27
© MAHLE Investor Update Call – Results H1 2018 | September 19, 2018 Philipp Kuckuck | VP Corporate Finance Jan-Frederek Thiele | Director Corporate Controlling

© MAHLE
Investor Update Call – Results H1 2018 | September 19, 2018
Philipp Kuckuck | VP Corporate Finance
Jan-Frederek Thiele | Director Corporate Controlling
MAHLE GmbH
© MAHLE
Disclaimer
2
This presentation was prepared with reasonable care. However, no responsibility can be assumed for the correctness of the provided information. In addition, this
document contains summary information only and does not purport to be comprehensive and is not intended to be (and should not be construed as) the sole basis of
any analysis or other evaluation. No representation or warranty (express or implied) is made as to, and no reliance should be placed on, any information, including
projections, targets, estimates and opinions contained herein. By accepting this presentation you acknowledge that you will be solely responsible for your own
assessment of the market and the market position of MAHLE and that you will conduct your own analysis and be solely responsible for forming your own view of the
potential future performance of MAHLE’s business.
This presentation may contain forward-looking statements and information on the business development of MAHLE. These statements are based on assessments
and assumptions relating to the development of the economies of individual countries, and in particular of the automotive industry, which we have made on the basis
of the information available to us and which we consider to be realistic at the time of publication.
The estimates given involve a degree of risk and uncertainty, and the actual developments of e.g. MAHLE’s sales, results and financial situation may differ from those
forecasted. We do not update forward-looking statements retrospectively. Such statements are valid on the date of publication and can be superseded.
This presentation does not constitute an offer or invitation to subscribe for, or purchase any securities and neither this presentation nor anything in it shall form the
basis of, or be relied upon in connection with, any contract or commitment whatsoever. This presentation does not contain or constitute an offer of, or the solicitation
of an offer to buy or subscribe for, securities to any person or in any jurisdiction to whom or in which such offer or solicitation is unlawful. The information contained in
this presentation is not for publication, release or distribution in the United States, Australia, Canada or Japan and, subject to certain exceptions, the securities
referred to herein may not be offered or sold in the United States, Australia, Canada or Japan or to, or for the account or benefit of, any national, resident or citizen of
Australia, Canada or Japan.
Due to rounding, numbers presented throughout this document may not add up precisely to the totals provided and percentages may not precisely reflect the
absolute figures.

MAHLE GmbH
+50%**
+60%*
Behr GmbH & Co. KG
+5%*
-33,33%*
-50%*
© MAHLE
Continued portfolio management and strong R&D
in line with our dual strategy
Strategic highlights H1 2018
* Percentage of shareholding acquired/divested by MAHLE Group ** Still subject to the approval by the antitrust authorities
Divestments significantly impacted half-year results 2018
Innovation focus Portfolio alignment
Investments
Divestments
R&D CV
R&D LV
3
MAHLE GmbH
Strong organic sales growth of 6% accompanied by
negative exchange rate effects
© MAHLE
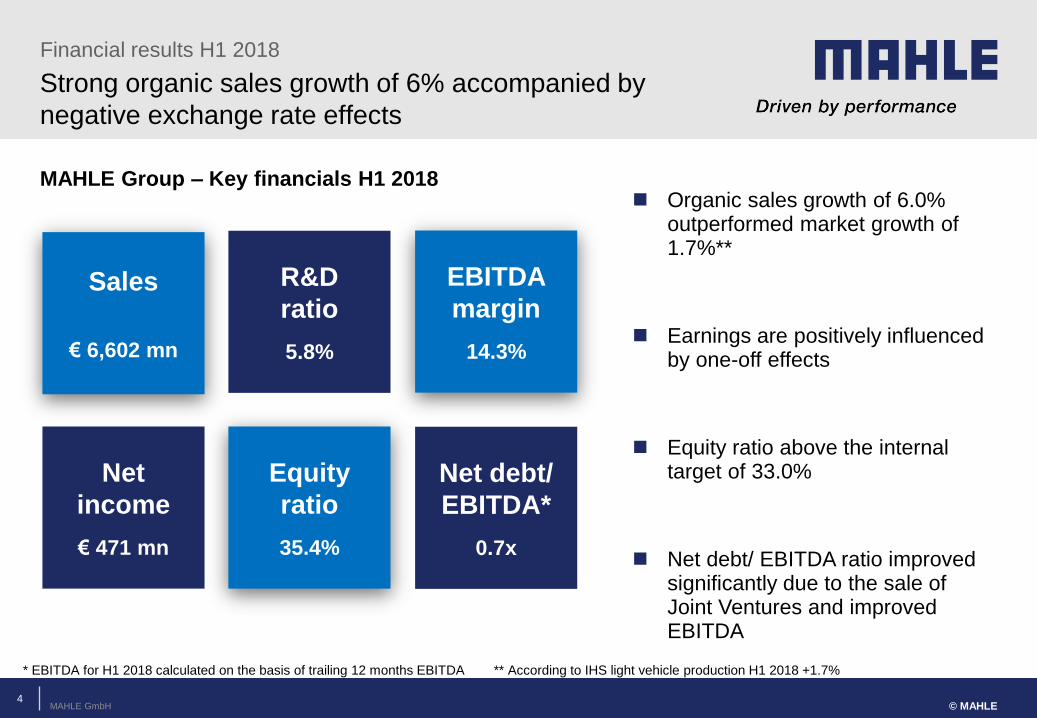
Organic sales growth of 6.0% outperformed market growth of 1.7%**
Earnings are positively influenced by one-off effects
Equity ratio above the internal target of 33.0%
Net debt/ EBITDA ratio improved significantly due to the sale of Joint Ventures and improved EBITDA
Financial results H1 2018
MAHLE Group – Key financials H1 2018
Sales
€ 6,602 mn
R&D
ratio
5.8%
Net
income
€ 471 mn
Net debt/
EBITDA*
0.7x
Equity
ratio
35.4%
EBITDA
margin
14.3%
4
* EBITDA for H1 2018 calculated on the basis of trailing 12 months EBITDA ** According to IHS light vehicle production H1 2018 +1.7%

MAHLE GmbH
-339
-15
+394 6,602
Financial results H1 2018
© MAHLE
All business units contributed to the strong
organic sales growth
-0.2%
M&A
+6.0%*
Organic growth
Jan – Jun 2017
-5.2%
Exchange rate
effects
Sales (EUR mn)
+ 0.6%
6,563
* Note: To calculate the organic growth, sales from 2017 were adjusted for effects from deconsolidation.
5
Jan – Jun 2018
MAHLE GmbH © MAHLE
Earnings increased due to positive effects from our
portfolio management
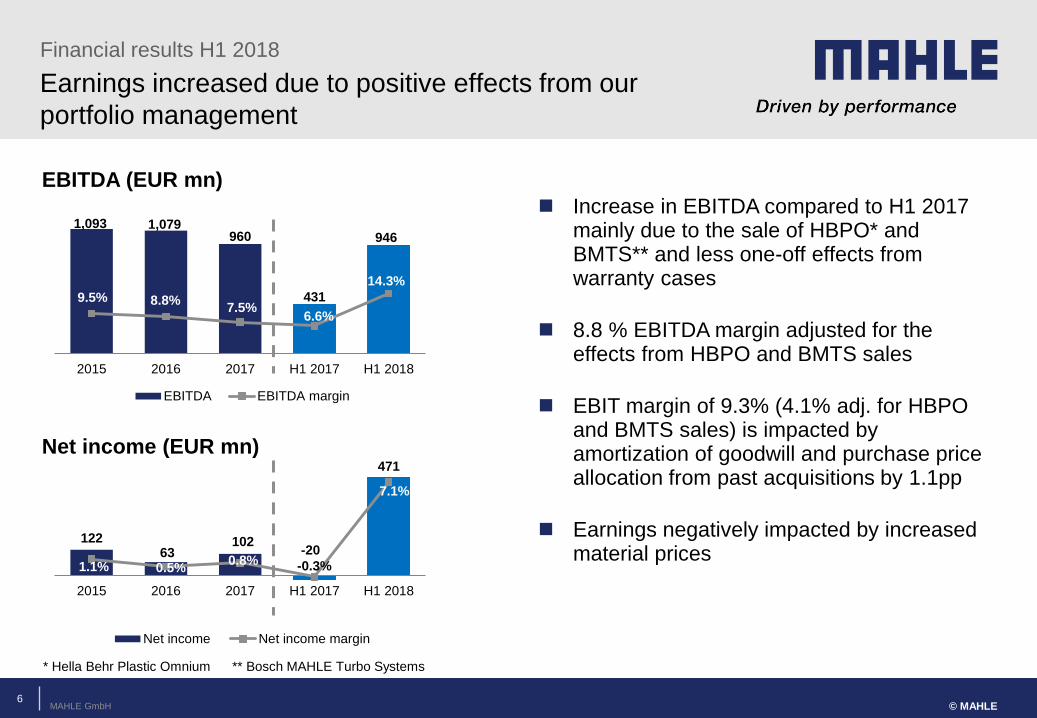
Increase in EBITDA compared to H1 2017 mainly due to the sale of HBPO* and BMTS** and less one-off effects from warranty cases
8.8 % EBITDA margin adjusted for the effects from HBPO and BMTS sales
EBIT margin of 9.3% (4.1% adj. for HBPO and BMTS sales) is impacted by amortization of goodwill and purchase price allocation from past acquisitions by 1.1pp
Earnings negatively impacted by increased material prices
Financial results H1 2018
Net income (EUR mn)
EBITDA (EUR mn)
1,093 1,079 960
431
946
9.5% 8.8% 7.5%
6.6%
14.3%
2015 2016 2017 H1 2017 H1 2018
EBITDA EBITDA margin
122 63
102 -20
471
1.1% 0.5% 0.8% -0.3%
7.1%
2015 2016 2017 H1 2017 H1 2018
Net income Net income margin
6
* Hella Behr Plastic Omnium ** Bosch MAHLE Turbo Systems
MAHLE GmbH
1,407 1,226 1,156
1,322
973
1.3 1.1 1.2
1.4
0.7
2015 2016 2017 H1 2017 H1 2018
Net debt Net debt / EBITDA**
2,667 2,722 2,632 2,561
3,052
34.0% 33.9% 32.1%
31.0% 35.4%
2015 2016 2017 H1 2017 H1 2018
Equity Equity ratio
© MAHLE
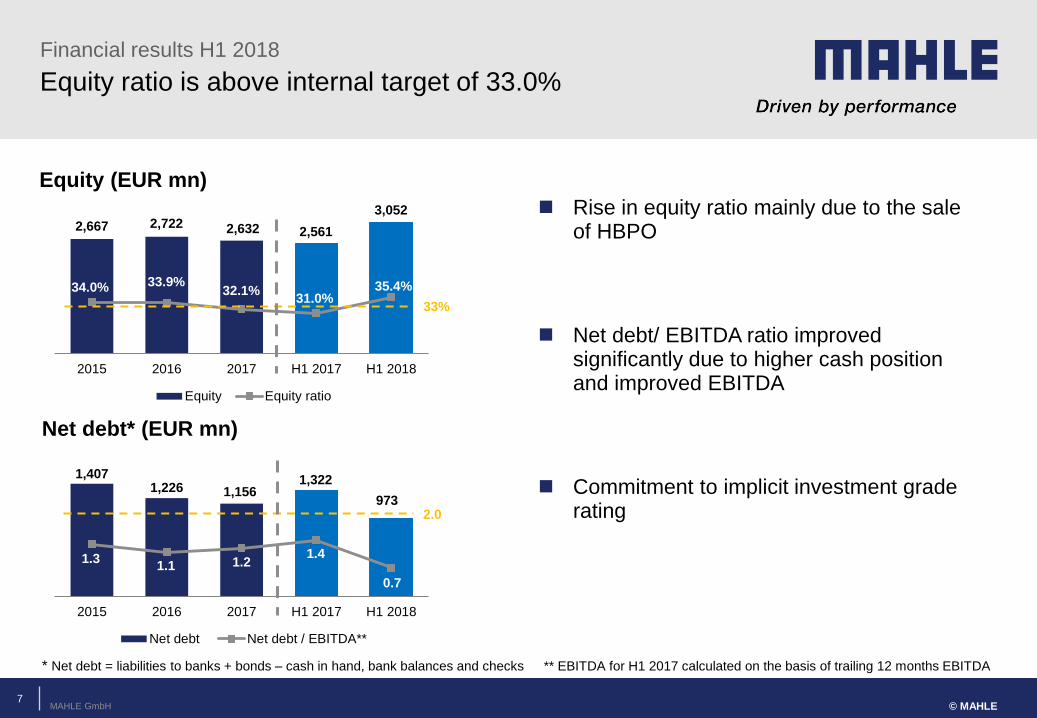
Equity ratio is above internal target of 33.0%
Rise in equity ratio mainly due to the sale of HBPO
Net debt/ EBITDA ratio improved significantly due to higher cash position and improved EBITDA
Commitment to implicit investment grade rating
Financial results H1 2018
Equity (EUR mn)
Net debt* (EUR mn)
33%
2.0
* Net debt = liabilities to banks + bonds – cash in hand, bank balances and checks ** EBITDA for H1 2017 calculated on the basis of trailing 12 months EBITDA
7
MAHLE GmbH © MAHLE
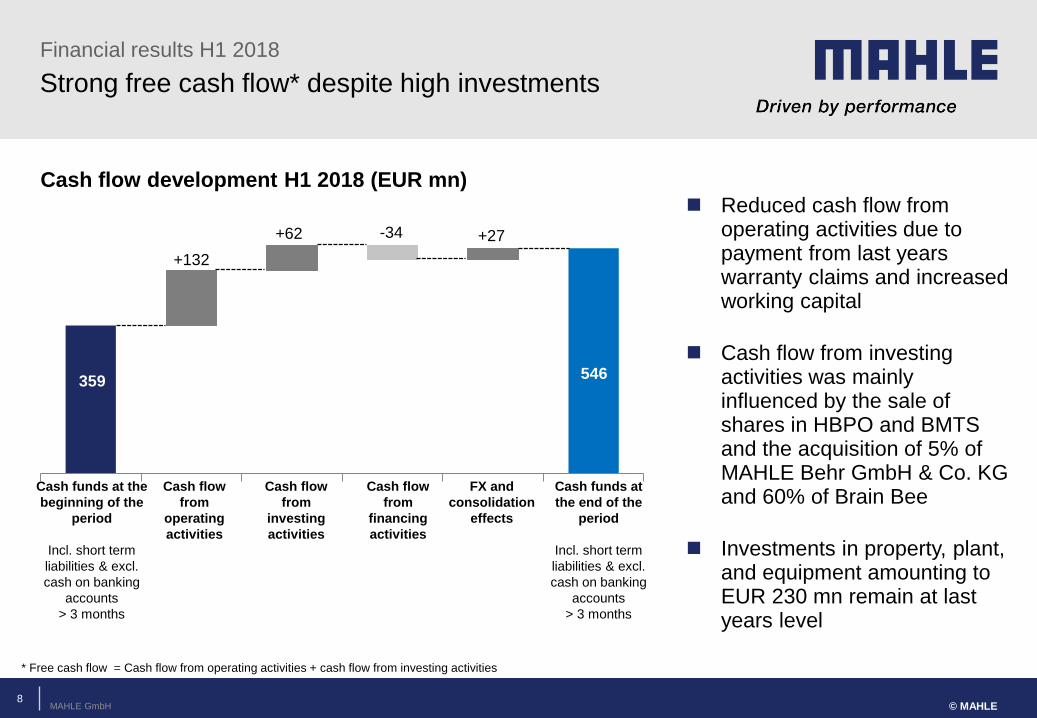
Strong free cash flow* despite high investments
Cash flow development H1 2018 (EUR mn)
Financial results H1 2018
Cash funds at the
beginning of the
period
Incl. short term
liabilities & excl.
cash on banking
accounts
> 3 months
Cash flow
from
operating
activities
Cash flow
from
investing
activities
Cash flow
from
financing
activities
359
+62
Cash funds at
the end of the
period
Incl. short term
liabilities & excl.
cash on banking
accounts
> 3 months
546
+27
FX and
consolidation
effects
-34
Reduced cash flow from operating activities due to payment from last years warranty claims and increased working capital
Cash flow from investing activities was mainly influenced by the sale of shares in HBPO and BMTS and the acquisition of 5% of MAHLE Behr GmbH & Co. KG and 60% of Brain Bee
Investments in property, plant, and equipment amounting to EUR 230 mn remain at last years level
8
+132
* Free cash flow = Cash flow from operating activities + cash flow from investing activities
MAHLE GmbH
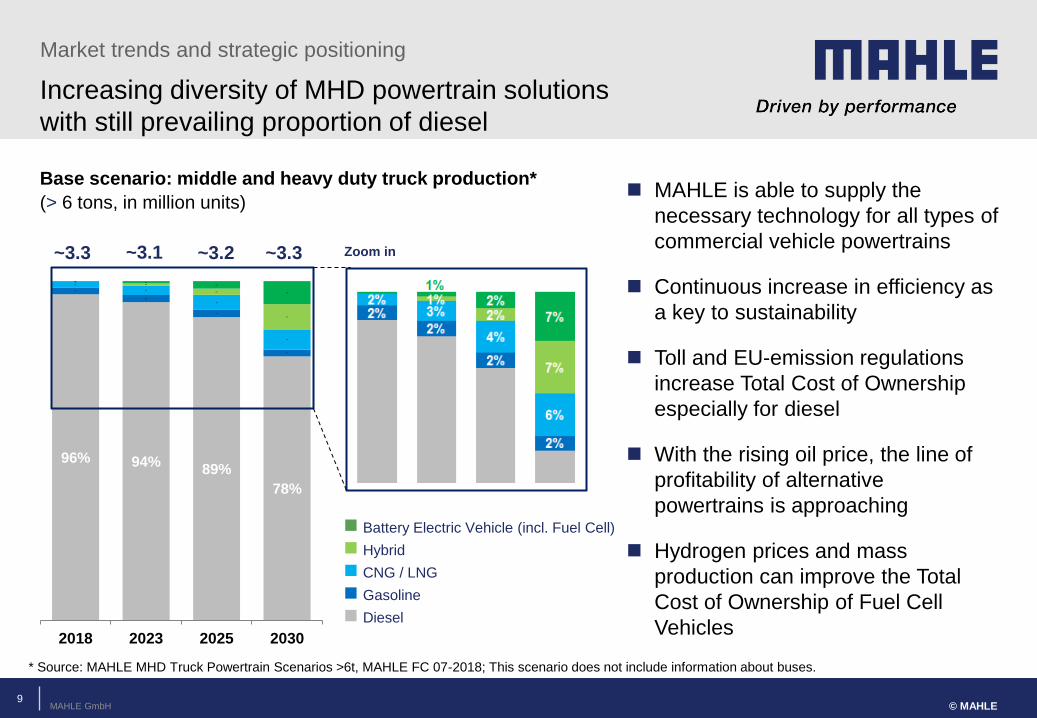
96% 94% 89%
78%
2%
2%
2%
2%
2%
3%
4%
6%
0%
1%
2%
7%
0% 1%
2%
7%
2018 2023 2025 2030
Battery Electric Vehicle (incl. Fuel Cell)
Hybrid
CNG / LNG
Gasoline
Diesel
MAHLE is able to supply the
necessary technology for all types of
commercial vehicle powertrains
Continuous increase in efficiency as
a key to sustainability
Toll and EU-emission regulations
increase Total Cost of Ownership
especially for diesel
With the rising oil price, the line of
profitability of alternative
powertrains is approaching
Hydrogen prices and mass
production can improve the Total
Cost of Ownership of Fuel Cell
Vehicles
Zoom in
© MAHLE
Market trends and strategic positioning
9
Base scenario: middle and heavy duty truck production*
(> 6 tons, in million units)
~3.3 ~3.1 ~3.2 ~3.3
Increasing diversity of MHD powertrain solutions
with still prevailing proportion of diesel
* Source: MAHLE MHD Truck Powertrain Scenarios >6t, MAHLE FC 07-2018; This scenario does not include information about buses.

MAHLE GmbH
Innovative technologies for the global
commercial vehicle powertrain mix of the future
Market trends and strategic positioning
© MAHLE
MAHLE is well prepared for a broad spectrum of drive architectures and applications
Fuel Cell
10
► Flat Membrane Humidifier
► e-Compressor
► Charge Air Cooler
► Fuel Cell Monitor Modul
► e-Waste Heat Recovery
► Oil-free Brake Compressor
► Thermal Piston Coatings
► Variable Valve Train System
► Visco® Hybrid Fan
Drive
► Demand-based
Battery Conditioning
MAHLE GmbH
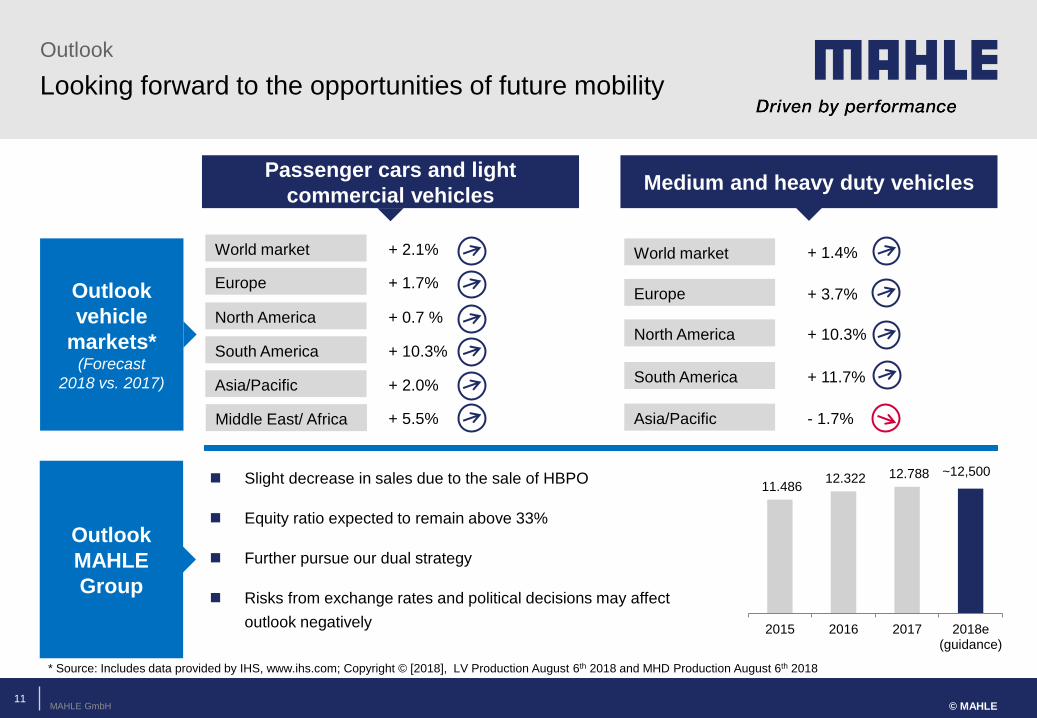
Passenger cars and light
commercial vehicles Medium and heavy duty vehicles
Outlook
vehicle
markets* (Forecast
2018 vs. 2017)
Outlook
MAHLE
Group
World market
Europe
North America
South America
Asia/Pacific
+ 1.4%
+ 3.7%
+ 11.7%
+ 10.3%
- 1.7%
Outlook
© MAHLE
Looking forward to the opportunities of future mobility
Slight decrease in sales due to the sale of HBPO
Equity ratio expected to remain above 33%
Further pursue our dual strategy
Risks from exchange rates and political decisions may affect
outlook negatively
World market
Europe
North America
South America
Asia/Pacific
+ 2.1%
+ 1.7%
+ 10.3%
+ 0.7 %
+ 2.0%
Middle East/ Africa + 5.5%
* Source: Includes data provided by IHS, www.ihs.com; Copyright © [2018], LV Production August 6th 2018 and MHD Production August 6th 2018
11
11.486 12.322 12.788
2015 2016 2017 2018e(guidance)
~12,500

MAHLE GmbH © MAHLE
Investor Relations contacts
http://www.mahle.com
Verena Sigel
Head of Group Financing
and Investor Relations
Philipp Kuckuck
Vice President Corporate
Finance
Stefanie Siedler
Corporate Finance
Reporting
and Investor Relations
Robert Kiese
Group Financing
and Investor Relations
12

© MAHLE
APPENDIX
13
MAHLE GmbH © MAHLE
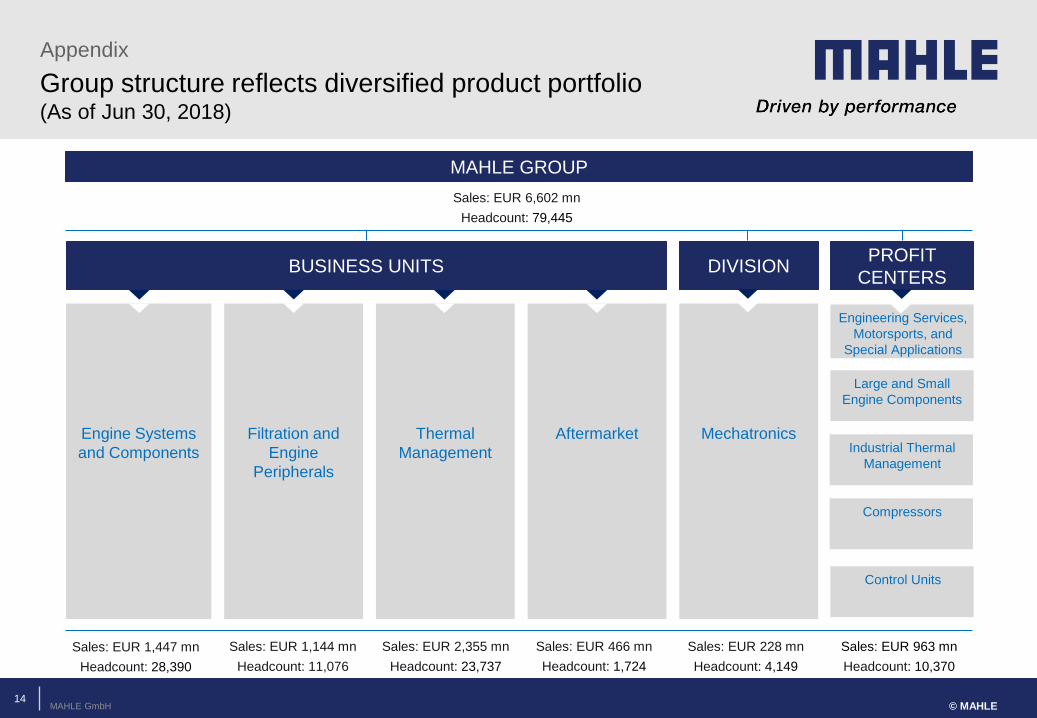
Group structure reflects diversified product portfolio (As of Jun 30, 2018)
Appendix
14
Large and Small
Engine Components
Industrial Thermal
Management
Control Units
Compressors
Engineering Services,
Motorsports, and
Special Applications
Sales: EUR 963 mn
Headcount: 10,370
BUSINESS UNITS
Engine Systems
and Components
Filtration and
Engine
Peripherals
Thermal
Management
Aftermarket
Sales: EUR 1,447 mn
Headcount: 28,390
Sales: EUR 1,144 mn
Headcount: 11,076
Sales: EUR 2,355 mn
Headcount: 23,737
Sales: EUR 466 mn
Headcount: 1,724
Mechatronics
Sales: EUR 228 mn
Headcount: 4,149
DIVISION PROFIT
CENTERS
MAHLE GROUP
Sales: EUR 6,602 mn
Headcount: 79,445
MAHLE GmbH
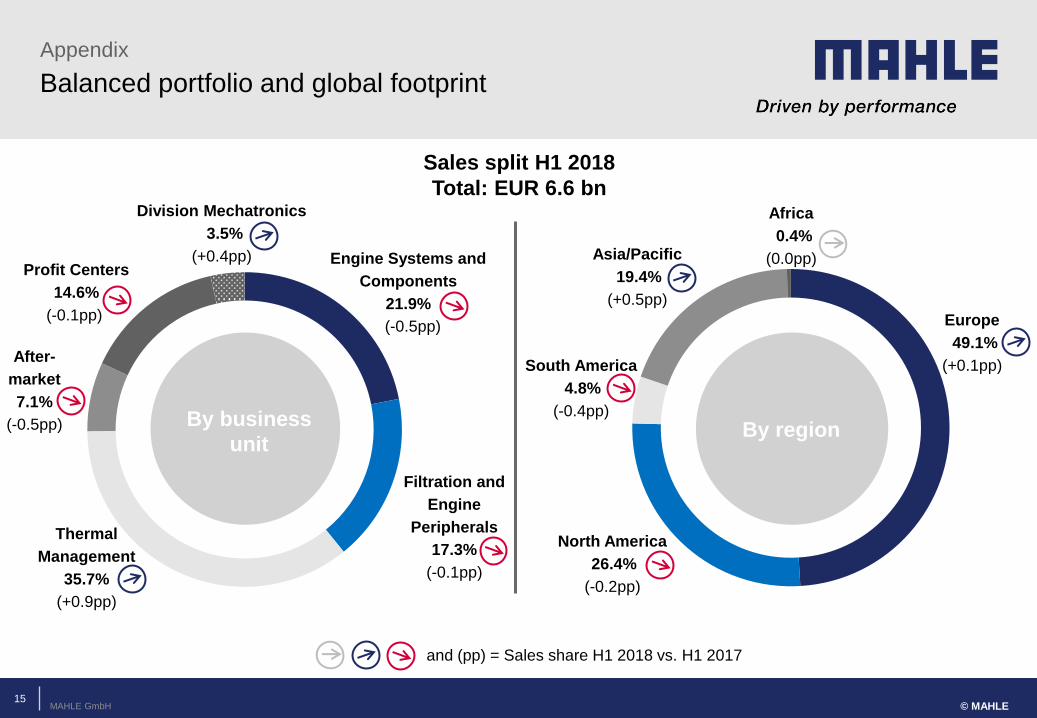
By region
© MAHLE
Balanced portfolio and global footprint
Appendix
Engine Systems and
Components
21.9%
(-0.5pp)
Filtration and
Engine
Peripherals
17.3%
(-0.1pp)
Thermal
Management
35.7%
(+0.9pp)
After-
market
7.1%
(-0.5pp)
Profit Centers
14.6%
(-0.1pp)
Division Mechatronics
3.5%
(+0.4pp)
By business
unit
Sales split H1 2018
Total: EUR 6.6 bn
Europe
49.1%
(+0.1pp)
Asia/Pacific
19.4%
(+0.5pp)
South America
4.8%
(-0.4pp)
Africa
0.4%
(0.0pp)
North America
26.4%
(-0.2pp)
and (pp) = Sales share H1 2018 vs. H1 2017
15
MAHLE GmbH © MAHLE
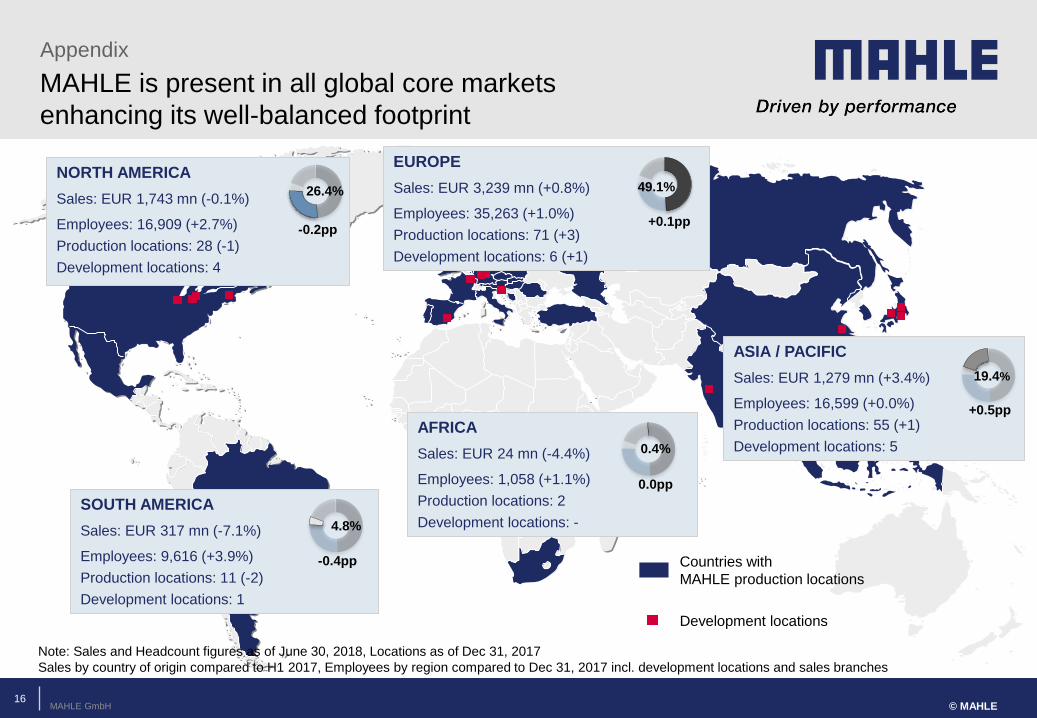
MAHLE is present in all global core markets
enhancing its well-balanced footprint
Appendix
AFRICA
Sales: EUR 24 mn (-4.4%)
Employees: 1,058 (+1.1%)
Production locations: 2
Development locations: -
ASIA / PACIFIC
Sales: EUR 1,279 mn (+3.4%)
Employees: 16,599 (+0.0%)
Production locations: 55 (+1)
Development locations: 5
SOUTH AMERICA
Sales: EUR 317 mn (-7.1%)
Employees: 9,616 (+3.9%)
Production locations: 11 (-2)
Development locations: 1
EUROPE
Sales: EUR 3,239 mn (+0.8%)
Employees: 35,263 (+1.0%)
Production locations: 71 (+3)
Development locations: 6 (+1)
NORTH AMERICA
Sales: EUR 1,743 mn (-0.1%)
Employees: 16,909 (+2.7%)
Production locations: 28 (-1)
Development locations: 4
Development locations
Countries with
MAHLE production locations
49.1% 26.4%
4.8%
0.4%
-0.2pp +0.1pp
-0.4pp
+0.5pp
19.4%
Note: Sales and Headcount figures as of June 30, 2018, Locations as of Dec 31, 2017
Sales by country of origin compared to H1 2017, Employees by region compared to Dec 31, 2017 incl. development locations and sales branches
0.0pp
16

MAHLE GmbH © MAHLE
Income statement (key figures)
Appendix
ACTUAL ACTUAL ACTUAL
1-6/2017 1-12/2017 1-6/2018
in million
EUR
in % of
sales
in million
EUR
in % of
sales
in million
EUR
in % of
sales
in million
EUR
Sales 6,562.9 100.0% 12,788.0 100.0% 6,602.4 100.0% 39.5
Cost of sales and other income and expenses -6,131.9 -93.4% -11,827.6 -92.5% -5,656.5 -85.7% 475.4
EBITDA 431.0 6.6% 960.5 7.5% 945.9 14.3% 514.9
Depreciation / amortization of tangible and intangible
assets (incl. goodwill) & longterm loans and securities-300.6 -4.6% -605.3 -4.7% -329.5 -5.0% -28.9
EBIT 130.4 2.0% 355.2 2.8% 616.4 9.3% 486.0
Investment result -3.7 -0.1% 9.7 0.1% -3.3 0.0% 0.4
Result from interest (incl. pensions) -57.5 -0.9% -102.4 -0.8% -58.3 -0.9% -0.8
Result from business activities 69.2 1.1% 262.5 2.1% 554.8 8.4% 485.6
Taxes on income -71.9 -1.1% -124.9 -1.0% -66.9 -1.0% 5.0
Result after taxes -2.7 0.0% 137.6 1.1% 487.9 7.4% 490.6
Other taxes -17.4 -0.3% -35.4 -0.3% -17.2 -0.3% 0.2
Consolidated net loss / net income -20.1 -0.3% 102.2 0.8% 470.7 7.1% 490.8
CHANGE
17
MAHLE GmbH © MAHLE
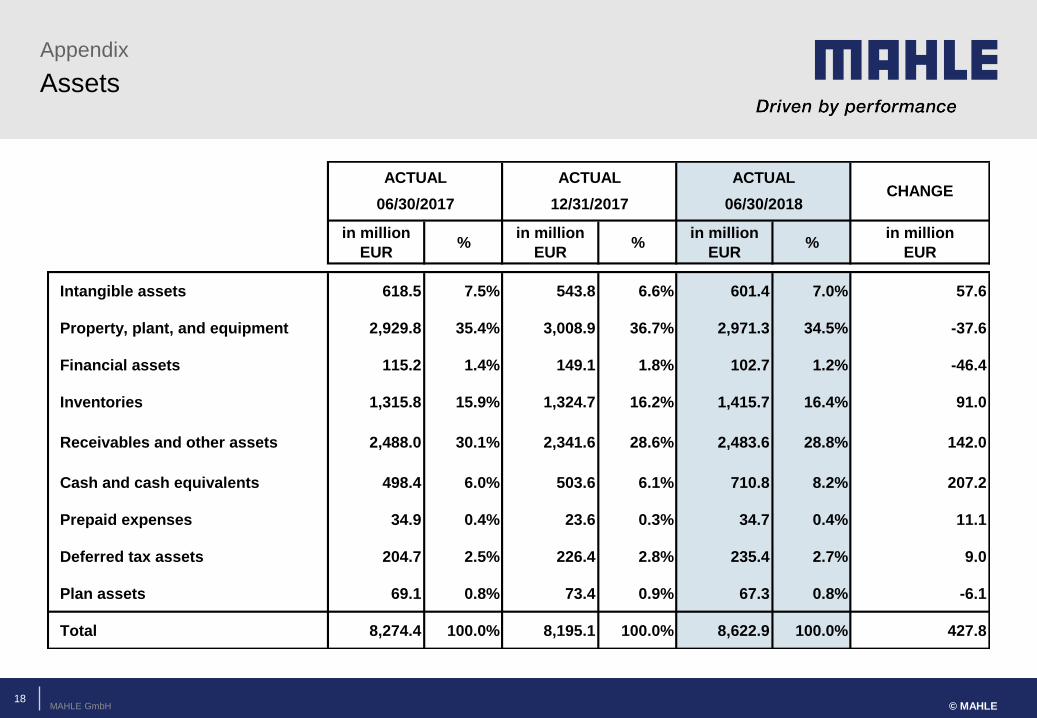
Assets
Appendix
06/30/2018
in million
EUR%
in million
EUR%
in million
EUR%
in million
EUR
Intangible assets 618.5 7.5% 543.8 6.6% 601.4 7.0% 57.6
Property, plant, and equipment 2,929.8 35.4% 3,008.9 36.7% 2,971.3 34.5% -37.6
Financial assets 115.2 1.4% 149.1 1.8% 102.7 1.2% -46.4
Inventories 1,315.8 15.9% 1,324.7 16.2% 1,415.7 16.4% 91.0
Receivables and other assets 2,488.0 30.1% 2,341.6 28.6% 2,483.6 28.8% 142.0
Cash and cash equivalents 498.4 6.0% 503.6 6.1% 710.8 8.2% 207.2
Prepaid expenses 34.9 0.4% 23.6 0.3% 34.7 0.4% 11.1
Deferred tax assets 204.7 2.5% 226.4 2.8% 235.4 2.7% 9.0
Plan assets 69.1 0.8% 73.4 0.9% 67.3 0.8% -6.1
Total 8,274.4 100.0% 8,195.1 100.0% 8,622.9 100.0% 427.8
ACTUAL
06/30/2017
ACTUAL
12/31/2017CHANGE
ACTUAL
18
MAHLE GmbH © MAHLE
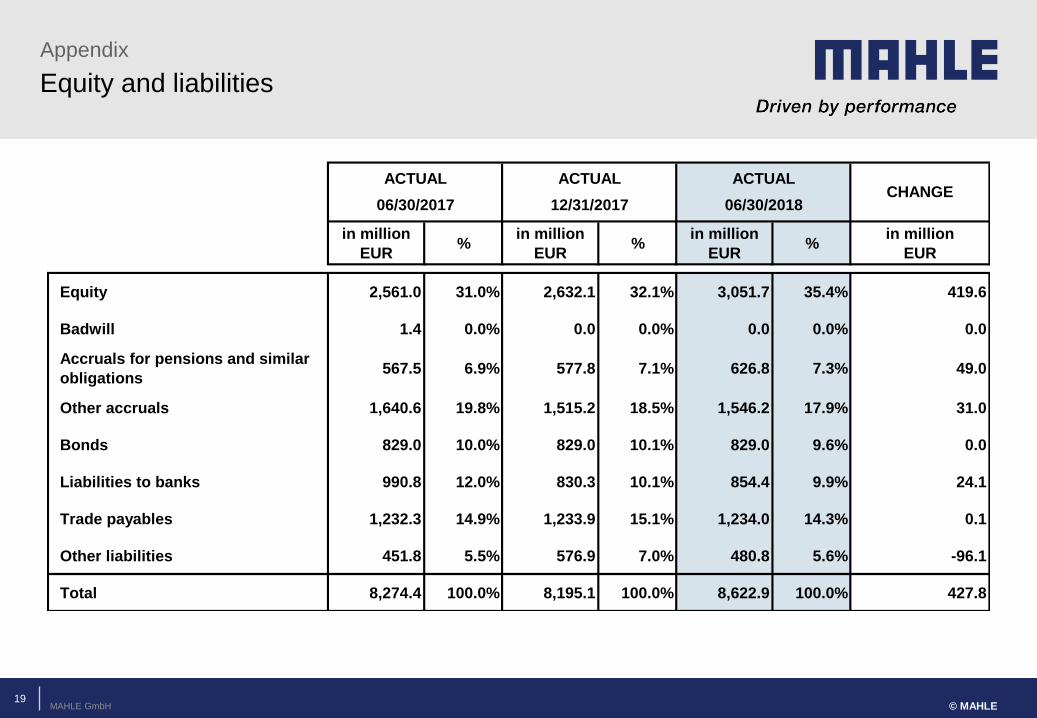
Equity and liabilities
Appendix
06/30/2018
in million
EUR%
in million
EUR%
in million
EUR%
in million
EUR
Equity 2,561.0 31.0% 2,632.1 32.1% 3,051.7 35.4% 419.6
Badwill 1.4 0.0% 0.0 0.0% 0.0 0.0% 0.0
Accruals for pensions and similar
obligations567.5 6.9% 577.8 7.1% 626.8 7.3% 49.0
Other accruals 1,640.6 19.8% 1,515.2 18.5% 1,546.2 17.9% 31.0
Bonds 829.0 10.0% 829.0 10.1% 829.0 9.6% 0.0
Liabilities to banks 990.8 12.0% 830.3 10.1% 854.4 9.9% 24.1
Trade payables 1,232.3 14.9% 1,233.9 15.1% 1,234.0 14.3% 0.1
Other liabilities 451.8 5.5% 576.9 7.0% 480.8 5.6% -96.1
Total 8,274.4 100.0% 8,195.1 100.0% 8,622.9 100.0% 427.8
ACTUAL
06/30/2017
ACTUAL
12/31/2017
ACTUALCHANGE
19

MAHLE GmbH © MAHLE
Abbreviated cash flow statement
Appendix
ACTUAL ACTUAL ACTUAL
[in million EUR] 1-6/2017 1-12/2017 1-6/2018
Cash funds at beginning of period 161.2 161.2 359.1 197.9
Cash flows from operating activities 244.4 765.5 131.9 -112.5
Cash flows from investing activities -311.0 -652.0 62.1 373.0
Cash flows from financing activities 171.7 26.4 -33.9 -205.5
Total cash flow 105.1 139.9 160.1 55.0
Change in cash funds from exchange rate movements and valuation
procedures5.6 58.0 27.0 21.4
Change in cash funds from changes in the consolidation group 0.0 0.0 0.0 0.0
Cash funds at end of period 271.9 359.1 546.2 274.3
CHANGE
20

MAHLE GmbH © MAHLE
Appendix
MAHLE has continuously increased and diversified its investor base
Maturity of EUR 1,600 mn RCF has been extended by one year to July 2023
Other liabilities to banks include ancillary
facilities in Turkey as well as bilateral
loan agreements in Brazil,
India, Japan and China
Total financial liabilities:
EUR 1,693 mn
(incl. liabilities to banks, bonds and
certain other liabilities)
RCF = Revolving Credit Facility SSD = Schuldscheindarlehen
* EUR 46,4 mn of other liabilities to banks represent short-term drawdowns from RCF maturing in 2023
Well balanced maturity profile and diversified funding mix
with different debt instruments
21
97 41 16 24
63 56* 1
0
29
300
500
15 124
102
125
74 100
25
2018 2019 2020 2021 2022 2023 2024 2025 2026 2027
Other liabilities to banks (EUR 299 mn) Bonds (EUR 829 mn) SSD (EUR 565 mn)
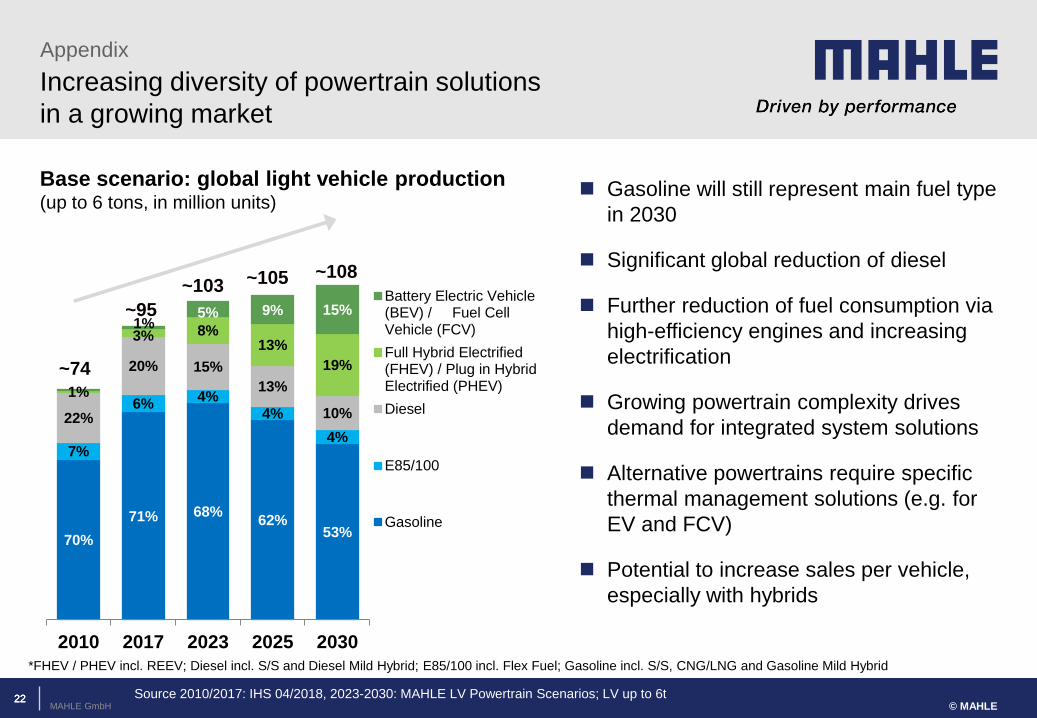
MAHLE GmbH
70%
71% 68% 62%
53%
7%
6% 4%
4%
4%
22%
20% 15%
13%
10%
1%
3% 8% 13%
19%
5% 9% 15%
2010 2017 2023 2025 2030
Battery Electric Vehicle(BEV) / Fuel CellVehicle (FCV)
Full Hybrid Electrified(FHEV) / Plug in HybridElectrified (PHEV)
Diesel
E85/100
Gasoline
© MAHLE
Increasing diversity of powertrain solutions
in a growing market
22 22 Source 2010/2017: IHS 04/2018, 2023-2030: MAHLE LV Powertrain Scenarios; LV up to 6t
~95
~74
~103 ~105
Gasoline will still represent main fuel type
in 2030
Significant global reduction of diesel
Further reduction of fuel consumption via
high-efficiency engines and increasing
electrification
Growing powertrain complexity drives
demand for integrated system solutions
Alternative powertrains require specific
thermal management solutions (e.g. for
EV and FCV)
Potential to increase sales per vehicle,
especially with hybrids
Base scenario: global light vehicle production (up to 6 tons, in million units)
~108
*FHEV / PHEV incl. REEV; Diesel incl. S/S and Diesel Mild Hybrid; E85/100 incl. Flex Fuel; Gasoline incl. S/S, CNG/LNG and Gasoline Mild Hybrid
Appendix
1%
22
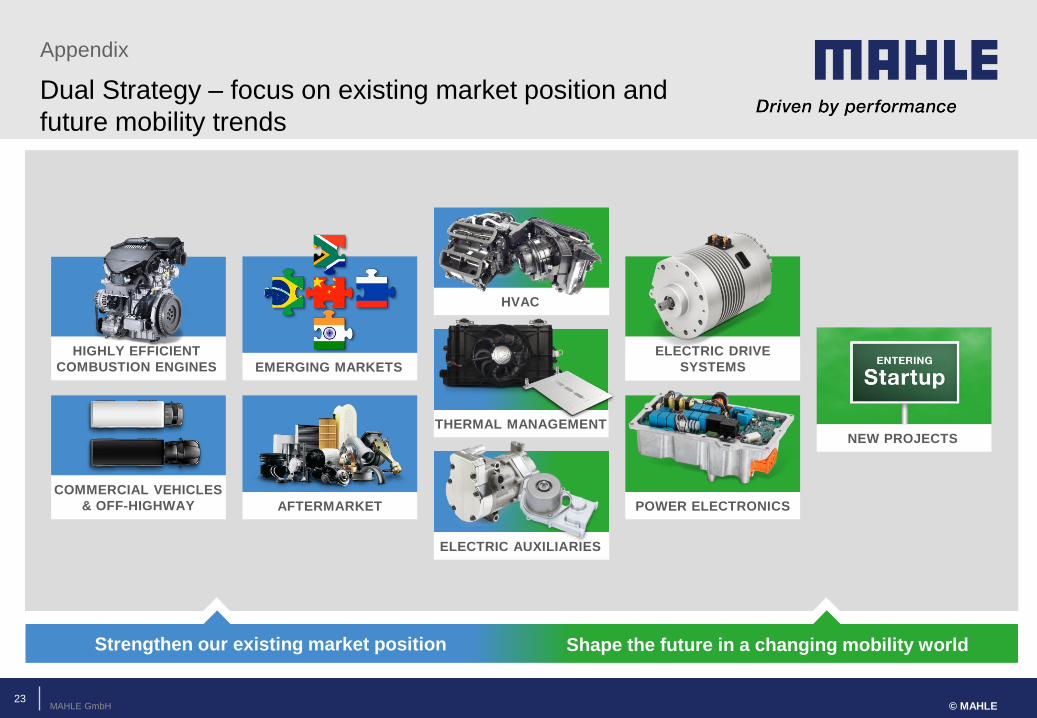
MAHLE GmbH © MAHLE
Dual Strategy – focus on existing market position and
future mobility trends
Strengthen our existing market position Shape the future in a changing mobility world
HIGHLY EFFICIENT
COMBUSTION ENGINES
COMMERCIAL VEHICLES
& OFF-HIGHWAY
EMERGING MARKETS
AFTERMARKET
HVAC
THERMAL MANAGEMENT
ELECTRIC DRIVE
SYSTEMS
NEW PROJECTS
POWER ELECTRONICS
ELECTRIC AUXILIARIES
Appendix
23
MAHLE GmbH
Thermo-
electrics
technology
Vehicle
control
electronics
© MAHLE
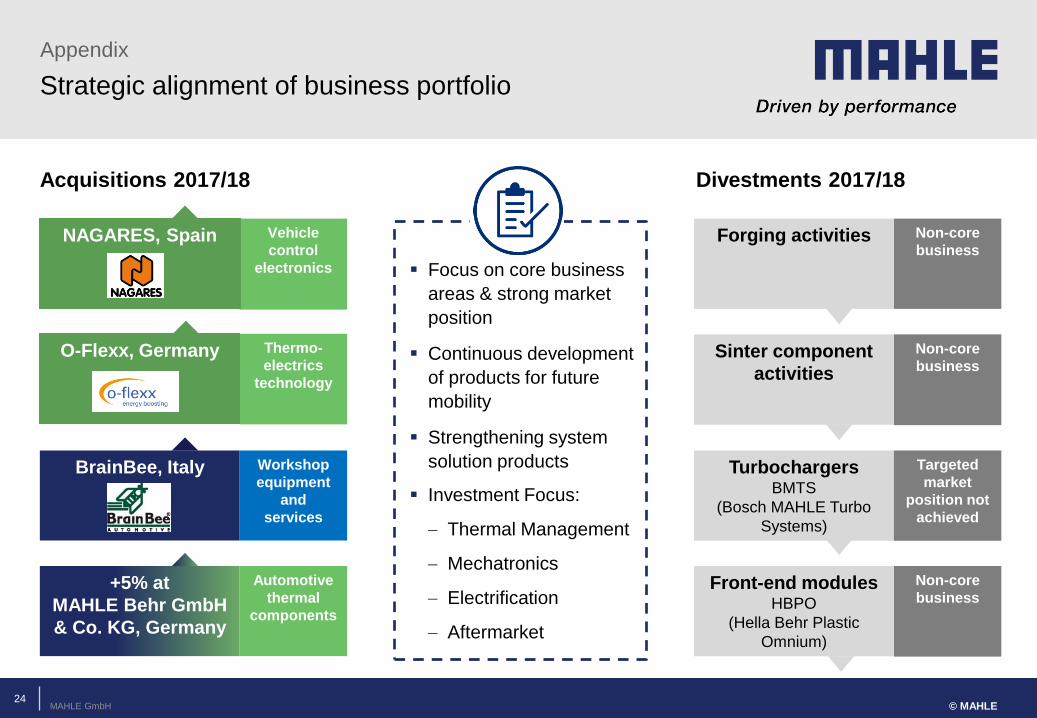
Strategic alignment of business portfolio
Appendix
Focus on core business
areas & strong market
position
Continuous development
of products for future
mobility
Strengthening system
solution products
Investment Focus:
Thermal Management
Mechatronics
Electrification
Aftermarket
NAGARES, Spain
O-Flexx, Germany
BrainBee, Italy
Workshop
equipment
and
services
Acquisitions 2017/18 Divestments 2017/18
Non-core
business
Non-core
business Forging activities
Sinter component
activities
Turbochargers BMTS
(Bosch MAHLE Turbo
Systems)
Targeted
market
position not
achieved
Non-core
business Front-end modules
HBPO
(Hella Behr Plastic
Omnium)
+5% at
MAHLE Behr GmbH
& Co. KG, Germany
Automotive
thermal
components
24
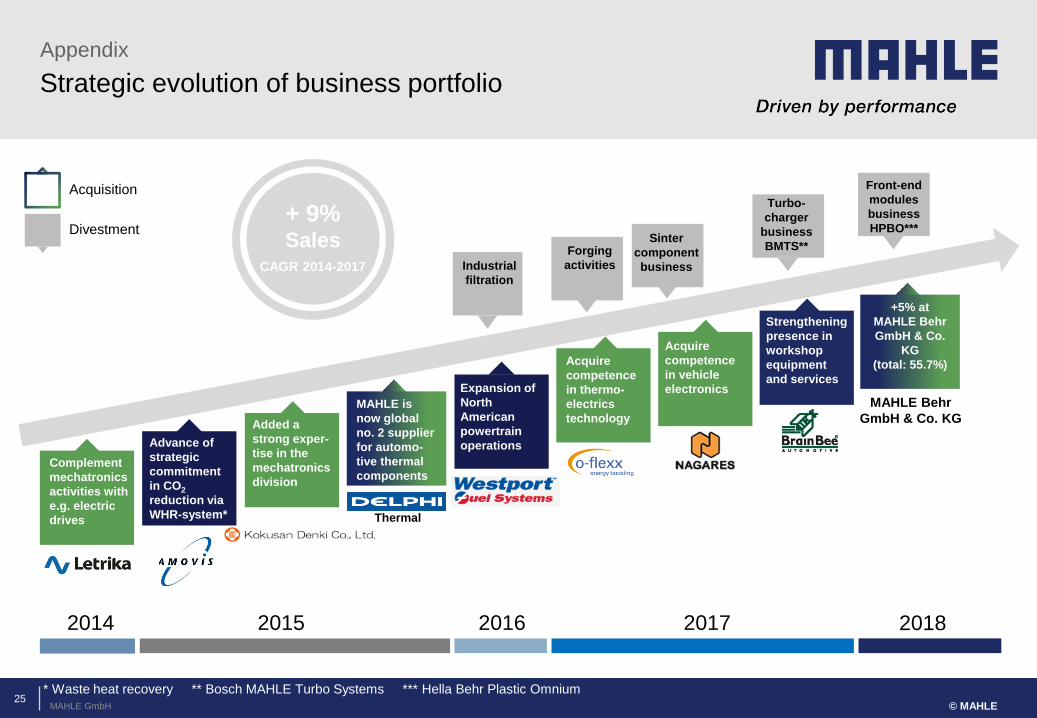
MAHLE GmbH
Appendix
© MAHLE
Strategic evolution of business portfolio
Thermal
MAHLE is
now global
no. 2 supplier
for automo-
tive thermal
components
Acquire
competence
in vehicle
electronics
Acquire
competence
in thermo-
electrics
technology
Expansion of
North
American
powertrain
operations
Added a
strong exper-
tise in the
mechatronics
division
Advance of
strategic
commitment
in CO2
reduction via
WHR-system*
Complement
mechatronics
activities with
e.g. electric
drives
Industrial
filtration
Forging
activities
Turbo-
charger
business
BMTS** Sinter
component
business
Divestment
Acquisition
* Waste heat recovery ** Bosch MAHLE Turbo Systems *** Hella Behr Plastic Omnium
Strengthening
presence in
workshop
equipment
and services
+ 9% Sales
CAGR 2014-2017
2014 2015 2016 2017
Front-end
modules
business
HPBO***
+5% at
MAHLE Behr
GmbH & Co.
KG
(total: 55.7%)
2018
MAHLE Behr
GmbH & Co. KG
25

MAHLE GmbH © MAHLE
Electrification offers potential for more MAHLE
content in light vehicles
Appendix
Factor: 1 x 2.4 - 5.2 x 1.0 - 3.4 x 1.3 - 2.8 x 1.3 - 1.9
MAHLE CPV potential*
CPV = Content per light vehicle; ICE = Internal Combustion Engine
* Range depending on future market share and strategic decisions regarding the product portfolio.
26
48 V
MAHLE’s growth drivers: higher value-added adaptive and new technologies
Premium
48V Mild Hybrid Fuel Cell Vehicle
Plug-in &
Full Hybrid Battery Vehicle
ICE & Basic 48V
Mild Hybrid
MAHLE GmbH © MAHLE
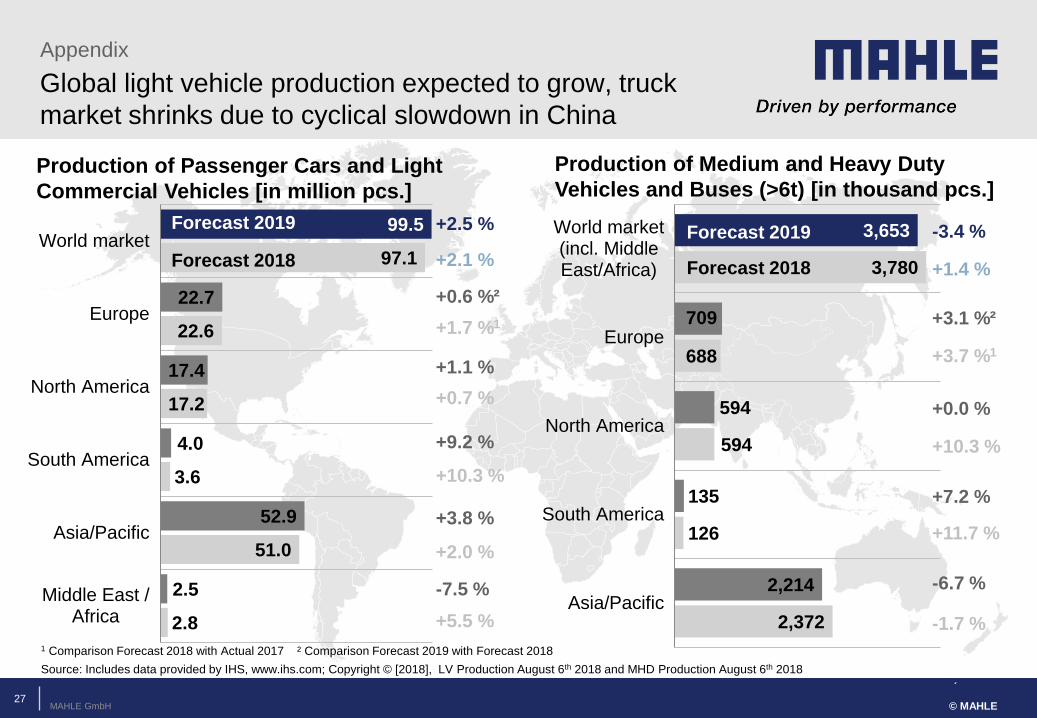
Global light vehicle production expected to grow, truck
market shrinks due to cyclical slowdown in China
Appendix
2.8
51.0
3.6
17.2
22.6
97.1
2.5
52.9
4.0
17.4
22.7
99.5
Middle East /Africa
Asia/Pacific
South America
North America
Europe
World market+2.5 %
+2.1 %
Production of Passenger Cars and Light
Commercial Vehicles [in million pcs.]
2,372
126
594
688
3,780
2,214
135
594
709
3,653
Asia/Pacific
South America
North America
Europe
World market(incl. MiddleEast/Africa)
-3.4 %
+1.4 %
Production of Medium and Heavy Duty
Vehicles and Buses (>6t) [in thousand pcs.]
Forecast 2019
Forecast 2018
+0.6 %²
+1.7 %1
+1.1 %
+0.7 %
+9.2 %
+10.3 %
+3.8 %
+2.0 %
-7.5 %
+5.5 %
+3.1 %²
+3.7 %1
+0.0 %
+10.3 %
+7.2 %
+11.7 %
-6.7 %
-1.7 %
1 Comparison Forecast 2018 with Actual 2017 ² Comparison Forecast 2019 with Forecast 2018
Source: Includes data provided by IHS, www.ihs.com; Copyright © [2018], LV Production August 6th 2018 and MHD Production August 6th 2018
Forecast 2019
Forecast 2018
27


