* RESULTS OF HYDROTREATING THEKEROSENE FRACTION OF HTI’S FIRST PROOF OF CONCEPT RUN Frances V. Stohl, Stephen E. Lott, Kathleen V. Diegert, David C. Goodnow Process Research Dept. 6212 Sandia National Laboratories P.O. Box 5800 Albuquerque, Nh4 871 85-0709 ---A CO/tl/5 9Gogoq Keywords: Hydrotreating coal liquids; Factorial experimental design; Continuous reactor studies ABSTRACT The objective of Sandia’s hydrotreating study is to determine the relationships between hydrotreating conditions and product characteristics for coal liquids produced using current technologies. The coal- derived liquid,used in the current work is the kerosene fraction of the product from Hydrocarbon Technologies Inc.’s first proof-of-concept run for it’s Catalytic Two-Stage Liquehction Technology. Sandia’s hydrotreating experiments were performed in a continuous operation, microflow reactor system using aged HDN-60 catalyst. A factorial experimental design with three variables (temperature, pressure, liquid hourly space velocity) was used in this work. Nitrogen and sulfir contents of the feed and hydrotreated products were determined using an Antek 7000 Sulfir and Nitrogen Analyzer. Multiple samples were collected at each set of reaction conditions to ensure that each condition was lined out. Hydrotreating at each set of reaction conditions was repeated so that results could be normalized for catalyst deactivation. The normalized results were statistically analyzed. Increases in temperature and pressure had the greatest effects on nitrogen removal. The highest severity condition (388”C, 1500 psig H2, l.sg/h/g(cat)) gave a measured nitrogen value of <5 ppm. I I INTRODUCTION DOERETC’s refining of coal liquids program is aimed at determining the most cost effective combination of existing refinery processes and blending options necessary to upgrade direct and indirect coal liquids into transportation fuels that meet year 2000 specifications. A main reason for this program is that coal liquefaction processing has improved significantly since the last refining evaluation was done by Sullivan and Frumkin“) at Chevron in the early 1980s. In addition, a recent publication by Zhou, Marano and Winschel(2) indicates that blending coal liquids with petroleum may allow refiners to produce specification products with less refining than if each fraction was processed separately. The objective of Sandia’s refining of coalderived liquids project is to experimentally evaluate options for hydrotreating coal liquids and various distillate cuts of coal liquids, and to develop a database relating hydrotreating parameters to feed and product quality. The hydrotreating effort is being conducted using a bench-scale, continuous flow, trickle-bed reactor that enables us to evaluate many hydrotreating options in a rapid and cost effective manner. The coalderived liquid used in this work was produced in Hydrocarbon Technologies Inc.’s first proof-of-concept run (POC #1) in their 3 ton/day Process Development Unit using their Catalytic Two-Stage Liquefaction Technology. This 57 day run used Illinois #6 coal and produced up to 5 barrels of distillate liquid product/ton moisture-ash-free coal. After completion of this run, HTI shipped 2500 gallons of coal liquids to Southwest Research Inc. (SwRI) for characterization, fractionation, and evaluation. The kerosene fraction that Sandia hydrotreated was obtained from SwRl as was the aged Criterion WN-60 catalyst used in Sandia’s hydrotreating study. This work is being done in conjunction with DOERETC’s Refining and End-Use Study of Coal Liquids project (Bechtel, SwRI, Amoco, M. W. Kellogg). Results from Sandia’s hydrotreating work will be analyzed by Bechtel using the PIMS refinery model as part of their effort to determine the best way to incorporate coal liquids into an existing refinery. ‘ EXPERIMENTAL SECTION Sandia’s experimental procedures included using a factorial experimental design, hydrotreating the kerosene fraction of the POC #1 whole coal liquid, characterizing the feed and products, and reporting results to other program participants. Reactor Feeds and Catalyst. The POC #1 kerosene fraction that was hydrotreated at Sandia was collected when HTI’s in-line hydrotreater was not in operation. The nitrogen and sulfir contents of this fraction were 645 ppm and 239 ppm respectively. The initial boiling point was 385°F and the final boiling point was 489°F. The nitrogen and sulfur values are Sandia’s values and the boiling points are from SwRI. The hydrotreating experiments used aged HDN-60 catalyst that was obtained from SwRI. Continuous Operation Hydrotreatinv System. Sandia’s hydrotreating experiments are being conducted using a bench-scale, continuous flow, trickle-bed reactor. The system has all required safety features to enable it to be operated unattended. Ranges of operating conditions for this system are as follows: liquid flow from 0.05 to 4 cm3/min; gas flows up to 2 L/min for N2 and H2 and up to 0.5 L/min for H2S; maximum temperature of 620°C; maximum pressure of 1800 psig; reactor volume of 59 cm3; and r
Transcript
* RESULTS OF HYDROTREATING THEKEROSENE FRACTION OF HTI’S FIRST PROOF OF CONCEPT RUN
Frances V. Stohl, Stephen E. Lott, Kathleen V. Diegert, David C. Goodnow Process Research Dept. 6212 Sandia National Laboratories
The objective of Sandia’s hydrotreating study is to determine the relationships between hydrotreating conditions and product characteristics for coal liquids produced using current technologies. The coal- derived liquid, used in the current work is the kerosene fraction of the product from Hydrocarbon Technologies Inc.’s first proof-of-concept run for it’s Catalytic Two-Stage Liquehction Technology. Sandia’s hydrotreating experiments were performed in a continuous operation, microflow reactor system using aged HDN-60 catalyst. A factorial experimental design with three variables (temperature, pressure, liquid hourly space velocity) was used in this work. Nitrogen and sulfir contents of the feed and hydrotreated products were determined using an Antek 7000 Sulfir and Nitrogen Analyzer. Multiple samples were collected at each set of reaction conditions to ensure that each condition was lined out. Hydrotreating at each set of reaction conditions was repeated so that results could be normalized for catalyst deactivation. The normalized results were statistically analyzed. Increases in temperature and pressure had the greatest effects on nitrogen removal. The highest severity condition (388”C, 1500 psig H2, l.sg/h/g(cat)) gave a measured nitrogen value of <5 ppm.
I
I
INTRODUCTION
DOERETC’s refining of coal liquids program is aimed at determining the most cost effective combination of existing refinery processes and blending options necessary to upgrade direct and indirect coal liquids into transportation fuels that meet year 2000 specifications. A main reason for this program is that coal liquefaction processing has improved significantly since the last refining evaluation was done by Sullivan and Frumkin“) at Chevron in the early 1980s. In addition, a recent publication by Zhou, Marano and Winschel(2) indicates that blending coal liquids with petroleum may allow refiners to produce specification products with less refining than if each fraction was processed separately.
The objective of Sandia’s refining of coalderived liquids project is to experimentally evaluate options for hydrotreating coal liquids and various distillate cuts of coal liquids, and to develop a database relating hydrotreating parameters to feed and product quality. The hydrotreating effort is being conducted using a bench-scale, continuous flow, trickle-bed reactor that enables us to evaluate many hydrotreating options in a rapid and cost effective manner. The coalderived liquid used in this work was produced in Hydrocarbon Technologies Inc.’s first proof-of-concept run (POC #1) in their 3 ton/day Process Development Unit using their Catalytic Two-Stage Liquefaction Technology. This 57 day run used Illinois #6 coal and produced up to 5 barrels of distillate liquid product/ton moisture-ash-free coal. After completion of this run, HTI shipped 2500 gallons of coal liquids to Southwest Research Inc. (SwRI) for characterization, fractionation, and evaluation. The kerosene fraction that Sandia hydrotreated was obtained from SwRl as was the aged Criterion WN-60 catalyst used in Sandia’s hydrotreating study. This work is being done in conjunction with DOERETC’s Refining and End-Use Study of Coal Liquids project (Bechtel, SwRI, Amoco, M. W. Kellogg). Results from Sandia’s hydrotreating work will be analyzed by Bechtel using the PIMS refinery model as part of their effort to determine the best way to incorporate coal liquids into an existing refinery.
‘
EXPERIMENTAL SECTION
Sandia’s experimental procedures included using a factorial experimental design, hydrotreating the kerosene fraction of the POC #1 whole coal liquid, characterizing the feed and products, and reporting results to other program participants.
Reactor Feeds and Catalyst. The POC #1 kerosene fraction that was hydrotreated at Sandia was collected when HTI’s in-line hydrotreater was not in operation. The nitrogen and sulfir contents of this fraction were 645 ppm and 239 ppm respectively. The initial boiling point was 385°F and the final boiling point was 489°F. The nitrogen and sulfur values are Sandia’s values and the boiling points are from SwRI. The hydrotreating experiments used aged HDN-60 catalyst that was obtained from SwRI.
Continuous Operation Hydrotreatinv System. Sandia’s hydrotreating experiments are being conducted using a bench-scale, continuous flow, trickle-bed reactor. The system has all required safety features to enable it to be operated unattended. Ranges of operating conditions for this system are as follows: liquid flow from 0.05 to 4 cm3/min; gas flows up to 2 L/min for N2 and H2 and up to 0.5 L/min for H2S; maximum temperature of 620°C; maximum pressure of 1800 psig; reactor volume of 59 cm3; and
r
DISCLAIMER
Portions of this document may be illegible in electronic image products. Images are produced from the best available original document.
maximum catalyst loading of 25 cm3. For this kerosene hydrotreating run, log of aged HDN-60 catalyst was used as received from SwRI, and the actual hydrogen flow rate was 4600 fi3/bbl. Four samples can be collected automatically during unattended operation. With a 45 minute sample collection time and liquid hourly space velocities (LHSV) of 1.5 and 3 g/h/g(cat), the amounts of sample collected would weigh about 11 g and 22 g respectively.
Factorial Experimental Desim. Based on experience, three parameters were chosen for the factorial experimental design used for hydrotreating the kerosene fraction (Figure 1): temperature ranging from 327°C to 388"C, pressure from 500 to 1500 psig H2, and LHSV from 1.5 to 3 g/h/g(cat)). Nitrogen and sulfur contents of the hydrotreated products were monitored during the hydrotreating experiments to ensure that activity was lined out at each set of reaction conditions. After line-out was attained, multiple samples were collected over a 24 hour period. All reaction conditions were tested at least twice so the effects of catalyst deactivation could be determined for each condition and appropriate corrections could be made. An Analysis of Variance (ANOVA) was used to model the results, which had been normalized for differences in catalyst deactivation and extrapolated to a total of 28,000 g of feed processed. The controlled variables used in the ANOVA are the measured temperature, pressure, and LHSV. In addition, SwRI requested that we test the center points of the cube edges parallel to the temperature axis. These points were also included in the ANOVA.
Nitropen and Sulfur Analyses. Small samples were collected either manually or automatically throughout the run. .Nitrogen analyses were used to determine when line-out was achieved at each reaction condition. These analyses were performed using an Antek 7000 Sulfur & Nitrogen Analyzer with an automatic sampler. Standards were prepared using phenanthridine for nitrogen, thianthrene for sulfur, and toluene for the solvent. Six standards prepared by serial dilution were used in the analysis. Standards were measured at least twice. A polynomial fit of the intensity versus concentration data was used for analysis of nitrogen, aid a linear fit of the intensity versus concentration data was used for sulhr. Results will only be shown for nitrogen because sulfur values are very low with only one sample having a measured value >20 ppm.
RESULTS AND DISCUSSION
This run was very successful. There was one unplanned shutdown on the second day of the run due to an operator error. The reactor was restarted and operated continuously for 55 days until the end of the run. The letters at each data point in Figure 2 show the order in which the various conditions were evaluated. The first number after the letter is the average ppm nitrogen at that condition. The number in parentheses is the total amount of feed in grams that had been processed through the reactor from the start of the evaluation of the experimental design to the time the samples were collected. All eight comers and the center point of the cubic design were run at least twice so that the rate of catalyst deactivation could be determined for each condition. The four points at the center points of the cube edges parallel to the temperature axis were only tested once because of lack of feed.
Catalyst Deactivation Correction. Results for each condition (Figure 2) show that the measured nitrogen contents get higher as the amount of feed processed increases, thus indicating catalyst deactivation. The first step in the analysis of the results was to normalize the results for catalyst deactivation so that all results could be compared based on an equal amount of feed processed. This was accomplished by plotting nitrogen values for each lined-out sample collected at a given condition versus the total amount of feed processed from the start of the run until that sample was collected. For example, the numbers of Iined-out samples collected at 388"C, 500 psig Hz, and 1.5 g/h/g(cat), were 8 for point A, 3 for point J, and 6 for point R. The equation for the straight line calculated for these 17 samples was Y = 0.00705X + 49.3 with 3 = 0.97. The slope of this equation (0.00705 p p d g of feed processed) was then used to extrapolate the nitrogen content of each individual sample obtained at this condition out to 28,000 g of total feed. This was approximately the total amount of feed processed in this hydrotreating run. This analysis was performed for. each reaction condition. These normalized nitrogen values for all conditions were then used in the ANOVA to give a model for the remaining nitrogen at 28,000 g total feed processed. The slopes of the lines for the various conditions are shown in Figure 3. The slopes used to correct the values at the center points of the cube edges parallel to the temperature axis were the averages of the high temperature and low temperature slopes at the saine LHSV and pressure. The negative deactivation slope at 327"C, 500 psig H2, 3 g/h/g(cat) is due to the collection of only two samples, which gave poor reproducibility in the nitrogen analysis, at the second repeat of this test condition.
'
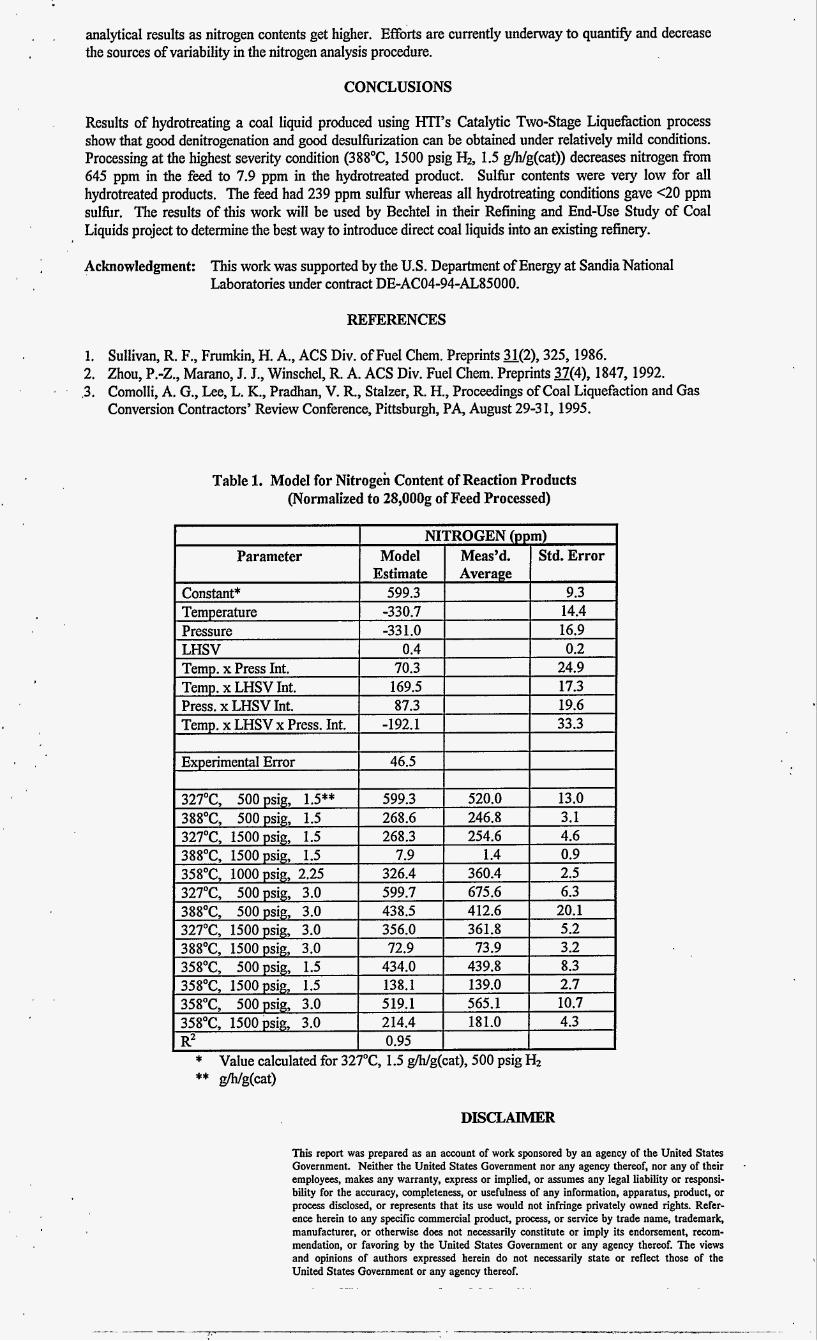
Model for Nitrogen Remaininp at 28,000 P Total Feed Processed. The ANOVA model for nitrogen contents of samples at 28,000 g of total feed processed is shown in Table 1. Results show a good fit of the model to the data as indicated by an 8 value of 0.95. Calculated nitrogen values vary from 7.9 ppm at the highest severity condition (388"C, 1500 psig H2, 1.5 g/h/g(cat)) to 599.7 ppm at the lowest severity condition (327"C, 500 psig H2, 3.0 g/h/g(cat)). The greatest impacts on the nitrogen content are due to the individual effects of temperature and pressure. Changing LHSV by itself has the least effect on nitrogen content. Figure 4 gives a comparison of the calculated and measured results for all reaction conditions. The biggest difference between the calculated and measured results is at the lowest severity condition 327"C, 500 psig H2, 3 g/h/g(cat). The calculated value for nitrogen at this condition is 675.6 ppm, whereas the amount of nitrogen in the feed is 645 ppm. This discrepancy is probably due to higher variability in
. . analytical results as nitrogen contents get higher. Effo'rts are currently underway to quantify and decrease the sources of variability in the nitrogen analysis procedure.
CONCLUSIONS
Results of hydrotreating a coal liquid produced using HTI's Catalytic Two-Stage Liquefaction process show that good denitrogenation and good desulfurization can be obtained under relatively mild conditions. Processing at the highest severity condition (388"C, 1500 psig H2, 1.5 g/h/g(cat)) decreases nitrogen fiom 645 ppm in the feed to 7.9 ppm in the hydrotreated product. Sulfur contents were very low for all hydrotreated products, The feed had 239 ppm sulfur whereas all hydrotreating conditions gave <20 ppm sulfur. The results of this work will be used by Bechtel in their Refining and End-Use Study of Coal Liquids project to determine the best way to introduce direct coal liquids into an existing refinery.
Acknowledgment: This work was supported by the U.S. Department of Energy at Sandia National Laboratories under contract DE-AC04-94-AL85000.
REFERENCES
1. Sullivan, R. F., Frumkin, H. A., ACS Div. of Fuel Chem. Preprints 31(2), 325, 1986. 2. Zhou, P.-Z., Marano, J. J., Winschel, R. A. ACS Div. Fuel Chem. Preprints 37(4), 1847, 1992. .3. Comolli, A. G., Lee, L. K., Pradhan, V. R., Stalzer, R. H., Proceedings of Coal Liquefaction and Gas
Conversion Contractors' Review Conference, Pittsburgh, PA, August 29-3 1 , 1995. I
Table 1. Model for Nitrogen Content of Reaction Products (Normalized to 28,OOOg of Feed Processed)
* Value calculated for 327"C, 1.5 g/h/g(cat), 500 psig H2
** g/h/g(cat)
This report was prepared as an account of work sponsored by an agency of the United States Government. Neither the United States Government nor any agency thereof, nor any of their employees, makes any warranty, express or implied, or assumes any legal liability or responsi- bility for the accuray, completeness, or usefulness of any information, apparatus, product, or process disclosed, or represents that its use would not infringe privately owned rights. Refer- ence herein to any specific commercial product, process, or service by trade name, trademark, manufacturer, or otherwise does not necessarily constitute or imply its endorsement, recom- mendation, or favoring by the United States Government or any agency thereof. The views and opinions of authors expressed herein do not necessarily state or reflect those of the United States Government or any agency thereof.