Page 1
Results of Mobile Metal Ion (MMI-M) Soil Geochemical Surveys, Palmer
Project, Sault Ste. Marie Mining Division,
Ontario
Prepared For
China Metallurgical Exploration Corporation 145 Riviera Drive, Unit 7
Markham, Ontario L3R 5J6
Tel: 905-968-1166
Prepared By
M.A.F. Fedikow Ph.D. P.Eng. P.Geo. C.P.G. Mount Morgan Resources Ltd.
P.O. Box 629 50 Dobals Road North
Lac du Bonnet, Manitoba R0E 1A0
Tel: 204-284-6869; Cell: 204-998-0271 FAX: 204-284-6869
Page 2
Mount Morgan Resources Ltd. “Accurate and Precise Geochemistry in Mineral Exploration”
China Metallurgical Exploration Corporation Palmer MMI Project Page 2
EXECUTIVE SUMMARY
This report presents interpretations based on the collection of 384 soil samples with analysis by
MMI-M from the Palmer project of the China Metallurgical Exploration Corporation
(“CMEC”).
The East Grid of the Palmer Property is marked by a well developed, multi-sample, linear
and northeast-trending Zn, Cd, Pb, Bi, In, K, P, Mn, Th and Ti anomaly. When the MMI
anomalies are compared to the chargeability features it becomes apparent there is a
reasonable correspondence between the Zn, Cd, Pb, Bi, In, K, P, Mn, Th and Ti anomaly
described earlier in this report and the IP anomaly. The two overlapping features are
likely attributable to a zone of disseminated to near solid sulphide mineralization with
Zn-rich mineralogy. The fact that there is excellent correspondence between Zn and Cd
strongly supports the Zn-rich nature of the source region that produces the MMI and IP
features and that the Zn mineral in the source zone is sphalerite. The presence of In and
Bi in association with the Zn-Cd responses are not unexpected since these elements are
common components of Zn-rich mineralization. The K, Mn and P are likely components
of iron formation noted in the survey area (Marc Gaudreau; pers. comm.) whereas Th
and Ti reflect a lithologic signature, possibly of mafic volcanic rocks and chemical
sediments.
Subsequent to verification of the sampling protocols on this property the East Grid
should be followed up by integrating all available data and drill testing. The nature and
chemical makeup of the East Grid anomaly suggests a zone of base metal mineralization
with low precious metal content. The low precious metal content may be due to the
sample collection being too low in the soil profile.
Page 3
Mount Morgan Resources Ltd. “Accurate and Precise Geochemistry in Mineral Exploration”
China Metallurgical Exploration Corporation Palmer MMI Project Page 3
The West Grid has very few significant MMI element suite responses. There are some
low-contrast Zn-Cd responses on this grid; however sample collection may have a direct
bearing on these results.
It is recommended that since sample collection is at the heart of an MMI soil
geochemical survey and without proper sampling protocols the results are necessarily
suspect. The sample collection at Palmer has been modified from that demonstrated to
be optimum. In addition, no vertical profiling of the survey area has been done.
Accordingly, the following steps are recommended before drill testing of the
“anomalous areas” is undertaken:
(i) Return to the East Grid and establish a short sampling transect that cuts
through the multi-element anomaly on the East Grid. Line 7+00S would
seem to offer the best opportunity to assess the sampling integrity.
(ii) Dig pits to coincide with the highest responses for the base metals.
(iii) Collect one sample from each pit at the 10-25 cm depth below the
contact between organic and inorganic soils.
(iv) From one pit, preferably over the base metal anomaly, collect four
samples at 10 cm intervals starting at the organic-inorganic contact. The
first sample will be 0-10 cm, followed by 10-20 cm, 20-30 cm and finally
30-40 cm. Each sample must be a vertical channel sampling all material
from top to bottom of the interval.
(v) Submit these analyses for MMI-M analysis.
The results will demonstrate whether acceptable results were obtained with the
first sampling program based on the responses for the anomaly-forming
elements. Secondly, the vertical profiling will indicate the optimum sample
depth.
An MMI anomaly does not indicate the depth to the source mineralization.
Therefore it is important that the depth to the source mineralization be
estimated by modeling any geophysical surveys that have been done on the grid.
Page 4
Mount Morgan Resources Ltd. “Accurate and Precise Geochemistry in Mineral Exploration”
China Metallurgical Exploration Corporation Palmer MMI Project Page 4
Since IP has been done at Palmer the depth to source and the orientation of the
mineralized zone can be estimated. Then, a drill hole can be determined with
appropriate inclination and declination over a suitably high MMI response.
Page 5
Mount Morgan Resources Ltd. “Accurate and Precise Geochemistry in Mineral Exploration”
China Metallurgical Exploration Corporation Palmer MMI Project Page 5
INTRODUCTION
This report describes the results of a Mobile Metal Ions (MMI) Technology soil
geochemical survey conducted at the Palmer Project. This work was conducted in the
summer of 2012. The intent of the survey is to assess two grid areas (the East Grid and
the West Grid) on the Palmer property for geochemical signatures related to buried
base and precious metal mineralization. Sample collection was contracted to Dan Patrie
Exploration Ltd. Induced Polarization geophysical survey results are compared with the
MMI results from this property.
PROJECT LOCATION AND ACCESS
The subject property is centered at 84°-35°W longitude, 46°-59°N latitude (UTM
coordinates, Zone 16, 684000mE, 5207000mN, NAD 83) in Palmer Township (G-
2478),District of Sault Ste. Marie, Ontario approximately 40 km north of Sault Ste.
Marie, Ontario and 3 km east of Batchawana Bay, Ontario on the east side of Lake
Superior. From Sault Ste. Marie, it is 64 km north on provincial highway 17 to the village
of Batchawana Bay. Four kilometers southeast of Batchawana Bay is the Tribag Mine
road which leads north from highway 17 for 4 km then an old logging road traveling
west 2 km to the East Grid. A gravel road 400 meters north of the village of Batchawana
Bay leads east 3 km to the West Grid. There is no significant infrastructure in the area
apart from the access roads.
Page 6
Mount Morgan Resources Ltd. “Accurate and Precise Geochemistry in Mineral Exploration”
China Metallurgical Exploration Corporation Palmer MMI Project Page 6
Figure 1: Location of the Palmer MMI Project area.
Page 7
Mount Morgan Resources Ltd. “Accurate and Precise Geochemistry in Mineral Exploration”
China Metallurgical Exploration Corporation Palmer MMI Project Page 7
DESCRIPTION OF THE PALMER PROPERTY
The Palmer Property is comprised of 14 mining claims in good standing containing 162
units and covering approximately 2,592 ha. The Property is located within Palmer
Township, claim map (G-2478).
GEOLOGY OF THE PALMER PROJECT AREA (From CMEC)
The subject property is located in the Batchawana Greenstone Belt (BGB) at the western
end of the Abitibi Subprovince. The BGB extends on an east-northeast trend from the
eastern shore of Lake Superior at 47°N latitude. The Palmer property is 3 km to the east
and is underlain by mafic to intermediate volcanic rocks of the Griffin Assemblage.
The Batchawana Greenstone Belt is subdivided into the metavolcanic Griffin and Dismal
assemblages, and the metasedimentary Wart assemblage. The greenstone belt is
gradational into migmatite of the Ramsey Gneiss Domain to the northwest and east; 2)
intruded to the south by the Algoma Plutonic Domain, which includes massive tonalite
and granodiorite intrusions and some gneissic units; and 3) separated from the
Chapleau Gneiss Domain migmatite and syn- to post-massive granodiorite and granite
by the Montreal River fault.
The western part of the greenstone belt is overlain by Keweenawan metavolcanic rocks,
Upper Keweenawan metasedimentary rocks and the Mesoproterozoic Jacobsville
formation. Metamorphic grade in the belt varies from greenschist in the central areas to
amphibolite facies; locally, anatectic migmatite exists near the plutonic-gneiss domains.
Synvolcanic, 2716 million-year old external tonalite plutons were emplaced into the
southern part of the greenstone belt (Griffin Assemblage) and into the Algoma Plutonic
Domain. Isoclinal folding and metamorphism of greenstone belt units occurred between
2677 and 2668 Ma, coincident with the emplacement of structurally concordant, syn-
tectonic to late tectonic diorite, tonalite and granodiorite plutons into the Ramsey
Page 8
Mount Morgan Resources Ltd. “Accurate and Precise Geochemistry in Mineral Exploration”
China Metallurgical Exploration Corporation Palmer MMI Project Page 8
Gneiss Domain, and the emplacement of several small, post-tectonic, internal plutons
into the greenstone belt. Contact metamorphic aureoles, which are related to the late
internal intrusions, are superimposed upon the regional metamorphic pattern. Diabase
dykes of the northwest-striking Sudbury and northeast-striking Preissac dyke swarm cut
all Precambrian rocks.
Most mineral deposits in the belt are located in the western part of the Greenstone belt
with both Archean and Proterozoic copper mineralization being present. Proterozoic
copper mineralization consists of carbonate、quartz、barite、chalcopyrite、pyrite and
molybdenite within breccia pipes cutting Archean metavolcanic and granitoid rocks.
GEOPHYSICS OF THE PALMER PROJECT AREA (From CMEC)
Property geology and the collection of magnetic and electromagnetic information were
elucidated by 2 Induced Polarization (IP) geophysical surveys carried out between the
26th to the 27th of July 2012 and 27th to 28th November. Surveys were undertaken by
Dan Patrie Exploration Ltd. on behalf of CMEC over its Palmer and Ryan property. The
survey coverage for the area is in the east portion of claims 4249406, 4249407, the west
portion of claim 4249412.
A total of 4.65 km IP survey lines along 6 previously cut lines in 2 grids, West and East,
were carried out on the first time by the Batchawana First Nation (BFN) Phil Swanson. 3
lines on the West Grid (2.65 km) with an “a” spacing of 50 m showing in the with blue
lines and black line and an “a” spacing of 25 m on the 3 lines of the East grid (2 km)
showing with 6 levels on both grids being read (n = 6).
Based on the anomaly of the first time results, another IP survey on the West Grid was
undertaken with a combination array with n of 1 to 5 using 25 m long and 2 additional
levels n = 7 to 9 using 50 m long, 25 m sampling. A total of 3.15 km were covered by the
IP survey. The location of the lines are shown in (Figure 2) with the pink lines and black
Page 9
Mount Morgan Resources Ltd. “Accurate and Precise Geochemistry in Mineral Exploration”
China Metallurgical Exploration Corporation Palmer MMI Project Page 9
line.
Figure 2. Location of IP survey lines.
Results
There is one moderate-strength IP anomaly on the East IP grid indicated a broad zone of
increased 13 chargeability that may be due to disseminated sulphides, trending 65°–
245° and in the order of 300 m wide. The anomalous values occur at depth on levels 4, 5
and 6. A number of strong IP anomalies on the West IP grid that may describe 2 or more
IP northwest trending IP zones that are at least 500 m long on the first time IP survey.
Page 10
Mount Morgan Resources Ltd. “Accurate and Precise Geochemistry in Mineral Exploration”
China Metallurgical Exploration Corporation Palmer MMI Project Page 10
As the second time follow-up pole-dipole IP survey was completed on the 3 new lines of
the Palmer Property West Grid in late November and early December 2012. The results
from the 2 surveys, July 2012 and the November 2012 in the West grid, indicate an
N45oW trending zone of anomalous chargeability up to 2.5 by background and with an
associated low resistivity. The zone is in the order of 500 m wide, has a strike length of
at least 1200 m and continuity to a depth in the order of 150 m and more. The zone is
open along strike to the northwest, southeast and to depth.
GEOCHEMISTRY OF THE PALMER PROJECT AREA
A Mobile Metal Ions soil geochemical survey was undertaken on two grids on the
property. These include the East grid where 230 soil samples were collected and the
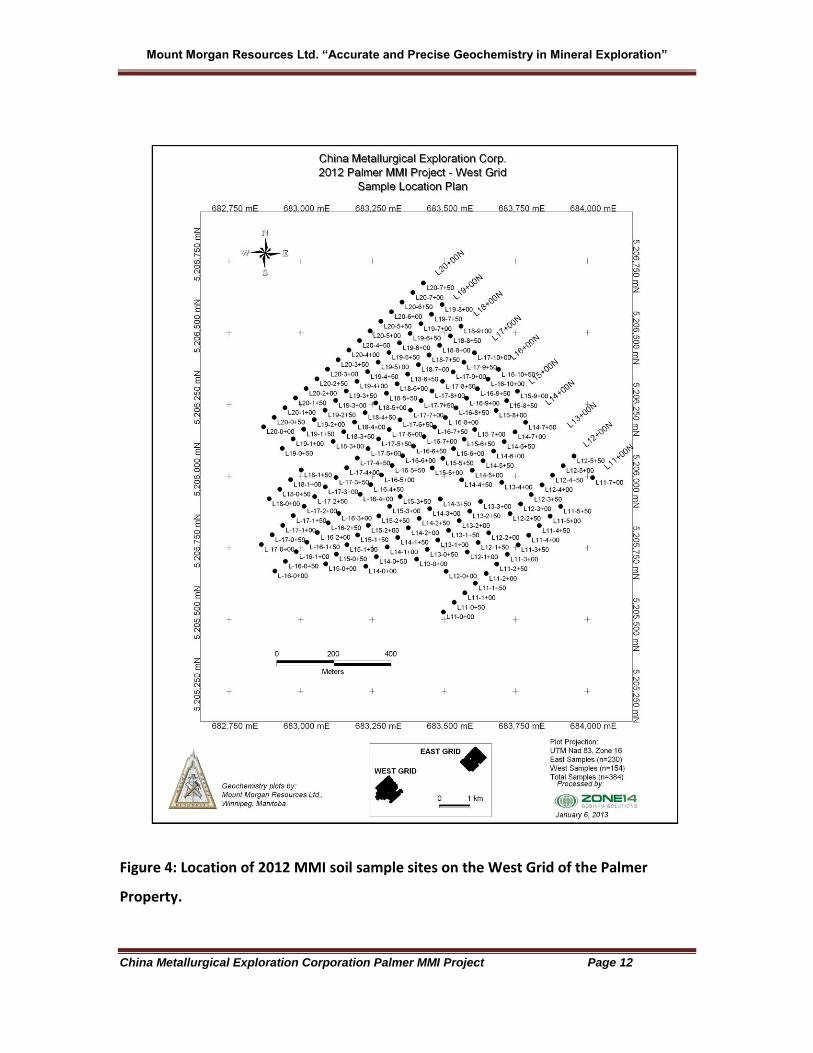
West grid where 154 soil samples were collected. Sample locations with labels are
presented in Figures 3 and 4.
Mobile Metal Ions (“MMI-M”) Soil Geochemical Survey
Figure 3 depicts the locations of soil samples for the 2012 program in the Palmer Project
area. MMI-M samples were collected at 384 sites on the Palmer Property in 2012.
Samples were collected from hand-dug pits at a constant depth of 10-25 cm below the
base of the B-Horizon. Sample collection was done by Dan Patrie Exploration (P.O. Box
45, Massey, Ontario, P0P 1P0; Telephone 705-844-2113) under the supervision of Brent
Patrie.
The sample was collected as a single continuous sample or vertical channel. Samples
were referenced to UTM coordinates using a Garmin GPS (NAD83 Zone 16 Datum). All
samples were analyzed for MMI-M at SGS laboratories in Toronto, Ontario. Sample UTM
coordinates and analyses as received from CMEC and SGS Mineral Services (Toronto) are
presented in Appendix 1. Appendix 2 contains all worksheets and Tables and figures are
presented in Figure 3. The following sections describe the results from MMI-M partial
extraction for 19 elements interpreted to be useful in the survey.
Page 11
Mount Morgan Resources Ltd. “Accurate and Precise Geochemistry in Mineral Exploration”
China Metallurgical Exploration Corporation Palmer MMI Project Page 11
Figure 2: Location of 2012 MMI soil sample sites on the East Grid of the Palmer
Property.
Page 12
Mount Morgan Resources Ltd. “Accurate and Precise Geochemistry in Mineral Exploration”
China Metallurgical Exploration Corporation Palmer MMI Project Page 12
Figure 4: Location of 2012 MMI soil sample sites on the West Grid of the Palmer
Property.
Page 13
Mount Morgan Resources Ltd. “Accurate and Precise Geochemistry in Mineral Exploration”
China Metallurgical Exploration Corporation Palmer MMI Project Page 13
PREAMBLE – MOBILE METAL IONS TECHNOLOGY
The exploitation of mineral commodities in the near-surface geological environment has
become increasingly difficult due to the exhaustion of mineralization exposed at surface
and the mantling of prospective bedrock by residual soil or glacially transported till and
its derivatives. Thick residual soils and glaciofluvial and glaciolacustrine sediments
topped by organic deposits make mineral exploration in these terrains challenging. For
this reason a plethora of innovative exploration geochemical selective and partial
digestions, coupled with state-of-the-art instrumentation capable of measuring
concentrations in the parts per billion (ppb) and sub-parts per billion ranges, have been
developed. These techniques offer the explorationist tools to "see through" overburden
and derive useful mineral exploration data for integration with geology and geophysics
and ultimately for drill-testing multivariate anomalies.
The proprietary Mobile Metal Ions Process (MMI) soil geochemical technique has been
utilized on a wide range of commodity types from base and precious metals to
diamonds worldwide. The Process is based upon proprietary partial extraction
techniques, specific combinations of ligands to keep metals in solution, and relies on
strict adherence to sampling protocols usually established during an orientation
program. Geochemical data resulting from MMI analysis of improperly collected soils
cannot be ameliorated with univariate and/or multivariate statistical
and graphical solutions.
The recognition of anomalies in geochemical data has progressed from simple visual
inspection in small data sets to multivariate, parametric and non-parametric or robust
statistical methods for large datasets usually extracted from regional geochemical
surveys. Derived parameters from these statistical exercises, such as factor scores or
discriminate functions, have been successfully utilized in reducing a large number of
potentially useful variables to a select few variables that identify and localize anomalous
Page 14
Mount Morgan Resources Ltd. “Accurate and Precise Geochemistry in Mineral Exploration”
China Metallurgical Exploration Corporation Palmer MMI Project Page 14
geochemical signatures. These statistical approaches have been required to manipulate
accurate and precise, low-cost, multi-element geochemical data.
The MMI technology uses a different approach to exploration geochemistry by analyzing
soils for a select few commodity elements upon which to base property evaluations.
Having stated this, the demand from explorationists for a more comprehensive package
including pathfinder element suites resulted in the development of “MMI-M”. The
MMI-M multi-element suite was utilized to analyze inorganic soils from the Palmer
Project area and provides analyses for 53 elements. These are a multi-element suite that
report ppb and sub-ppb analyses for base and precious metals, pathfinder elements for
these commodities, as well as elements useful for mapping bedrock geology obscured
by overburden and its derivatives. The large number of elements in the database
provides an opportunity to assess an area of interest for a wide range of metallic
mineral deposits with only minor drawbacks in terms of lower limits of determination.
Mobile Metal Ion Sample Collection and Analysis
In MMI surveys there are some general approaches that are used to guide sample
collection including preferred depths of sampling and these are described briefly here. A
wealth of additional information is also available from the SGS website
(www.sgs/geochemistry.com).
Soil samples, each weighing approximately 250 grams, are normally collected at 25-m
stations in precious metal exploration and up to 50-m in the case of base metals. For
larger targets such as porphyry copper systems the sampling spacing can be increased to
250 m or more. Sample spacing should be established on the basis of a “best-estimate”
of the likely target being sought with estimates from historical data or exploration
results from nearby/adjacent programs. Sample locations are usually documented
according to grid coordinates and GPS readings at each station. Samples are then
collected from a consistent depth of 10-25 cm beneath the point at which soil formation
Page 15
Mount Morgan Resources Ltd. “Accurate and Precise Geochemistry in Mineral Exploration”
China Metallurgical Exploration Corporation Palmer MMI Project Page 15
is initiated in the particular landscape environment where the survey is taking place.
Samples are normally collected with a stiff vinyl trowel after the initial sample pit was
dug with a shovel. The shovel is clean without paint or rust. In particularly hostile
overburden scenarios where significant thickness of organic soils is encountered,
samples may be collected with an auger. A Dutch auger has been found to be
particularly useful for this purpose although maintaining a consistent sample depth with
an auger is difficult. Samples are bagged on site without preparation and shipped to SGS
Laboratories (Toronto, Ont.) for MMI-M analysis. Analytical finish for all extractions is by
inductively coupled plasma-mass spectrometry (ICP-MS).
Analytical duplicates and a standard MMI reference sample are utilized by SGS Mineral
Services (Toronto) to monitor analytical accuracy and precision. Analytical blanks
monitor laboratory-based contamination. The analytical data for all samples are
presented in Appendix 1 and all other work data sheets are presented in Appendix 2.
Figures generated for this report are presented in Appendix 3.
Analytical Protocol
Mobile Metal Ions (MMI) Process
The proprietary Mobile Metal Ions Process (MMI) soil geochemical technique has been
utilized on a wide range of commodity types from base and precious metals to
diamonds worldwide. The MMI Process is based upon proprietary partial extraction
techniques and specific combinations of ligands to retain metals in solution once they
are stripped from individual soil particles. The MMI method relies on strict adherence to
sampling protocols usually established during an orientation program. An orientation
survey is normally conducted prior to the full-blown exploration survey. The orientation
comprises a series of hand dug pits established over a known mineralized target,
geophysical anomaly or a unique lithology. The sample pit is 40 cm deep and exposes 40
cm of inorganic soil. Organic soil (peat or humus) is not recommended for sampling. A
Page 16
Mount Morgan Resources Ltd. “Accurate and Precise Geochemistry in Mineral Exploration”
China Metallurgical Exploration Corporation Palmer MMI Project Page 16
series of four samples are collected at 10 cm intervals below the organic/inorganic soil
contact. Analysis of these samples using MMI extraction will determine at what depth
the optimum base and/or trace element signature can be isolated. Geochemical data
resulting from MMI analysis of improperly collected soils cannot be ameliorated with
univariate and/or multivariate statistical and/or graphical solutions. Samples analyzed
using the MMI methodology require no preparation subsequent to collection and are
shipped to Toronto (SGS Minerals Services Laboratories) and analyzed. The method
targets recently arrived “mobile metal ions” that have traveled from buried/blind
mineralized sources at depth and migrated vertically to surface. The method is
effectively substrate independent and analyses are presented at parts per billion or sub-
parts per billion concentrations. Exceptions are Al, Ca, Fe and Mg, which are quoted in
ppm. Since the MMI-M extraction was utilized for the MMI surveys there are a wide
range of metals reported including precious and base metals and related or “pathfinder”
elements as well as lithologically-sensitive metals. Quality assurance, quality control,
analytical blanks and standards ensure analytical data is both accurate and precise. The
addition of new instrumentation, including an Elan DICP-MS to the SGS laboratory,
permits the measurement of low-level Cr to 1 ppb, a distinct advantage that allows the
differentiation between a Ni signature from a mafic or ultramafic lithology and a Ni
signature from Ni sulphide mineralization.
DATA TREATMENT
Analytical data from the Palmer Project was examined visually for analyses less than the
lower limit of detection (<LLD) for ICP-MS. Data <LLD were replaced with a value ½ of
the LLD for statistical calculations and graphical representation. The 25th percentile for
these data was determined using the software program SYSTAT (V10) and the arithmetic
mean of the lower quartile used to normalize all analyses. The normalized data
represent "response ratios" which were utilized in subsequent plots. Zeros resulting
from this calculation are replaced with “1”. Response ratios are a simple way to
compare MMI data collected from different grids, areas and environments from year to
Page 17
Mount Morgan Resources Ltd. “Accurate and Precise Geochemistry in Mineral Exploration”
China Metallurgical Exploration Corporation Palmer MMI Project Page 17
year. This normalized approach also significantly removes or "smoothes" analytical
variability due to inconsistent dissolution or instrument instability.
Some elements within the Palmer dataset were excluded from statistical assessment
due to the significant number of samples with values at or <LLD. These included As, Au,
Cr, Li, Mo, Pd, Pt, Sb, Sn, Ta, Te and W. Peat samples were excluded from the data set.
Organic soils do not respond well, if at all to MMI partial extraction.
DATA PRESENTATION
Analytical MMI-M data from the survey is presented as two-dimensional bubble plots
for elements deemed to be useful indicators of signatures related to potential
mineralized zones. These plots include Ag, Au, Bi, Cd, Cu, Fe, Ga, In, K, Mn, Nb, Ni, Pb, P,
Sc, Th, Ti, Zn and Zr and are inserted in the report accompanied by a geochemical
narrative. Plots were produced with Vertical Mapper, a module within the MAPINFO
platform.
DATA DESCRIPTION
The 25th percentiles and backgrounds used for the calculation of response ratios for the
Palmer Project soil samples are presented in Appendix 2. The dataset is marked by a
number of elements that have numerous samples at or below the lower limit of
determination (LLD). These include the elements As, Au, Hg, In, Li, Pd, Pt, Sb, Sn, Ta, Te,
Tl and W. These elements are typically less mobile than Cu or Zn and their presence in
measurable quantities in a small number of samples is testament to this. The high
percentage of samples with Pd, Pt, Sn and Ta contents <LLD in this survey is not
surprising given their very low mobility in the surficial/secondary environment. In this
regard, any MMI-M analysis for Pd and/or Pt that is >LLD should be reviewed with care
for its overall significance in the survey and be field checked for possible association
with platinum group metal geological environments. The absence of coincident,
elevated Cd responses with high-contrast Zn response ratios in some samples can be
Page 18
Mount Morgan Resources Ltd. “Accurate and Precise Geochemistry in Mineral Exploration”
China Metallurgical Exploration Corporation Palmer MMI Project Page 18
cause for concern. Generally, coincident Zn-Cd responses are interpreted to represent
bedrock-hosted sphalerite mineralization. The absence of Cd is suggestive of the
possible derivation of Zn from anthropogenic contamination from cultural and/or
industrial activity. This can result in what has been described as a “false” geochemical
anomaly.
For purposes of interpretation of the MMI-M data, element responses are described as
follows: 1-10RR (very low-contrast and generally insignificant); 11-20RR (low-contrast);
21-50RR (moderate-contrast) and >50RR (high-contrast). These are arbitrary divisions
based on observations from numerous MMI surveys undertaken in glaciated terrain and
are not necessarily the only method of data interpretation.
Histograms and Tukey Box Plots
Histograms-Distribution of the Elements
The distribution of select commodity and lithologically-sensitive elements are presented
in histograms below. The commonality amongst this group is the positively skewed
nature of each element presented (Figure 5). For these elements this is due to the large
number of samples that report in the very low parts per billion concentration range. A
review of these histograms also indicates that for the commodity elements selected for
presentation each has a long positively skewed distribution with a “tail” of high
concentration. This is strongly suggestive of an anomalous or elevated data population
and that this population may be related to mineralization.
Page 19
Mount Morgan Resources Ltd. “Accurate and Precise Geochemistry in Mineral Exploration”
China Metallurgical Exploration Corporation Palmer MMI Project Page 19
Figure 5. Histograms for commodity and lithologically-sensitive elements, Palmer
Project.
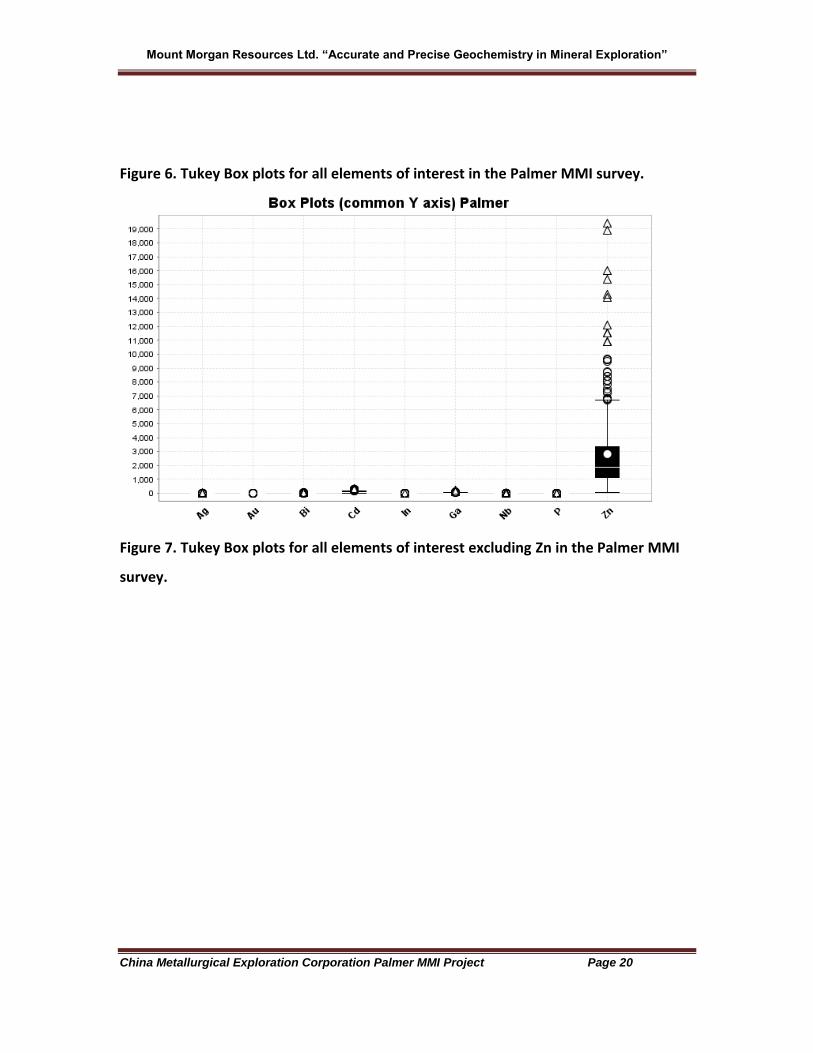
Tukey Box Plots
Another method of examining commodity elements is a Tukey box plot based on a
common Y axis for these elements (Figure 6). The Box plot below illustrates the range in
concentration for the same suite of elements in the histograms and suggests that the
elements Zn and Cd followed by Ga and In have very strongly skewed distributions with
some samples having very high concentrations >19,000 ppb Zn and >350 ppb Cd. If Zn is
removed from the suite of elements that are plotted, other highly elevated elements
include Ga and In (Figure 7). The elements P and Nb are likely indicators of lithologic
differences within the survey areas. The elements with the greatest range in
concentration are most likely to be the anomaly-forming elements.
Page 20
Mount Morgan Resources Ltd. “Accurate and Precise Geochemistry in Mineral Exploration”
China Metallurgical Exploration Corporation Palmer MMI Project Page 20
Figure 6. Tukey Box plots for all elements of interest in the Palmer MMI survey.
Figure 7. Tukey Box plots for all elements of interest excluding Zn in the Palmer MMI
survey.
Page 21
Mount Morgan Resources Ltd. “Accurate and Precise Geochemistry in Mineral Exploration”
China Metallurgical Exploration Corporation Palmer MMI Project Page 21
PALMER PROJECT MMI RESULTS
Analytical data (MMI-M) received from CMEC and SGS are presented in Appendix 1.
Edited data with UTMs, calculated response ratios and both 25th percentiles and
backgrounds used to calculate the RR are given in Appendix 2. Quality control data is
also presented in this Appendix. Response ratios are calculated on the basis of all 2012
inorganic soil samples.
Quality Control “QC”
Analytical Duplicates
The reproducibility of MMI-M analyses in the 2012 Palmer Project dataset was
monitored with the use of analytical duplicates. These are samples that are selected
every 12th sample in the batch and re-analyzed under the same conditions as the
remainder of the unknown soil samples. The duplicate pairs, which illustrate the
analytical reproducibility, are given in Appendix 2.
Page 22
Mount Morgan Resources Ltd. “Accurate and Precise Geochemistry in Mineral Exploration”
China Metallurgical Exploration Corporation Palmer MMI Project Page 22
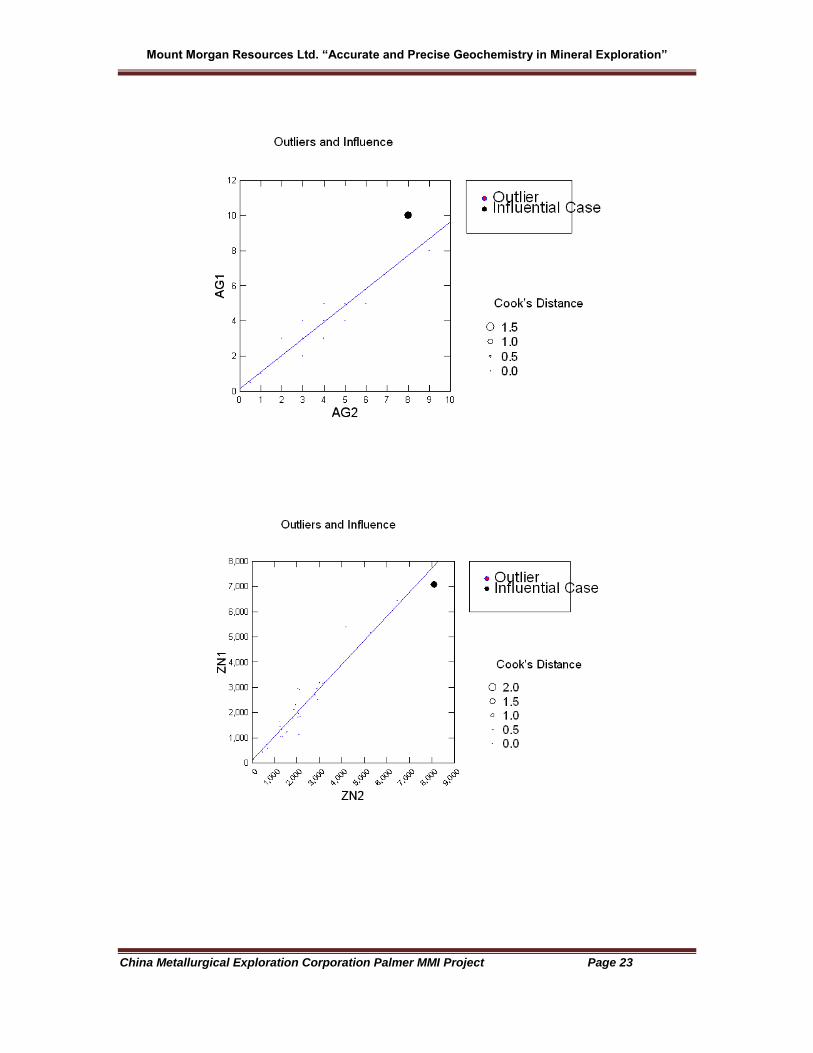
Review of these data indicates good analytical reproducibility over a broad range of
concentration for most elements of interest (Figure 8). The results for the commodity
and lithologically-sensitive elements indicate excellent reproducibility across a wide
range of concentration and this same quality of analytical data is observed for the
majority of the MMI-M element suite. Some variability is noted for the elements near
the LLD and at higher concentration levels. Occasionally there are duplicate pairs that
exhibit variability for select elements but these sample pairs are not indicative of the
majority of results for the remainder of the sample pairs. Simple linear regression for
analytical duplicate pairs is given below for the elements of interest including Au, Ag, Zn,
Cd, Bi, In, K and P. For these plots simple linear regression is based upon concentration
and not response ratios. The results for Au are to be considered non-diagnostic since
the overwhelming majority of analyses from duplicate pairs fall below the lower limit of
detection. Overall, analytical reproducibility for the Palmer MMI-M survey is interpreted
to be good and not a hindrance to the recognition of anomalous responses at all
concentration/contrast levels.
Figure 8. Simple linear regression plots for elements of interest in the Palmer MMI
Project.
Page 23
Mount Morgan Resources Ltd. “Accurate and Precise Geochemistry in Mineral Exploration”
China Metallurgical Exploration Corporation Palmer MMI Project Page 23
Page 24
Mount Morgan Resources Ltd. “Accurate and Precise Geochemistry in Mineral Exploration”
China Metallurgical Exploration Corporation Palmer MMI Project Page 24
Page 25
Mount Morgan Resources Ltd. “Accurate and Precise Geochemistry in Mineral Exploration”
China Metallurgical Exploration Corporation Palmer MMI Project Page 25
Page 26
Mount Morgan Resources Ltd. “Accurate and Precise Geochemistry in Mineral Exploration”
China Metallurgical Exploration Corporation Palmer MMI Project Page 26
Spearman Rank Correlation Coefficient Matrix
The results of the Spearman Rank Correlation Coefficient Matrix review of the Palmer
MMI data is presented in Table 1 below. The entire Matrix is presented in Appendix 2.
The most significant correlations for the commodity elements occurs between Zn and
Cd, Bi With a wide range of elements including Fe, Ga, In, K, Nb, P, Pb, Th and Zr, Cu
With Ni and the rare earths and Fe With Nb, P, Ti, Th and Zr. The rare earths are strongly
inter-correlated as should be expected because of their geochemical affinities. The
elevated correlations between the REE can be used as an indirect assessment of
analytical quality in that good quality analytical work will be reflected by strong
correlations between the individual REE. The lack of any significant correlation in the
Palmer dataset between Au, Ag and Cu is curious but may be explained by the sampling
methodology used in this survey. This issue will be discussed in a later section. Of
particular interest is the Fe-Ti-Nb correlation. This correlation is almost a guarantee that
the survey is underpinned by magnetite-bearing oxide facies iron formation in areas of
anomalous responses for these three elements.
Page 27
Mount Morgan Resources Ltd. “Accurate and Precise Geochemistry in Mineral Exploration”
China Metallurgical Exploration Corporation Palmer MMI Project Page 27
Table 1. Summary of significant correlations-Spearman Rank.
Correlation Coeficient Matrix, Palmer MMI Project.
ELEMENT "r" ELEMENT "r" ELEMENT "r"
DOUBLET
DOUBLET
DOUBLET
Zn With
Cu With Cd 0.76 Dy 0.625 Fe With
Er 0.629 Nb 0.748
Pb With
Eu 0.585 P 0.641
Th 0.622 Gd 0.602 Ti 0.738
Zr 0.538 La 0.569 Th 0.55
Mn 0.426 Zr 0.575
Bi With
Nd 0.582 Fe 0.585 Ni 0.427 Au With
Ga 0.603 Pr 0.576 Ag 0.245
In 0.867 Sc 0.507 Cu 0.248
K 0.504 Sm 0.589 Nb 0.468 Tb 0.574 P 0.686 Y 0.631 Pb 0.819 Yb 0.608 Th 0.677
Zr 0.654
Ca With
*REE >0.800
Mg 0.826
Sr 0.829
PALMER PROJECT RESPONSES
The observations and interpretation that follow are based upon the grid-based 2012
survey dataset. So that trends in the data would be more clearly visible there is a
separate bubble plot for elements analyzed in samples from the east Grid and one plot
for the West Grid. Those elements with RR>100 are truncated at RR=100 and re-plotted
so that subtle trends in the data can be examined.
Page 28
Mount Morgan Resources Ltd. “Accurate and Precise Geochemistry in Mineral Exploration”
China Metallurgical Exploration Corporation Palmer MMI Project Page 28
Base Metal and Related Element Responses (Cu, Pb, Zn, Cd, Ni, Ga, Bi, In)
CuRR (1-72; Figures 9 and 10)
Copper responses in the project areas have moderate- to high-contrast (to 72RR or 72
times background) responses. Unfortunately these elevated responses are present for
only two samples on the East Grid. There are no anomalous responses for Cu on the
West Grid and no vectors to mineralization in either the East or West Grids.
Page 29
Mount Morgan Resources Ltd. “Accurate and Precise Geochemistry in Mineral Exploration”
China Metallurgical Exploration Corporation Palmer MMI Project Page 29
Figure 9: Cu results (RR – response ratios) for 2012 soil geochemical surveys (MMI-M) -
on the East grid of the Palmer Property.
Page 30
Mount Morgan Resources Ltd. “Accurate and Precise Geochemistry in Mineral Exploration”
China Metallurgical Exploration Corporation Palmer MMI Project Page 30
Figure 10: Cu results (RR – response ratios) for 2012 soil geochemical surveys (MMI-M)
- on the West grid of the Palmer Property.
Page 31
Mount Morgan Resources Ltd. “Accurate and Precise Geochemistry in Mineral Exploration”
China Metallurgical Exploration Corporation Palmer MMI Project Page 31
PbRR (1-65; Figures 11 and 12):
The Pb responses from the Palmer survey are marked by northeast-trending linear
responses of 1-3 samples with maximum RR of 65 or 65 times background. This pattern
is present on the East Grid and to some extent on the West Grid. Elevated Pb responses
on lines 19+00N and 20+00N occur at the edge of sampling and could indicate the
presence of a significant Pb anomaly although additional surveys would be required to
ascertain this.
Page 32
Mount Morgan Resources Ltd. “Accurate and Precise Geochemistry in Mineral Exploration”
China Metallurgical Exploration Corporation Palmer MMI Project Page 32
Figure 11: Pb results (RR – response ratios) for 2012 soil geochemical surveys (MMI-M)
- on the East Grid of the Palmer Property.
Page 33
Mount Morgan Resources Ltd. “Accurate and Precise Geochemistry in Mineral Exploration”
China Metallurgical Exploration Corporation Palmer MMI Project Page 33
Figure 12: Pb results (RR – response ratios) for 2012 soil geochemical surveys (MMI-M)
- on the West Grid of the Palmer Property.
Page 34
Mount Morgan Resources Ltd. “Accurate and Precise Geochemistry in Mineral Exploration”
China Metallurgical Exploration Corporation Palmer MMI Project Page 34
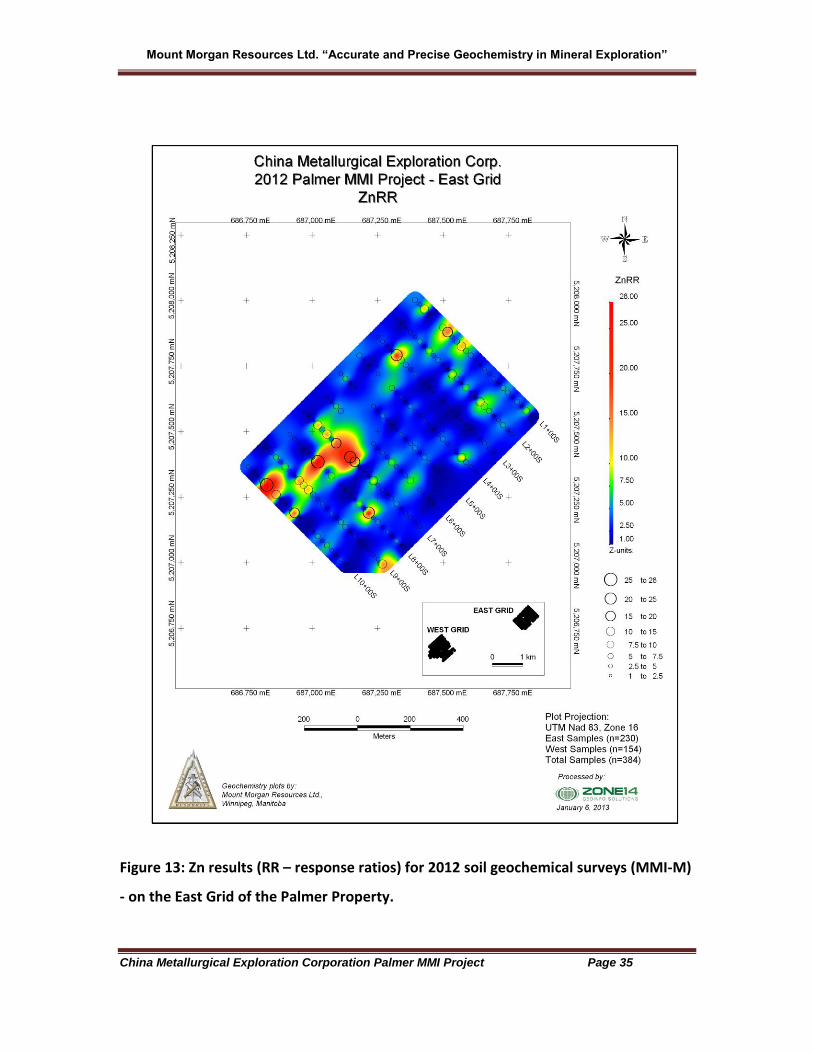
ZnRR (1-28; Figures 13 and 14):
A multi-sample low- to moderate-contrast Zn anomaly occurs in the southwest corner of
the East Grid. The anomaly trends northeast and in this regard has a similar trend as the
Pb responses described earlier. The pattern of response trends off of the east Grid to
the northeast and likely continues in this direction. The anomaly is developed between
lines 10+00S and 7+00S. The West Grid is marked by numerous scattered low-contrast
Zn responses and a single moderate-contrast response in the southwest portion of the
grid. This elevated response occurs at the edge of the West Grid.
Page 35
Mount Morgan Resources Ltd. “Accurate and Precise Geochemistry in Mineral Exploration”
China Metallurgical Exploration Corporation Palmer MMI Project Page 35
Figure 13: Zn results (RR – response ratios) for 2012 soil geochemical surveys (MMI-M)
- on the East Grid of the Palmer Property.
Page 36
Mount Morgan Resources Ltd. “Accurate and Precise Geochemistry in Mineral Exploration”
China Metallurgical Exploration Corporation Palmer MMI Project Page 36
Figure 14: Zn results (RR – response ratios) for 2012 soil geochemical surveys (MMI-M)
- on the West Grid of the Palmer Property.
Page 37
Mount Morgan Resources Ltd. “Accurate and Precise Geochemistry in Mineral Exploration”
China Metallurgical Exploration Corporation Palmer MMI Project Page 37
CdRR (1-14; Figures 15 and 16):
Cadmium responses on the East Grid mirror those of Zn and provide excellent
coincidence between these two elements. This anomalous doublet is interpreted as the
geochemical signature of bedrock-hosted sphalerite. The Cd anomaly has low-contrast
maximum response ratios of 14 times background. A similar observation is made for the
West Grid with the coincidence between Zn and Cd defining an area of interest on lines
15+00N, 16+00N and 17+00N.
Page 38
Mount Morgan Resources Ltd. “Accurate and Precise Geochemistry in Mineral Exploration”
China Metallurgical Exploration Corporation Palmer MMI Project Page 38
Figure 13: Cd results (RR – response ratios) for 2012 soil geochemical surveys (MMI-M)
- on the East Grid of the Palmer Property.
Page 39
Mount Morgan Resources Ltd. “Accurate and Precise Geochemistry in Mineral Exploration”
China Metallurgical Exploration Corporation Palmer MMI Project Page 39
Figure 14: Cd results (RR – response ratios) for 2012 soil geochemical surveys (MMI-M)
- on the West Grid of the Palmer Property.
Page 40
Mount Morgan Resources Ltd. “Accurate and Precise Geochemistry in Mineral Exploration”
China Metallurgical Exploration Corporation Palmer MMI Project Page 40
NiRR (1-8; Figures 15 and 16):
Very low-contrast Ni responses are present on both the East and West Grids. The
pattern or distribution of the responses is erratic and without an indication of either Ni
mineralization or of mafic/ultramafic lithologies in the subsurface. Depending on the
element associations with Ni this element can detect nickel sulphides or mafic and
ultramafic lithologies.
Page 41
Mount Morgan Resources Ltd. “Accurate and Precise Geochemistry in Mineral Exploration”
China Metallurgical Exploration Corporation Palmer MMI Project Page 41
Figure 15: Ni results (RR – response ratios) for 2012 soil geochemical surveys (MMI-M)
- on the East Grid of the Palmer Property.
Page 42
Mount Morgan Resources Ltd. “Accurate and Precise Geochemistry in Mineral Exploration”
China Metallurgical Exploration Corporation Palmer MMI Project Page 42
Figure 16: Ni results (RR – response ratios) for 2012 soil geochemical surveys (MMI-M)
- on the West Grid of the Palmer Property.
Page 43
Mount Morgan Resources Ltd. “Accurate and Precise Geochemistry in Mineral Exploration”
China Metallurgical Exploration Corporation Palmer MMI Project Page 43
BiRR (1-102; Figures 17 and 18):
Very high-contrast Bi responses are present on the East Grid and are coincident with
both Zn and Cd responses and to a lesser extent with Pb. The Bi anomalies are well-
defined multi-sample linear responses and trend northeast. They are interpreted to
trend off of the East Grid and as such will require additional surveys to determine their
extent and characteristics. The results for the West Grid define numerous low- to
moderate-contrast responses developed for multiple samples as well. The best anomaly
from the West Grid occurs on line 17+00N. There is a curious angular pattern to the
overall MMI-Bi responses.
Page 44
Mount Morgan Resources Ltd. “Accurate and Precise Geochemistry in Mineral Exploration”
China Metallurgical Exploration Corporation Palmer MMI Project Page 44
Figure 17: Bi results (RR – response ratios) for 2012 soil geochemical surveys (MMI-M)
- on the East Grid of the Palmer Property.
Page 45
Mount Morgan Resources Ltd. “Accurate and Precise Geochemistry in Mineral Exploration”
China Metallurgical Exploration Corporation Palmer MMI Project Page 45
Figure 18: Bi results (RR – response ratios) for 2012 soil geochemical surveys (MMI-M)
- on the West Grid of the Palmer Property.
Page 46
Mount Morgan Resources Ltd. “Accurate and Precise Geochemistry in Mineral Exploration”
China Metallurgical Exploration Corporation Palmer MMI Project Page 46
GaRR (1-71; Figures 19 and 20):
There is only a single elevated response on the East and West Grids. The maximum 71RR
occurs on the East Grid on line 6+00S. All other responses are very low-contrast.
Page 47
Mount Morgan Resources Ltd. “Accurate and Precise Geochemistry in Mineral Exploration”
China Metallurgical Exploration Corporation Palmer MMI Project Page 47
Figure 19: Ga results (RR – response ratios) for 2012 soil geochemical surveys (MMI-M)
- on the East Grid of the Palmer Property.
Page 48
Mount Morgan Resources Ltd. “Accurate and Precise Geochemistry in Mineral Exploration”
China Metallurgical Exploration Corporation Palmer MMI Project Page 48
Figure 20: Ga results (RR – response ratios) for 2012 soil geochemical surveys (MMI-M)
- on the West Grid of the Palmer Property.
Page 49
Mount Morgan Resources Ltd. “Accurate and Precise Geochemistry in Mineral Exploration”
China Metallurgical Exploration Corporation Palmer MMI Project Page 49
InRR (1-13; Figures 21 and 22):
On the East Grid indium responses are very similar in morphology to those observed for
Pb. These are linear, northeast-trending features with low-contrast response ratios. The
anomalies trend off of the grid to the northeast and southwest. The West Grid is marked
by a small number of 1- and 2-smple low-contrast anomalies. Linear patterns of very
low-contrast responses are visible on the West Grid plot.
Page 50
Mount Morgan Resources Ltd. “Accurate and Precise Geochemistry in Mineral Exploration”
China Metallurgical Exploration Corporation Palmer MMI Project Page 50
Figure 21: In results (RR – response ratios) for 2012 soil geochemical surveys (MMI-M)
- on the East Grid of the Palmer Property.
Page 51
Mount Morgan Resources Ltd. “Accurate and Precise Geochemistry in Mineral Exploration”
China Metallurgical Exploration Corporation Palmer MMI Project Page 51
Figure 22: In results (RR – response ratios) for 2012 soil geochemical surveys (MMI-M)
- on the West Grid of the Palmer Property.
Page 52
Mount Morgan Resources Ltd. “Accurate and Precise Geochemistry in Mineral Exploration”
China Metallurgical Exploration Corporation Palmer MMI Project Page 52
Precious Metal Responses (Au, Ag)
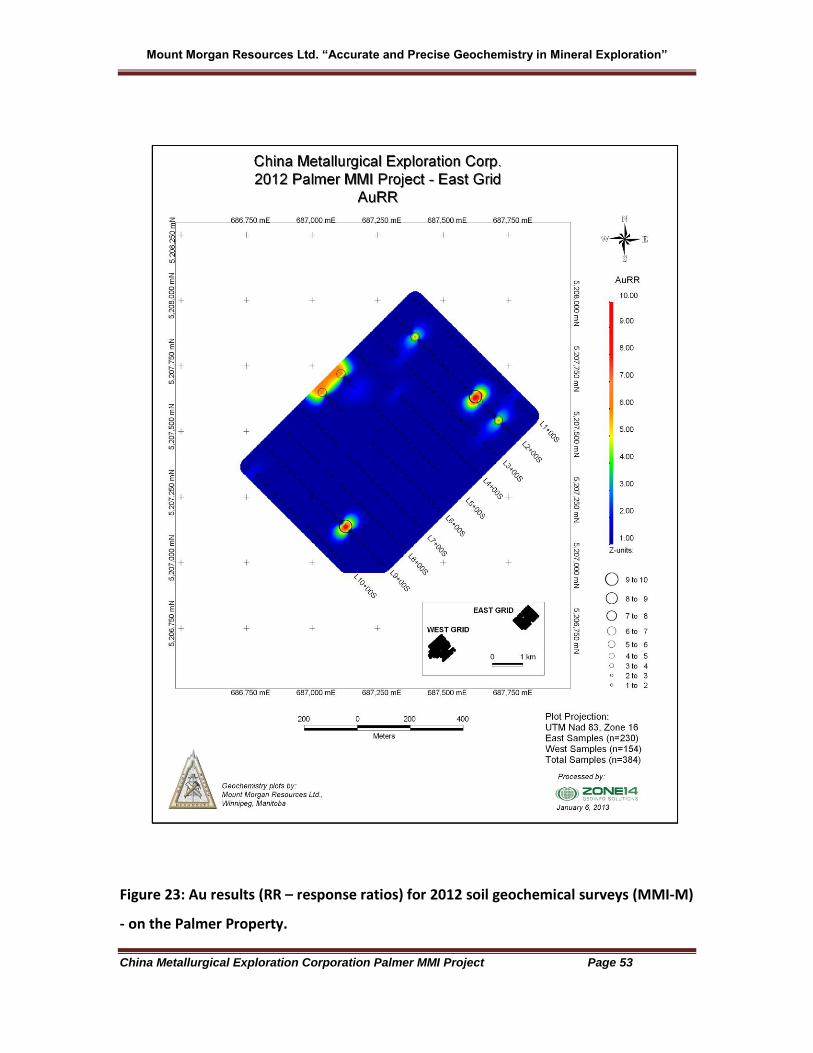
AuRR (1-10; Figures 23 and 24):
Significantly elevated Au responses are absent from both the East and West Grids. The
West Grid is marked by no elevated responses-all responses are at background. Only 6
samples are weakly elevated on the east Grid and these responses are little more than
background with maximum RR of 10 times background. They occur mainly as single
sample responses.
Page 53
Mount Morgan Resources Ltd. “Accurate and Precise Geochemistry in Mineral Exploration”
China Metallurgical Exploration Corporation Palmer MMI Project Page 53
Figure 23: Au results (RR – response ratios) for 2012 soil geochemical surveys (MMI-M)
- on the Palmer Property.
Page 54
Mount Morgan Resources Ltd. “Accurate and Precise Geochemistry in Mineral Exploration”
China Metallurgical Exploration Corporation Palmer MMI Project Page 54
Figure 24: Au results (RR – response ratios) for 2012 soil geochemical surveys (MMI-M)
- on the West Grid of the Palmer Property.
Page 55
Mount Morgan Resources Ltd. “Accurate and Precise Geochemistry in Mineral Exploration”
China Metallurgical Exploration Corporation Palmer MMI Project Page 55
AgRR (1-70; Figures 25 and 26):
Elevated silver responses have maximum values of 70RR or 70 times background. This
value comes from a single sample on the East Grid (Figure 25). There are no significantly
elevated Ag responses on the West grid (Figure 26).
Page 56
Mount Morgan Resources Ltd. “Accurate and Precise Geochemistry in Mineral Exploration”
China Metallurgical Exploration Corporation Palmer MMI Project Page 56
Figure 25: Ag results (RR – response ratios) for 2012 soil geochemical surveys (MMI-M)
- on the East Grid of the Palmer Property.
Page 57
Mount Morgan Resources Ltd. “Accurate and Precise Geochemistry in Mineral Exploration”
China Metallurgical Exploration Corporation Palmer MMI Project Page 57
Figure 26: Ag results (RR – response ratios) for 2012 soil geochemical surveys (MMI-M)
- on the West Grid of the Palmer Property.
Page 58
Mount Morgan Resources Ltd. “Accurate and Precise Geochemistry in Mineral Exploration”
China Metallurgical Exploration Corporation Palmer MMI Project Page 58
Lithologically-Sensitive Elements (Fe, K, Mn, Nb, P, Sc, Th, Ti, Zr)
FeRR (1-55; Figures 27 and 28):
Iron responses from both East and West Grids are scattered and non-definitive of a
mineralization-related response or of a particular lithologic unit. There are multiple
contributing sources to the Fe signature and as such the pattern of response can be
irregular.
Page 59
Mount Morgan Resources Ltd. “Accurate and Precise Geochemistry in Mineral Exploration”
China Metallurgical Exploration Corporation Palmer MMI Project Page 59
Figure 27: Fe results (RR – response ratios) for 2012 soil geochemical surveys (MMI-M)
- on the East Grid of the Palmer Property.
Page 60
Mount Morgan Resources Ltd. “Accurate and Precise Geochemistry in Mineral Exploration”
China Metallurgical Exploration Corporation Palmer MMI Project Page 60
Figure 28: Fe results (RR – response ratios) for 2012 soil geochemical surveys (MMI-M)
- on the West Grid of the Palmer Property.
Page 61
Mount Morgan Resources Ltd. “Accurate and Precise Geochemistry in Mineral Exploration”
China Metallurgical Exploration Corporation Palmer MMI Project Page 61
KRR (1-9; Figures 29 and 30):
Despite the low-contrast responses for K on the East Grid there is good correspondence
with the responses for Zn, Cd, Pb, Bi and In. The K anomalies are both linear, northeast-
trending features as well as single-and two-sample point anomalies. The source of the K
signature may be alteration mineralogy associated with the source of the base metal
anomalies on this grid. The West Grid is marked by sporadic and isolated single sample
anomalies with no correspondence with any of the metal responses seen on this grid.
This could suggest less intense alteration and would suggest less potential for significant
mineralized zones.
Page 62
Mount Morgan Resources Ltd. “Accurate and Precise Geochemistry in Mineral Exploration”
China Metallurgical Exploration Corporation Palmer MMI Project Page 62
Figure 29: K results (RR – response ratios) for 2012 soil geochemical surveys (MMI-M) -
on the East Grid of the Palmer Property.
Page 63
Mount Morgan Resources Ltd. “Accurate and Precise Geochemistry in Mineral Exploration”
China Metallurgical Exploration Corporation Palmer MMI Project Page 63
Figure 30: K results (RR – response ratios) for 2012 soil geochemical surveys (MMI-M) -
on the West Grid of the Palmer Property.
Page 64
Mount Morgan Resources Ltd. “Accurate and Precise Geochemistry in Mineral Exploration”
China Metallurgical Exploration Corporation Palmer MMI Project Page 64
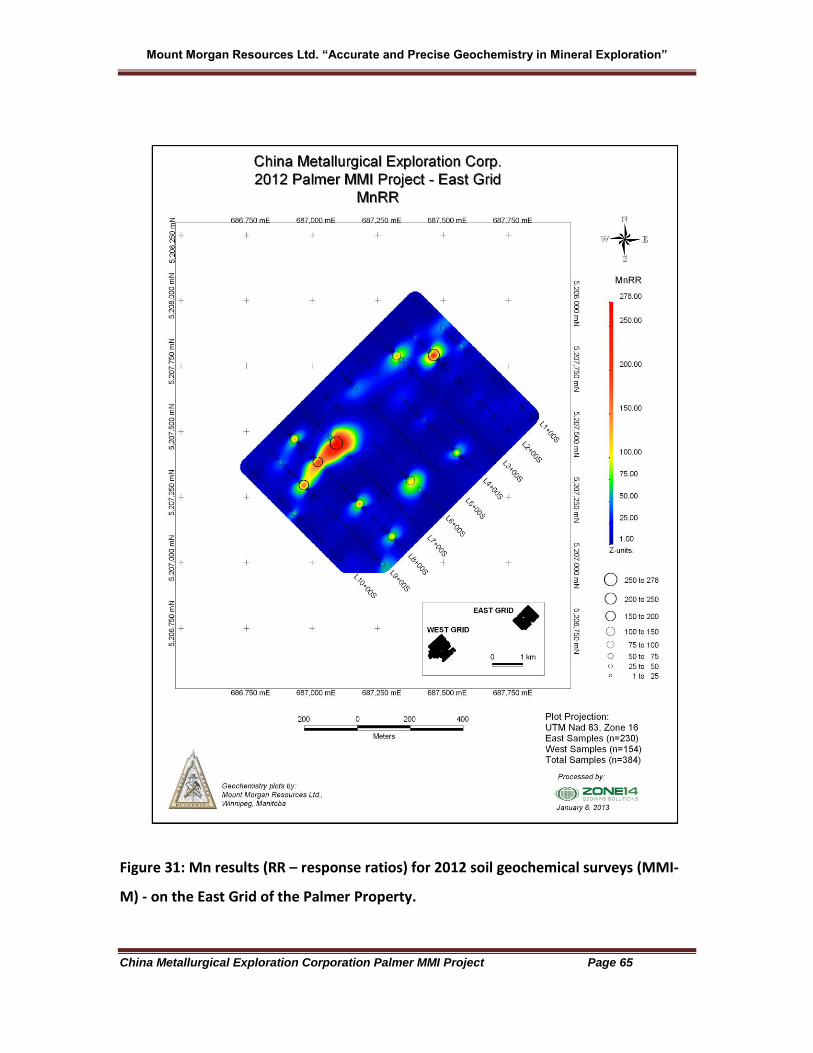
MnRR (1-278; Figures 31, 32, 33 and 34):
Manganese responses for the East Grid are very successful in documenting linear,
northeast-trending responses that are coincident with K and the commodity and related
element suite of Zn, Cd, Pb, Bi and In. In truncated data these patterns are even more
pronounced. It is likely the linear Mn anomalies are related to chemical sedimentary
lithologies that are present in the stratigraphy that underpins the survey area. There
are no such patterns evident in the data from the West Grid suggesting a completely
different geological scenario may be present on the West Grid.
Page 65
Mount Morgan Resources Ltd. “Accurate and Precise Geochemistry in Mineral Exploration”
China Metallurgical Exploration Corporation Palmer MMI Project Page 65
Figure 31: Mn results (RR – response ratios) for 2012 soil geochemical surveys (MMI-
M) - on the East Grid of the Palmer Property.
Page 66
Mount Morgan Resources Ltd. “Accurate and Precise Geochemistry in Mineral Exploration”
China Metallurgical Exploration Corporation Palmer MMI Project Page 66
Figure 32: Mn results (RR – response ratios) for 2012 soil geochemical surveys (MMI-
M) - on the West Grid of the Palmer Property. Truncated data.
Page 67
Mount Morgan Resources Ltd. “Accurate and Precise Geochemistry in Mineral Exploration”
China Metallurgical Exploration Corporation Palmer MMI Project Page 67
Figure 33: Mn results (RR – response ratios) for 2012 soil geochemical surveys (MMI-
M) - on the West Grid of the Palmer Property.
Page 68
Mount Morgan Resources Ltd. “Accurate and Precise Geochemistry in Mineral Exploration”
China Metallurgical Exploration Corporation Palmer MMI Project Page 68
Figure 34: Mn results (RR – response ratios) for 2012 soil geochemical surveys (MMI-
M) - on the West Grid of the Palmer Property. Truncated data.
Page 69
Mount Morgan Resources Ltd. “Accurate and Precise Geochemistry in Mineral Exploration”
China Metallurgical Exploration Corporation Palmer MMI Project Page 69
NbRR (1-134; Figures 35, 36, 37 and 38):
The maximum response for Nb on both grids is 134 times background. However, this is
from a single sample collected from the east Grid which is in isolation. Regardless
whether truncated or non-truncated data is examined there are not distinctive patterns
in these data to suggest the presence of any lithology with a unique bulk chemistry.
Page 70
Mount Morgan Resources Ltd. “Accurate and Precise Geochemistry in Mineral Exploration”
China Metallurgical Exploration Corporation Palmer MMI Project Page 70
Figure 35: Nb results (RR – response ratios) for 2012 soil geochemical surveys (MMI-M)
- on the East Grid of the Palmer Property.
Page 71
Mount Morgan Resources Ltd. “Accurate and Precise Geochemistry in Mineral Exploration”
China Metallurgical Exploration Corporation Palmer MMI Project Page 71
Figure 36: Nb results (RR – response ratios) for 2012 soil geochemical surveys (MMI-M)
- on the West Grid of the Palmer Property. Truncated data.
Page 72
Mount Morgan Resources Ltd. “Accurate and Precise Geochemistry in Mineral Exploration”
China Metallurgical Exploration Corporation Palmer MMI Project Page 72
Figure 37: Nb results (RR – response ratios) for 2012 soil geochemical surveys (MMI-M)
- on the West Grid of the Palmer Property.
Page 73
Mount Morgan Resources Ltd. “Accurate and Precise Geochemistry in Mineral Exploration”
China Metallurgical Exploration Corporation Palmer MMI Project Page 73
Figure 38: Nb results (RR – response ratios) for 2012 soil geochemical surveys (MMI-M)
- on the West Grid of the Palmer Property. Truncated data.
Page 74
Mount Morgan Resources Ltd. “Accurate and Precise Geochemistry in Mineral Exploration”
China Metallurgical Exploration Corporation Palmer MMI Project Page 74
PRR (1-42; Figures 39 and 40):
Phosphorus responses on the East Grid document the presence of linear, northeast-
trending multi-sample anomalies that are coincident with Zn, Cd, Pb, Bi, In, K and Mn
anomalies. The source for the P is likely apatite, particularly if the stratigraphy
underlying the east grid is iron formation or other forms of chemical sediments. The
West Grid is devoid of significant anomalous responses with only low-contrast 1- to 2-
sample weakly elevated responses present.
Page 75
Mount Morgan Resources Ltd. “Accurate and Precise Geochemistry in Mineral Exploration”
China Metallurgical Exploration Corporation Palmer MMI Project Page 75
Figure 39: P results (RR – response ratios) for 2012 soil geochemical surveys (MMI-M) -
on the East Grid of the Palmer Property.
Page 76
Mount Morgan Resources Ltd. “Accurate and Precise Geochemistry in Mineral Exploration”
China Metallurgical Exploration Corporation Palmer MMI Project Page 76
Figure 40: P results (RR – response ratios) for 2012 soil geochemical surveys (MMI-M) -
on the West Grid of the Palmer Property.
Page 77
Mount Morgan Resources Ltd. “Accurate and Precise Geochemistry in Mineral Exploration”
China Metallurgical Exploration Corporation Palmer MMI Project Page 77
ScRR (1-20; Figures 41 and 42):
Scandium responses are normally enhanced in Fe-rich lithologies in MM data. There are
no patterns of response that would suggest the presence of the Fe-rich lithologies on
either the East or West grid. Maximum RR is 20 times background.
Page 78
Mount Morgan Resources Ltd. “Accurate and Precise Geochemistry in Mineral Exploration”
China Metallurgical Exploration Corporation Palmer MMI Project Page 78
Figure 41: Sc results (RR – response ratios) for 2012 soil geochemical surveys (MMI-M)
- on the East Grid of the Palmer Property.
Page 79
Mount Morgan Resources Ltd. “Accurate and Precise Geochemistry in Mineral Exploration”
China Metallurgical Exploration Corporation Palmer MMI Project Page 79
Figure 42: Sc results (RR – response ratios) for 2012 soil geochemical surveys (MMI-M)
- on the West Grid of the Palmer Property.
Page 80
Mount Morgan Resources Ltd. “Accurate and Precise Geochemistry in Mineral Exploration”
China Metallurgical Exploration Corporation Palmer MMI Project Page 80
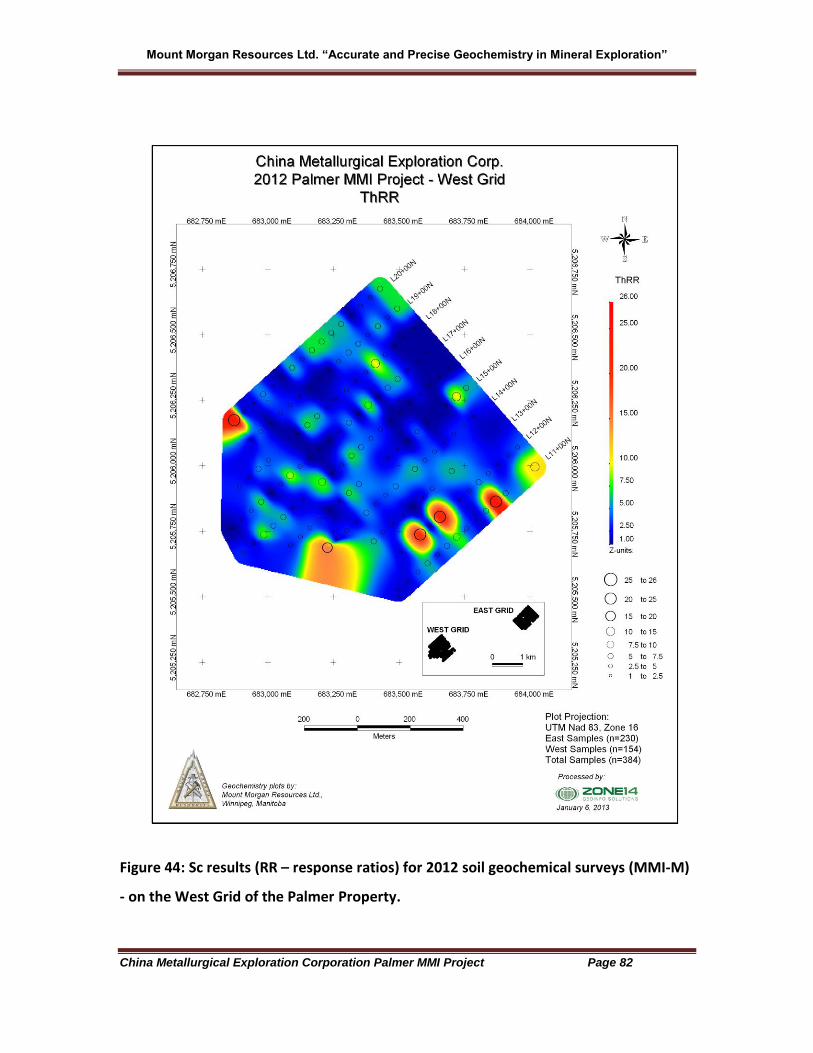
ThRR (1-26; Figures 43 and 44):
The linear, northeast-trending anomalies observed on the East Grid for Zn, Cd, Pb, Bi, In,
K, Mn, and P are also observed for Th. The Th response ratios have maximum values of
26 times background, are multi-sample and extend across multiple sampling grid lines.
These anomalies do not extend off of the grid. Thorium responses from the West Grid
are spotty, irregular and non-diagnostic of a lithologic signature.
Page 81
Mount Morgan Resources Ltd. “Accurate and Precise Geochemistry in Mineral Exploration”
China Metallurgical Exploration Corporation Palmer MMI Project Page 81
Figure 43: Th results (RR – response ratios) for 2012 soil geochemical surveys (MMI-M)
- on the East Grid of the Palmer Property.
Page 82
Mount Morgan Resources Ltd. “Accurate and Precise Geochemistry in Mineral Exploration”
China Metallurgical Exploration Corporation Palmer MMI Project Page 82
Figure 44: Sc results (RR – response ratios) for 2012 soil geochemical surveys (MMI-M)
- on the West Grid of the Palmer Property.
Page 83
Mount Morgan Resources Ltd. “Accurate and Precise Geochemistry in Mineral Exploration”
China Metallurgical Exploration Corporation Palmer MMI Project Page 83
TiRR (1-269; Figures 45, 46, 47 and 48):
Very high TiRR are noted from the Palmer project area with maximum RR of 269 times
background. In non-truncated data the very high single sample response of 269RR
subdues the lower contrast responses however when truncated data is examined linear,
northeast-trending anomalies are observed. These lower contrast anomalies have some
correspondence with Zn, Cd, Pb, Bi, In, K, Mn, Th and P but are not always present in
every area of anomalous response for these elements. This is suggestive of variable
geology in the subsurface. Diffuse but multi-sample low-contrast Ti responses are also
present on the West Grid but these responses tend to be developed across the entire
grid with little variability. This could suggest the presence of a dominant single lithology
in the subsurface.
Page 84
Mount Morgan Resources Ltd. “Accurate and Precise Geochemistry in Mineral Exploration”
China Metallurgical Exploration Corporation Palmer MMI Project Page 84
Figure 45: Ti results (RR – response ratios) for 2012 soil geochemical surveys (MMI-M)
- on the East Grid of the Palmer Property.
Page 85
Mount Morgan Resources Ltd. “Accurate and Precise Geochemistry in Mineral Exploration”
China Metallurgical Exploration Corporation Palmer MMI Project Page 85
Figure 46: Ti results (RR – response ratios) for 2012 soil geochemical surveys (MMI-M)
- on the East Grid of the Palmer Property. Truncated data.
Page 86
Mount Morgan Resources Ltd. “Accurate and Precise Geochemistry in Mineral Exploration”
China Metallurgical Exploration Corporation Palmer MMI Project Page 86
Figure 47: Ti results (RR – response ratios) for 2012 soil geochemical surveys (MMI-M)
- on the West Grid of the Palmer Property.
Page 87
Mount Morgan Resources Ltd. “Accurate and Precise Geochemistry in Mineral Exploration”
China Metallurgical Exploration Corporation Palmer MMI Project Page 87
Figure 48: Ti results (RR – response ratios) for 2012 soil geochemical surveys (MMI-M)
- on the West Grid of the Palmer Property. Truncated data.
Page 88
Mount Morgan Resources Ltd. “Accurate and Precise Geochemistry in Mineral Exploration”
China Metallurgical Exploration Corporation Palmer MMI Project Page 88
ZrRR (1-23; Figures 49 and 50):
Spotty, irregular and non-diagnostic responses for Zr are apparent in the data for both
the East and West Grids. Maximum RR is 23 times background.
Page 89
Mount Morgan Resources Ltd. “Accurate and Precise Geochemistry in Mineral Exploration”
China Metallurgical Exploration Corporation Palmer MMI Project Page 89
Figure 49: Zr results (RR – response ratios) for 2012 soil geochemical surveys (MMI-M)
- on the East Grid of the Palmer Property.
Page 90
Mount Morgan Resources Ltd. “Accurate and Precise Geochemistry in Mineral Exploration”
China Metallurgical Exploration Corporation Palmer MMI Project Page 90
Figure 50: Zr results (RR – response ratios) for 2012 soil geochemical surveys (MMI-M)
- on the West Grid of the Palmer Property.
Page 91
Mount Morgan Resources Ltd. “Accurate and Precise Geochemistry in Mineral Exploration”
China Metallurgical Exploration Corporation Palmer MMI Project Page 91
OBSERVATIONS
Sample Collection in the Palmer MMI Project
Soil samples collected from the Palmer Project area targeted the 10-25 cm sample
depth beneath the base of the B-Horizon. This sample location in the soil profile was
collected from hand-dug pits. The depth of the sample location, however was not
consistent and numerous peat samples are recorded in the sampling information
supplied to the author. The peat samples were removed from the database for this
report. A telephone conversation was held with Brent Patrie of Dan Patrie Exploration
(January 4, 2013) and the sample depth was described/confirmed as above. This sample
location in the soil profile is not the recommended depth of 10-25 cm beneath the
contact between the organic and inorganic soil horizons. As such the data is considered
suspect or at the very least not optimum. Moreover, an orientation survey was not
undertaken to ascertain the optimum depth of sample collection. A total of 384 soil
samples were used for this report.
Data Quality
Simple linear regression, box plots coupled with a visual assessment of quality control
data from analytical duplicates and MMI standard reference materials indicate the
analytical data is both accurate and precise. There are some reproducibility problems
with data at or near the lower limit of determination and possibly at extremely high
responses, however for most elements the partial MMI-M extraction releases sufficient
concentrations of metals from the surfaces of soil particles to be easily measured with
ICP-MS instrumentation.
Anomalous Responses
Base and precious metal mineralization is the focus of exploration on the Palmer Project
and to this end MMI-M surveys were undertaken on both the East and West grids.
These surveys have been based on the collection of a soil sample between 10 and 25 cm
below the base of the B-Horizon. Accordingly the responses that have been observed,
Page 92
Mount Morgan Resources Ltd. “Accurate and Precise Geochemistry in Mineral Exploration”
China Metallurgical Exploration Corporation Palmer MMI Project Page 92
documented and described in this report must be viewed with caution.
Recommendations for assessing the quality of the data in terms of sample collection are
made in the Recommendations section of this report.
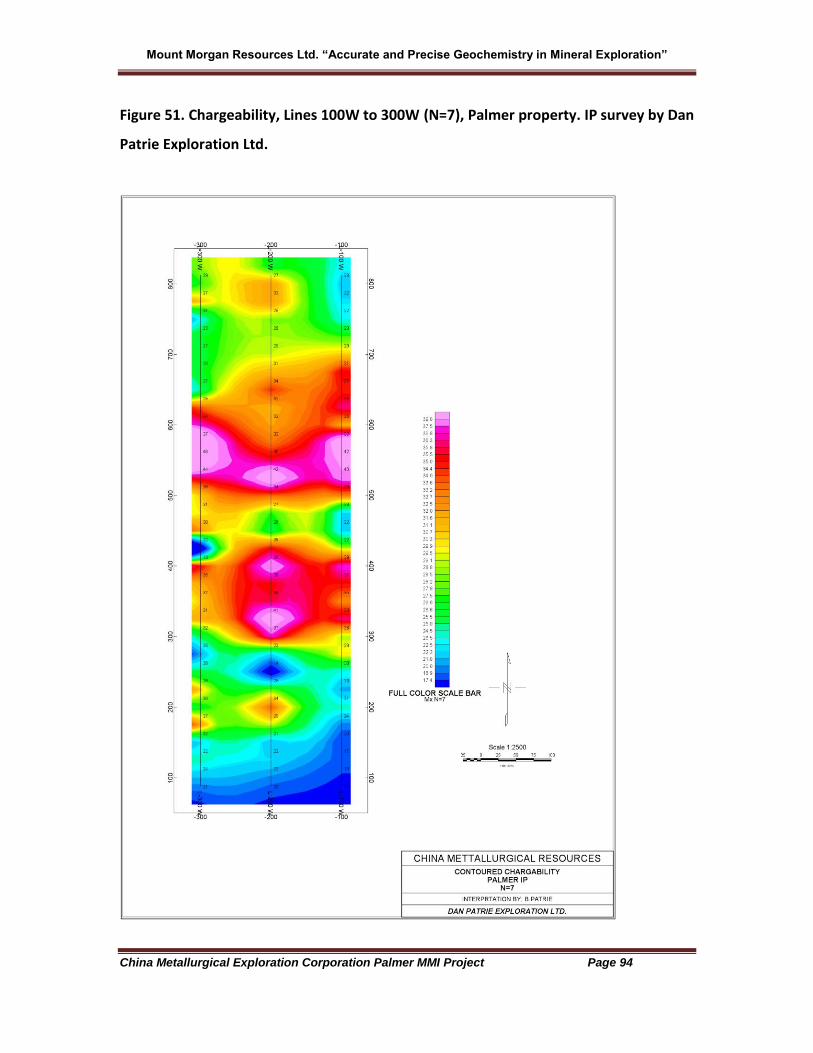
Induced Polarization Survey and Correspondence with Mobile Metal Ions Results
CMEC has undertaken an IP survey on the Palmer property and the results are displayed
below in Figures 51 and 52. The area surveyed indicates the presence of a chargeable
mass between lines 100W and 300W in N=2 and N=7 in an area that corresponds to the
East Grid” where MMI surveys were undertaken. The mass is persistent and non-
truncated to the east and west suggesting a continuation of the zone. It occurs between
400N to 600N (approximately) and extends across all survey lines.
When the chargeability features are compared to the MMI anomalies it becomes
apparent that there is a reasonable correspondence between the Zn, Cd, Pb, Bi, In, K, P,
Mn, Th and Ti anomaly described earlier in this report and the IP anomaly. The two
overlapping features are likely attributable to a zone of disseminated to near solid
sulphide mineralization with Zn-rich mineralogy. The fact that there is excellent
correspondence between Zn and Cd strongly supports the Zn-rich nature of the source
region that produces the MMI and IP features and that the Zn mineral in the source
zone is sphalerite. The presence of Bi and In in association with the Zn-Cd responses are
not unexpected since these elements are common components of Zn-rich
mineralization. The K, Mn and P are likely components of iron formation noted in the
survey area (Marc Gaudreau; pers. comm.) whereas Th and Ti reflect a lithologic
signature, possibly of mafic volcanic rocks and chemical sediments.
Page 93
Mount Morgan Resources Ltd. “Accurate and Precise Geochemistry in Mineral Exploration”
China Metallurgical Exploration Corporation Palmer MMI Project Page 93
Figure 51. Chargeability, Lines 100W to 300W (N=2), Palmer property. IP survey by Dan
Patrie Exploration Ltd.
Page 94
Mount Morgan Resources Ltd. “Accurate and Precise Geochemistry in Mineral Exploration”
China Metallurgical Exploration Corporation Palmer MMI Project Page 94
Figure 51. Chargeability, Lines 100W to 300W (N=7), Palmer property. IP survey by Dan
Patrie Exploration Ltd.
Page 95
Mount Morgan Resources Ltd. “Accurate and Precise Geochemistry in Mineral Exploration”
China Metallurgical Exploration Corporation Palmer MMI Project Page 95
CONCLUSIONS
Notwithstanding the questionable sample collection the following conclusions are
evident:
1. There is a well developed, multi-sample, linear and northeast-trending Zn, Cd,
Pb, Bi, In, K, P, Mn, Th and Ti anomaly present on the East Grid. It should be
followed up by integrating all available data and drill testing.
2. There is some correspondence with a chargeability anomaly defined by an IP
survey. The correspondence is reasonably well developed however there is some
offset to the chargeability features and MMI anomalies.
3. The nature and chemical makeup of the East Grid MMI anomaly suggests a zone
of base metal mineralization without precious metal content. The nature of the
mineralization could be either disseminated or massive. The absence of precious
metals may be due to the sample collection being too low in the soil profile.
4. The West Grid has very few significant MMI element suite responses. There are
some low-contrast Zn-Cd responses on this grid. Again sample collection may
have a direct bearing on these results.
RECOMMENDATIONS
The following recommendations are made with respect to this MMI-M survey at the
Palmer Project of CMEC:
1. Sample collection is at the heart of an MMI soil geochemical survey. Without
proper sampling protocols the results are necessarily suspect. The sample
collection at Palmer has likely been modified from that which has been
demonstrated to be optimum. Moreover no vertical profiling of the survey area
has been done. Accordingly, the following steps are suggested for the short
term, meaning before drill testing of the anomalous areas is undertaken:
Page 96
Mount Morgan Resources Ltd. “Accurate and Precise Geochemistry in Mineral Exploration”
China Metallurgical Exploration Corporation Palmer MMI Project Page 96
(vi) Return to the East Grid and establish a short sampling transect that cuts
through the multi-element anomaly on the East Grid. Line 7+00S would
seem to offer the best opportunity to assess the sampling integrity.
(vii) Dig pits to coincide with the highest responses for the base metals.
(viii) Collect one sample from each pit at the 10-25 cm depth below the
contact between organic and inorganic soils.
(ix) From one pit, preferably over the base metal anomaly, collect four
samples at 10 cm intervals starting at the organic-inorganic contact. The
first sample will be 0-10 cm, followed by 10-20 cm, 20-30 cm and finally
30-40 cm. Each sample must be a vertical channel sampling all material
from top to bottom of the interval.
(x) Submit these analyses for MMI-M analysis.
The results will demonstrate whether acceptable results were obtained with the
first sampling program based on the responses for the anomaly-forming
elements. Secondly, the vertical profiling will indicate the optimum sample
depth.
2. An MMI anomaly does not indicate the depth to the source mineralization.
Therefore it is important that the depth to the source mineralization be
estimated by modeling any geophysical surveys that have been done on the grid.
Since IP has been done at Palmer the depth to source and the orientation of the
mineralized zone can be estimated. Then, a drill hole can be determined with
appropriate inclination and declination over a suitably high MMI response.
Page 97
Mount Morgan Resources Ltd. “Accurate and Precise Geochemistry in Mineral Exploration”
China Metallurgical Exploration Corporation Palmer MMI Project Page 97
CERTIFICATE of AUTHOR
I, Mark A.F. Fedikow, HB.Sc., M.Sc., Ph.D., P.Eng., P.Geo., do hereby certify that:
1. I am currently a self-employed Consulting Geologist/Geochemist with a field office
at:
50 Dobals Road North,
Lac du Bonnet, Manitoba, Canada R0E 1A0.
2. I graduated with a degree in Honors Geology (B.Sc.) from the University of Windsor
(Windsor, Ont.) in 1975. In addition, I earned a M.Sc. in geophysics and
geochemistry from the University of Windsor and a Doctor of Philosophy (Ph.D.) in
exploration geochemistry from the School of Applied Geology, University of New
South Wales (Sydney) in 1982.
3. I am a Member of the Association of Professional Engineers and Geoscientists of
Manitoba. I am also a Fellow of the Association of Exploration (Applied)
Geochemists, and a Member of the Prospectors and Developers Association of
Canada. I am registered as a Professional Engineer (P.Eng.) and a Professional
Geologist (P.Eng.) by the Association of Professional Engineers and Geoscientists of
Manitoba (APEGM). I am registered as a Certified Professional Geologist (C.P.G.) by
the American Association of Professional geologists (Westminster, Colorado, U.S.A.).
4. I have worked as a geologist for a total of thirty-five years since my graduation from
university; as a graduate student, as an employee of major and junior mining
companies, the Manitoba Geological Survey and as an independent consultant.
5. I have read the definition of “qualified person” set out in National Instrument 43-
101 (“NI 43-101”) and certify that by reason of my education, affiliation with a
professional association (as defined in NI 43-101) and past relevant work experience,
I fulfill the requirements to be a “qualified person” for the purposes of NI 43-101.
Page 98
Mount Morgan Resources Ltd. “Accurate and Precise Geochemistry in Mineral Exploration”
China Metallurgical Exploration Corporation Palmer MMI Project Page 98
6. I am responsible for the preparation of the technical report titled "Results of Mobile
Metal Ion (MMI-M) Soil Geochemical Surveys, Palmer Project, Sault Ste. Marie
Mining Division, Ontario”.
7. I have not had prior involvement with the property that is the subject of the
Technical Report.
8. I am not aware of any material fact or material change with respect to the subject
matter of the Technical Report that is not reflected in the Technical Report, the
omission to disclose which makes the Technical Report misleading.
9. I consent to the filing of the Technical Report with any stock exchanges or other
regulatory authority and any publication by them, including electronic publication in
the public company files on the web-sites accessible by the public, of the Technical
Report.
Dated this 17th Day of January, 2012.
Original Signed by Mark Fedikow
Mark A.F. Fedikow, HB.Sc., M.Sc., Ph.D., P. Eng. P.Geo.
Consulting Geologist and Geochemist
Mount Morgan Resources Ltd.
50 Dobals Road North
Lac du Bonnet, Manitoba R0E 1A0
Tel/Fax: 204-284-6869 Cell: 204-998-0271
Email: [email protected]


![PROSP MMI GEOCHEM LINE CUTTING SURV RPT · Falit Zone 100 ITIIIfrell elevation tOO m 8.&.1. The MJv1] geochemical survey was completed at a reconnaissance scale with sample locations](https://static.documents.pub/doc/80x56/5e65029b80c4ee310450acc6/prosp-mmi-geochem-line-cutting-surv-falit-zone-100-itiiifrell-elevation-too-m-81.jpg)


