Page 1
Copyright ©DAIKOKU DENKI Co., Ltd. All rights reserved.
Results of Operations and Strategies
First half of fiscal year ending March 31, 2016
Daikoku Denki Co., Ltd.
(Tokyo Exchanges, First Section, 6430)
Page 2
Copyright ©DAIKOKU DENKI Co., Ltd. All rights reserved. 1 1
Contents
Consolidated Financial Highlights -------------------------
Business Environment --------------------------------------
FY Ending March 2016 Full Year Forecasts -------------
Future Activities ----------------------------------------------
Shareholders Return --------------------------------------------------
p.2
p.9
p.14
p.17
p.29
Page 3
Copyright ©DAIKOKU DENKI Co., Ltd. All rights reserved. 2
Consolidated Financial Highlights
Page 4
Copyright ©DAIKOKU DENKI Co., Ltd. All rights reserved. 3
(note)The planned ratio is the value of earnings projection for the term ending in March 2015 announced on May 11, 2015, as well as the planned ratio described in the materials for the briefing of the second quarter closing of the term ending in March 2015 held on May 28, 2015 targeting institutional investors and analysts.
First Half Consolidated Financial Highlights
27,892
24,225
2,170
815
-3,500
-2,500
-1,500
-500
500
1,500
2,500
0
5,000
10,000
15,000
20,000
25,000
30,000
35,000
40,000
45,000
50,000
2015/3期2Q(累計) 2016/3期2Q(累計)
売上高、営業利益
売上高
営業利益
Consolidated Statements of Income (Summary)
Net Sales ¥24,225 Million
Operating Income ¥815 Million
Ordinary income ¥905 Million
Net income ¥421 Million
Net Sale
Operation Income
Net Sales and Operation Income
2014/9 2015/9
(Millions ¥) 2014/9 2015/9 YoY
Change
Vs. Forecasts
Change
Net Sales 27,892 24,225 -3,667 -2,775
Gross profit-net 8,551 7,966 -585 -1,334
Selling, general and
administrative expenses 6,380 7,150 +770 -650
Operating Income 2,170 815 -1,355 -685
Ordinary income 2,235 905 -1,330 -595
Net income 1,472 421 -1,051 -579
Research and
development expenditure 1,636 2,562 +925 +862
Page 5
Copyright ©DAIKOKU DENKI Co., Ltd. All rights reserved. 4
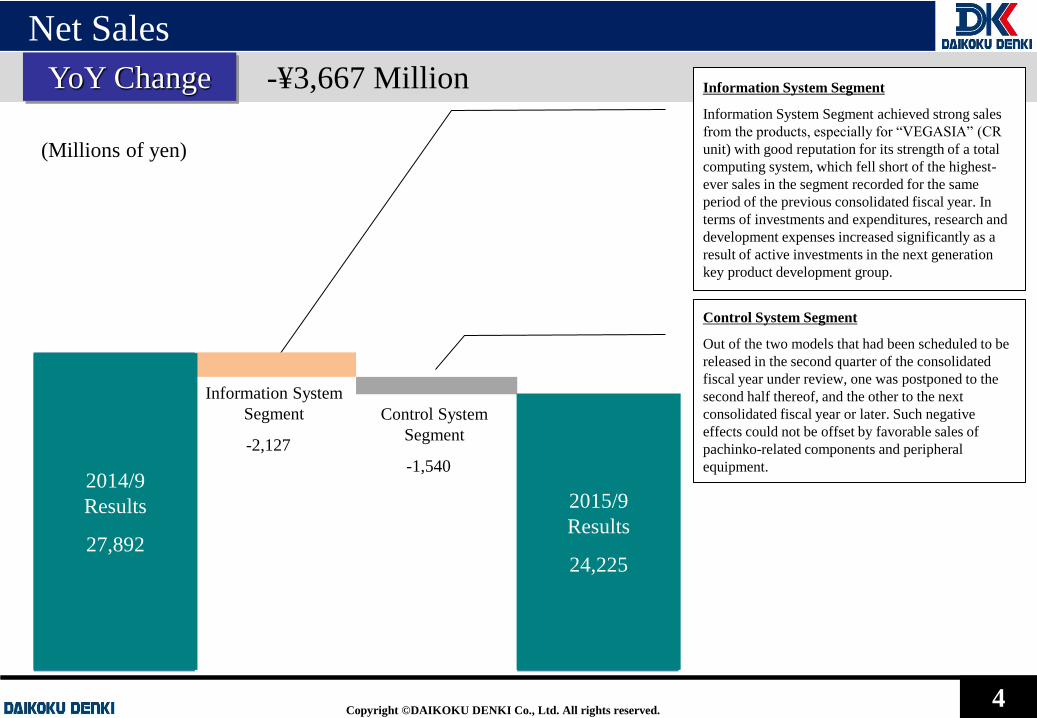
Information System Segment
Information System Segment achieved strong sales
from the products, especially for “VEGASIA” (CR
unit) with good reputation for its strength of a total
computing system, which fell short of the highest-
ever sales in the segment recorded for the same
period of the previous consolidated fiscal year. In
terms of investments and expenditures, research and
development expenses increased significantly as a
result of active investments in the next generation
key product development group.
Control System Segment
Out of the two models that had been scheduled to be
released in the second quarter of the consolidated
fiscal year under review, one was postponed to the
second half thereof, and the other to the next
consolidated fiscal year or later. Such negative
effects could not be offset by favorable sales of
pachinko-related components and peripheral
equipment.
単位:百万円
2016/3期2Q
売上高
24,225
2015/3期2Q
売上高
27,8922015/3期2Q 売上
高, 257642015/3期2Q 売上
高, 24232
制御システム
売上高
△1,540
情報システム
売上高
△2,127
Information System
Segment
-2,127
Control System
Segment
-1,540
Net Sales
YoY Change -¥3,667 Million
(Millions of yen)
2014/9
Results
27,892
2015/9
Results
24,225
Page 6
Copyright ©DAIKOKU DENKI Co., Ltd. All rights reserved. 5
2015/3期2Q
営業利益
2,170
差引売上総利益
(減少)
△585
研究開発費
(費用増加)
△925
その他販管費
(費用減少)
+155
2016/3期2Q
営業利益
815
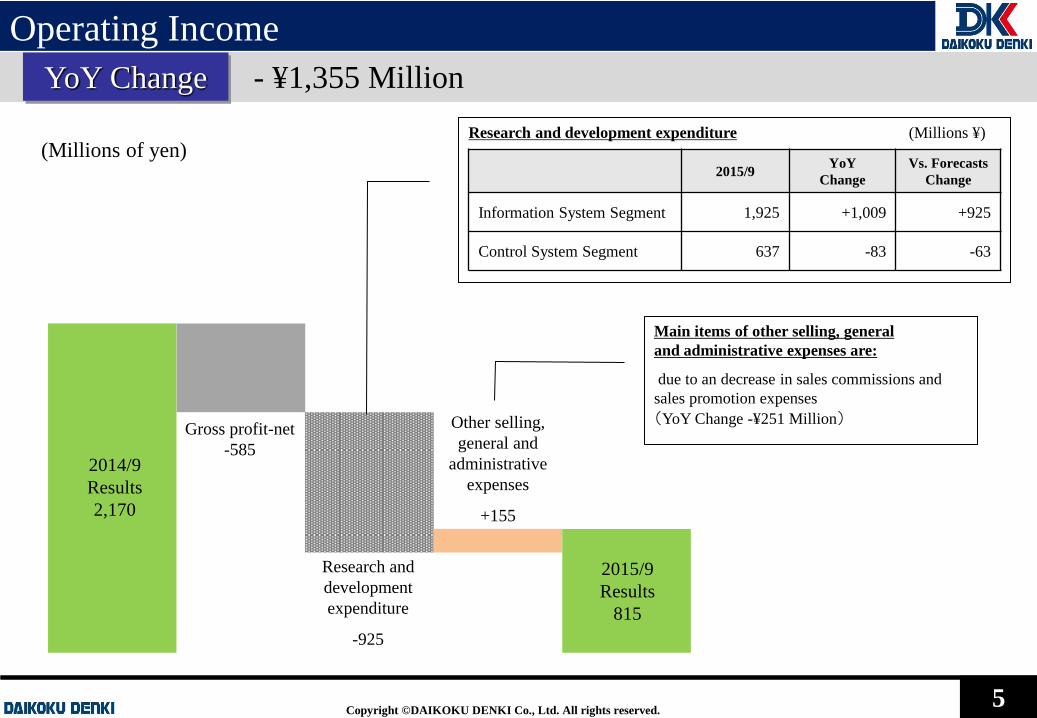
- ¥1,355 Million
Operating Income
YoY Change
(Millions of yen)
2014/9
Results
2,170
2015/9
Results
815
Gross profit-net
-585
Research and
development
expenditure
-925
Other selling,
general and
administrative
expenses
+155
Research and development expenditure (Millions ¥)
2015/9
YoY
Change
Vs. Forecasts
Change
Information System Segment 1,925 +1,009 +925
Control System Segment 637 -83 -63
Main items of other selling, general
and administrative expenses are:
due to an decrease in sales commissions and
sales promotion expenses
(YoY Change -¥251 Million)
Page 7
Copyright ©DAIKOKU DENKI Co., Ltd. All rights reserved. 6
単位:百万円、%
32,138 31,667
60.0% 62.0%
-1
-1
-1
0
0
0
0
0
1
1
1
0
10,000
20,000
30,000
40,000
50,000
60,000
2015/3期 2016/3期2Q
自己資本、自己資本比率
自己資本
自己資本比率
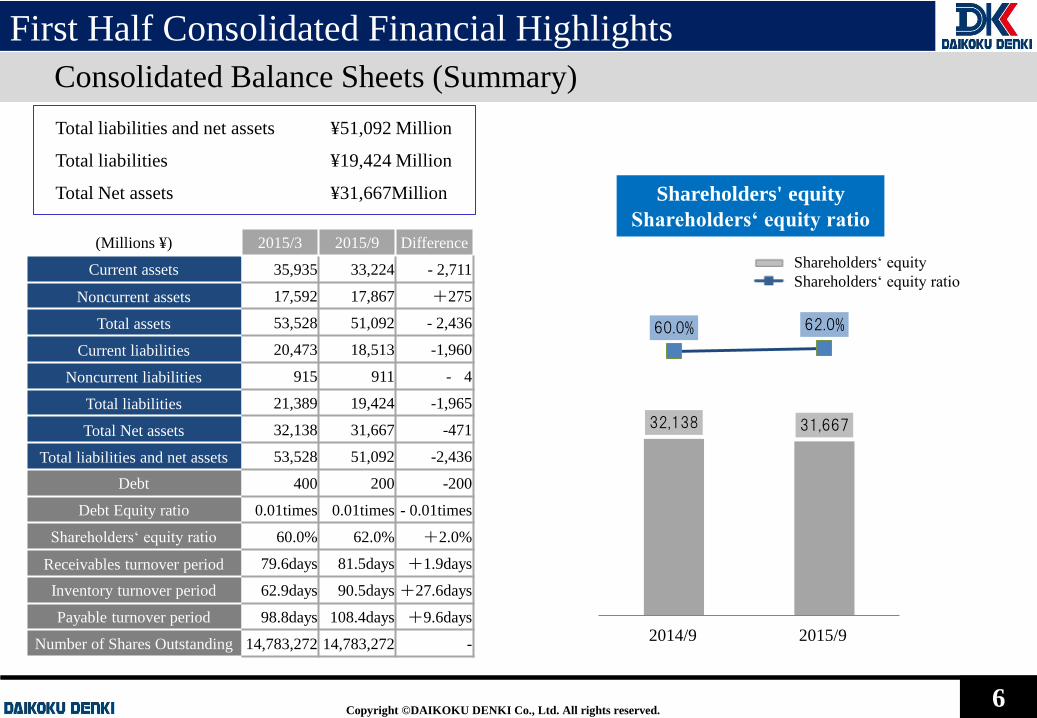
First Half Consolidated Financial Highlights
Consolidated Balance Sheets (Summary)
Total liabilities and net assets ¥51,092 Million
Total liabilities ¥19,424 Million
Total Net assets ¥31,667Million
(Millions ¥) 2015/3 2015/9 Difference
Current assets 35,935 33,224 - 2,711
Noncurrent assets 17,592 17,867 +275
Total assets 53,528 51,092 - 2,436
Current liabilities 20,473 18,513 -1,960
Noncurrent liabilities 915 911 - 4
Total liabilities 21,389 19,424 -1,965
Total Net assets 32,138 31,667 -471
Total liabilities and net assets 53,528 51,092 -2,436
Debt 400 200 -200
Debt Equity ratio 0.01times 0.01times - 0.01times
Shareholders‘ equity ratio 60.0% 62.0% +2.0%
Receivables turnover period 79.6days 81.5days +1.9days
Inventory turnover period 62.9days 90.5days +27.6days
Payable turnover period 98.8days 108.4days +9.6days
Number of Shares Outstanding 14,783,272 14,783,272 -
Shareholders' equity
Shareholders‘ equity ratio
Shareholders‘ equity
Shareholders‘ equity ratio
2014/9 2015/9
Page 8
Copyright ©DAIKOKU DENKI Co., Ltd. All rights reserved. 7
単位:百万円
765 902 1,628
2,710
1,925
2,824 1,818
2,028
1,124
637
3,589
2,720
3,656 3,834
2,562
2012/3期 2013/3期 2014/3期 2015/3期 2016/3期2Q
研究開発費
研究開発費_情報システム 研究開発費_制御システム
2016/3期
全社
5,800百万円
(計画)
Consolidated Statements of Cash Flows
First Half Consolidated Financial Highlights
2014/9 2015/9 YoY Change
Operating CF -227 -2,387 -2,160
Investment CF - 991 - 1,308 - 317
Financing CF - 1,086 - 1,086 + 0
Cash and cash
equivalents 12,975 7,733 - 5,242
(Millions ¥)
Research and development expenses
FY2011 FY2012 FY2013 FY2014 FY2015
(Millions ¥)
Information System Segment Control System Segment
5,800
2,562
(Operating CF )
Cash used in operating activities for the second quarter of the
consolidated fiscal year totaled ¥2,387 million or a ¥2,159
million increase year-on-year. The year-on-year increase was
primarily attributable to a decrease in net income before income
taxes as well as a significant increase in inventory assets,
although there was a decrease in notes and accounts receivable-
trade.
(Investment CF)
Cash used in investing activities for the second quarter of the
consolidated fiscal year was ¥1,308 million or a ¥317 million
increase year-on-year. The year-on-year decrease was primarily
attributable to an increase in expenditure by acquisition of non-
current assets, which exceeded the proceeds from the
withdrawals of time deposits from banks.
(Financing CF)
Cash used for financing activities for the second quarter of the
consolidated fiscal year was ¥1,086 million, almost no change
year-on-year. The main components used were repayment of
debts and payment of dividends.
Page 9
Copyright ©DAIKOKU DENKI Co., Ltd. All rights reserved. 8
18,217 16,089
9,6758,144
0
5,000
10,000
15,000
20,000
25,000
30,000
2015/3期2Q 2016/3期2Q
セグメント売上高
制御システム 情報システム
2,618
1,320
369
350
0
500
1,000
1,500
2,000
2,500
3,000
2015/3期2Q 2016/3期2Q
セグメント利益
制御システム 情報システム
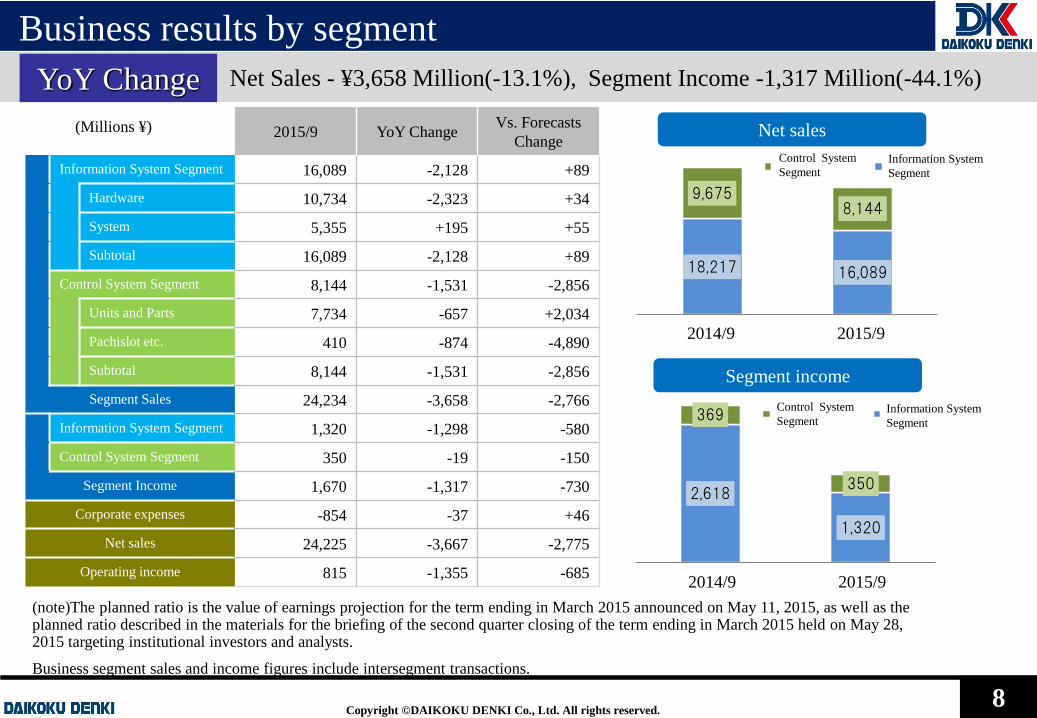
2015/9 YoY Change Vs. Forecasts
Change
Information System Segment 16,089 -2,128 +89
Hardware 10,734 -2,323 +34
System 5,355 +195 +55
Subtotal 16,089 -2,128 +89
Control System Segment 8,144 -1,531 -2,856
Units and Parts 7,734 -657 +2,034
Pachislot etc. 410 -874 -4,890
Subtotal 8,144 -1,531 -2,856
Segment Sales 24,234 -3,658 -2,766
Information System Segment 1,320 -1,298 -580
Control System Segment 350 -19 -150
Segment Income 1,670 -1,317 -730
Corporate expenses -854 -37 +46
Net sales 24,225 -3,667 -2,775
Operating income 815 -1,355 -685
(Millions ¥)
Business results by segment
YoY Change Net Sales - ¥3,658 Million(-13.1%), Segment Income -1,317 Million(-44.1%)
Net sales
Segment income
Control System
Segment Information System
Segment
Control System
Segment Information System
Segment
2014/9 2015/9
2014/9 2015/9
(note)The planned ratio is the value of earnings projection for the term ending in March 2015 announced on May 11, 2015, as well as the planned ratio described in the materials for the briefing of the second quarter closing of the term ending in March 2015 held on May 28, 2015 targeting institutional investors and analysts.
Business segment sales and income figures include intersegment transactions.
Page 10
Copyright ©DAIKOKU DENKI Co., Ltd. All rights reserved. 9
FY Ending March 2016 Full Year
Forecasts
Page 11
Copyright ©DAIKOKU DENKI Co., Ltd. All rights reserved. 10
1. During the cumulative consolidated second (July-September) quarter, while the Japanese economy
showed an improving trend in corporate earnings and employment mainly driven by the government's
economic stimulus measures, the outlook remains unpredictable due to possible downside risks of
overseas economies mainly due to the slowdown of the Chinese economy.
2. The pachinko business, a part of the amusement industry in which the Daikoku Denki Group (“the
Group”), faces a significant challenge as the overall market due to the planned self-imposed
regulations on pachinko and pachislot game machines that are scheduled for the second half of this
consolidated fiscal year 2015.
3. Under such market environment, the Information System Segment improved the added value of
“BiGMO PREMIUM” (data display tools) through the enhancement of the display contents.
In addition, the follow-up exhibition & seminar was held in major cities in Japan successively from the
first quarter, with the aim of promoting the sales of “VEGASIA” (CR unit) and data display tools.
4. The Control System Segment was committed to the development and proposal on new products
aiming for the improvement of business performance and enhanced its framework with a desire to
contribute to improving the operation rate of game machines installed in pachinko halls. In addition,
the development and sales schedule were reviewed due to the changes in specifications by the planned
self-imposed regulations.
Recent industry trends and outlook
Page 12
Copyright ©DAIKOKU DENKI Co., Ltd. All rights reserved. 11 11 11
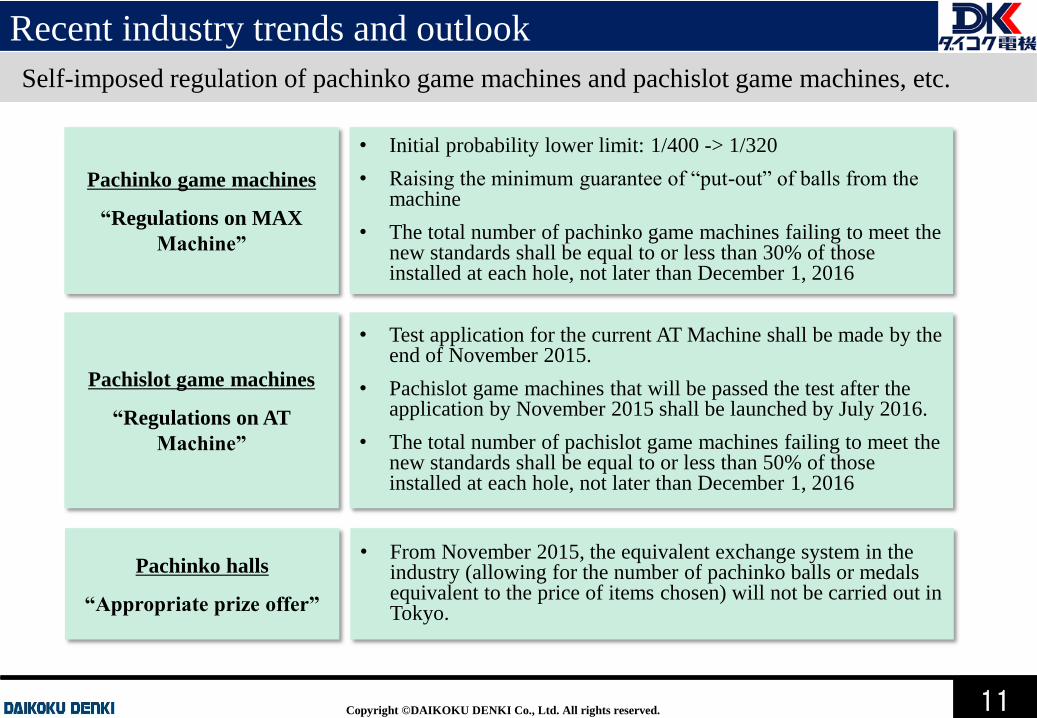
Pachinko game machines
“Regulations on MAX
Machine”
• Initial probability lower limit: 1/400 -> 1/320
• Raising the minimum guarantee of “put-out” of balls from the machine
• The total number of pachinko game machines failing to meet the new standards shall be equal to or less than 30% of those installed at each hole, not later than December 1, 2016
Pachislot game machines
“Regulations on AT
Machine”
• Test application for the current AT Machine shall be made by the end of November 2015.
• Pachislot game machines that will be passed the test after the application by November 2015 shall be launched by July 2016.
• The total number of pachislot game machines failing to meet the new standards shall be equal to or less than 50% of those installed at each hole, not later than December 1, 2016
Self-imposed regulation of pachinko game machines and pachislot game machines, etc.
Pachinko halls
“Appropriate prize offer”
• From November 2015, the equivalent exchange system in the industry (allowing for the number of pachinko balls or medals equivalent to the price of items chosen) will not be carried out in Tokyo.
Recent industry trends and outlook
Page 13
Copyright ©DAIKOKU DENKI Co., Ltd. All rights reserved. 12
Market trends in the present envisioned
by the Company
(estimate of the Company)
Changes in the size of market total gross profit and shifts in performance by year
Hosting of Tokyo
Olympics
Recovery of ¥4 trillion size
of market gross profit
Although market conditions are projected to be severe in the short term, it is expected to recover towards a ¥4 trillion
market size in the medium term Pachinko business scale
[Changes in the size of total gross profit and performance by year]
(Note) Source of survey materials: Daikoku Denki "DK-SIS"
※The gross profit size data is the value obtained by inference based on the market data from DK-SIS data
※Running time per hour is calculated by 5000 balls for pachinko and 2000 coins for pachislot
Consumption tax hike
Page 14
Copyright ©DAIKOKU DENKI Co., Ltd. All rights reserved. 13
50% 49% 47% 46%
13% 14% 14% 15%
34% 33% 35% 35%
3% 4% 4% 4%
2012/10 2013/10 2014/10 2015/10 4円パチンコ
パチンコ(低価貸し)
20円パチスロ
パチスロ(低価貸し)
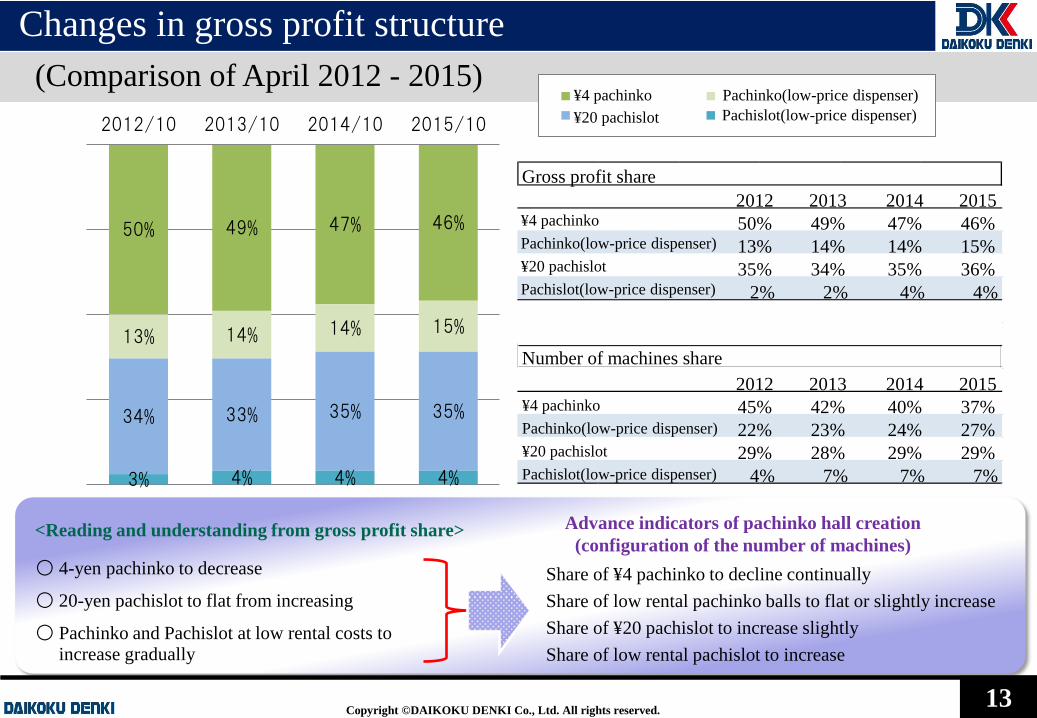
Changes in gross profit structure
(Comparison of April 2012 - 2015)
2012 2013 2014 2015
50% 49% 47% 46%
13% 14% 14% 15%
35% 34% 35% 36%
2% 2% 4% 4%
2012 2013 2014 2015 ¥4 pachinko 45% 42% 40% 37% Pachinko(low-price dispenser) 22% 23% 24% 27% ¥20 pachislot 29% 28% 29% 29% Pachislot(low-price dispenser) 4% 7% 7% 7%
Gross profit share
Number of machines share
¥4 pachinko
Pachinko(low-price dispenser)
¥20 pachislot
Pachislot(low-price dispenser)
¥4 pachinko Pachinko(low-price dispenser)
¥20 pachislot Pachislot(low-price dispenser)
<Reading and understanding from gross profit share> Advance indicators of pachinko hall creation
(configuration of the number of machines)
○ 4-yen pachinko to decrease
○ 20-yen pachislot to flat from increasing
○ Pachinko and Pachislot at low rental costs to increase gradually
Share of ¥4 pachinko to decline continually
Share of low rental pachinko balls to flat or slightly increase
Share of ¥20 pachislot to increase slightly
Share of low rental pachislot to increase
Page 15
Copyright ©DAIKOKU DENKI Co., Ltd. All rights reserved. 14
FY Ending March 2016 Full Year
Forecasts
Page 16
Copyright ©DAIKOKU DENKI Co., Ltd. All rights reserved. 15
○ Downward revisions were made to the full-year consolidated results forecasts on net sales and
income items that were announced on May 11, 2015.
• The pachinko business faces a significant challenge as the overall market due to the planned
implementation of self-imposed regulations on pachinko and pachislot game machines that
are scheduled for the second half of this consolidated fiscal year 2015. As a result, the
Control System Segment is likely to be forced to postpone two models related to display
circuits for pachinko game machines, which were originally scheduled to be released in the
second half of the consolidated fiscal year under review, to the next consolidated fiscal year
or later.
• In addition, one model of pachislot game machine that had been scheduled to be released in
the second quarter of the consolidated fiscal year under review was postponed to the next
consolidated fiscal year.
FY Ending March 2016 Full Year Forecasts
Page 17
Copyright ©DAIKOKU DENKI Co., Ltd. All rights reserved. 16
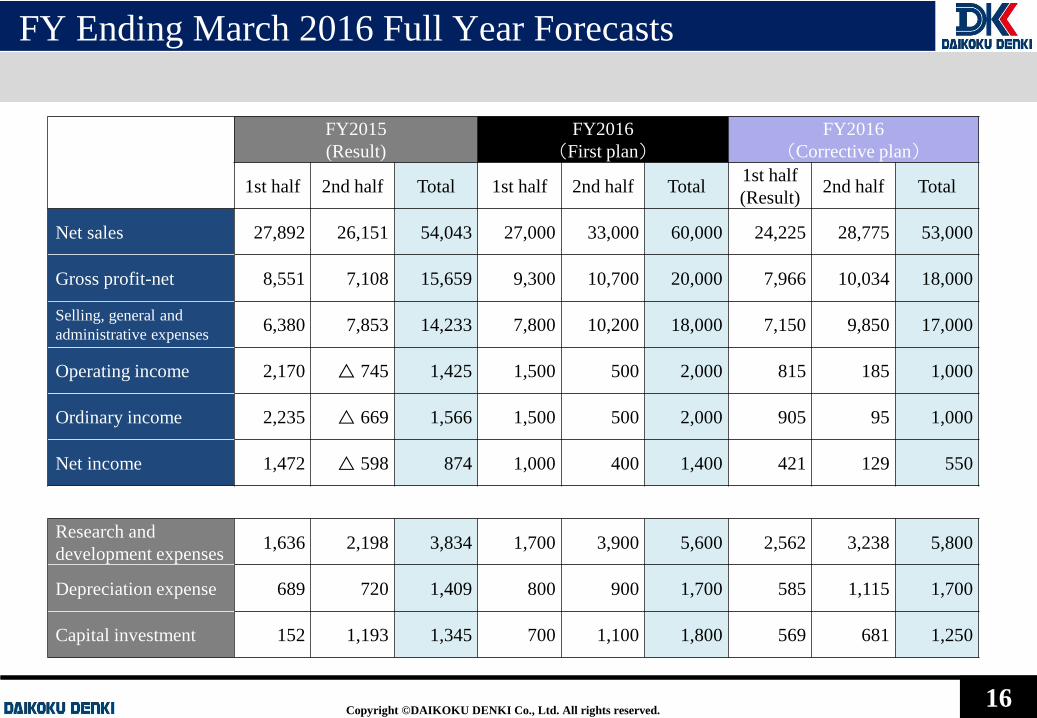
FY Ending March 2016 Full Year Forecasts
FY2015
(Result)
FY2016
(First plan)
FY2016
(Corrective plan)
1st half 2nd half Total 1st half 2nd half Total 1st half
(Result) 2nd half Total
Net sales 27,892 26,151 54,043 27,000 33,000 60,000 24,225 28,775 53,000
Gross profit-net 8,551 7,108 15,659 9,300 10,700 20,000 7,966 10,034 18,000
Selling, general and
administrative expenses 6,380 7,853 14,233 7,800 10,200 18,000 7,150 9,850 17,000
Operating income 2,170 △ 745 1,425 1,500 500 2,000 815 185 1,000
Ordinary income 2,235 △ 669 1,566 1,500 500 2,000 905 95 1,000
Net income 1,472 △ 598 874 1,000 400 1,400 421 129 550
Research and
development expenses 1,636 2,198 3,834 1,700 3,900 5,600 2,562 3,238 5,800
Depreciation expense 689 720 1,409 800 900 1,700 585 1,115 1,700
Capital investment 152 1,193 1,345 700 1,100 1,800 569 681 1,250
Page 18
Copyright ©DAIKOKU DENKI Co., Ltd. All rights reserved. 17
Future Activities
Page 19
Copyright ©DAIKOKU DENKI Co., Ltd. All rights reserved. 18
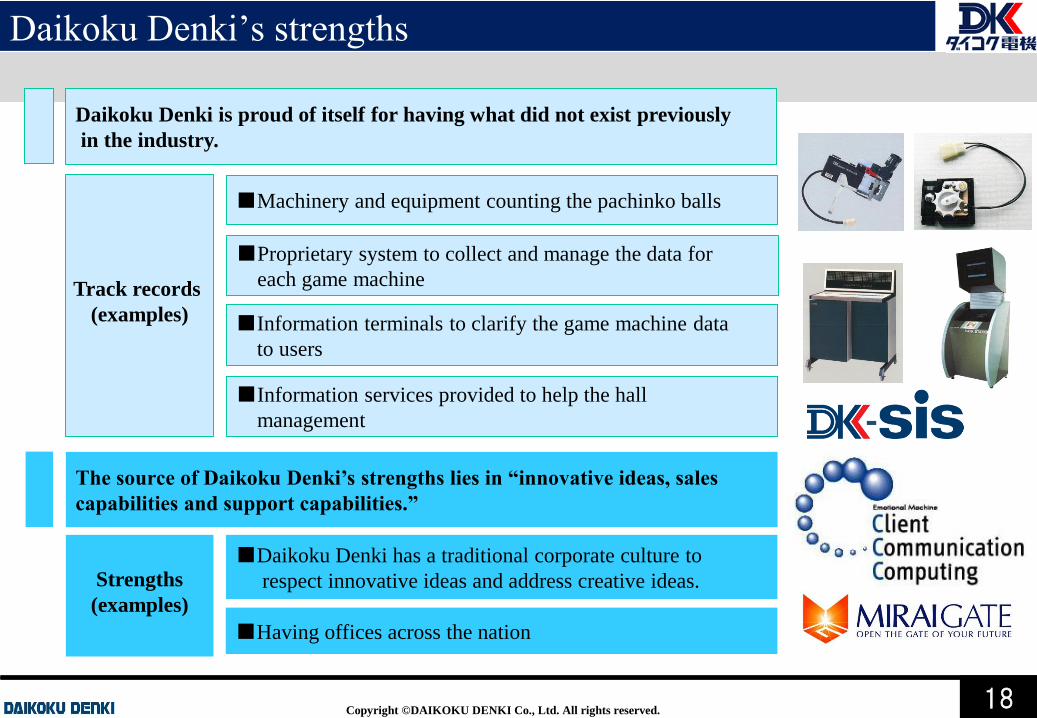
■Having offices across the nation
The source of Daikoku Denki’s strengths lies in “innovative ideas, sales
capabilities and support capabilities.”
■Machinery and equipment counting the pachinko balls
■Proprietary system to collect and manage the data for
each game machine
■Information terminals to clarify the game machine data
to users
■Information services provided to help the hall
management
■Daikoku Denki has a traditional corporate culture to
respect innovative ideas and address creative ideas.
18
Track records
(examples)
Strengths
(examples)
18
Daikoku Denki’s strengths
Daikoku Denki is proud of itself for having what did not exist previously
in the industry.
Page 20
Copyright ©DAIKOKU DENKI Co., Ltd. All rights reserved. 19
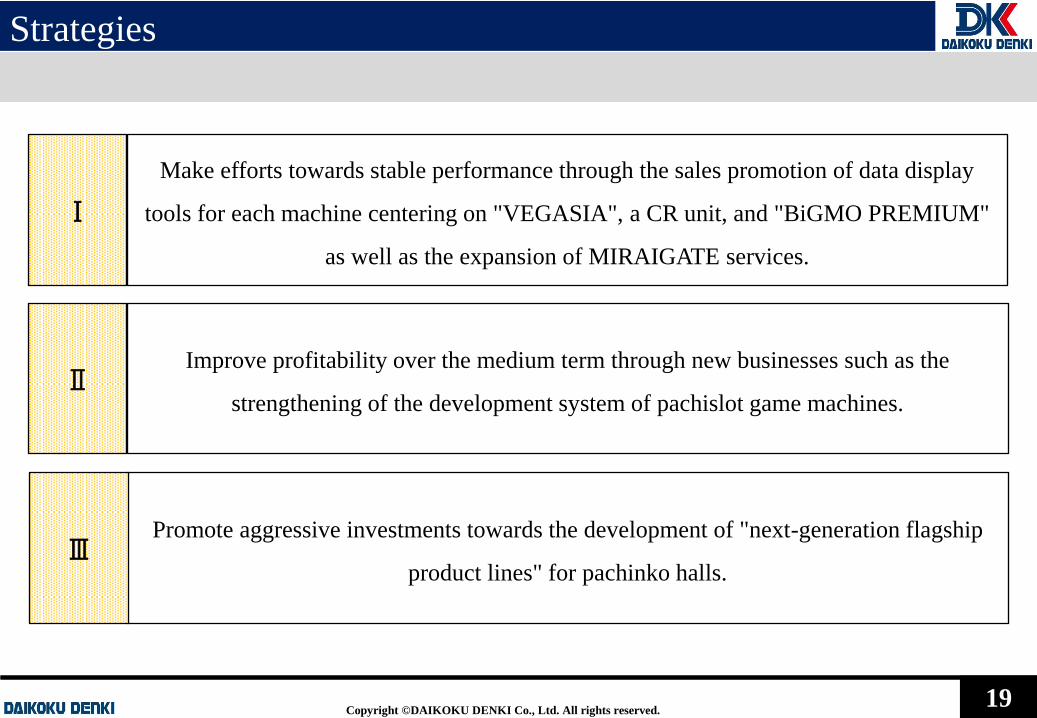
Make efforts towards stable performance through the sales promotion of data display
tools for each machine centering on "VEGASIA", a CR unit, and "BiGMO PREMIUM"
as well as the expansion of MIRAIGATE services.
Improve profitability over the medium term through new businesses such as the
strengthening of the development system of pachislot game machines.
Promote aggressive investments towards the development of "next-generation flagship
product lines" for pachinko halls.
Ⅰ
Ⅱ
Ⅲ
Strategies
Page 21
Copyright ©DAIKOKU DENKI Co., Ltd. All rights reserved. 20
Establishing logistics center and development test environments, and newly setting
up quality assurance office
Daikoku Denki purchased the land located next to Kasugai Division Office
(Kasugai City, Aichi Prefecture) and commenced the operations in mid-
October with a view of improving sales in the Information System
Segment, addressing an increase in product lines and strengthening
production function.
Pursuant to the medium-term management plan, Daikoku Denki will
advance the integration of production bases, and improve and maintain the
quality assurance and development test environment functions on a step-
by-step basis, with the aim of improving product capabilities and
strengthening customer satisfaction.
Page 22
Copyright ©DAIKOKU DENKI Co., Ltd. All rights reserved. 21
163.2 159.2150.5
162.3174.3 175.1
153.8
13.8%
16.1% 15.6% 15.9%
18.2%
20.6%
24.1%
0.0%
5.0%
10.0%
15.0%
20.0%
25.0%
30.0%
100.0
120.0
140.0
160.0
180.0
200.0
220.0
240.0
2008 2009 2010 2011 2012 2013 2014
当社
シェ
ア(%
)
年度
遊技
機の
周辺
機器
市場
規模
(10億
円)
(データ出所)遊技機の周辺機器市場規模は矢野経済研究所調べ
当社シェアは当社推定値
情報システム事業
(市場規模、当社シェア)
遊技機の周辺機器市場 当社シェア(推定)
市場シェア
約35%
ホールコンピュータ市場
21 21
2008 2009 2010 2011 2012 2013 2014
(10億円) 163.2 159.2 150.5 162.3 174.3 175.1 153.8
(10億円) 22.6 25.6 23.5 25.7 31.7 36.1 37.1
13.8% 16.1% 15.6% 15.9% 18.2% 20.6% 24.1%
(データ) 遊技機の周辺機器市場(A) : 矢野経済研究所調べ
弊社 情報システム 売上高(B) : 情報システムセグメントの外部売上高
年度
遊技機の周辺機器市場(A)
弊社 情報システム 売上高(B)
当社シェア 推定 (B÷A)
(データ出所) 当社推定値
Information System Segment
(Billions ¥)
Raising the market share
Our share (estimated) Game machine peripheral
equipment market
FY
Game machine peripheral
equipment market (A)
Information System
Segment (B)
Our share (estimated) B/A
Hall computer market
Our share
(estimated)
35%
Information System Segment
(Billions ¥)
(Billions ¥)
(Source of data) Game machine peripheral equipment market: Surveyed by Yano Research Institute
Page 23
Copyright ©DAIKOKU DENKI Co., Ltd. All rights reserved. 22 22 22
29.7 26.3
11.1
21.4
27.2
20.9 17.0
13.3% 12.9%
5.2%
14.3%
17.7%
14.6%
12.3%
-10.0%
-5.0%
0.0%
5.0%
10.0%
15.0%
20.0%
25.0%
0.02008 2009 2010 2011 2012 2013 2014
当社
シェ
ア(%
)
年度
制御
シス
テム
売上
高(1
0億
円)
(データ出所)表示ユニットの当社シェアは弊社推定
制御システム事業
(売上高、表示ユニット_当社シェア)
制御システム_売上高 表示ユニット_当社シェア(推定)
年度 2008 2009 2010 2011 2012 2013 2014
(千台) 3,339 3,333 2,900 2,604 2,495 2,065 2,016
(10億円) 29.7 26.3 11.1 21.4 27.2 20.9 17.0
(千台) 443 430 151 374 443 301 248
13.3% 12.9% 5.2% 14.3% 17.7% 14.6% 12.3%
(データ出所) パチンコ販売台数 : 矢野経済研究所調べ、 弊社 制御システム 売上高 : 弊社 制御システムセグメントの外部売上高
表示ユニット_当社シェア 推定 (B÷A)
弊社 表示ユニット販売台数(B)
パチンコ 販売台数(A)
弊社 制御システム 売上高
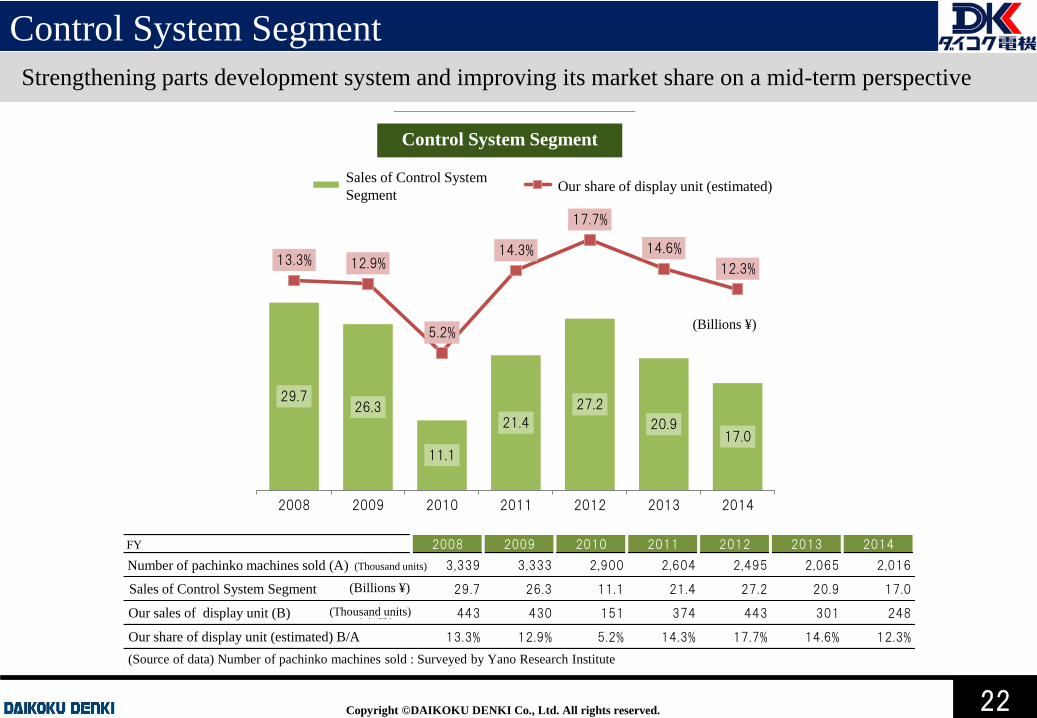
Control System Segment
Strengthening parts development system and improving its market share on a mid-term perspective
(Billions ¥)
Control System Segment
Our share of display unit (estimated) Sales of Control System
Segment
FY
(Billions ¥)
Our share of display unit (estimated) B/A
Sales of Control System Segment
Our sales of display unit (B)
(Thousand units)
(Thousand units)
Number of pachinko machines sold (A)
(Source of data) Number of pachinko machines sold : Surveyed by Yano Research Institute
Page 24
Copyright ©DAIKOKU DENKI Co., Ltd. All rights reserved. 23 23
Business strategy
Information System Segment
Page 25
Copyright ©DAIKOKU DENKI Co., Ltd. All rights reserved. 24
Number of units sold – NO.1!
The strong supports by users are attributable to the completeness in CR unit, as well as the advanced security in
conjunction with the hall computer “C II” and the advanced operational efficiency through unified management.
- Prompt response from the payment of money to the receipt of lending balls
- Prompt response from the pushing of return button to the receipt of balance card
- Prompt response from the insertion of balance card insertion to the play mode state of lending balls
Overwhelming
processing speed
CR unit "VEGASIA"
- Protect pachinko halls from unauthorized bringing-in balls (medals) and unauthorized counting with the aid of
advanced security in conjunction with the hall computer
- Protecting fans with the aid of standard equipped card theft protection functions
1. Self-locking function by each fan; 2. Safe mode to automatically monitor seat-leaving of user;
3. “Theft registration function” and “anti-theft guidance function” and so on
1. Completeness in CR unit
2. Real-time fraud detection; advanced security functions
3. Analyzing the trend of fans by game machine in conjunction with “C II face”
- In the past, the support state by fans was solely identified as the total number of balls (medals). However, the fan
analysis function by game machine in conjunction with “C II face” will allow for the computation of the detailed put-
out (the number of users played multiplied by the playing hours), which will visualize the potentiality of game
machines and contribute to the replacement game machines. "VEGASIA"
Page 26
Copyright ©DAIKOKU DENKI Co., Ltd. All rights reserved. 25
Creating value-added services through enhanced network solutions
Focusing on further strengthening MG services to achieve stabilized support systems for pachinko hall management
C II Standard 2,329 2,493 - 2,585 2,668 - 2,741 2,950 -
Contents library 1,083 1,236 - 1,345 1,449 - 1,502 1,560 -
DK-SIS members 3,628 3,676 - 3,712 3,719 - 3,718 3,780 -
C II-SIS members 586 730 - 827 874 - 965 1,000 -
CR unit (pachinko halls) 152 218 - 304 393 - 454 545 -
Third-party stored ball management 542 589 - 636 685 - 726 770 -
FY2014 FY2015 FY2016
1st half 2nd half Total 1st half 2nd half Total 1st half 2nd half Total
Net Sales 15,562 20,503 36,065 18,217 18,887 37,104 16,089 18,911 35,000
(Annual sales of MG service) 1,363 1,499 2,862 1,627 1,753 3,380 1,868 1,932 3,800
Segment Income 2,950 3,143 6,093 2,618 1,626 4,244 1,320 1,580 2,900
Research and
development expenditure 517 1,111 1,628 916 1,794 2,710 1,925 1,975 3,900
Hall computer 90 113 203 72 59 131 54 96 150
BiGMO Series 34,333 11,591 45,924 11,192 5,933 17,125 6,820 13,180 20,000
BiGMO PREMIUM - 48,046 48,046 30,188 28,399 58,587 21,619 38,381 60,000
IL-X Series 51,779 53,094 104,873 42,944 39,803 82,747 41,189 43,811 85,000
CR unit “VEGASIA” 30,619 46,604 77,223 53,007 56,554 109,561 44,094 45,906 90,000
Face authentication system - - 23 - - 11 6 24 30
Note) Business segment sales and income figures include intersegment transactions.
Call
Lamp
■Total subscribership
■Number of sales
(Number of Halls)
Page 27
Copyright ©DAIKOKU DENKI Co., Ltd. All rights reserved. 26 26
Business strategy
Control System Segment
Page 28
Copyright ©DAIKOKU DENKI Co., Ltd. All rights reserved. 27
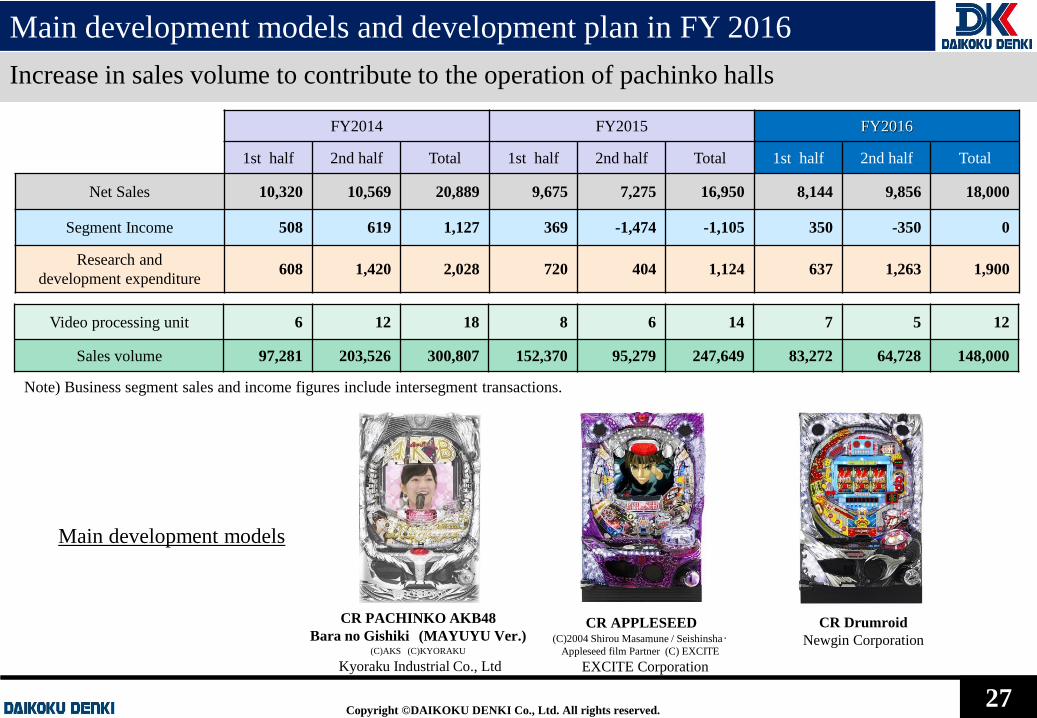
(C)AKS (C)KYORAKU
(C)2004 Shirou Masamune / Seishinsha・
Appleseed film Partner (C) EXCITE
CR APPLESEED
EXCITE Corporation
Increase in sales volume to contribute to the operation of pachinko halls
Main development models and development plan in FY 2016
Video processing unit 6 12 18 8 6 14 7 5 12
Sales volume 97,281 203,526 300,807 152,370 95,279 247,649 83,272 64,728 148,000
FY2014 FY2015 FY2016
1st half 2nd half Total 1st half 2nd half Total 1st half 2nd half Total
Net Sales 10,320 10,569 20,889 9,675 7,275 16,950 8,144 9,856 18,000
Segment Income 508 619 1,127 369 -1,474 -1,105 350 -350 0
Research and
development expenditure 608 1,420 2,028 720 404 1,124 637 1,263 1,900
Main development models
CR Drumroid
Newgin Corporation
CR PACHINKO AKB48
Bara no Gishiki (MAYUYU Ver.)
Kyoraku Industrial Co., Ltd
Note) Business segment sales and income figures include intersegment transactions.
Page 29
Copyright ©DAIKOKU DENKI Co., Ltd. All rights reserved. 28
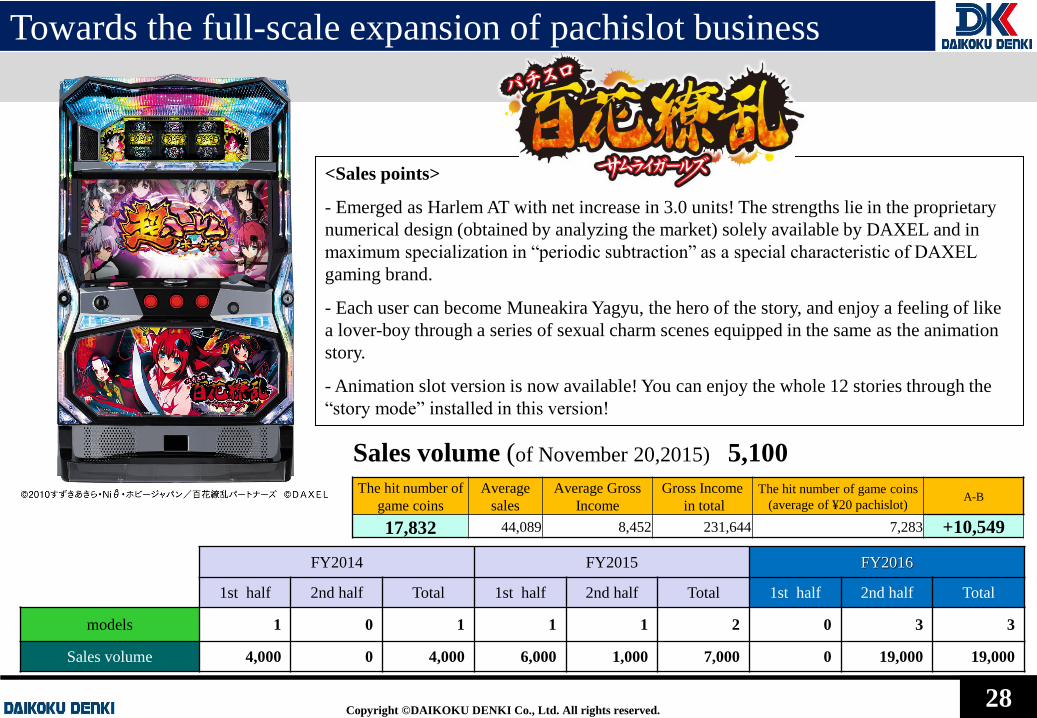
<Sales points>
- Emerged as Harlem AT with net increase in 3.0 units! The strengths lie in the proprietary
numerical design (obtained by analyzing the market) solely available by DAXEL and in
maximum specialization in “periodic subtraction” as a special characteristic of DAXEL
gaming brand.
- Each user can become Muneakira Yagyu, the hero of the story, and enjoy a feeling of like
a lover-boy through a series of sexual charm scenes equipped in the same as the animation
story.
- Animation slot version is now available! You can enjoy the whole 12 stories through the
“story mode” installed in this version!
Sales volume (of November 20,2015) 5,100
The hit number of
game coins
Average
sales
Average Gross
Income
Gross Income
in total
The hit number of game coins
(average of ¥20 pachislot) A-B
17,832 44,089 8,452 231,644 7,283 +10,549
Towards the full-scale expansion of pachislot business
FY2014 FY2015 FY2016
1st half 2nd half Total 1st half 2nd half Total 1st half 2nd half Total
models 1 0 1 1 1 2 0 3 3
Sales volume 4,000 0 4,000 6,000 1,000 7,000 0 19,000 19,000
Page 30
Copyright ©DAIKOKU DENKI Co., Ltd. All rights reserved. 29
Returning earnings to
shareholders
Page 31
Copyright ©DAIKOKU DENKI Co., Ltd. All rights reserved. 30
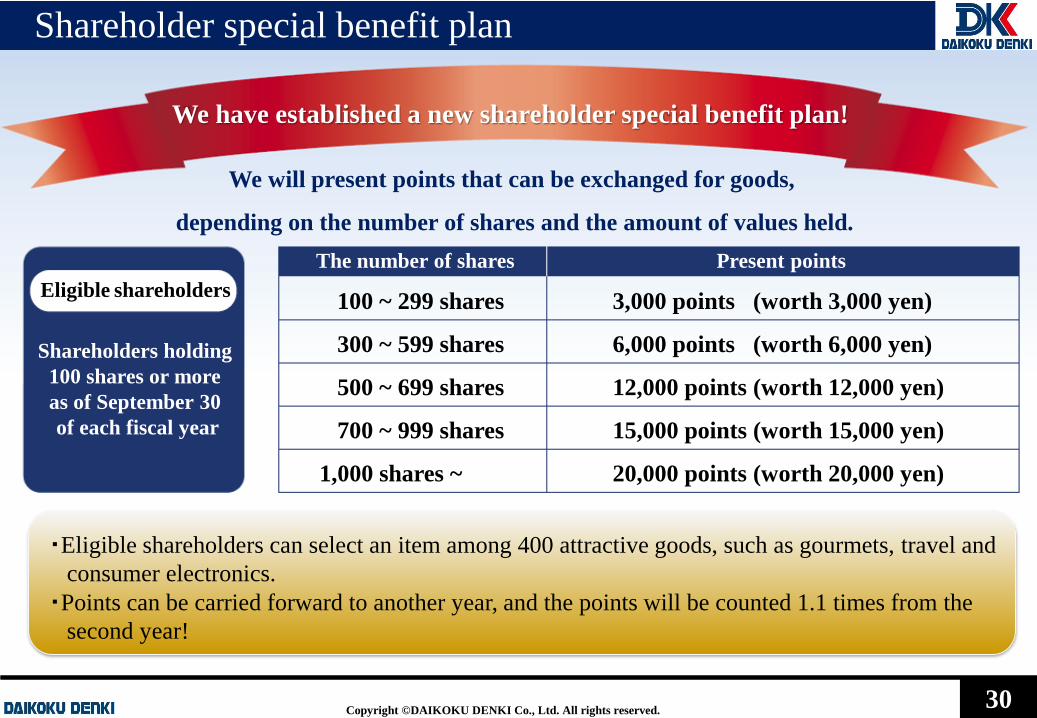
Shareholder special benefit plan
We have established a new shareholder special benefit plan!
We will present points that can be exchanged for goods,
depending on the number of shares and the amount of values held.
Eligible shareholders
Shareholders holding
100 shares or more
as of September 30
of each fiscal year
・Eligible shareholders can select an item among 400 attractive goods, such as gourmets, travel and
consumer electronics.
・Points can be carried forward to another year, and the points will be counted 1.1 times from the
second year!
100 ~ 299 shares 3,000 points (worth 3,000 yen)
300 ~ 599 shares 6,000 points (worth 6,000 yen)
500 ~ 699 shares 12,000 points (worth 12,000 yen)
700 ~ 999 shares 15,000 points (worth 15,000 yen)
1,000 shares ~ 20,000 points (worth 20,000 yen)
The number of shares Present points
Page 32
Copyright ©DAIKOKU DENKI Co., Ltd. All rights reserved. 31
Shareholder special benefit plan
※ Points also can be donated to social contribution activities.
Examples of goods for the shareholder special benefit plan that can be selected among
about 400 items
3,000 points 6,000 points
12,000 points 20,000 points
Raw ham of tuna
Fine wine
Broiled eels (kabayaki)
Puffer (fugu) dishes (4 servings)
Special Rice (5kg) Hotel’s ice cream
Matsusaka beef Hotel vouchers
Page 33
Copyright ©DAIKOKU DENKI Co., Ltd. All rights reserved. 32
<Policy> The Company implements "special dividends" according to the revenue based on
"consecutive dividends"
40
90
80
70
50
2012/3期 2013/3期 2014/3期 2015/3期 2016/3期(計画)
期末 中間 期末配当金 中間配当金
The Company pays “Special
dividends"
according to performance.
Stable dividend (¥10 interim dividend and ¥40
year-end dividend).
Consecutive dividends Interim dividend Year-end dividend
Special dividends Interim dividend Year-end dividend
FY2012 FY2013 FY2014 FY2015 FY2016
(Forecast) FY2012 FY2013 FY2014 FY2015 FY2016
(Forecast)
Net Sales 47,096 58,861 56,954 54,043 53,000
Operating Income 3,525 7,023 5,338 1,425 1,000
Net Income 1,663 4,161 3,278 874 550
Dividends ¥40 ¥90 ¥80 ¥70 ¥50
Payout ratio 35.6% 32.0% 36.1% 118.3% 134.4%
Dividends
Page 34
Copyright ©DAIKOKU DENKI Co., Ltd. All rights reserved.
Disclaimer The contents in this material and comments made during the
questions and answers etc. of this briefing session are the
judgment and forecasts of the Company’s management based
on the currently available information.
These contents involve risk and uncertainty, and the actual
results may differ materially from these contents/comments.
■Contact details for inquiries
Daikoku Denki Co., Ltd.
Inquiries: Investor Relations
E-MAIL [email protected]
33