Commonwealth Bank of Australia ACN 123 123 124
Ralph NorrisCHIEF EXECUTIVE OFFICER
David CraigCHIEF FINANCIAL OFFICER
Results PresentationFor the full year ended 30 June 2010
11 August 2010
Determined to be better than we‟ve ever been.
2
Disclaimer
The material that follows is a presentation of general background information
about the Group‟s activities current at the date of the presentation,
11 August 2010. It is information given in summary form and does not
purport to be complete. It is not intended to be relied upon as advice to
investors or potential investors and does not take into account the
investment objectives, financial situation or needs of any particular investor.
These should be considered, with or without professional advice when
deciding if an investment is appropriate.
3
Agenda
Ralph Norris, CEO – Company Update and Outlook
David Craig, CFO – Financial Overview
Questions and Answers
4
Jun 10 Dec 09 Jun 09
CBA BWA Combined CBA + BWA CBA + BWA
Home loans 22.6% 3.6% 26.2% 26.1% 25.2%
Credit cards 2 19.6% 2.9% 22.5% 22.3% 21.6%
Personal lending 13.8% 0.8% 14.6% 15.0% 15.7%
Household deposits 28.3% 3.0% 31.3% 31.3% 32.3%
Retail deposits 23.3% 4.0% 27.3% 26.6% 26.5%
Business lending – APRA 13.6% 5.9% 19.5% 18.8% 19.4%
Business lending – RBA 14.1% 3.5% 17.6% 17.7% 17.4%
Business deposits – APRA 17.0% 5.9% 22.9% 21.7% 20.7%
Equities trading – Total 6.3% n/a 6.3% 6.7% 6.2%
Australian retail funds – administrator view 14.6% 0.1% 14.7% 14.7% 14.4%
FirstChoice platform 10.7% n/a 10.7% 10.5% 10.2%
Australia life insurance (total risk) 13.0% 0.8% 13.8% 13.8% 15.7%
Australia life insurance (individual risk) 13.4% 1.2% 14.6% 14.6% 14.7%
NZ Lending for housing 23.0% n/a 23.0% 23.3% 23.3%
NZ Retail deposits 21.6% n/a 21.6% 21.4% 21.2%
NZ Lending to business 9.3% n/a 9.3% 9.2% 8.8%
NZ Retail FUM 17.4% n/a 17.4% 18.0% 18.8%
NZ Annual inforce premiums 31.0% n/a 31.0% 31.3% 31.7%
Market shares
1 Includes St Andrew‟s
2 As at May 2010
3 As at March 2010
1 1
3
3
3
3
5
Overview
Another good financial result
Disciplined strategy execution continuing to deliver
Challenging operating environment – signs of momentum slowing
Global uncertainty continuing – conservative settings retained
Well placed for medium term
6
Snapshot – FY10 Results
Cash earnings ($m) 6,101 +42%
ROE (Cash) 18.7% +370bpts
Cash EPS (cents) 396 +34%
DPS (cents) 290 +27%
Cost-to-Income 45.7% (70bpts)
NIM 2.13% +5bpts
RBS ($m) 4,258 +15%
IB&M ($m) 1,775 +3%
BPB ($m) 1,582 +19%
Bankwest ($m) 840 +81%
Wealth Management ($m) 802 +12%
NZ ($m) 586 (24%)
Total Assets ($bn) 646 +4%
Total Liabilities ($bn) 611 +4%
FUM ($bn) 144 +4%
RWAs ($bn) 291 +1%
Provisions to Credit RWAs 2.12% +20bpts
Tier 1 Capital 9.2% +110bpts
Tier 1 – UK FSA 12.8% +180bpts
WAM – Portfolio (yrs) 3.8 +0.2yrs
WAM – New Issuance (yrs) 5.0 +1.5yrs
Liquid Assets ($bn) 89 +6%
* All movements on prior comparable period.
Financial
Strong balance sheet Capital & Funding
Operating Performance by Division
*
7
Jun 10 vs Jun 09
Cash NPAT ($m) 6,101 42%
Statutory NPAT ($m) 5,664 20%
ROE 18.7% 370bpts
Cash EPS (cents) 396 34%
Dividend per Share (cents) 290 27%
Another good financial result
9
Delivering for Shareholders
2006 2007 2008 2009 2010
63%84%63%
61%
74%
87%88%
Payout Ratio
59%
Interim
Final
84%
cents
per share 94 107 113 113 120130 149 153 115
84%
290
170
10
Strategy continues to deliver
1, 2, 3, 4 - Refer note slide at back of presentation for source information
FirstChoice Satisfaction3
Business Customer Satisfaction2
Ranking
2010 1st
2009 1st
2008 1st
2007 2nd
2006 2nd
Jun 10 vs Jun 09
(6 month rolling average)
0.9%
-1.1%
-3.6%
-0.5%
CBA Peer 1 Peer 2 Peer 3
CBA Peers
Gap to top-rated major banking group peer
Retail MFI Customer Satisfaction 1
60%
65%
70%
75%
80%
85%
Jun 06 Jun 07 Jun 08 Jun 09 Jun 10
3.0%
12.5%
% S
atisfie
d (
„ve
ry s
atisfie
d‟ o
r „fa
irly
sa
tisfie
d‟)
Products per customer 4
CBA Peers
2.56
Ave
rag
e n
um
be
r o
f p
rod
ucts
at th
e F
ina
ncia
l In
stitu
tio
n
4 major banking groupsCBA Peers
Ave
rag
e n
um
be
r o
f p
rod
ucts
at th
e F
ina
ncia
l In
stitu
tio
n
Jun 06 Jun 07 Jun 08 Jun 09 Jun 10
2.17
4 major banking groups
11
Transformational change - scorecard
Customer Satisfaction
Retail 64.9% 75.6%
Business - TNS 56.5% 67.9%
Business - DBM n/a Ranked 1st
FirstChoice Ranked 2nd Ranked 1st
Share of Ombudsman Complaints 29.8% 15.1%
Market Shares
Home Lending 18.7% 26.2%
Business Lending 12.1% 19.5%
Household Deposits 29.3% 31.3%
Business Deposits 11.9% 22.9%
Products per Customer 2.17 2.56
System Reliability – Sev. 1 incidents pa 66 14
Processing times – New Home Loans 14 days 6 days
Employee Engagement – Percentile 69th 76th
Total Shareholder Return – Ranking
1
6
1, 2, 3, 4, 5 – Refer note slide at back of this presentation for source information6 Source RBA/APRA. June 2006 market shares do not include Bankwest7 Time period relates to that component of the home loan process that is under the direct control of the
Group‟s mortgage processing area. Comparative period relates to Oct 07. 8 Major banks
2
3
4
7
June 2006
8 Number 1 (2, 3, 4, 5 yrs)
June 2010
Progress
5
12
Products per Customer
Source: Roy Morgan Research
Refer note slide at back of this presentation for source information
6 months to June 2010
1.341.15 1.19
1.041.20
0.510.67 0.59 0.58 0.57
0.20 0.260.21 0.24 0.34
0.33 0.280.25
0.23 0.11
Insurance
Personal Lending
Home loan
Credit Cards
Managed funds
Superannuation
Deposit and Transaction accounts
2.56 2.542.44
2.352.27
Average Product Composition between Commonwealth Bank,
the 4 Major Banking Groups and Bankwest
Peer 3 Peer 1 BankwestCBA Peer 2
13
Customer satisfaction creating value
2.172.14 2.13
2.102.08
2.102.13
2.16
2.222.24
2.29
2.402.42 2.42
2.48
2.542.56
Ju
n 0
6
Se
p 0
6
De
c 0
6
Ma
r 0
7
Ju
n 0
7
Se
p 0
7
De
c 0
7
Ma
r 0
8
Ju
n 0
8
Se
p 0
8
De
c 0
8
Ma
r 0
9
Ju
n 0
9
Se
p 0
9
De
c 0
9
Ma
r 1
0
Ju
n 1
0*
New strategic
agenda launched
– targeting No.1 in
customer
satisfaction
CommSee
rolled out
across branch
network
Over 1,000
customer facing
staff added
over 4yrs
64.9%
75.6%Retail branch
transformation
programme
Entire rated
deposits suite
awarded
Cannex 5 Stars“60 Minute”
home loans
launched
Products per customer Retail customer satisfaction
2.17
2.56
Source: Roy Morgan Research. Refer note slide at back of this presentation for source information
* Methodology change in October 2008 by Roy Morgan Research regarding capturing of Deposit &
Transaction accounts across the industry
14
$m
0.7x
0.8x
1.1x
1.7x
1.7x
1.7x
1.7x
1.9x
2.1x
2.5x
2.6x
CBA / Bankwest - Original
CBA / Bankwest - Revised
Colonial / Trust Bank
CBA / Colonial
Westpac / Bank of Melbourne
Suncorp / Metway
Westpac / St George
HBOS / Bankwest
St George / Advance
Bank of Queensland / Bendigo
Bendigo / Adelaide
1 Remaining 43% interest by HBOS
2 Original valuation adjusted for additional provisioning recognised at 30 June 2010 relating to the legacy
portfolio review
Source: Company announcements, ASX announcements, Factset, IRESS
1
(Acquiror / Target)
Bankwest
Comparable price-to-book values
Number of retail customers
(Bankwest)
Retail customer growth
1,372
1,720
Jun 09 Jun 10
Operating Income
+25%
905,000 919,000
960,000989,000
1,036,000
Sep 08 Dec 08 Jun 09 Dec 09 Jun 10
2
15
Bankwest
A good business performing strongly:
► 100,000 extra customers since acquisition
► Income 25%; Costs 3%
Legacy book review:
► Comprehensive and in-depth
► Smaller, performing loans
► A legacy issue – predominantly East Coast
► Unrealistic security valuations
► $212m after-tax charged against acquisition profit
► Risk management practices significantly strengthened
16
2010 Awards
Bank of the Year 2010
Money Minder of the Year (RBS)
Margin Lender of the Year (CommSec)
Australian Financial Institution of the Year (Retail Bank)
Financial Services Executive of the Year (Ralph Norris)
Best Career Development Program
Chief Information Officer of the Year (Michael Harte)
Strongest Bank in Australia
Best Retail Bank in Australia
Best Retail Bank in Asia Pacific
Best Brand Building Initiative (RADAR)
Best Leadership in Banking in Australia
Achievement Award, Cash Management in Australia
Business Achievement Award, Risk Management
World‟s Best Banks in Developed Markets:
Best Bank in Australia
Australia‟s Best Foreign Exchange Provider
Best Web Site Design (NetBank)
Best in Class, Banking (Projects.CBA Intranet)
Outstanding Achievement Award, Investor Relations
(Shareholder Centre)
eCommerce (eVolve iShop)
Banking (NetBank)
B2B (IB&M microsite)
Hybrid Deal of the Year (PERLS V)
Best Domestic Bank in Australia
Best Managed Company, Large Cap
Best Bank in Australia 2010
Best Private Bank for Super Affluent Clients
Best Private Bank for High Net Worth 1 Clients
Best Private Bank for Family Office Services
Service Level Survey Awards 2010
Fund Manager Service Level Award
(FirstChoice platform)
Outstanding Private Banking Institution of the
Year
Official Honoree, Banking/Bill Paying (NetBank)
Official Honoree, Mobile Marketplace (NetBank
Mobile Banking)
Reconciliation Awards for Business 2010
Established Business Award (Indigenous Banking
Team)
CANSTAR CANNEX 2010
Five star rating, online share trading, CommSec
Five star rating, all deposit and transaction
accounts
Innovation Excellence Award (Travel Money Card)
17
Employing 45,000 people
Serving 11 million Australian customers
$100 billion in new lending
Paid $2.9 billion in taxes
74% of profit returned to shareholders
AA Credit Rating
► Ensures Australia‟s stability
► Keeps interest rates lower
► Delivers funds for our customers
Supporting Australia
54%
18%
28%780,000
Retail
InvestorsOverseas
Funds
Australian
Funds
Where does our net income go?
Expenses
Taxes
Shareholder
dividends
Salaries for
45,000 staff
Retained to
grow lending
4.0
4.5
4.6
1.6
2.9
2.1
Impairment$bn
18
Key Earnings Drivers - FY11
Driver FY11 Outlook
System
Credit Growth*
► Total Credit (%): 7½-9½
► Housing Credit (%): 8-10
► Business Credit (%): 7-9
Margins► Continued downward pressure from higher funding costs
► Many variables – specific outlook hard to predict
Other Banking Income► Trading Income normalised
► Likely subdued overall growth
Funds Management
Income
► Leverage to equity market recovery
► Normalisation in Investment Experience
Costs► Continued cost discipline + investing in the business
► Inflationary pressures
Impairment Expense ► Expected to continue to trend lower
* CBA Economists forecasts
19
Outlook
Despite improvement, global outlook remains uncertain
Domestic economy relatively well-placed
Regulatory reform outcomes likely to be manageable
Given uncertainty, remain cautious on near-term outlook
However, medium to longer term outlook very good
Commonwealth Bank of Australia ACN 123 123 124
David CraigCHIEF FINANCIAL OFFICER
Results PresentationFor the full year ended 30 June 2010
11 August 2010
Determined to be better than we‟ve ever been.
23
Strong profit growth
Jun 10
$m
Jun 09
Pro forma
$m
Jun 10 vs
Jun 09
Operating income 18,823 17,729 6%
Operating expenses (8,601) (8,222) 5%
Operating performance 10,222 9,507 8%
Investment experience 236 (263) Large
Impairment expense (2,075) (3,392) (39%)
Tax and minorities (2,282) (1,544) 48%
Cash NPAT 6,101 4,308 42%
24
Other key information
Reported and Pro forma comparatives
For added transparency and comparability, financial results for
the prior year to June 2009 have been prepared on a pro forma
basis, assuming the Bankwest and St Andrews acquisition was
completed on 1 July 2008
NZ tax expense
Tax on NZ structured finance transactions
Hedging and AIFRS volatility
Unrealised accounting gains and losses arising from the
application of “AASB 139 Financial Instruments:
Recognition and Measurement”
Non-cash items
Bankwest non-cash items
(after tax)
Jun 10
$m
Jun 09
$m
Gain on acquisition 612
Bankwest impairment charge (212) -
Amortisation of fair value
acquisition adjustment25 80
Integration expenses (29) (78)
Total (216) 614
1 Additional impairment expense relating to pre-acquisition collective provision on the business book,
charged below Cash NPAT. This is consistent with the treatment of the gain on acquisition of Bankwest.
2 DB Expense included in Cash NPAT from 1 July 2009.
Jun 10
$m
Jun 09
$m
Treasury shares adjustment (44) (28)
Sale of Fiji/other (23) -
DB Expense / Other - (33)
Bankwest cash NPAT prior to acquisition - 107
(67) 46
Other
1
2
25
Statutory profit
Jun 10
$m
Jun 09
$m
Cash NPAT 6,101 4,308
Bankwest non-cash items (216) 614
NZ tax expense (171) -
Hedging and AIFRS volatility 17 (245)
Other non-cash items (67) 46
Statutory NPAT 5,664 4,723
42%
20%
26
$m
Operating
Performance
Impairment
Expense
Investment
Experience
Tax &
Minorities
Cash
NPAT
Jun 10
Cash
NPAT
Jun 09
FY10 Mvt
Cash
NPAT
FY10 Mvt
Operating
Performance
RBS 4,258 (736) - (1,061) 2,461 2,107 17% 15%
IB&M 1,775 (249) - (344) 1,182 166 Large 3%
BPB 1,582 (326) - (363) 893 736 21% 19%
Bankwest 840 (754) - (26) 60 3 Large 81%
WM 802 - 183 (267) 718 289 Large 12%
NZ 586 (100) 1 (99) 388 438 (11%) (24%)
Other 379 90 52 (122) 399 569 (30%) (53%)
Total 10,222 (2,075) 236 (2,282) 6,101 4,308 42% 8%
Business unit profitability
1 Jun 09 pro forma
2 Includes Centre functions, Group Treasury
1
1
2
27
Strong operating performance
4,258
1,775 1,582
840 802 586
RBS IB&M BPB Bankwest WM NZ
+15%
+3% +19%
+12%+81%(24%)
* FY10 Operating revenue less operating expense. All movements on prior comparable period.
Jun 09 pro forma
Strong volume growth
Banking Income 9%
Costs flat
Income 7%
Margins improved
NPAT $1.0bn
Double digit growth all businesses
Income 11%
Costs 3%
Income 25%
Costs 3%
Cost : Income now 51%
FUA 6%
Income 5%
Costs 1%
NZ Recession
Break fees $100m
Trading income down
*
28
Australia’s leading bank for deposits
Total Deposits
Household Deposits Other Deposits
Source : APRA. Includes Bankwest
14464 62
109
175
127 145
168
CBA Peer 1 Peer 2 Peer 3
$bn319
191 207
277
Jun 10 Jun 09$bn
Netbank Saver Investment accounts Savings deposits
Business Online Saver Transaction accounts
RBS Deposit Mix
3262
$bn
26
71
28
319
Number of Transaction Accounts
20
6232
3 19
5.6m
5.7m
5.9m
Jun 09 Dec 09 Jun 10
Balance Growth
Source: APRA. Six months to Jun-10 annualised
9.9%
2.4% 2.8% 3.1%6.0%
CBA Peer 1 Peer 2 Peer 3
System
Combined Households and
Business Deposits
Average balances
29
Strong six-month volume growth
Growth rates inclusive of Bankwest balances. All figures are six month balance movements annualised.
Figures adjusted for restatements where appropriate.
Source : APRA / RBA, except for Funds Under Administration – Source: Plan for Life – six months to Mar-10 annualised.
9.3
5.9
3.3
17.9
6.68.3
5.7
-3.7
6.55.2
CBA System
Home
Lending
Household
Deposits
Business
Lending
Business
DepositsFunds Under
Administration
SME Lending +7%
% % % % %
30
Other Banking Income
Jun 10
$m
Dec 09
$m
Jun 09
$m
Jun 10 vs
Dec 09
Jun 10 vs
Jun 09
Commissions 972 1,034 1,050 (6%) (7%)
Lending Fees 716 719 779 - (8%)
Trading Income 306 291 293 5% 4%
Other 176 157 146 12% 21%
Sub-total 2,170 2,201 2,268 (1%) (4%)
AIFRS reclassification
of net swap costs(136) (123) (128) 11% 6%
Total 2,034 2,078 2,140 (2%) (5%)
6 months
31
Good volumes driving income growth
17,72918,823919 233 (219) 72 89
1,6051,468
1,2861,410 1,433
2H08 1H09 2H09 1H10 2H10
Funds & Insurance Income
Total Operating Income 6%
$m
$m
346
442
293 291 306
2H08 1H09 2H09 1H10 2H10
Trading Income
$m
Jun 09 Jun 10Net Interest
Income -
Volume
Net Interest
Income -
Margin
Fee
changes
Funds &
Insurance
Income
Other
OBI
33
3 813 14 17
37
83
127
151
174
1 year 2 year 3 year 4 year 5 year
Funding costs continue to increase
Jun 07
bpts
Jun 10
50
100
200
150
Indicative Long Term Wholesale Funding costs
Jun 07 Dec 07 Jun 08 Dec 08 Jun 09 Dec 09 Jun 10
Deposit
Funding
Wholesale
Funding*
Increased
funding
cost
+1.22%
+1.46%
x 58%
+0.89%
x 42%
* Long term and short term. Includes basis riskWeighted average cost for each tenor in domestic and offshore
wholesale markets
34
Group NIM – 12 months
208205
213
9
5
4
(10)
(2)
(1)
FY 09 Deposits Assets Mix Sub total Replicating Portfolio
Treasury Other FY 10
bpts
35
219
205
198
216218
208
Jun 06 Jun 07 Jun 08 Jun 09 Dec 09 Jun 10
Funding costs higher in 2H10
NIM decline as GFC
drives term funding
costs higher
NIM recovery as pricing
adjusted for higher
funding costs and
increased risk
NIM under
pressure from
higher funding
costs
Group NIM (Six Monthly)
bpts
37
RBS NIM particularly impacted
226233
219
(8)17
(2)
(24)
10
2H09 Funding Pricing Mix/Other 1H10 Funding Pricing 2H10
251
2H07
bpts
39
Higher funding costs impacted 2nd
Half
Operating Income
1H10 2H103 less
days
Fee
changes
Margin
impact
Volume
impact
Other
-3%$m
9,550
9,273
(98)
(47)(280)
135 13-3%
40
12 months
to Jun 10
$m
Growth Projects 595
Core banking modernisation
Awards Optimisation
Productivity Projects 275
Darling Park 1
Collections transformation
Regulatory and Risk Projects 166
1,036
Investment Spend
41
Tight cost control : continued investment
4,214 4,268 4,333
64 (10) 59 6
Defined
Benefits
Fund
Other IT
Expense
Other
$m
Jun 09 Dec 09 Jun 10
+1% +1½%
Operating Expenses
258405
697 626
527
615
378410
FY07 FY08 FY09 FY10
Capitalised Expensed
Investment Spend$m
785
1,0201,075
1,036
42
20 2636
96
72
9
Jun 07 Dec 07 Jun 08 Dec 08 Jun 09 Dec 09 Jun 10
177
15 1932
85
61 55
28
12
Jun 07 Dec 07 Jun 08 Dec 08 Jun 09 Dec 09 Jun 10 Stat
40
2416 20 23
4132
27
Jun 07 Dec 07 Jun 08 Dec 08 Jun 09 Dec 09 Jun 10
Margin Lending
Impairment Expense to Gross Loans
CBA Group 1
1 Includes ASB and Bankwest. December 08 includes Bankwest on a pro forma basis.
2 Represents Retail Banking Services
3 Represents Institutional Banking and Markets and Business and Private Banking
bpts
CBA Corporate (ex Bankwest)
bpts
Consumer (ex Bankwest)2
bpts
3
15 30 44
282
68
248
339
251
Jun 07 Dec 07 Jun 08 Dec 08 Jun 09 Dec 09 Jun 10 -stat
Bankwest Business
bpts
pro forma
590
Additional impairment expense relating to pre-acquisition business book, charged below Cash NPAT
43
5847
35
17
12
9
7
-7
15
5
13
18
28
Impairment expense trending lower
1,3371,121
881
428
270
207
189
-177
344
113
313
441
692
6 months ($m)6 months annualised (basis points)*
85
1,951
OverlayBase
61
Bankwest
1,4411,383
55
* Basis points as a percentage of average Gross Loans and Acceptances
Dec 08
pro forma
Jun 09 Jun 10
cash earnings
Dec 09 Dec 08
pro forma
Jun 09 Jun 10
cash earnings
Dec 09
251
44
Margin LendingTotal provisions to GLAs
Individual provisions ($m) Total provisions to Credit RWA
Individual provisions to impaired assets
1.10% 1.06%1.31% 1.20%
3.01%2.88% 2.87%
2.33%
Peer 3 Mar 10 CBA Jun 10 Peer 1 Mar 10 Peer 2 Mar 10
Total provisions to GLAs Total provisions to GLAs ex Housing
Peer 3
Mar 10
CBA
Jun 10
Peer 2
Mar 10
Peer 1
Mar 10
* Impairment provisions to impaired assets
CBA
Jun 10
Peer 1
Mar 10
Peer 3
Mar 10
Peer 2
Mar 10
2.10%
1.73%
Strong provisioning coverage
* Gross Loans and Acceptances
2.14% 2.12%
*
43.1%*38.2%
29.3% 27.2%
8571,066 927 920
3943 162 116238
620 733 9561,134
Commercial
Consumer
Bankwest
1,729
Dec 08 Jun 09 Dec 09
1,8221,992
Jun 10
45
0.7%
1.7%
2.7%
3.7%
Sep 07 Jun 08 Dec 08 Jun 09 Dec 09 Jun 10
Overlay
709 775 776 681
568667 795 830
115
463530 7581,082
1,3201,351 1,192
Collective provisions ($m)
2,474
Bankwest
Granularity
Economic
Model and data
Commercial
Consumer
Bankwest
3,225
Dec 08 Jun 09
Strong Balance Sheet Provisioning
3,452
Dec 09
3,461
Jun 10
30 days +
CBA Home Loans*
Bankwest Home Loans
Consumer arrears
Total and New impaired assets
58
86 96
30
51 49 46
Dec 08 Jun 09 Dec 09 Jun 10
bpts
35 40
CBA
16
28
5842
Bankwest New
$2,714m $4,210m
CBA Includes ASB
61
$4,823m
62
$5,216m
1 102
1 As a percentage of Gross Loans and Acceptances
CBA Credit Cards
CBA Personal Loans
* includes customer assist
47
Funding – a long term issue for Australia
Systemic Issues
Credit growth > deposit growth
Funding task > domestic capacity
Global funding increasingly expensive
Regulatory change likely manageable
Assets retained on bank balance sheets
Australia to continue to attract investment:
► AAA rated fast growing economy
► Australian banks well-regarded
CBA Position
Like peers, step-change in funding costs
Access to debt markets remains strong
CBA well regarded and stable AA rating
Prudent management:
► Diversification
► Extending term maturity
► Pre-funding
Working with ABA, Treasury and regulators
to address systemic issues
49
560
593
26 (25) 28
4
Asset growth largely deposit funded
Funded
assets
FY09
Funded
assets
FY10
Wholesale Funding
+$3bn
Deposits Equity
3 8 13 14 17
37
83
127
151174
June 2007
June 2010
1yr 2yr 3yr 4yr 5yr
Funded assets includes securitisation, bank acceptances of customers and accounting gross-ups
Short term Long term
$bn
50
Other key information
16 20
22 1628
11
35 40
Jun 07 Jun 09 Jun 10
Internal RMBS
Other
Bank, NCD, Bills, RMBS
Cash, CGS, Semi, Supra
8489$bn
3126
19 20 18 19
FY11 FY12 FY13 FY14 FY15 FY16+
Long Term Wholesale Debt
$bn
Liquid Assets
Term maturity profile*
* Maturity profile includes all long term wholesale debt. Weighted Average Maturities of 3.8 years includes all deals with first call or maturity of 12 months or greater.
Weighted Average Maturity 3.8yrs
13
Regulatory
Minimum $34bn
51
Strong funding and capital positions
3.54.4
5.0
3.6 3.7 3.8
New Issuance Portfolio
Years
Funding tenor1 Tier 1 capital movement
Customer Deposit Funding
235
297324
55% 56%58%
Jun 08 Jun 09 Jun 10
Customer Deposits % of funding
$bn
1 Weighted Average Maturity. Includes all deals with first call date or contractual maturity of 12 months or greater
2 Percentage of funding excluding equity; no netting of excess liquid assets
2
8.07%9.10% 9.15%
12.82%
Customer Deposit FundingTier 1 Capital Ratio 9.2%
Jun 09 Dec 09 Jun 10 Jun 10
CBA
(UK FSA)
Jun 09 Dec 09 Jun 10
9.10% 9.15%42 (37)
Dec 09 Jun 10Organic
growth
Sub total On-market
share purchase
(DRP)
All movements in basis points
9.52%
52
Snapshot – FY10 Results
Cash earnings ($m) 6,101 +42%
ROE (Cash) 18.7% +370bpts
Cash EPS (cents) 396 +34%
DPS (cents) 290 +27%
Cost-to-Income 45.7% (70bpts)
NIM 2.13% +5bpts
RBS ($m) 2,461 17%
IB&M ($m) 1,182 612%
BPB ($m) 893 21%
Bankwest ($m) 60 1900%
Wealth Management ($m) 718 148%
NZ ($m) 388 (11)%
Total Assets ($bn) 646 +4%
Total Liabilities ($bn) 611 +4%
FUM ($bn) 144 +4%
RWAs ($bn) 291 +1%
Provisions to Credit RWAs 2.12% +20bpts
Tier 1 Capital 9.2% +110bpts
Tier 1 – UK FSA 12.8% +180bpts
WAM – Portfolio (yrs) 3.8 +0.2yrs
WAM – New Issuance (yrs) 5.0 +1.5yrs
Liquid Assets ($bn) 89 +6%
* All movements on prior comparable period
Financial
Strong balance sheet Capital & Funding
Cash NPAT by division
*
53
Summary
Another good financial resultCash NPAT 42%
ROE 18.7%
Strong volume growth CBA > System
Higher funding costs 2nd Half NIM 10 bpts
Tight cost control and continuing investment ($1bn)
Conservative settingsTier 1 Ratio 9.2%
$14bn pre-funded
Clear, focussed strategy Delivering results
Commonwealth Bank of Australia ACN 123 123 124
Supplementary MaterialsFor the full year ended 30 June 2010
11 August 2010
Determined to be better than we‟ve ever been.
56
Index
Overview and Strategy 56
Business Performance 70
Risk Management 89
Capital, Funding and Liquidity 101
Economic Overview 113
57
CBA Overview
Largest Australian Bank by market cap. and 2nd largest listed company
AA Credit Rating
Tier 1 Capital Ratio of 9.2%; or 12.8% on UK FSA basis
Total Assets of $646bn
13 million customers; large distribution footprint
#1 in household deposits – over 31% share
#1 in home lending – over 26% share
#1 Retail Funds Manager - ~14% share
58
A clear, focussed strategy
Australia’s finest
financial services
organisation
Customer
Satisfaction
Business
Banking
Trust and
Team Spirit
Technology and
Operational
Excellence
Profitable
Growth
59
Disciplined strategy execution delivering results
Over 1,000 new front
line service
staff added
Outstanding Private
Banking Institution of
the Year
Core Banking –
targeting quantum
improvements in
service and efficiency
Engagement now top
25% world-wide*Bankwest acquisition
CommSee provides
single view of
customer at the
frontline
CommSec maintaining
strong market share
position with 50.6% of
the online non advisory
Market
Market leading online
banking presence –
NetBank, CommSec,
CommBiz, FirstChoice
Significant
improvement in
Group-wide safety
scores
Targeted growth
in Asia
Retail Deposits Suite
awarded Canstar
CANNEX 5-Star rating
Established business
banking presence in
23 new branches
“60 minute Home
Loan” – 59% of loans
conditionally approved
and printed in branch
Internal Customer
Service scores
trending higher
CFS GAM diversified
earnings and
expansion
Retail Bank branch
transformation
programme: >300
sites refurbished /
upgraded
Formed Specialised
Agribusiness Solutions
Team
System reliability
significantly enhanced
Very low turnover rate
relative to industry
Significant
improvement in
products-per-customer
and referral conversion
rates
Customer
Satisfaction
Business
Banking
Technology and
Operational
Excellence
Trust and
Team Spirit
Profitable
Growth
* Source: Gallup
60
Business Customer Satisfaction
% of business
customers who
are satisfied
% point change in each bank’s business customers
who are satisfied compared to:
June 2010 1 month ago
(May 10)
3 months ago
(Mar 10)
6 months ago
(Dec 09)
12 months ago
(Jun 09)
CBA 70.8 2.0 4.9 5.8 0.9
ANZ 74.1 -0.2 0.1 1.8 -1.1
NAB 65.6 -0.8 -3.2 -0.3 -3.6
Westpac 72.3 0.8 1.7 2.6 -0.5
St George 73.3 -1.1 1.1 -1.6 6.4
Source: TNS. Refer Notes page at end of this presentation for further details.
All figures based on 6 month rolling average
61
Institutional Banking
Understanding Customers’ BusinessLoyalty to Relationship
More
Satisfied
Less
Satisfied
Lower the Score the Higher the Satisfaction
Source : East & Partners' Institutional Banking Markets Report April 2010
Lower the Score the Higher the Satisfaction
More
Satisfied
Less
Satisfied
62
Core Banking Modernisation
Quantum improvements in customer
service and efficiency
On track and delivering
Early phases encouraging
All customer information migrated
All Term Deposits migrated
(1 million+ accounts)
Timetable
Term Deposits Completed
All Retail Deposits end-2010
Lending Products mid-2012
Next Phase
- ASB, BWA etc 2012-13
Benefits
Real time banking
Customised product offers
Standardised processing
Faster speed-to-market
Broader growth opportunities
63
Market leading online banking presence:
► CommSec, NetBank, FirstChoice,
CommBiz, CommSee
Significant improvement in system reliability
Back-office processing efficiencies
Core Banking Modernisation:
► On track
► Term deposit customers migrated to
new platform
► Savings and transaction customers
migrating late 2010
► Customers now starting to experience
real time banking
Technology and Operational Excellence
NetBank
Average Monthly Logons
18.5m22.9m
29.3m35.6m
FY07 FY08 FY09 FY10
FY07 FY08 FY09 FY10
Total Incidents Repeat Incidents
6
Severity 1 Incidents
Zero Zero Zero
4842
2714
FY07 FY08 FY09 FY10
Online, real time secure business and corporate banking...
a more responsive and simplified approach to credit
Market leading online retail broking platform
Increased resilience
Portfolio view across broking, margin lending
and retail deposits
Frontline customer interface
Single view of customer
Integration with Core
Banking underway
New First Rate Saver attracts $1.3bn - extending to include
term deposits
Finest Online has delivered an independently reviewed,
market leading customer experience, winning awards
for best of breed useability and capability
CommSec
CommSee
CommBiz
Netbank
FirstChoice
65
Market Shares and Balance Growth
Home lending
Market Shares
22.9%
16.2%
22.5%20.7%
CBA / Bankwest
Peer 1 Peer 2 Peer 3
19.5%17.3%
19.2%
15.4%
CBA / Bankwest
Peer 1 Peer 2 Peer 3
Business lending Household deposits Business deposits
Home lending Business lending Business deposits
Balance Growth*
Market
3.3%
-4.6%
-2.0%
-4.4%CBA /
Bankwest
Peer 1 Peer 2 Peer 3 CBA /
Bankwest
Peer 1 Peer 2 Peer 3
* Six months to Jun 10 annualised
17.9%
-3.0%
0.8%
-0.5%
26.2%
12.9% 13.1%
24.5%
CBA / Bankwest
Peer 1 Peer 2 Peer 3
31.3%
14.0% 13.4%
23.6%
CBA / Bankwest
Peer 1 Peer 2 Peer 3
9.3%
13.7%
6.6%
10.9%
CBA / Bankwest
Peer 1 Peer 2 Peer 3
Household deposits
5.9%7.3%
5.3% 5.5%
CBA / Bankwest
Peer 1 Peer 2 Peer 3
66
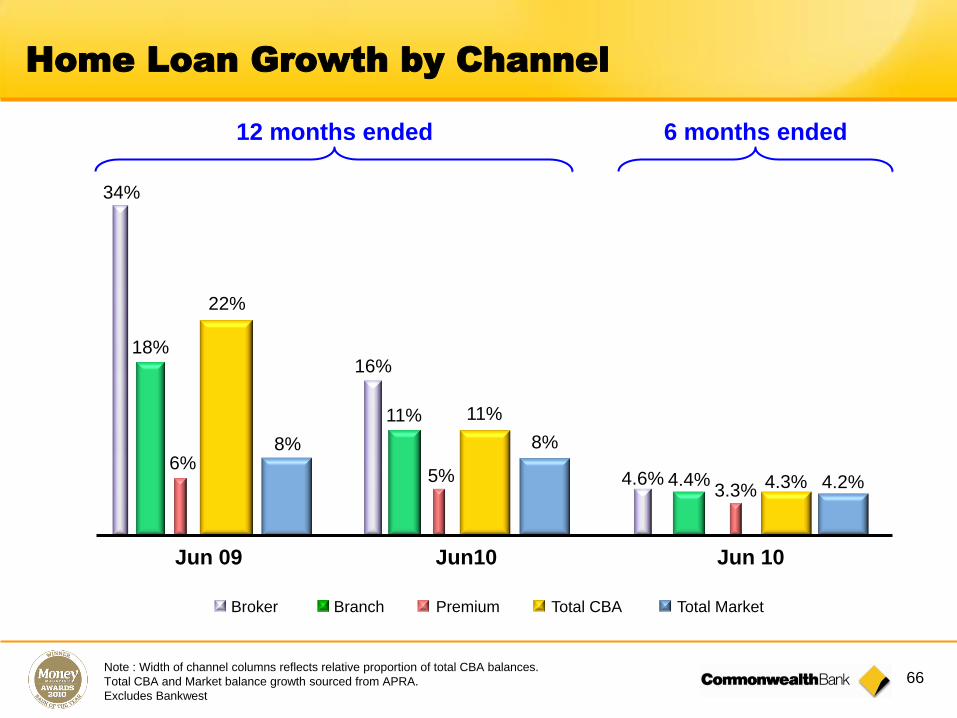
Home Loan Growth by Channel
12 months ended
Jun10Jun 09
34%
16%
11%
5%
11%
8%
18%
6%
22%
Broker Branch Premium Total CBA Total Market
8%
Note : Width of channel columns reflects relative proportion of total CBA balances.
Total CBA and Market balance growth sourced from APRA.
Excludes Bankwest
Jun 10
4.6% 4.3%3.3% 4.2%4.4%
6 months ended
67
One of the Group‟s 5 key strategic priorities
Significant investment and development:
► 23 new Business Banking Centres
► 154 local business bankers in branches
► 24/7 access to business bankers
► Significant online and systems enhancements (eg CommBiz)
Supporting our customers:
► SME loan balances 7%*
► Lowest interest rate on residentially secured business loans of the major banks
► Business Health Check, Small Business Package, Small Business Forums
Customer Satisfaction:
► Fastest rate of growth of the major banks (TNS)
► Number 1 in all business banking segments (DBM)
Strong position in Small Business
* Six months to Jun 10 annualised
68
Sustainability scorecard
Metric 2010 2009 2008 2007
Customers
Customer satisfaction Roy Morgan Research MFI retail customer
satisfaction % & rank (6-month to June rolling avg)
75.63rd
73.04th
70.1equal 4th
70.55th
Customer satisfaction TNS Business Finance Monitor customer
satisfaction % & rank (12-month rolling average)
67.94th
72.84th
73.95th
60.75th
Customer satisfaction Wealth Insights Platform Survey % & rank 86.51st
84.11st
88.21st
89.42nd
People
Safety Lost Time Injury Frequency Rate (LTIFR) 2.5 2.4 3.1 3.7
Staff satisfaction Gallup Survey GrandMean percentile4.32 76th
4.3780th
4.2878th
4.1369th
Absenteeism Average days per FTE 5.9 5.9 6.5 6.2
Employee Turnover Voluntary % 12.73 11.37 18.45 14.94
Environmental
Carbon emissions Property and fleet emissions (tonnes CO2-e) 1 176,806 172,752 173,397 163,964
Complete definitions for scorecard metrics are available at www.commbank.com.au/sustainability
1. 2009 figures previously reported have been adjusted by replacing estimated data with actual data following receipt of outstanding electricity invoices. Emissions
increased in 2010 due to improvements made to the Group‟s carbon reporting system that captured emissions from a number of branches not included in previous years.
69
People
Established new Diversity Strategy including a goal to increase representation of women in leadership to 35% by
December 2014.
Significant progress on the Indigenous Employment Strategy, with 130 new Indigenous staff employed.
Customers
Progress towards our „onemillionkids‟ goal of educating more than one million Australian schoolchildren in
financial literacy by 2015, with 224,800 children reached between November 2009 and 30 June 2010.
Indigenous Banking Team won the Established Business Award in the Queensland Government‟s Reconciliation
Awards for Business.
Community
Continued successful partnership with Clean Up Australia Day, supporting an estimated 588,000 Australians to
clean up their local environment.
The Staff Community Fund, Australia‟s longest running workplace giving program, offered 66 youth and
children‟s charities grants totalling $550,000.
Environment
Reduced emissions associated with the Group‟s tool-of-trade fleet by 8% by changing vehicle and fuel types and
offering driver education.
Recognised in the top 10% of companies globally by the Carbon Disclosure Project for the quality of our
disclosure and reporting on carbon emissions, by achieving a place in the Carbon Disclosure Leadership Index
Sustainability progress
More information about sustainability is available at commbank.com.au/sustainability
70
Index
Overview and Strategy 56
Business Performance 70
Risk Management 89
Capital, Funding and Liquidity 101
Economic Overview 113
71
Group NIM – 6 months
bpts
218
--0 -
(6)
(4)
208
Dec 09 Deposits Assets
& Mix
Replicating
portfolio
Balance Sheet
positioning
Jun 10
Product Margins
72
RBS – 6 month periods
Jun 10 Dec 09 Jun 09Jun 10 vs
Jun 09
Net interest income Home loans 1,122 1,091 856 31%
Consumer finance 594 549 511 16%
Retail deposits 1,092 1,248 1,146 (5%)
2,808 2,888 2,513 12%
Other banking income Home loans 93 99 85 9%
Consumer finance 205 212 265 (23%)
Retail deposits 209 248 321 (35%)
Distribution 166 124 108 54%
673 683 779 (14%)
Total banking income Home loans 1,215 1,190 941 29%
Consumer finance 799 761 776 3%
Retail deposits 1,301 1,496 1,467 (11%)
Distribution 166 124 108 54%
3,481 3,571 3,292 6%
Operating expenses (1,414) (1,380) (1,430) (1%)
Impairment expense (345) (391) (462) (25%)
Expense to income 40.6% 38.6% 43.4% (280 bpts)
Cash net profit after tax 1,216 1,245 988 23%
73
Jun 10
$m
Jun 10 vs
Jun 09
Home loans 2,405 38%
Consumer finance 1,560 8%
Retail deposits 2,797 (9%)
Distribution 290 29%
Total banking income 7,052 9%
Operating expenses (2,794) -
Operating performance 4,258 15%
Impairment expense (736) 5%
Tax (1,061) 19%
Cash net profit after tax 2,461 17%
Retail Banking Services
Customer satisfaction gains
supporting strong business
performance
Solid volume growth in Home
Loans and Deposits
Higher funding costs and deposit
competition causing some margin
pressure
Cost-to-income ratio further
improved, sub 40% for FY10
Impairment trends consistent with
cycle and improving
74
IB&M – 6 month periods
Jun 10 Dec 09 Jun 09Jun 10 vs
Jun 09
Net interest income Institutional Banking 558 569 571 (2%)
Global Markets 93 114 192 (52%)
651 683 763 (15%)
Other banking income Institutional Banking 388 330 218 78%
Markets 173 342 259 (33%)
561 672 477 18%
Total banking income Institutional Banking 946 899 789 20%
Markets 266 456 451 (41%)
1,212 1,355 1,240 (2%)
Operating expenses (405) (387) (366) 11%
Profit before impairment expenses 807 968 874 (8%)
Impairment expense 72 (321) (512) Large
Expense to income 33.4% 28.6% 29.5% 390 bpts
Cash net profit after tax 637 545 334 91%
75
Institutional Banking and Markets
Jun 10
$m
Jun 10 vs
Jun 09
Institutional Banking 1,845 16%
Markets 722 (10%)
Total banking income 2,567 7%
Operating expenses (792) 17%
Operating performance 1,775 3%
Impairment expense (249) (85%)
Tax (344) Large
Cash net profit after tax 1,182 Large
Strong NPAT result with an increase of
7% in operating income and 85%
decrease in loan impairment
Solid revenue growth:
► Improved margins and fee income,
offset by decline in balances
► Decline in Markets Desk Revenue
Continued strong customer satisfaction
ratings in East & Partners survey
Expense increase impacted by
performance related staff costs,
operating lease depreciation and
continued investment in the business.
76
BPB – 6 month periods
Jun 10 Dec 09 Jun 09Jun 10 vs
Jun 09Net interest income Corporate Financial Services 269 279 272 (1%)
Regional & Agribusiness 116 120 111 5%
Local Business Banking 242 215 197 23%
Private Bank 61 62 55 11%
Equities Margin Lending 108 108 101 7%
Other 25 38 41 (39%)
821 822 777 6%Other banking income Corporate Financial Services 255 231 206 24%
Regional & Agribusiness 68 70 62 10%
Local Business Banking 112 116 124 (10%)
Private Bank 58 57 53 9%
Equities Margin Lending 113 142 98 15%
Other 17 10 8 Large
623 626 551 13%Total banking income Corporate Financial Services 524 510 478 10%
Regional & Agribusiness 184 190 173 6%
Local Business Banking 354 331 321 10%
Private Bank 119 119 108 10%
Equities Margin Lending 221 250 199 11%
Other 42 48 49 (14%)
1,444 1,448 1,328 9%Operating expenses (671) (639) (645) 4%Impairment expense (132) (194) (189) (30%)Expense to income 46.5% 44.1% 48.6% (210 bpts)Cash net profit after tax 453 440 363 25%
77
Business and Private Banking
Double digit revenue growth in all
segments
Operating performance 19%:
► Good volume growth in
lending
► Stable total margin
► Improved equities trading
volumes within CommSec
Disciplined expense management
Improving impairments trend
* Represents revenue earned from products sold through direct channels
Jun 10
$m
Jun 10 vs
Jun 09
Corporate Financial Services 1,034 11%
Regional and Agribusiness 374 11%
Local Business Banking 685 10%
Private Bank 238 10%
Equities and Margin Lending 471 14%
Other * 90 2%
Total banking income 2,892 11%
Operating expenses (1,310) 3%
Operating performance 1,582 19%
Impairment expense (326) 6%
Tax (363) 26%
Cash net profit after tax 893 21%
78
New Zealand – 6 month periods
NZ$M Jun 10 Dec 09 Jun 09
Jun 10 vs
Jun 09
Net interest income ASB 468 440 451 4%
Other (5) (4) 5 Large
Total NII 463 436 456 2%
Other banking income ASB 135 207 254 (47%)
Other (16) (15) - -
Total OBI 119 192 254 (53%)
Total banking income ASB 603 647 705 (14%)
Other (21) (19) 5 Large
Total Banking Income 582 628 710 (18%)
Funds Management Income 26 32 30 (13%)
Insurance Income 160 106 143 12%
Total operating income 768 766 883 (13%)
Operating expenses (428) (401) (375) 14%
Profit before impairment expense 340 365 508 (33%)
Impairment Expense 2 (127) (170) Large
Expense to income 55.7% 52.3% 42.5% Large
Underlying profit after tax 272 188 232 17%
Investment experience 3 (2) (8) Large
Cash net profit after tax 275 186 224 23%
79
New Zealand
Jun 10
NZ$m
Jun 10 vs
Jun 09
ASB 1,311 (11%)
Sovereign 251 (7%)
Other (28) (Large)
Total operating income 1,534 (12%)
Operating expenses (829) (5%)
Operating performance 705 (25%)
Impairment expense (125) (47%)
Tax and minority interests (120) (29%)
Underlying profit after tax 460 (14%)
Investment experience 1 -
Cash net profit after tax 461 (14%)
ASB NZD Cash NPAT 13%
due to:
► Break fees $100m
► Trading income down
► Recession in NZ
Sovereign NZD cash NPAT 13%
due to:
► Higher claims expense
Sovereign capturing 27% of new
business sales
80
WM – 6 month periods
Jun 10 Dec 09 Jun 09Jun 10 vs
Jun 09
Net operating income CFS GAM 333 330 271 23%
Colonial First State 333 318 263 27%
CommInsure 337 364 329 2%
Other (2) (1) 1 Large
1,001 1,011 864 16%
Operating expenses CFS GAM (188) (170) (173) 9%
Colonial First State (213) (231) (211) 1%
CommInsure (143) (138) (143) -
Other (65) (62) (68) (4%)
(609) (601) (595) 2%
Underlying profit after tax CFS GAM 115 121 67 72%
Colonial First State 86 61 37 Large
CommInsure 140 159 133 5%
Other (44) (46) (51) (14%)
297 295 186 60%
Cash net profit after tax CFS GAM 129 137 5 Large
Colonial First State 85 59 31 Large
CommInsure 168 228 122 38%
Other (43) (45) (47) (9%)
339 379 111 Large
81
Wealth Management
CFS GAM:
► FUM 4% to $144bn
► Strong investment performance - 76%
of funds outperforming over 5 years
Colonial First State:
► Retail FUA 10% to $74bn
► FirstChoice 2nd largest platform, 21%
of inflows
CommInsure:
► Retail Life inforce premiums 12%
► General Insurance inforce premiums
13%
Total expenses 1%
Investment Experience:
► Improved shareholder investment
returns
► Annuity mark to market gains of
$39m post tax
Jun 10
$m
Jun 10 vs
Jun 09
CFS GAM 663 4%
Colonial First State 651 17%
CommInsure 701 (3%)
Other (3) n/a
Net operating income 2,012 5%
Operating expenses (1,210) 1%
Tax (210) 2%
Underlying profit after tax 592 15%
Investment experience 126 Large
Cash net profit after tax 718 Large
Movements vs Jun 09 pro forma
82
Quarterly Net Flows
+ 2%
* Wholesale life impacted by loss of Australian Super
+6%$1,069m
$890m $935m
$702m
$872m
Jun 09 Sep 09 Dec 09 Mar 10 Jun 10
Funds under Administration FirstChoice net flows solid
Strong investment performance – 5 years Inforce premiums up 2%
$169bn$186bn $180bn
$2bn$15bn ($5bn) ($1bn)
Jun 09 Net
flows
Inv
Returns
Dec 09 Net
flows
Inv
Returns
Jun 10
$1,560m $1,584m$88m ($112m)
$48m
Jun 09 Retail Life Wholesale
Life*
General
Insurance
Jun 10
Wealth Management
100%
0
33%
65%
100%
50%
29%
100% 100%
67%76%
Domestic
Equities
Global
Resources
Property
Securities
Fixed
Interest
Cash Infrastructure Direct
Property
Listed
Property
GEM/AP Global
Equities
Average
83
Global Asset Management
* FUM figures exclude the Group‟s interests in the China Joint Venture.
North America
$1.6bn FUM
3 People
Globally: $144bn FUM*, 925 people
Middle East
$6.3bn FUM
UK & Europe
$19.6bn FUM
174 People
Japan
$4.0bn FUM
Asia ex China & Japan
$16.0bn FUM
111 People
Australia & New Zealand
$96.7bn FUM
637 People
33% FUM raised from offshore clients, 42% people located offshore, 52% revenue generated offshore
84
Bankwest – 6 month periods
Jun 10 Dec 09 Jun 09Jun 10 vs
Jun 09
Net interest income 760 727 591 29%
Other banking income 112 121 168 (33%)
Total banking income 872 848 759 15%
Operating expenses (437) (443) (483) (10%)
Impairment expense (441) (313) (113) Large
Net profit before tax (6) 92 163 Large
Corporate tax expense 2 (28) (50) Large
Cash net profit after tax (4) 64 113 Large
85
Bankwest
Income growth underpinned by
strong retail lending volumes and
margin management
Disciplined cost management –
expenses down 3%
Significant cost-to-income
improvement – now 51%
Impairment expense:
► Review of non-impaired
legacy business book
► Steps taken to strengthen
risk management practices
Jun 10
$m
Jun 10 vs
Jun 09
Net interest income 1,487 33%
Other banking income 233 (7%)
Total banking income 1,720 25%
Operating expenses (880) (3%)
Operating performance 840 81%
Impairment expense (754) 65%
Tax (26) Large
Cash net profit after tax 60 Large
Movements vs Jun 09 pro forma
86
Bankwest integration
IT
RestructuringProperty
Operations / other
Integration costs - composition
$286m
Annual expense synergies – 2012 composition
East Coast
Store Rollout
(cessation)
Restructuring
Property & Procurement
$240m pa
Operating
efficiencies, other
IT
$101m
$145m
$24m$16m
$18m
$48m
$26m
$60m
$88m
87
Bankwest High level timeline
By
December
2008
Acquisition of Bankwest and St Andrew‟s announced Oct 08
Steering committee and governance structure established
Due diligence commenced, regulatory approvals obtained
Jon Sutton appointed BWA MD, new CFO and CRO appointed
Transaction completed 19 Dec 08 – formal acquisition date
Common ATM and branch access for CBA/BWA customers
Multi-brand strategy implemented
Revised growth plan established (risk, costs, distribution etc)
Integration of St Andrew‟s into CBA Wealth Management
Final acquisition accounting included in CBA FY09 results
By
June
2009
By
FY12
Post
FY12
Systems alignment
Consolidation of operations/processes
Pursue targeted cost synergy opportunities
Focus on leveraging CBA scale advantage
Integration of Bankwest systems into Core Banking
Pursue incremental synergy opportunities
Transaction
completion
Completed
Extract cost
synergies via
business
alignment
Phase 2 –
Core
Banking
88
Asia Targeted growth strategy
China
* Includes Asian earnings from all CBA business units, and excludes head office support costs
Branches Staff
Japan Branch
India Mumbai Branch opened April 2010
Hong Kong Branch, First State Investments
Vietnam 15% stake in VIB (announced in April 2010),
Branch (Ho Chi Minh), Representative office (Hanoi).
Singapore Branch, First State Investments
Indonesia
PT Bank Commonwealth 74 1,562
PT Commonwealth Life 24 342
First State Investments 25
Qilu Bank (20%) 74 1,822
Bank of Hangzhou (20%) 93 3,202
Shanghai Branch 13
Beijing Representative office 5
BoCommLife JV 115
First State Cinda Fund Management Company 72
Branches Staff
143
2010 Cash
NPAT $m*
68
2010 Cash
NPAT $m*
13
89
Index
Overview and Strategy 56
Business Performance 70
Risk Management 89
Capital, Funding and Liquidity 101
Economic Overview 113
90
Exposure mix
Regulatory exposure mix 1
CBA Peer 1 Peer 2 Peer 3
Residential Mortgages 60% 41% 39% 53%
Corporate, SME & Spec Lending 27% 36% 42% 36%
Bank 5% 6% 12% 4%
Sovereign 5% 7% 4% 3%
Qualifying Revolving 2% 4% 2% 3%
Other Retail 1% 6% 1% 1%
Total Advanced 2 100% 100% 100% 100%
1. Source Pillar 3 disclosures for CBA as at June 2010 and Peers as at March 2010.
2. Includes Specialised lending. Excludes Standardised, Other Assets and Securitisation (representing 6%
of Peer 1, 16% of Peer 2 and 25% of Peer 3). Exposure mix is re-baselined to total 100% for comparison.
91
0.00%
0.20%
0.40%
0.60%
0.80%
1.00%
Mar-08 Sep-08 Mar-09 Sep-09 Mar-10
FHB Portfolio
Credit Quality
30 days+ arrears rate
(3 months on book)
23%
5%
1%0%
5%
5%
0%
29%
6%
5%
21%
Agriculture
Construction
Energy
Finance - Bank
Finance - Other
Manufacturing
Mining
Property
Retail & Wholesale Trade
Transport & Storage
Other
90 days +
0.0%
0.5%
1.0%
1.5%
2.0%
2.5%
Mar-08 Jun-08 Sep-08 Dec-08 Mar-09 Jun-09 Sep-09 Dec-09 Mar-10 Jun-10
Home Loans Credit Cards Personal Loans
4.5
Jun 08 Dec 08 Jun 09 Dec 09 Jun 10
CBA (including ASB) Bankwest
$bn
4.9
bpts 2 101 166 197
5.5
2.9
5.56.2
7.2
238
8.5
5.7
275
1 Includes defaulted/well secured exposures & exposures where there is a potential for default within ~ 12 months if a
sustained improvement in financial performance is not achieved in the short term. Excludes impaired exposures. 2 As a percentage of total commercial exposures
First Home Buyers
Troublesome Exposures by Sector Troublesome Exposures 1
ASB arrears
92
Home Lending
* Source APM database
Excludes Bankwest
70% of customers paying in advance
(average 9 payments)
Portfolio average LVR:
► 52% based on original values
► 43% based on current values
Maximum LVR of 90% except for best risk existing
CBA customers
Genuine savings of 5% required for loans above
85% LVR
First Home Owner Grant not counted as genuine
savingsHome loan portfolio mix
Jun 10 Dec 09 Jun 09
Owner-Occupied 58% 58% 57%
Investment 32% 32% 32%
Line-of-Credit 10% 10% 11%
Variable 85% 82% 79%
Fixed 15% 17% 21%
Honeymoon 0% 1% 1%
Low Doc % 3.8% 4.1% 4.5%
Originations
Proprietary 64% 63% 58%
Third Party 36% 37% 42%
Portfolio LVR Distribution
% of Portfolio by LVR band
*
01020304050607080
0-60% 60-70% 70-80% 80-90% 90-95% 95%+
LVR at origination
LVR at current market value
No. of Accounts in Customer Assist Program
Jun-09 Aug-09 Oct-09 Dec-09 Feb-10 Apr-10 Jun-10
Home Loans Personal Loans Credit Cards
9,325
13,299
5,132
93
Home Loan stress test
PD = Probability of default. Excludes lines of credit.
Unemployment rise to: 10%
Interest rates rise to: 14%
Property values drop: 30%
Probability of default increase: 6x
Loans >80% LVR mortgage insured (additional insured
losses of $1,515m in high stress scenario)
The higher of the Standard Variable Rate + rate buffer
(150bp) or the 5 yrs fixed rate built into serviceability
tests.
Portfolio average LVR of 43%
Full recourse to borrower
70% of customers paying in advance (avg 9 payments)
Expected loss $m PD stress factor
Property value x1 x2 x4 x6
No decrease 11 16 24 32
10% decrease 33 50 77 102
20% decrease 100 154 249 333
30% decrease 214 338 553 743
High stress scenario Expected Loss outcomes
Six-Month Movement Loss mitigants
Excludes Bankwest and ASB
762 743
55 184
122 97
$m
Previous
Result
Closed
Accounts
Increase in
Market
Valuation
Existing
Accounts
New
Accounts
Current
Result
94
Jun 10 Jun 09
Total exposures = balance for uncommitted facilities; greater of limit or balance for committed facilities.
Includes settlement risk.
Jun 10 Jun 09
Consumer 54.8% 51.5%
Agriculture 2.4% 2.4%
Mining 0.7% 1.0%
Manufacturing 2.3% 2.7%
Energy 1.1% 1.5%
Construction 1.0% 1.1%
Retail & Wholesale 2.4% 2.6%
Transport 1.4% 1.5%
Banks 10.2% 10.4%
Finance – other 4.1% 5.0%
Business Services 0.9% 1.0%
Property 6.9% 7.8%
Sovereign 4.9% 4.0%
Health & Community 0.9% 0.9%
Culture & Recreation 0.7% 0.9%
Other 5.3% 5.7%
Total 100% 100%
Australia 81%
New Zealand 9%
Europe 5%
Other International 5%
Including ASB and Bankwest Including ASB and Bankwest
Sector exposures
Australia 79%
New Zealand 10%
Europe 7%
Other International 4%
95
- 200 400 600 800 1,000 1,200
BB-
A-
BBB+
AA+
BBB+
BB
BBB+
A-
BBB
A-
A
A
A+
BBB+
A-
BB+
A-
BBB
A
A+
1
Sector exposures
$bnAAA to
AA-
A+ to
A-
BBB+
to
BBB-
Other Total
Banks 37.0 27.1 2.2 0.4 66.7
Finance Other 10.0 8.7 3.8 5.6 28.1
Property 0.3 4.8 6.8 36.4 48.3
Sovereign 29.5 1.5 0.4 0.4 31.8
Manufacturing 0.1 2.8 5.9 6.6 15.4
Retail/Wholesale Trade 0.0 0.8 4.1 12.2 17.1
Agriculture 0.0 0.3 1.5 14.9 16.7
Energy 0.6 1.4 4.2 1.6 7.8
Transport 0.3 2.1 3.4 4.2 10.0
Mining 0.1 1.2 1.4 2.2 4.9
All other (ex consumer) 2.5 3.7 10.4 36.4 53.0
Total 80.4 54.4 44.1 120.9 299.8
1 Total exposure = balance for uncommitted facilities; greater of limit or balance for committed facilities
Excludes settlement exposures
Includes ASB and Bankwest
Top 20 Commercial Exposures
Note 1
Notes: The ratings reflect the bulk of the aggregated entities
exposure.
Within these aggregated exposures is the following:
1. $149m rated CCC, $110m CC, $160m B, secured by fixed &
floating charge.
2. $294m rated A-, secured by fixed & floating charge.
3. $180m rated BBB-, secured by fixed & floating charge.
2 Excluding finance and government. CBA grades in S&P Equivalents
2Sector Exposures – Jun 10
Note 3
Note 2
96
Commercial Property market
0%
5%
10%
15%
20%
25%
30%
35%
40%
Sydney Melbourne Brisbane Perth Adelaide
1991 Recession Current
Source : Jones Lang LaSalle Research
Market
Current
(Q2 2010)
Previous
(Q4 2009)
Peak
1990s
Sydney 7.9% 8.2% 22.4%
Perth 8.6% 7.7% 31.8%
Melbourne 6.3% 6.4% 25.8%
Brisbane 10.6% 10.2% 14.3%
Adelaide 7.8% 8.2% 19.8%
% of Total Stock
CBD Vacancy RatesCBD Office Supply Pipeline*
CBA Commercial Property
49%
19%11% 13%
5% 3%
NSW VIC QLD WA SA Other
Source : Jones Lang LaSalle Research
Includes Bankwest
Exposure by State
* The development pipeline includes all projects currently under construction. Melbourne for example is
only developments in 2010 (there is nothing beyond the calendar year at present), while Perth and
Brisbane include projects through 2012.
97
0
1
2
3
4
1982 1984 1986 1988 1990 1992 1994
Lo
ss R
ate
(%
)
Small Business
Personal Loans
Credit cards
Business Banking
Home Loans
Institutional Banking
Historical loss rates in the last recession
98
Credit RWA Movement (%) Composition of Movement (%)
RWA Movement (%)
Total Tier 1 ratio impact (bpt)
Credit Risk (1)% 5
Traded Market Risk (13)% 2
Operational Risk 11% (6)
Total excl IRRBB (3)% 1
IRRBB (38)% 19
Total (2)% 20
■ Credit RWAs relatively flat as a result of:
Growth in non-retail RWAs driven by update to
credit risk factors
Offset by review and disaggregation of data and
slight decrease in retail RWAs
■ IRRBB RWAs decrease driven mostly by fall in
re-pricing and yield curve risk
On Balance
Sheet
Off Balance
SheetTotal
Consumer Retail 0% (4)% (1)%
Non-retail (1)% 5% 1%
CRFs1 FX/
Volume Quality
Data
reviewTotal
- (359)% 539% (79)% 100%
344% (230)% (51)% 37% 100%
Tier 1 impact – Retail (bpts) 1 1 2
Tier 1 impact – Non-Retail (bpts) 2 (5) (3)
Tier 1 impact – Other 2 (bpts) 7 (1) 6
Total Tier 1 impact (bpts) 10 (5) 5
- (6) 9 (1) 2
(10) 7 1 (1) (3)
- (1) 0 7 6
(10) 0 10 5 5
1 Credit Risk Factors 2 Other includes Credit Risk Weighted Assets for other Basel Asset standardised classes including
Bankwest, margin lending, equities, securitised and other assets and claims
Risk Weighted Assets – Jun-10 Half
99
A comprehensive, in-depth review:
► ~1,100 individual files (66% of book now reviewed)
► Results extrapolated to remaining, lower risk segment
► Independent insolvency firms engaged
► Specialist management team reviews across key industry sectors
Profile of problem loans:
► Legacy - 99% written pre-acquisition
► Predominantly East Coast
► Performing loans; average loan size $8m
► Unrealistic security valuations
Risk management practices significantly strengthened:
► Strengthened oversight regime (Board and Executive Risk Committees)
► Guidelines and delegations tightened
► Alignment with CBA policy and procedures
Bankwest Legacy Book Review
100
5% 5%2%
2%
6%
48%
5%
27%
Agriculture
Construction
Energy
Finance - Bank
Finance - Other
Manufacturing
Mining
Property
Retail & Wholesale Trade
Transport & Storage
Other
Jun 10 Jun 09
Consumer 60.0% 57.9%
Agriculture 3.1% 3.1%
Mining 0.3% 0.3%
Manufacturing 1.3% 1.4%
Energy 0.2% 0.2%
Construction 1.9% 2.2%
Retail & Wholesale 3.7% 3.7%
Transport 0.6% 0.6%
Banks 6.3% 6.5%
Finance – other 0.8% 0.8%
Business Services 1.3% 1.4%
Property 13.5% 15.4%
Sovereign 1.2% 0.4%
Health & Community 1.8% 2.0%
Culture & Recreation 0.2% 0.2%
Other 3.7% 3.9%
Total 100% 100%
Troublesome Business Exposures by Sector
Bankwest Portfolio Overview
Total Exposures by Sector
101
Index
Overview and Strategy 56
Business Performance 70
Risk Management 89
Capital, Funding and Liquidity 101
Economic Overview 113
102
UK Comparison
The following table estimates the impact on CBA Group capital, as at June 2010, of the
differences between the APRA Basel II guidelines and those of the UK regulator, Financial
Services Authority (FSA)
1. Represents Fundamental Tier One capital net of Tier One deductions2. Based on APRA 20% loss given default (LGD) floor compared to FSA 10% and CBA‟s downturn LGD loss experience.
For Standardised portfolio, based on APRA matrix compared to FSA standard3. UKFSA provides larger Tier One Hybrid limits compared to APRA4. VIF at acquisition is treated as goodwill and intangibles and therefore is deducted at Tier One by APRA. FSA allows
VIF to be included in Tier One Capital but deducted from Total Capital
Net
Fundamental
Capital1
Tier 1
Capital
Total
Capital
June 2010 Actual 6.9% 9.2% 11.5%
RWA treatment – mortgages 2, margin loans 1.1% 1.4% 1.7%
IRRBB risk weighted assets 0.3% 0.3% 0.4%
Future dividends 0.9% 0.9% 0.9%
Tax impact in EL > EP calculation 0.1% 0.1% 0.2%
Removal of Tier 1 Hybrid Limits 3 0.0% 0.1% 0.0%
Equity Investments 0.3% 0.3% 0.2%
Value of in force (VIF) deductions 4 0.5% 0.5% 0.0%
Total Adjustments 3.2% 3.6% 3.4%
June Actual – Normalised 10.1% 12.8% 14.9%
103
UK Comparison
Key differences between the APRA and FSA method of calculating regulatory capital.
Item Items impacting published total capital adequacy ratio
Impact on Bank’s
ratio if FSA rules
applied
Mortgages
Under APRA rules, the minimum Loss Given Default (LGD) for residential real estate secured
exposures is higher (20%) compared with 10% for FSA. This results in higher RWA under APRA
rules.
Increase
Margin loansUnder APRA rules, margin loans attract a minimum risk weight (20%), compared to FSA where no
minimum risk weight is applied .Increase
IRRBBThe APRA rules require the inclusion of Interest Rate Risk in the Banking Book (IRRBB) within
RWA. This is not required by FSA.Increase
Dividends
Under FSA rules, dividends should be deducted from regulatory capital when declared and/or
approved, whereas APRA requires dividends to be deducted on an anticipated basis. This is partially
offset by APRA making allowance for expected shares to be issued under a dividend reinvestment
plan.
Increase
Equity
investments
Under APRA rules some equity investments are treated as a deduction 50% from Tier 1 Capital and
50% from Tier 2 Capital. Under the FSA, these equity investments are treated as Total Capital
deductions or as RWA.
Increase
Deferred tax
assets (DTA)
Under APRA rules, DTA (excluding those associated with Collective Provisions), are deducted from
Tier 1 Capital. FSA treat DTA as a 100% RWA.Increase
Hybrid limitsAPRA imposes a Residual Capital limit of 25% of Tier 1 Capital. Under FSA rules this limit is 50%, with
more flexible transition rules.
Increase Tier 1,
Total Capital neutral
Value of in
force (VIF)
VIF at acquisition is treated as goodwill and intangibles and therefore is deducted at Tier 1 by APRA.
FSA allows VIF to be included in Tier 1 Capital but deducted from Total Capital.
Increase Tier 1,
Total Capital neutral
104
European
comparison
The Group‟s Tier 1 Capital Ratio compares favourably to
international peers
Basel II Tier 1 Capital
Hybrids
13.0%11.4%
10.0% 10.5% 10.1% 9.9%
7.5%9.0% 8.5% 8.4% 9.0% 8.6% 9.0% 8.4% 8.1%
7.4%
16.4% 16.3%
13.2%12.8% 12.8%
11.5% 11.3% 11.2% 10.7% 10.6%
10.3% 10.1% 10.0% 9.4% 9.2% 8.7%
0%
2%
4%
6%
8%
10%
12%
14%
16%
UB
S
CR
ED
IT
SU
ISS
E
BA
RC
LA
YS
RB
S
CB
A
HS
BC
H
LD
GS
PL
C
DE
UT
SC
HE
B
AN
K
ST
AN
DA
RD
C
HA
RT
ER
ED
SO
CG
EN
BN
P
PA
RIB
AS
LL
OY
DS
BA
NC
O
SA
NT
AN
DE
R
NO
RD
EA
UN
ICR
ED
IT
BB
VA
INT
ES
A
SA
NP
AO
LO
E
Top 15 European banks by market capitalisation as at 1 July 2010
Source: latest publicly disclosed company reports and other market updates. Includes pro-forma announcements
1. Reflects Tier 1 Capital less hybrid Tier 1 instruments
Europe
Average
Tier 1 : 11.4%
Europe
Average
Core Tier 11:
9.2%
Core Tier 1 P Pro-forma
P
105
Constructive dialogue on key reforms
Consumer
Liquidity
Other
Capital
Basel III
1 month liquidity buffer
Qualifying assets narrowed
Net stable funding ratio
Basel III
Tier 1 capital – qualifying assets, hybrids
Deductions methodology – Tier 1 impact
Leverage ratio
Rating agency models changing
APRA Review of Conglomerates
APRA Review of General and Life insurers
Australian Credit Law Reform
Privacy reforms + comprehensive credit reporting
Future of Financial Advice and Cooper Review
Wealth Management product simplification
Provisioning
Governance and remuneration
Henry Tax Review
Overseas change
106
Regulatory Change: Liquidity, funding, capital
Subsequent Basel 3 proposal (July 2010)Initial Basel 3 proposal (Dec 2009)Impact of
change on CBA
Liq
uid
ity
Fu
nd
ing
Cap
ital
Liquidity Coverage Ratio (LCR)
Definition of liquid assets excludes most existing liquid
assets except Commonwealth Govt (and semi-govt) bonds
Acute stress scenario from 1 week to 1 month
Onerous assumptions about durability of deposits during
stress scenario
Result – more liquid assets required and narrower definition
of qualifying assets
Definition of liquid assets widened to include “Level 2” liquid
assets and development of standards for jurisdictions with
insufficient government bonds(e.g. Aust)
Reduction of the severity of some assumptions – for example,
different types of deposits assumed to be more durable with
lower run-off assumptions
Introduction and transition periods still to be determined
Net Stable Funding Ratio (NSFR)
Assets with >1yr maturity to be funded with “stable”
liabilities with >1yr term
Result –would require CBA to raise over $100bn in additional
long term wholesale funding
Decrease in the quantum of “stable funding” required for
mortgages – from 100% to 65%
Run-off assumptions for some deposits less onerous
Transition via an “observation phase” with finalisation and
introduction by Jan 2018
Leverage Ratio
New rules relating to hybrids
More punitive rules relating to capital deductions
Provisions to address pro-cyclicality
APRA specific rules on Bank Conglomerates
Result - more capital, less hybrids, many technical issues
requiring clarification
Leverage ratio set at min 3% - less onerous than expected –
with transition through to Jan 2018
Allow for differences in Australian accounting rules
Many technical changes remain and require clarification
indicates that the change from 2009 is positive for the Group
neutral
neutral
107
Interest
Rate Risk
Capital Assigned to Interest Rate Risk in
Banking Book - APS117
Jun 08 Dec 08
Optionality
Basis Risk
Repricing and
Yield Curve Risk
Embedded Loss
Jun 09
$1,286m
-$70m
(ie zero)
$716m
Embedded Gain
(offset to capital)
Repricing and
Yield Curve Risk
Basis Risk
Optionality
Fixed rate asset portfolios serve to offset NIM
compression in falling and low rate environment -
less APS117 capital needs to be held
Embedded gain reduces due to increase
in swap rates, and other factors including
customer pre-payments of fixed rate
mortgages
Dec 09
$1,328m
51 bpts 26 bpts 54 bpts0 bpts
$822m
Jun 10
33 bpts
108
Unguaranteed Guaranteed
Funding
$m
5%
36%
11%3%4%
24%
4%5%
5% 3%Structured MTN
Vanilla MTN
Commercial Paper
Structured Finance
Debt Capital
CDs
Securitisation
Bank Acceptance
Deposits from other financial institutions
Other
36%
7%11%
30%
6%7% 2% 1% Australia
Other Asia
Europe
United States
Japan
United Kindom
Hong Kong
Misc
Note: AUD, USD & EURO Public benchmark deals are fully allocated to their
respective currency locations
Wholesale Funding by Product
$bn
Wholesale Funding by Region FY10 Issuance
7,938
3,117
5,846
8,406
6,994
4,585
3,051 3,023
6,675
2,627
293 616
58%
18%
5%
16%2% 1%
Customer Deposits ST Wholesale FundingLT Wholesale maturing <12m LT Wholesale maturing >=12mRMBS Hybrids
58% Deposit Funded
109
1%
2%
3%
4%
5%
6%
7%
8%
Replicating Portfolio
Actual and Forecast Scenario*
2001 Current 2012
Forecast*
* Indicative forecast of the replicating portfolio in relation to hypothetical movements in the official cash rate
1%
2%
3%
4%
5%
6%
7%
8%
Official Cash Rate
Replicating Portfolio Yield
110
UK and US balance sheet comparison
United Kingdom
5% 5%
13% 9%
12% 20%
46%
12%
18%
48%
6% 6%
Other Assets
Other Fair
Value assets
Other Lending
Home Loans
Trading Securities
Cash Capital
Deposits
Long Term
Short Term
Other Liabilities
Trading Liabilities
Assets Liab + Equity
USA
12%4%
13%
7%
16%
17%
37%
16%
15%
47%
7% 9%
Other Assets
Other Lending
Home Loans
Trading Securities
Cash Capital
Deposits
Long Term
Short Term
Other Liabilities
Trading Liabilities
Assets Liab + Equity
Based on analysis of Citigroup, JP Morgan, Bank of America and Wells Fargo
as at 31 March 2010. Average of four banks
Based on analysis of Lloyds, RBS, HSBC and Barclays, as at 30 June 2010
Average of four banks
Balance sheets do not include derivative assets and liabilities
Other Fair
Value assets
Based on statutory balance sheet
111
Australian Banks – safe assets, secure funding
Other Assets
Other Lending
Home Loans
Trading Securities
Cash Capital
Deposits
Long Term
Short Term
Other Liabilities
Commonwealth Bank
Trading Liabilities
CBA balance sheet as at 30 June 2010
Balance sheet does not include derivative assets and liabilities
Based on statutory balance sheet
21% Aust
household
deposits)
Assets Liab + Equity
Other Fair
Value assets
Assets – CBA’s assets are safer because:
52% of balance sheet is home loans, which are stable/long
term
Trading securities and other fair value assets comprise just
9% of CBA balance sheet compared to 25% and 29% for UK
and US banks
CBA‟s balance sheet is less volatile due to a lower proportion
of fair value assets
Funding – a more secure profile because:
Highest deposit base (54% including 22% of stable household
deposits)
Reliance on wholesale funding similar to UK and US banks,
although a longer profile than UK banks, which gives CBA a
buffer against constrained liquidity in the wholesale markets
Balance sheet comparisons
Assets*
Amortised cost Fair Value
CBA 82% 18%
UK 56% 44%
US 45% 55%
* Includes grossed up derivatives.
6%1%
4%6%
5%17%
30% 16%
52%54%
3% 6%
112
Regulatory Expected Loss
Jun 09
$m
Dec 09
$m
Jun 10
$m
CBA (ex Bankwest) Regulatory Expected Loss (EL) – before tax 3,960 4,276 4,332
Eligible Provision 1
Collective provision 2 2,247 2,339 2,036
Individually assessed provisions 2 1,109 1,204 1,172
Other provisions 30 30 25
Subtotal 3,386 3,573 3,233
less tax effect impact (683) (711) (618)
General Reserve for Credit Losses adjustment (after tax) - - 90
Other (51) (40) (33)
Total Eligible Provision 2,652 2,822 2,672
Regulatory EL in excess of Eligible Provision 1,308 1,454 1,660
Tier 1 deduction – 50% 654 727 830
Tier 2 deduction – 50% 654 727 830
Total Capital Deduction 1,308 1,454 1,660
1. Eligible provisions exclude Bankwest portfolio which operates under Basel II standardised methodology.
2. Includes transfer from Collective provision to Individually assessed provisions in accordance with APS
220 requirements (June 10: $136m, Dec 09; $116m, June 09: nil).
113
Index
Overview and Strategy 56
Business Performance 70
Risk Management 89
Capital, Funding and Liquidity 101
Economic Overview 113
114
As at June
2007 2008 2009 2010 2011 (f) 2012 (f)
Credit Growth % – Total 15.5 12.0 3.3 2.8 7½-9½ 7-9
Credit Growth % – Housing 12.9 9.8 7.0 8.2 8-10 7-9
Credit Growth % – Business 19.2 17.1 0.5 -5.0 7-9 8-10
Credit Growth % – Other Personal 16.1 3.3 -7.0 3.1 4-6 4-6
GDP % 3.8 3.7 1.3 2.3 3.6 3.3
CPI % 2.9 3.4 3.1 2.3 3.0 3.1
Unemployment rate % 4.3 4.2 5.7 5.2 5.1 4.7
Cash Rate % 6¼ 7¼ 3 4½ 5½ 6
CBA Economists Forecasts
Credit Growth = 12 months to June
GDP & CPI = Year average
Unemployment, Cash Rate = June qtr
CBA Economists summary of key indicatorsEconomic
Summary
115
Growth outperformance Stronger labour market
Global Backdrop
2009
Unemployment Rate
Sources : ABS; Thomson Reuters
Real GDP GrowthYear-ended
Sources : ABS; CEIC; Thomson Reuters
116
Recovery with downside risks Recovery with an Asian Skew
China-Commodities-Incomes
-2
0
2
4
6
8
-2
0
2
4
6
8
1950 1960 1970 1980 1990 2000 2010
WORLD GROWTH(annual % change)
%%
Source: IMF
Long-runaverage
Globalrecessions
-2 -1 0 1 2
World
Advanced economies
Euro area
United States
Asian NICs
Developing Asia
China
India
Middle East
Western Hemisphere
WORLD GROWTH IN 2010-2011(% deviation from normal*)
*1998-07 average
0
30
60
90
Phil. Thai. Mal. Sing. Kor. Jap. NZ Indo. Aus.
CHINA & EXPORTS(% of a country's exports that remain in China)
%Source: HKMA
-2
-1
0
1
2
3
-2
-1
0
1
2
3
1994/95 1998/99 2002/03 2006/07 2010/11
COMMODITY INCOME BOOST*(% of GDP) %%
2010/11
Source: CBA calculations
2011/12
80% of Australian exports to China remain there
Global Backdrop
117
Domestic Drivers
0
30
60
90
120
0
30
60
90
120
1995 1997 1999 2001 2003 2005 2007 2009 2011
$bn $bn
Source: ABARE
ADVANCED MINING PROJECTS
20
30
40
50
20
30
40
50
Sep-89 Sep-93 Sep-97 Sep-01 Sep-05 Sep-09
'000 '000DWELLING COMMENCEMENTS
-60
-30
0
30
60
90
3.5
4.0
4.5
5.0
5.5
6.0
Jan-08 Jul-08 Jan-09 Jul-09 Jan-10 Jul-10
LABOUR MARKET
Employmentgrowth
(3mnth average, rhs)
Unemployment rate
(lhs)
% '000
0
20
40
60
80
0
20
40
60
80
Sep-84 Sep-89 Sep-94 Sep-99 Sep-04 Sep-09
$bn $bn
Non-residential
Engineeringconstruction
Public
THE CONSTRUCTION PIPELINE(real value of work yet to be done)
Residential
A Capex recovery & a large funding need Mining capex boom
Residential construction upturn Supportive labour market
118
The props under the domestic economy
0
1
2
3
4
0
1
2
3
4
1970 1975 1978 1983 1987 1991 1996 2000
%%
RESIDENTIAL CONSTRUCTION(contribution to GDP during upswing)
For cyle commencing in...
The typical residential construction upturn directly adds 2-
3ppts to GDP growth over the typical upswing of 2-3 years.
Big second round effects as well.
Residential Building Construction Multipliers
Output Multiplier(gross value added)
$1.31
Employment Multiplier(full-time equivalent)
17
-10
0
10
20
30
0
15
30
45
60
2000 2002 2004 2006 2008 2010
RESIDENTIAL LAND SUPPLY
Number ofresidential lots
(lhs)
Source: UDIA/CBA
%'000
House prices
(rhs)
HI2010
Residential land supply Housing demand and supply
100
150
200
100
150
200
Sep-90 Sep-94 Sep-98 Sep-02 Sep-06 Sep-10
HOUSING DEMAND & SUPPLY
Demand
Supply
'000'000
Domestic Drivers
119
0
150
300
450
0
150
300
450
1990/91 1995/96 2000/01 2005/06 2010/11
POPULATION DRIVERS'000 '000
Netmigration
Naturalincrease
Many factors supporting house prices
0
200
400
600
800
0
200
400
600
800
Sep-00 Sep-02 Sep-04 Sep-06 Sep-08 Sep-10
Brisbane
Perth
Sydney
Melbourne
Adelaide
Hobart
CBA ESTABLISHED HOUSE PRICES$'000$'000
Population drivers Migration program
Excess investment – not a savings shortfall CBA established house prices
0 10 20 30
Canada
France
Germany
Japan
UK
US
Australia
Canada
France
Germany
Japan
UK
US
Australia
SAVINGS & INVESTMENT(% of GDP)
% of GDP
SAVINGS
INVESTMENT
0
70
140
210
0
70
140
210
1990/91 1995/96 2000/01 2005/06 2010/11
MIGRATION PROGRAM'000 '000
Total
Skilled
457visa
120
0
2
4
6
0
2
4
6
Mar-93 Mar-97 Mar-01 Mar-05 Mar-09
DWELLING PRICES(ratio to household income)
*Source: RP Data/CBA/ABS
Australia-wide
Capitalcities
3.4% 6.4%
16.3%
24.7%
48.2%
First
Second
Third
Fourth
Fifth
Share of household debt held by income quintiles, 2006
Income quintiles includes at households
Sources : HLDA Release 6.0; RBA
50
55
60
65
70
75
50
55
60
65
70
75
Sep 69 Sep 77 Sep 85 Sep 93 Sep 01 Sep 09
%%
Australia
UnitedStates
CONSUMER SPENDING(% of GDP)
Australians more cautious in spending Dwelling prices
Increase in debt in upper age ranges 50% household debt held by top 20% income earners
Many factors supporting house prices
121
0
800
1600
2400
0
800
1600
2400
Mar-01 Mar-03 Mar-05 Mar-07 Mar-09
$bn $bn
Cumulativehousing
equity withdrawal
Cumulative increase in dwelling wealth
HOUSING EQUITY WITHDRAWAL
Cumulativerise in
housing debt
AUST H/H ASSETS BY RISK(% of total)
0
25
50
75
1989 1992 1995 1998 2001 2004 2007
0
25
50
75
% %
Fairly
risky
Fairly
safe
Safe
Source: CBA (e)
Housing equity withdrawal Aust H/H Assets by Risk
Domestic Drivers
122
Note
1 Retail MFI Customer Satisfaction – Roy Morgan Research. Australian Population 14+, % “Very Satisfied” or “Fairly
Satisfied” with relationship with that MFI institution. 6 month rolling average.
2 Business Customer Satisfaction - TNS Business Finance Monitor. Customer satisfaction with MFI – businesses with
annual turnover to $100m (ex Agribusinesses). This is based on a 12 month rolling average, except where noted.
Percentage point change refers to the increase /decrease of each bank‟s customers who are satisfied. Satisfaction is
based on business customers who said they were Very or Fairly Satisfied with their relationship with their MFI.
Peers are the other major banks: ANZ, NAB, STG and Westpac.
3 FirstChoice - Wealth Insights Platform Service Level Survey compared with bank peer platforms as ranked by
financial advisors.
4 Products per Customer - Roy Morgan Research. Australian Population 14+ , Banking and Finance products per
Banking and Finance customer at financial institution. 6 month moving average.
5 DBM Business Financial Services Monitor, measured micro business with turnover up to $1 million, small business
with turnover of $1 million up to $5 million, medium business with turnover of $5 million up to $50 million and large
business with turnover of over $50 million, 5 month data to May 2010.
Sources for Customer Satisfaction and related results outlined in this pack