Page 1
RESVERATROL AUGMENTS PACLITAXEL TREATMENT IN MDA-
MB-231 AND PACLITAXEL-RESISTANT MDA-MB-231 BREAST
CANCER CELLS
Alyssa A. Sprouse
Submitted to the faculty of the University Graduate School in partial fulfillment of the requirements
for the degree Doctor of Philosophy
in the Department of Pharmacology & Toxicology, Indiana University
August 2014
Page 2
ii
Accepted by the Graduate Faculty, of Indiana University, in partial fulfillment of the requirements for the degree of Doctor of Philosophy.
____________________________________ Brittney-Shea Herbert, Ph.D., Chair
Doctoral Committee
____________________________________ David A. Flockhart, M.D., Ph.D.
____________________________________ Richard Nass, Ph.D.
____________________________________ Karen E. Pollok, Ph.D.
May 23, 2014
____________________________________ Ahmad R. Safa, Ph.D.
Page 3
iii
DEDICATION
For the family I was given and the family I have chosen.
For Zoey.
Page 4
iv
ACKNOWLEDGEMENTS
I would like to thank the Indiana University Simon Cancer Center Flow Cytometry
Core facility for their services, Norma Lopez for her assistance with the senescence
staining, Dr. Harlan Shannon for his guidance in designing the drug combination
experiments, and the members of the Herbert laboratory for helpful discussions on this
project. In addition, I would like to thank the IBMG program and the staff of the
Department of Pharmacology & Toxicology for keeping me organized and for being
helpful and supportive every step of the way. Thank you to the Department of
Pharmacology & Toxicology faculty and students for their encouragement, discussion
and constructive criticism that have facilitated my growth as a scientist and a
professional. A special thank you to my mentor and thesis committee members for their
helpful discussion, suggestions and guidance. This work was supported by the Indiana
University Simon Cancer Center and the Indiana Genomics Initiative (INGEN) supported
in part by the Lilly Endowment, Inc. I am also grateful for the philanthropic support in
memory of Carol Herbert made to the Herbert laboratory through IUSCC. Finally, I would
like to thank my friends and family for their unwavering love and support.
Page 5
v
Alyssa A. Sprouse
RESVERATROL AUGMENTS PACLITAXEL TREATMENT IN MDA-MB-231 AND
PACLITAXEL-RESISTANT MDA-MB-231 BREAST CANCER CELLS
Resveratrol has been shown to inhibit cell growth and induce apoptosis, as well
as augment chemotherapeutics and irradiation in multiple cancer types. However, it is
unknown if resveratrol is beneficial for treating drug-resistant cancer cells. To study the
effects of resveratrol in triple negative breast cancer cells that are resistant to the
common cancer drug, paclitaxel, a novel paclitaxel-resistant cell line was generated from
the MDA-MB-231 breast cancer cell line. The resulting cell line, MDA-MB-231/PacR,
exhibited a 12-fold increased resistance to paclitaxel but remained sensitive to
resveratrol treatment. Resveratrol treatment reduced cell proliferation and colony
formation and increased senescence and apoptosis in both the parental MDA-MB-231
and MDA-MB-231/PacR cell lines. Importantly, resveratrol treatment augments the
effects of paclitaxel in both cell lines. The expression of the drug efflux transporter gene,
MDR1, and the main metabolizing enzyme of paclitaxel gene, CYP2C8, was increased
in the resistant cells. Moreover, pharmacological inhibition of the protein products of
these genes, P-glycoprotein and CYP2C8, decreased paclitaxel resistance in the
resistant but not in the parental cells, which suggests that the increase of these proteins
are important contributors to the resistance of these cells. In conclusion, these studies
imply that resveratrol, both alone and in combination with paclitaxel, may be useful in the
treatment of paclitaxel-sensitive and paclitaxel-resistant triple negative breast cancers.
Brittney-Shea Herbert Ph.D., Chair
Page 6
vi
TABLE OF CONTENTS
List of Tables .................................................................................................................. ix
List of Figures .................................................................................................................. x
List of Abbreviations ...................................................................................................... xii
Chapter 1: Introduction and Literature Review ................................................................ 1
I. Breast Cancer .......................................................................................................... 1
A. Triple Negative Breast Cancer ............................................................................. 4
B. Cancer Drug Resistance ...................................................................................... 6
II. Paclitaxel ................................................................................................................. 8
A. Paclitaxel Resistance in Breast Cancers .............................................................10
B. Multidrug Resistance Proteins ............................................................................11
C. Cytochrome P450 Enzymes ...............................................................................14
III. Dietary Supplements .............................................................................................17
IV. Resveratrol ...........................................................................................................19
A. Resveratrol Pharmacokinetics ............................................................................22
B. Resveratrol Anti-cancer Pharmacodynamics ......................................................24
C. Resveratrol Combination Therapy ......................................................................29
V. Preliminary and Present Work ................................................................................30
Chapter 2: Materials and Methods .................................................................................33
I. Cell Culture .............................................................................................................33
A. Cell Culture and Reagents ..................................................................................33
B. Mycoplasma Testing ...........................................................................................33
II. Resistant Cellular Model Generation ......................................................................34
III. Cell Proliferation Assays ........................................................................................34
A. Methylene Blue Cell Proliferation Assay .............................................................34
B. Cell Count Proliferation Assay ............................................................................35
Page 7
vii
C. Cell Survival Assays ...........................................................................................35
D. Checkerboard Drug Combination Assay .............................................................36
E. Inhibitor Assay ....................................................................................................37
IV. Molecular Techniques ...........................................................................................37
A. Cell Cycle Analysis .............................................................................................37
B. Senescence Staining ..........................................................................................38
C. Immunofluorescence ..........................................................................................39
D. Annexin V Apoptosis Flow Cytometry .................................................................39
E. SDS-PAGE Immunoblotting ................................................................................40
F. siRNA Knockdown ..............................................................................................42
G. Co-immunoprecipitation Assay ...........................................................................42
H. RNA Extraction ..................................................................................................44
I. cDNA Synthesis ...................................................................................................45
J. RT2 Profiler PCR Array ........................................................................................45
K. RT2 qPCR Primer Assay .....................................................................................46
V. Statistics ................................................................................................................47
Chapter 3: Results .........................................................................................................48
I. Paclitaxel-resistant Cellular Model Generation ........................................................48
II. Resveratrol Induced Cell Proliferation Inhibition, Senescence, and Apoptosis ........50
A. Resveratrol Inhibits Cell Proliferation ..................................................................50
B. Resveratrol Induces Sub-G1 Phase Accumulation..............................................55
C. Resveratrol Induces Senescence .......................................................................58
D. Resveratrol Induces Apoptosis ...........................................................................60
E. Resveratrol Decreases Survivin Protein Expression at High Concentration ........66
III. Resveratrol Augments Paclitaxel Treatment ..........................................................75
IV. Upregulation of P-glycoprotein & CYP2C8 Contributes to Paclitaxel Resistance
Page 8
viii
in MDA-MB-231/PacR Cells .......................................................................................82
Chapter 4: Discussion and Future Directions .................................................................87
I. Paclitaxel-resistant Cellular Model Generation ........................................................87
II. Resveratrol Induced Cell Proliferation Inhibition, Senescence, and Apoptosis ........87
III. Resveratrol Augments Paclitaxel Treatment ..........................................................94
IV. Upregulation of P-glycoprotein & CYP2C8 Contributes to Paclitaxel Resistance
in MDA-MB-231/PacR Cells .......................................................................................97
Summary ..................................................................................................................... 101
Appendix: Complete PCR Array Data .......................................................................... 103
References .................................................................................................................. 107
Curriculum Vitae
Page 9
ix
LIST OF TABLES
Table 1. Combination Treatment Decreases Paclitaxel IC50 ..........................................79
Table 2. PCR Array Identified Two Genes, ABCB1 & CYP2C8, Implicated in Breast
Cancer Paclitaxel Resistance as Highly Upregulated ....................................................84
Page 10
x
LIST OF FIGURES
Figure 1. Mechanisms of Cancer Drug Resistance ......................................................... 7
Figure 2. Metabolism of Paclitaxel in Humans ...............................................................16
Figure 3. Chemical Structure of Resveratrol ..................................................................20
Figure 4. Molecular Mechanisms of Resveratrol Anti-cancer Activity .............................26
Figure 5. Hypothesized Mechanism of Resveratrol Induced Apoptosis ..........................28
Figure 6. Resveratrol Sensitizes HCC1937 Cells with Mutant or Wild-type BRAC1 to
Paclitaxel .......................................................................................................................31
Figure 7. Schematic of Drug Resistant Cell Line Generation .........................................49
Figure 8. Paclitaxel Resistance is Not Correlated to Resveratrol Sensitivity ..................52
Figure 9. Resveratrol Inhibits Cell Proliferation ..............................................................53
Figure 10. Resveratrol Inhibits Colony Formation ..........................................................54
Figure 11. Resveratrol Induces Sub-G1 Accumulation ..................................................56
Figure 12. Micronuclei are Present in MDA-MB-231 & MDA-MB-231/PacR Cells ..........57
Figure 13. Resveratrol Induces Senescence .................................................................59
Figure 14. Resveratrol Induces Apoptosis .....................................................................62
Figure 15. Caspase 7 Activation Occurs at 48 Hours with 300 μM Resveratrol
Treatment ......................................................................................................................63
Figure 16. Caspase 7 Activation Occurs at 3 & 5 Days with 100 μM Resveratrol
Treatment ......................................................................................................................64
Figure 17. Caspase 3 Activation Occurs Before 48 Hours with 300 μM Resveratrol
Treatment ......................................................................................................................65
Figure 18. Resveratrol Inhibits Survivin Expression at High Concentration ....................68
Figure 19. Caspase 7 Knockdown Does Not Affect Resveratrol-Induced Survivin
Decrease .......................................................................................................................69
Page 11
xi
Figure 20. Resveratrol Does Not Affect Protein Expression of DBC1 & SIRT1 ..............70
Figure 21. Resveratrol Activates AMPK .........................................................................71
Figure 22. Resveratrol Does Not Affect Binding of DBC1 & SIRT1 ................................72
Figure 23. SIRT1 & DBC1 Co-immunoprecipitate in MDA-MB-468 Cells .......................73
Figure 24. Mechanisms of Resveratrol Induced Apoptosis ............................................74
Figure 25. Resveratrol Augments Paclitaxel Treatment MDA-MB-231 & MDA-MB-
231/PacR Cells ..............................................................................................................77
Figure 26. Resveratrol Can Attenuate Paclitaxel Treatment with Short-term,
Simultaneous Treatment ................................................................................................80
Figure 27. The Combination of Resveratrol and Paclitaxel is not Synergistic. ................81
Figure 28. ABCB1 & CYP2C8 are overexpressed in MDA-MB-231/PacR & MDA-MB-
231/PacR-Hi Cells .........................................................................................................85
Figure 29. Inhibition of P-glycoprotein & CYP2C8 Re-sensitize MDA-MB-231/PacR
Cells to Paclitaxel ..........................................................................................................86
Page 12
xii
LIST OF ABBREVIATIONS
ABC
Akt
AMPK
ANOVA
AP-1
ATP
BCA
Bcl-2
Bcl-xL
BCRP
BRCA
BSA
CAM
cAMP
cDNA
CBP
COX-2
CT
CYP
DAPI
DBC1
DCIS
DMEM
DMSO
ATP-binding cassette
protein kinase B
adenosine monophosphate-activated protein kinase
analysis of variance
activator protein 1
adenosine triphosphate
bicinchoninic acid
B-cell lymphoma 2
B-cell lymphoma-extra large
breast cancer resistance protein
breast cancer susceptibility protein
bovine serum albumin
complementary and alternative medicine
cyclic adenosine monophosphate
complementary deoxyribonucleic acid
CREB-binding protein
cyclooxygenase-2
threshold cycle
cytochrome p450
4’,6’-diamino-2-phenylindole
deleted in breast cancer 1
ductal carcinoma in situ
Dulbecco’s Modified Eagle Medium
dimethyl sulfoxide
Page 13
xiii
DNA
DNase
ECL
EDTA
EGTA
EGFR
ER
FAS
FITC
HBSS
HER2
HRP
IC50
IP
MAP
MAPK
MBC
MDR1
mRNA
MRP1
NFκB
NP-40
OHP
p21
p53
P-AMPK
deoxyribonucleic acid
deoxyribonuclease
enhanced luminol-based chemiluminescent
Ethylenediaminetetraacetic acid
ethylene glycol tetraacetic acid
epidermal growth factor receptor
estrogen receptor
apoptosis antigen 1
fluorescein isothiocyanate
Hank’s balanced salt solution
human epidermal growth factor receptor 2
horseradish peroxidase
half maximal inhibitory concentration
immunoprecipitation
microtubule-associated protein
mitogen-activated protein kinase
metastatic breast cancer
multidrug resistance protein 1
messenger ribonucleic acid
multidrug resistance-associated protein 1
nuclear factor kappa-light-chain-enhancer of activated B cells
nonyl phenoxypolyethoxylethanol
hydroxypaclitaxel
cyclin-dependent kinase inhibitor 1
cellular tumor antigen p53
phosphorylated-adenosine monophosphate-activated protein kinase
Page 14
xiv
PBS
PBST
PCR
P-gp
PI
PKA
PR
PVDF
qPCR
RES
RIPA
RNA
RNase
rpm
RT-PCR
SDS
siRNA
SIRT1
SLC
SLCO
TBE
TBST
TNBC
Tris
VEGF
XIAP
phosphate buffered saline
phosphate buffered saline with tween
polymerase chain reaction
P-glycoprotein
propidium iodide
protein kinase A
progesterone receptor
Polyvinylidene fluoride
real-time, quantitative polymerase chain reaction
resveratrol
radioimmunoprecipitation assay buffer
ribonucleic acid
ribonuclease
revolutions per minute
reverse transcriptase polymerase chain reaction
sodium dodecyl sulfate
small interfering ribonucleic acid
sirtuin 1
solute carrier
solute carrier organic anion transporter
Tris/Borate/EDTA
Tris buffered saline with tween
triple negative breast cancer
tris(hydroxymethyl)aminomethane
vascular endothelial growth factor
inhibitor of apoptosis protein 3
Page 15
1
CHAPTER 1: INTRODUCTION and LITURATURE REVIEW
I. Breast Cancer
Cancer is a diverse group of diseases that are characterized in general by
uncontrolled cell growth [1]. Although all cancers involve deregulation of genes that
control cell growth, there are a wide range of causes and genes involved that are often
specific to the tissue of origin. Though some of these genetic variations are hereditary,
90-95% are sporadic [2]. The tissue from which the abnormal cells originate identifies
cancers though it may spread to many parts of the body, denoting metastatic disease.
Cancer originating from the breast, known as breast cancer, is the second most
common cancer and is the fifth cause of cancer deaths in the world [3, 4]. In the United
States, breast cancer is the second leading cause of cancer death among women [2].
One in eight women in the United States will develop breast cancer in their lifetime, and
of these, approximately fifteen percent will succumb to the disease [5]. It was estimated
that in 2013 alone more than two hundred thousand women and two thousand men
would be diagnosed with breast cancer, and more than forty thousand people would die
from the disease [5].
Breast cancers are almost exclusively carcinomas, which derive from epithelial
cells; breast sarcomas, which derive from mesenchymal cells, are possible, though they
are rare [6]. Carcinoma breast cancers can be divided into two main types: ductal
carcinoma in situ (DCIS) and metastatic breast cancer (MBC). DCIS originates from the
breast duct linings and is a non-invasive cancer, which may or may not ever progress to
an invasive cancer. It has been suggested that only approximately one-third of DCIS
cases will progress making the identification of the most likely subtypes to progress
crucially important [7]. MBCs are cancers that have broken through the ductal or
Page 16
2
glandular tissue from which they originated and have grown into the surrounding tissue.
The stage of the disease is important for prognosis and treatment options and is
determined by three measures: tumor size and distance of spreading within the breast,
the spread to nearby lymph nodes, and the presence of distant metastases. Staging is
ranked from 0 to IV with stage 0 being in situ and stage IV being the most advanced
invasive cancer. Finally, breast cancers are defined by sub-type. Breast cancer sub-type
is loosely defined by the expression of estrogen receptor (ER), progesterone receptor
(PR), and whether or not the tumor overexpresses human epidermal growth factor
receptor 2 (HER2). The luminal A subtype makes up approximately 40% of breast
cancers and generally consists of ER+ and/or PR+ and HER2- tumors that are slow-
growing and less aggressive [8]. The luminal B sub-type represents 10-20% of breast
cancers most of which are ER+ and/or PR+ with either overexpression of HER2 or a
high proliferation rate [8, 9]. The HER2-enriched sub-type is characterized by ER- and
PR- cancers that overexpress HER2 and are highly invasive and aggressive [8]. Finally,
10% to 20% of breast cancers are basal-like, which have the worse prognosis of all sub-
types [9]. The majority of basal-like breast cancers are triple negative breast cancers
(TNBC), which are ER-, PR-, and do not overexpress HER2 [10].
There are many known risk factors for breast cancer. The most important risk
factors for women to develop breast cancer relate to life-long hormone exposure and
include: menopausal status, the age of menopause and menarche, and time of
pregnancies. One of the most important risk factor for breast cancers, as for many other
cancers, is age; risk increases with increasing age. Personal or family history of breast
cancer is another major factor increasing risk of developing breast cancer. There are
inherited genetic mutations, such as in the BRAC1 and BRCA2 genes, which increase
the risk for breast cancer. Although these mutations are only present in 1% of the
population, it is estimated that 5-10% of breast cancers result from these mutations and
Page 17
3
so are considered inherited rather than sporadic [11]. Due to knowledge of these risk
factors, women at high risk for breast cancer can be treated with tamoxifen, an estrogen
receptor antagonist, or prophylactic surgery to prevent the development of the disease.
The recent decreases in mortality for breast cancer have been attributed to both early
detection, promoted by awareness and regular screening, and improvements in
treatment [12].
Treatment options are dependent on the stage and subtype of breast cancer [13].
Surgical removal of the tumor is almost always the first treatment for breast cancer; the
only exception to this is high stage, inoperable tumors that are first treated with
chemotherapy, known as neaoadjuvant treatment, in an attempt to shrink the tumor and
to make surgery a treatment option. There are two different options of breast cancer
surgery: breast-conserving, removal of the tumor only, and total mastectomy, removal of
all breast tissue. Choice between these surgeries is determined by the stage of disease
and risk factors present. The treatment that follows surgery is dependent on the surgery
performed, the stage and the cancer type. DCIS is treated with tamoxifen after a total
mastectomy and with tamoxifen and radiation therapy after breast-conserving surgery.
Stage I, II, and some stage III cancers are initially treated similarly to DCIS, but adjuvant,
or post-surgery, chemotherapy and targeted treatments are added to the possible
tamoxifen and radiation treatment. The combination of treatments is determined by the
status of the axillary nodes, sub-type of the cancer, menopausal status of the patient,
and RNA expression profiling information. More aggressive treatment is necessary in
axillary node- positive and pre-menopausal patients. For the remaining stage III and all
stage IV cancers, many tumors are inoperable. Treatment often includes hormone
therapy, targeted therapies and chemotherapy simultaneously. Radiation therapy and
surgery are also important parts of treatment though the timing of these treatments is
less clear than in lower staged cancers.
Page 18
4
For patients with TNBC, surgery along with radiation and traditional
chemotherapy are the standard of care as discussed above. However, although great
strides have been made over the last decade with targeted therapies, therapies that
directly target ER and HER2, these therapies are ineffective in TNBCs, which lack ER
and do not overexpress HER2. Due to the lack of targeted therapies, these patients
have a poor prognosis [5].
A. Triple Negative Breast Cancer (TNBC)
TNBCs are associated with lower survival rates than other breast cancers [14].
Partially this is due to the recently decreased mortality rates of other breast cancers
resulting from improvements of treatments that are not available to patients with TNBCs.
Interestingly, pathologically complete response rates are higher in triple negative
compared to other breast cancer sub-types [15]. However, TNBCs are highly aggressive
and more likely than other sub-types to recur which result in lower survival rates [16]. A
common measure of the aggressiveness of cancer is the differentiation status. Cancers
that are not well differentiated, or look very different from the tissue of origin cells, tend
to grow much faster and therefore spread faster [17]. TNBCs are much more likely to be
poorly differentiated or undifferentiated compared to other breast cancers [18].
TNBCs are also associated with younger age and more advanced stage at
diagnosis. In addition, TNBCs are more common and have worse prognosis among
African Americans and Hispanics compared to other ethnic groups [18]. Some of this
health disparity is undoubtedly due to differences in access to medical care, treatment or
socioeconomic status [19-21]. However, it has been shown that access to medical care
cannot completely remove this disparity [22-24], and there is a biological disadvantage
for survival in African American women [10, 25, 26].
Page 19
5
There are several active areas of research working toward improved treatments
for TNBCs. The use of platinum agents in combination with standard therapy is currently
being studied in cancers that have a mutation in BRCA1, a gene important in double-
strand DNA break repair, as these cancers cannot repair the damage to DNA caused by
platinum agents [27, 28]. This may be a promising treatment regimen in TNBCs as
cancers with BRCA1 mutations are often TNBCs. PARP inhibitors have also shown
some success, but will possibly only work in BRCA1 and BRCA2 mutant cancers as they
rely on synthetic lethality, which is the targeting of multiple pathways that would
compensate if only one were targeted [29, 30]. An anti-epidermal growth factor receptor
(EGFR) antibody has also been attempted, though the response rate was only 20% as
the EGFR pathway was deactivated by the treatment in only 25% of the cases
suggesting compensating mechanisms [31]. In addition, there is promise in the use of
anti-angiogenic therapies for TNBCs [32, 33]. While all of these approaches are currently
in clinical trials, none of these have yet made it to the clinic.
Due to health disparities, poor prognosis and lack of treatments, more research
needs to be done to improve the treatment of TNBCs. In addition to these problems,
resistance to chemotherapy is a concern for all cancers. However, in TNBCs, which rely
entirely on chemotherapy treatment, drug resistance is of even larger concern. Though
the pathologically complete response rate is high in TNBCs at 22%, the prognosis for
cancers that do not respond to chemotherapy is very poor [34]. This suggests a high
level of intrinsic resistance. Interestingly, approximately one third of metastatic breast
cancer patients with intrinsic taxane resistance are patients with TNBCs [35].
Furthermore, the high rate of recurrence among TNBCs suggests an increased
opportunity for acquired multi-drug resistance.
Page 20
6
B. Cancer Drug Resistance
Cancer drug resistance limits the effectiveness of chemotherapeutics. It is
estimated that 90% of treatment failure in metastatic cancers is due to drug resistance
[36]. There are two different types of drug resistance: intrinsic and acquired [37]. Intrinsic
drug resistance denotes that treatment is ineffective because resistance-mediating
factors were already present in a tumor prior to treatment. Acquired resistance develops
during treatment by adaptive responses or mutations in a previously sensitive tumor;
resistance can also be acquired by the selection of a resistant population of cells, which
can cause recurrence.
There are many known mechanisms of cancer drug resistance (Figure 1). Many
mechanisms affect the balance of drug entry and exit to prevent drug accumulation, as
accumulation of chemotherapeutics in cells is crucial for drugs to bind to their molecular
targets. Cancer cells can alter drug accumulation by inhibiting drug uptake or, more
commonly, increasing drug efflux. However, there are other ways of achieving a
decrease of drug that is free to bind to molecular targets such as compartmentalizing the
drug away from the target or altering drug metabolism so the active form of the drug is
not available. Aside from drug availability, alteration of drug targets, DNA damage repair
mechanisms and cell crisis response mechanisms can all lead to cancer cell survival.
Increases in drug targets may allow cancer cells to compensate in the presence of a
drug. In addition, the mutation of a drug target that inhibits drug binding can render a
drug ineffective. Cancer cells are well known to hijack endogenous mechanisms to
promote survival. A cancer cell that is capable of repairing DNA damage efficiently may
be resistant to drugs that directly cause DNA damage. In addition, cancers that have
hijacked cell cycle arrest or apoptosis pathways may be capable of escaping the cell
death that chemotherapeutics should cause.
Page 21
7
Figure 1. Mechanisms of Cancer Drug Resistance. Possible mechanisms by which
cancer cells can evade drug-induced cell death. Resistance in cells may be a single
mechanism or a combination of mechanisms (D=Drug; D*=Drug metabolite). Originally
published in [38].
Due to toxicity to normal cells, doses of chemotherapeutics may be limited, which
rules out any possibility of simply giving more drug to overcome some of these
resistance mechanisms. However, there are several methods to overcome resistance to
a drug [39]. Treating with a different drug to which the cells are sensitive is a simple
Page 22
8
approach. However, many drug resistance mechanisms can cause multidrug resistance,
conferring resistance to multiple drugs, limiting this approach. To avoid this problem,
patients are standardly treated with a “cocktail” of chemotherapy drugs providing multiple
drugs at once with different modes of entry and cellular targets and so a multiple hit
approach, maximizing cancer cell killing. Another possibility to overcoming drug
resistance is combining chemotherapy with another drug that will make the cells more
sensitive to the original drug or otherwise enhances the effect of the chemotherapeutic.
These combination therapies are molecularly targeted to improve response to
chemotherapeutics and have shown varying levels of success [37].
It is important to study resistance of specific drugs in specific cancers as both
factors impact the development and, therefore, the reversion of drug resistance. One of
the first line treatments for breast cancer is the mitotic inhibitor from the taxane drug
class, paclitaxel. Paclitaxel is a very successful drug; however, some breast cancers are
intrinsically resistant and others can acquire resistance to the drug. Consequently, there
is a need for methods to overcome paclitaxel resistance particularly in TNBCs, which
rely heavily on chemotherapy treatment.
II. Paclitaxel
Taxanes are a class of microtubule-stabilizing agents or mitotic inhibitors [40].
Microtubules are protein polymer filaments, which are important in cellular functions
such as cell shape, movement, signaling, division and mitosis [41]. These filaments are
hollow cylinders made up of α and β tubulin heterodimers and display dynamic instability
and treadmilling behavior [42]. Dynamic instability is the process of constant lengthening
and shortening of the microtubules by the association and dissociation of α/β tubulin; this
process can be held in stead state by balancing the lengthening and shortening of the
Page 23
9
microtubules or can be overpowered by one or the other causing an imbalance in the
process [41, 43, 44]. Treadmilling describes the lengthening of one end of the tubule
concurrent with the shortening at the other end [45]. These processes occur in all cells
and are regulated by microtubule-associated proteins (MAPs) such as tau, which binds
and stabilizes microtubules [46]. The dynamic polymerization and depolymerization of
microtubules is essential for cell division and chromosome segregation during mitosis
[43]. Taxanes bind to β-tubulin on a site that is only accessible when tubulin is
assembled [42, 47, 48]. When taxanes are bound to assembled tubulin, they suppress
microtubule dynamics by stabilizing the microtubule and preventing disassembly [41].
This stabilization prevents the cells from undergoing mitosis and induces mitotic
catastrophe and apoptosis [41, 49].
The first drug in the taxane family to be discovered, paclitaxel, was first isolated
in 1969 from the bark of the pacific yew tree (Taxus brevifolia) [50]. After decades of
improving synthesis methods, Taxus species cell cultures are now used with elicitor
compounds to produce paclitaxel [51]. However, the difficulty of producing paclitaxel
continues to create a shortage of the drug [52]. Intravenously administered paclitaxel
presents nonlinear pharmacokinetics, is metabolized in the liver and is eliminated
through the biliary system [53, 54]. Due to the high hydrophobicity of paclitaxel, it must
be administered in a formulation of alcohol and Cremophor ® EL (polyoxyethylated
castor oil) to assist delivery; this formulation can cause severe hypersensitivity reactions;
though, the frequency of these reactions has been reduced with shorter infusion times
and premedication with corticosteroids and anti-histamines [52]. In addition, paclitaxel
has severe side effects such as neutropenia and neuropathy that significantly limit
dosage [55]. However, paclitaxel can be administered with acceptable toxicity and is still
considered a successful treatment for non-small-cell lung, ovarian and breast cancers in
some patients [56-58].
Page 24
10
Paclitaxel is a first-line treatment for breast cancer and has a response rate
between 25 and 69% [59]. Paclitaxel can be given as a single agent but is often given in
combination with an anthracycline, such as doxorubicin, as it improves disease-free
survival and overall survival [60, 61]. In addition, paclitaxel is often given with an
anthracycline and an alkylating agent, such as cyclophosphamide [62]. Paclitaxel given
as a 1-hour infusion weekly, rather than as a 3-hour infusion every 3 weeks, improves
both disease-free survival and overall survival [63]. For HER2 positive breast cancers,
neoadjuvant paclitaxel and doxorubicin followed by cyclophosphamide, methotrexate,
and fluorouracil given in combination with adjuvant and neoadjuvant trastuzumab, a
HER2 inhibitor, improves clinical and pathological response by 22% [64]. Paclitaxel is
currently in a clinical trial, CALGB-40603 (NCT00861705), in TNBCs to evaluate
neoadjuvant chemotherapy combination of carboplatin with the standard paclitaxel and
doxorubicin plus cyclophosphamide treatment. Although paclitaxel is an efficacious drug,
resistance is a problem as with all cancer drugs tested to date.
A. Paclitaxel Resistance in Breast Cancers
Both intrinsic and acquired taxane resistance are common in cancers [45]. There
are many mechanisms of paclitaxel resistance that have been previously shown to
potentially be relevant in breast cancers. Importantly, though all of these mechanisms
have been seen in vitro, none have yet been convincingly shown to be a clinically
relevant mechanism of paclitaxel resistance in breast or any other cancer with the
exception of the up-regulation of multidrug resistance proteins [65, 66]. Due to this
clinical relevance, the up-regulation of multidrug resistance proteins is of particular
importance and will be discussed at length. In addition, the next most likely mechanism
to be relevant to resistance is changes in drug metabolism, which will also be discussed
Page 25
11
at length. Resistance through drug target alteration has been shown with mutations in
the paclitaxel target protein, β-tubulin [67-69]. In addition, changes in the expression
profile of the seven different β-tubulin isotypes can affect paclitaxel action as isotypes
βIII and βIV require more bound paclitaxel to stabilize the microtubule [70]. Variation of
the expression of MAPs, which regulate microtubule dynamics, can also confer
resistance to paclitaxel. Examples are high levels of microtubule stabilizing proteins,
such as tau and stathmin, or low levels of destabilizing proteins, such as MAP4 [71-73].
Deregulation of the cell cycle, specifically in the spindle assembly checkpoint, and
associated proteins can also lead to resistance [74-79]. Furthermore, changes in levels
of apoptosis-related proteins such as p53, Bcl-2, Bcl-xL, Akt, survivin, XIAP, and NFκB
to inhibit apoptosis can cause resistance [80-85]. The upregulation of HER2 can also
confer paclitaxel resistance, which seems to show some clinical significance in the
beneficial effect of combining trastuzumab with paclitaxel [86]. It is important to note that,
for the present work, the upregulation of HER2 and the changes of p53 will not be
mechanisms of concern, as the cell line used in this study does not overexpress HER2
and harbors mutant p53 protein. Though HER2 overexpression would not be an
important clinical factor for TNBCs, it is possible that changes in p53 could be important
clinically for TNBCs that harbor wild-type p53 protein. Importantly, most of these
mechanisms have yet to be shown to have clinical relevance with the exception of
multidrug resistance proteins and the alteration of drug metabolism, which are the most
likely candidates for a resistance mechanism
B. Multidrug Resistance Proteins
ATP binding cassette (ABC) proteins are transporters that utilize ATP to transport
a specific substrate or group of substrates across the cell membrane. Substrates for
Page 26
12
these proteins can be metal ions, sugars, amino acids, peptides, proteins, hydrophobic
compounds and metabolites [87]. These transporters are believed to operate by
alternating access from one side of the membrane to the other by a conformational
change [88]. ATP hydrolysis provides the energy to switch the protein from facing inside
the cell when a substrate is bound to outward facing to then release the substrate. Drug
interactions are a possibility for transporters with multiple substrates as substrates can
act as competitive inhibitors [38]. ABC transporters that transport cancer drugs have
been shown to be important in resistance by preventing cancer drug accumulation in
cells. There are 48 known human ABC genes that are separated into seven distinct
subfamilies based on organization of domains and amino acid homology which leads to
differences in substrate specificity [87]. For example, the MDR proteins transport a
variety of hydrophobic compounds whereas the MRP proteins transport organic anions,
such as glutathione conjugates of compounds [87]. P-glycoprotein (P-gp, MDR1,
ABCB1), BCRP (ABCG2), and MRP2 (ABCC2) have all been shown to be widely
expressed in tumors and linked to drug resistance [89, 90]. The ability to inhibit these
proteins has the potential to greatly improve chemotherapy treatment and so have been
studied for many years [91].
P-gp was the first ABC efflux pump to be identified and has been studied
extensively. P-gp is located on chromosome 9q31.1 and is ubiquitously expressed,
though it is most prominently expressed in the liver and blood-brain barrier. P-gp is a
highly promiscuous transporter, which binds electrically neutral and positively charged
hydrophobic drugs [38]; hundreds of substrates have been identified, including several
chemotherapeutics [89, 90]. It has been shown that treatment with several anti-cancer
drugs in colon cancer cells can induce pregnane X receptor, which induces P-gp
expression and decreases drug accumulation [92]. In addition, inhibition of P-gp has
Page 27
13
been shown to restore drug sensitivity to resistant cells in culture that overexpress the
protein [93].
Notably, paclitaxel is a substrate of P-gp, and P-gp has been implicated in
paclitaxel resistance in breast cancer [94]. The analysis of 60 cells lines revealed that
the lower the P-gp gene expression, the higher the sensitivity to paclitaxel [95]. In cell
lines derived from breast carcinoma specimens, a similar correlation between high P-gp
expression and high paclitaxel resistance was also shown [96]. P-gp is expressed in
normal breast tissue, though usually in lower levels than in in cancer tissue [97].
Approximately 40% of untreated breast cancers express P-gp compared to 52% of
cancers that have been treated with a P-gp substrate [97]. Interestingly, the level of P-gp
positive cancers is higher in cancers within one month post-treatment at 56% compared
to only 36% of cancers more than one month post-treatment suggesting that the effect of
chemotherapy is transient [97]. Perhaps most striking is a comparison of tumors pre-
and post-neoadjuvant treatment; only 43% of tumors were positive for P-gp prior to
treatment compared to 64% positive afterward, which is a 37% induction of P-gp
expression [97]. High expression of P-gp has been associated with poor response of
locally advanced breast cancer to neoadjuvant chemotherapy, though the therapy in
these studies did not include paclitaxel [98, 99]. Of critical importance, tumors with high
P-gp expression demonstrate faster drug clearance and lower drug accumulation in the
tumor [100-105].
Thus far, no P-gp inhibitors have made it to clinical use in combination with
chemotherapeutics, though many clinical trials have been conducted with various
inhibitors and chemotherapy regimens. When pooled, four studies of the P-gp inhibitor
verapamil in advanced breast cancer patients refectory to anthracycline-containing
treatment regimens, showed 15% re-sensitization [97]. However, later studies proved
verapamil to have a dose limiting and life-threating cardiotoxicity [106]. The P-gp
Page 28
14
inhibitor, biricodar, showed a partial response of 11% in combination with paclitaxel in
locally advanced breast cancer patients refractory to paclitaxel [107]. Two other
inhibitors, zosuquidar and tariquidar, have shown disappointing clinical results in breast
cancer suggesting there may be redundancy in efflux pumps that must be addressed
[37, 108, 109]. Recently the importance of the dynamics between P-gp and the
membrane has become apparent, which may lead a new generation of inhibitors [91]. In
summary, although there have been only minor clinical successes in reversing drug
resistance with P-gp inhibitors, P-gp remains an important potential target to re-sensitize
breast cancers that are refractory to or likely to be resistant to paclitaxel treatment as P-
gp has been shown to be an important factor in tumors and targeting of P-gp can
reverse some clinical drug resistance.
C. Drug Metabolism
Drug metabolism is separated into three phases although not all drugs have to
go through all phases. Phase I metabolism reactions are often catalyzed by cytochrome
P450 (CYP) enzymes and include oxidation, reduction, hydrolysis, cyclization, or
decyclization reactions. Some of the resulting polar metabolites can be excreted at this
point. Otherwise, the metabolite will have to undergo a phase II metabolism reaction,
which include methylation, sulfation, acetylation, glucuronidation, glutathione
conjugation, or glycine conjugation, catalyzed by a transferase to produce highly polar
conjugate molecules that are usually less active and must be actively transported due to
the addition of large anionic groups [110]. In phase III metabolism, these conjugates can
be further metabolized and excreted from cells by ABC transporters with the anionic
groups acting as an affinity tag for the transporters [111, 112]. Outside of the cell the
conjugates and metabolites are either further metabolized or excreted [113].
Page 29
15
CYP enzymes are a family of mono-oxygenases, which catalyze organic
substance oxidation. Most commonly, CYPs insert one oxygen atom into the aliphatic
position of an organic substrate and reduce the other oxygen atom to water [114]:
RH + O2 + NADPH + H+ → ROH + H2O + NADP+
Generally membrane-associated proteins , human CYPs are located primarily in the
endoplasmic reticulum but can also be located in the inner membrane of the
mitochondria or the plasma membrane [115]. These enzymes are present in most
tissues, though the expression is specific to each CYP and its function [116]. CYPs can
play important roles in the formation and metabolism of lipids, steroids or xenobiotic
substances such as toxic chemicals and drugs and may metabolize one, few or many
substrates [117]. Total CYP activity accounts for approximately 75% of total drug
metabolism [118]. Although some drugs can be activated by this metabolism, most drugs
are deactivated by CYPs.
Changes in drug metabolism mechanisms in cancer cells can play a role in drug
resistance [36, 37]. For drugs that must undergo metabolism for activation, a decrease in
metabolism will decrease the amount of active drug available inside cells rendering the
cells more resistant to the drug. More commonly drugs are inactivated by metabolism,
and with an increase of metabolism there is a decrease in the amount of active drug
available to bind to intracellular targets. Therefore, a decrease or increase of metabolism
enzyme expression or activity could affect how cancer cells react to drugs. Changes in
these enzymes can lead to cancer drug resistance or higher sensitivity to drugs.
Therefore, manipulating these mechanisms with combination therapies provides a
strategy for overcoming drug resistance. Conversely, it is also possible that drug
combinations could dangerously increase drug toxicities. Importantly, this makes the
study of individual drug metabolism pathways in individual cancers important to
overcoming cancer drug resistance as well as predicting harmful drug-drug interactions.
Page 30
16
Paclitaxel has two main metabolites in humans: 6α-hydroxypaclitaxel (6α-OHP)
and C3’-hydroxypaclitaxel (C3’-OHP) (Figure 2). 6α-OHP is formed by CYP2C8 and C3’-
OHP is formed by CYP3A4 [119]. 6α-OHP has been shown to be 30-fold less active than
paclitaxel [120], and C3’-OHP shown to have no activity [121]. 6α-OHP is the most
important metabolite making up approximately 60% of excreted paclitaxel compared to
only 10% of C3’-OHP [122]. There is one other metabolite, which has very low
abundance and was originally reported to be di-hydroxypaclitaxel [123] but was shown in
a later study to be C2-hydroxypaclitaxel formed by CYP3A4 [124]. It has also been seen
that induction of CYP3A4 due to concomitant drug use can change the metabolite profile
of paclitaxel in a patient [54]. Crucially, it has been shown that it is possible for drug
interactions to affect CYPs and, therefore, the efficacy of paclitaxel [125]. Enhanced
ability of a cell to metabolize paclitaxel would protect a cell from the toxic effects of
paclitaxel, and due to the larger contribution of CYP2C8 in paclitaxel metabolism it is
likely that this enzyme would be of greater importance. Consequently, overexpression of
CYP2C8 in a cancer cell could explain a high tolerance for paclitaxel and so confer
resistance.
Figure 2. Metabolism of Paclitaxel in Humans. The major metabolism pathway through
CYP2C8 produces 6α-hydroxypaclitaxel, a 30-fold less active metabolite. The
metabolites produced by CYP3A4 are inactive and much less abundant. Adapted from
[124, 126].
Paclitaxel
6α-hydroxypaclitaxel C3’-hydroxypaclitaxel
CYP2C8 CYP3A4
C2-hydroxypaclitaxel
Page 31
17
The CYP2C8 gene is located on chromosome 10q24 along with the other
CYP2C family members [127]. The CYP2C8 gene has several polymorphisms, and
though the high inter-individual variability in paclitaxel pharmacokinetics is well known
[128], it has yet to be strongly linked to CYP2C8 polymorphisms [129]. Interestingly, it
has been suggested that the lack of consensus on a link between paclitaxel
pharmacokinetics and CYP2C8 polymorphisms may be due to the lack of studies that
simultaneously consider polymorphisms of ABCB1 and CYP2C8. CYP2C8 protein is
highly expressed in the human liver making up approximately 7% of the total microsomal
CYP content [130, 131]. CYP2C8 has many endogenous and exogenous substrates and
carries out the phase I oxidative metabolism of at least 5% of drugs cleared by the liver
[132]. CYP2C8 metabolizes drugs in several drug classes such as thiazolidinediones,
meglitinides, NSAIDs, anti-malarials and taxanes; CYP2C8 is often a secondary
mechanism of metabolism, but it can be the primary mechanism, as it is with paclitaxel,
choloroquine, rosiglitazone and repaglinide [129]. In addition to the liver, CYP2C8 mRNA
has been shown to be expressed in several other tissues including the kidney, intestine,
adrenal gland, brain, mammary gland, ovary, heart and, notably, in breast cancer tumors
[116, 133-136]. Importantly, overexpression of CYP2C8 has been shown to contribute to
acquired paclitaxel resistance by increasing paclitaxel metabolism in colon cancer cells
with no contribution of CYP3A4 [137]. Taken together, these data suggest alteration of
paclitaxel metabolism may be an important mechanism of paclitaxel resistance in breast
cancers.
III. Dietary Supplements
Complementary and alternative medicine (CAM) encompasses a wide range of
health treatments that are not used in conventional medicine and are often supported by
Page 32
18
little or no scientific evidence. In western countries, 40-50% of all cancer patients use
some type of CAM [138, 139]. The most common user is female, highly educated and of
high socioeconomic status. Therefore, the most prevalent CAM users are women with
breast cancer [139, 140]. There are many reasons for people to choose CAM therapies;
stress reduction, decreasing side effects, improving strength and the immune system,
the desire of a ‘more holistic’ treatment and autonomy are all important factors reported
[139, 141-145]. In addition, many hope to prevent cancer recurrence or to fight cancer
directly. CAM therapies present many problems, which are confused by the fact that very
few people disclose their CAM use to their oncologists [146, 147]. CAM therapies can
cause side effects of their own accord, but they can also cause dangerous drug
interactions. Perhaps the most dangerous problem for cancer patients is the postponing
or omission of proper treatment. Finally, CAM therapies can have a large financial
impact on both individuals and health care systems.
Several of the most common CAMs used by breast cancer patients fall into the
dietary supplements category [148]. The category of dietary supplements encompasses
a range of products from vitamins to botanicals. In the United States, dietary
supplements are a multi-billion dollar per year industry [149]. The use of dietary
supplements has been steadily rising in the United States. One study in 2002 showed,
14% of the general population and 16% of prescription drug users concurrently take
some kind of dietary supplement [150]. In 2005, it was estimated that the prevalence of
botanicals use in the United States is approximately 12.1-18.6% [151]. However, by
2011 it was reported that 50% of Americans reported using dietary supplements, and
approximately 20% of adults were using botanicals [152]. Importantly, dietary
supplements are not regulated like foods or drugs but instead fall under the Dietary
Supplement Health and Education Act of 1994, which restricts the authority of the FDA
over these products [153]. Therefore, many of these products have been insufficiently
Page 33
19
tested for safety, efficacy and often quality control. Though viewed by the public as
generally safe, there are many examples of botanicals causing harmful herb-drug
interactions [154].
However, botanicals can also have beneficial health effects and provide the basis
of many medications. It is estimated that from 1 in 3 to 1 in 2 of currently used drugs
were derived from plants [155]. Indeed, over 60% of clinically used anti-cancer agents
are derived from natural sources such as plants, marine organisms and microorganisms
[156]. Vinblastine and vincristine were discovered in the 1950s, which spurred an
extensive program initiated by the National Cancer Institute in 1960 producing most of
these discoveries including taxanes and camptothecins. However, since these
compounds have reached the clinic, no other plant-derived anti-cancer agents have
made it to general use [156].
To conclude, botanicals and their derivatives have the potential to be both
harmful and beneficial alone and in combination with prescription drugs. Considering
that women with breast cancer are the most common CAM users, more research is
needed to ensure the safety of patients taking botanicals. In addition, in light of the need
for more treatments, especially for TNBCs, more research is needed to determine if any
of these botanicals or their derivatives can improve treatments. Resveratrol is a highly
studied, botanically derived chemical of particular interest, which has been shown to
have a wide variety of health effects.
IV. Resveratrol
Resveratrol is made by a variety of plant species in response to fungal infection
or exposure to ultraviolet light, and therefore classified as a phytoalexin [157]. Assaults
cause a hormone response in plants, which induces gene expression of resveratrol
Page 34
20
synthase to produce resveratrol [158]. Resveratrol functions as a plant pathogen toxin as
well as and inducer of plant cell death when stress cannot be counteracted [159]. Due to
widespread production in plants it is also present in the human diet though in very low
amounts and is perhaps best known to be in grapes, peanuts and red wine [160].
Resveratrol is a polyphenol and a stilbenoid, a chemical with a stilbene backbone
(Figure 3). Highly lipophilic and insoluble in water, resveratrol is highly soluble in ethanol
and DMSO and so many studies are performed using one of these solutes [161]. It is
stable in solution and human plasma with the exception of extended exposure to light or
high pH environments [162].
Figure 3. Chemical Structure of Resveratrol. Trans-3,4’,5-trihydroxystilbene is a highly
lipophilic polyphenol stilbenoid.
Resveratrol is being studied for prevention or delaying progression of aging,
cardiovascular diseases, neurodegenerative diseases, as well as cancer prevention and
treatment [163]. Generally, the protective effects are produced with low nanomolar to
micromolar concentrations of resveratrol whereas anti-cancer effects are produced with
high micromolar concentrations. This biphasic effect of resveratrol coincides with
previous work showing that cancer cells treated with low concentrations of resveratrol
increase proliferation compared to higher concentrations that cause cancer cell death
Page 35
21
[164]. The anti-oxidant and anti-inflammatory effects of resveratrol seem to be important
factors for the beneficial cardiovascular, neuroprotective, and anti-aging effects [163].
Resveratrol demonstrates protective effects at low μM concentrations in relation to
multiple neurodegenerative disorders, which are a group of progressive disorders
sharing inflammatory status and accumulation of reactive oxygen species causing
neuron damage and death such as Alzheimer, Parkinson and Huntington Disease. The
anti-inflammatory effects, reduction of oxidative stress, inhibition of apoptosis, and
effects on neurological function are all important in neurodegenerative disease
protection effects of resveratrol [163]. There are many targets that have been shown to
be important in these actions many of which are also important in the cardioprotective,
anti-ageing and anti-cancer effects. Of particular interest is the involvement of the
activation of SIRT1 through the AMPK pathway, which is also important for the
cardioprotective effects [163]. For resveratrol-induced chemoprevention, regulation of
carcinogen metabolism as well as cell proliferation inhibition and apoptosis induction are
important [165]. Resveratrol has been shown to prevent or delay the onset of cancer
[166, 167]. In breast cancer, resveratrol has been shown to exhibit anti-initiation, anti-
promotion and anti-progression activities in both hormone-sensitive and hormone-
resistant breast cancers [168]. These effects of cancer prevention seem to be related to
xenobiotic metabolism regulation as well as anti-inflammatory, anti-proliferative and pro-
apoptotic effects [168]. Details of anti-cancer activity of resveratrol will be discussed at
length below. Despite extensive pre-clinical work with resveratrol, human safety and
efficacy studies are scarce [169]. However, many studies have been conducted
attempting to elucidate the metabolism and complicated pharmacokinetics of resveratrol
in humans.
Page 36
22
A. Resveratrol Pharmacokinetics
Resveratrol is metabolized very rapidly in humans [170]. Free resveratrol and its
metabolites are both highly bound to plasma proteins, which would suggests poor
availability [171]. However, it has been shown that protein-bound resveratrol can still be
transported into cells as free resveratrol through carrier-mediated transport [172]. The
predominate metabolites consist of two sulfated and two glucuronidated forms,
Sulfotransferases form the sulfated metabolites, and glucuronidated metabolites are
formed by the UDP-glucoronosyltransferases 1A family [173]. In humans, the sulfated
metabolite, resveratrol-3-O-sufate, is the most prominent [174]. Importantly, resveratrol
metabolites have shown little or no anti-cancer activity with the exception of some
resveratrol sulfates showing low cytotoxicity in breast cancer cells and one study
showing activity in colon cancer cells [175-178]. However, physiologically relevant
amounts of sulfate metabolites have been shown to be regenerated into resveratrol and
cause cell proliferation inhibition of cultured colon cancer cells through autophagy and
senescence [178]. Therefore, it is likely that any effects of resveratrol treatment are due
to resveratrol activity and not the activity of metabolites.
Resveratrol is very well tolerated in humans [179]. After 8 days of daily oral
resveratrol dosing in healthy volunteers, no toxicities presented with up to 1 gram per
day, and only mild gastrointestinal toxicities were observed with 5 grams per day. The
half-life of resveratrol has been seen to vary from 2.9 to 11.5 hours [180]. A seemingly
poor oral bioavailability, which has been attributed to poor intestinal absorption or
extensive intestinal metabolism, has been a major barrier to the potential clinical use of
resveratrol [181-184]. However, resveratrol demonstrates high intestinal absorption, as
approximately 70% enters enterocytes by passive diffusion in humans [185]. In rodents it
has been shown that resveratrol is highly metabolized in the enterocytes, and MRP2 and
Page 37
23
BCRP, but not P-gp, then excrete the resveratrol metabolites back into the intestinal
lumen limiting intestinal absorption [186, 187]. In addition, resveratrol is highly excreted
in urine, and has highly variable excretion in feces, which suggests the occurrence of the
enterohepatic cycle [185]. Enteric recirculation is further supported by a secondary peak
in resveratrol plasma concentration at 6 hours following the primary peak at 1 hour [185].
Interestingly, although resveratrol excretion shows high inter-individual variability, all the
subjects had a portion, between 2 and 30%, of resveratrol that was not recovered in
either the urine or feces; the fate of which was unknown. These phenomena create a
confusing picture of resveratrol pharmacokinetics, which has spurred interest in
resveratrol analogues and drug delivery systems to improve bioavailability.
The problem of bioavailability has been especially troubling for the anti-cancer
effects of resveratrol that only occur at high micromolar concentrations. However,
recently a series of studies have emerged suggesting that bioavailability may not be as
major of a problem as once believed. Previously, plasma levels of resveratrol and its
metabolites have been shown to be very low with gram doses resulting in only low
micromolar amounts in plasma [170]. However, a new study has shown plasma
concentrations of resveratrol metabolites in humans to be higher than previous
estimations due to a lack of metabolite standards [178]. Critically, this study showed in a
mouse model that the sulfated metabolite of resveratrol, which has the highest plasma
concentrations of all the resveratrol forms, enters cells and can be converted back to
free resveratrol. The uptake of the sulfate metabolite is likely dependent on anion
transporter SLC22A9 and anion-transporting polypeptides SLCO1B1 and SLCO1B3
[178]. This mechanism of resveratrol regeneration resulted in a sustained exposure to
resveratrol and suggests that resveratrol can be regenerated from conjugates as long as
they are present, which can be at least 24 hours [174]. At 1 gram of resveratrol per day,
20 to 30 μM concentrations of resveratrol sulfates can be attained in human plasma,
Page 38
24
which is within the range of inhibiting cell proliferation in cancer cells [179]. When
resveratrol and resveratrol metabolite levels were measured in the colorectal tissue of
colon cancer patients, resveratrol was shown to have accumulated to high micromolar,
up to 640 μM, amounts [188]. Although there has been considerable interest in
developing resveratrol analogs and delivery systems to promote delivery of efficacious
concentrations to target tissues, these studies suggest these extra efforts may not be
necessary.
B. Resveratrol Anti-cancer Pharmacodynamics
The anti-cancer effects of resveratrol have been extensively studied in many in
vitro and in vivo human cancer models. Resveratrol has been shown to inhibit
angiogenesis, invasion and metastasis, and cell proliferation and to induce cell cycle
arrest and apoptosis in various cancers [189, 190]. Interestingly, many of the effects of
resveratrol appear to be cell type specific. For example, the type of cell cycle arrest
caused by resveratrol, if any, is dependent on cancer cell-type [161]. Additionally, due to
phytoestrogen properties, resveratrol may stimulate growth in breast cancers that
express ER [191]; however, this effect has been contested [192]. This contradiction may
be explained by low resveratrol concentrations inducing proliferation whereas high
concentrations suppress proliferation [193]. Finally, resveratrol has been shown to cause
senescence, an essentially irreversible form of cell proliferation arrest [194], and
autophagy, the effect and relevance of which is unclear [195], in various cancer cells
[196]. Autophagy is a multistep process in which autophagolysosomes are formed so
cells can destroy proteins or damaged organelles; this process is normally used by cells
to promote survival during stress, however, it can also cause cells to undergo cell death
[197]. Although resveratrol inhibits proliferation and induces cell death in many cancer
Page 39
25
cells, the mechanisms through which resveratrol acts vary widely [161] (Figure 4). Some
of the pathways resveratrol has been commonly shown to inhibit are the NF-κB, MAPK,
and AP-1 pathways [161]. Resveratrol has also been shown to activate other pathways
such as the p53 and FAS pathways [161]. In addition, resveratrol has extensively been
shown to suppress protein kinases, growth factors, cell-cycle proteins as well as COX-2
and lipooxygenase [161]. Recently, evidence has shown that resveratrol has the ability
to target cancer stem cells, which are capable of self-renewal and differentiation and are
believed to the root of tumor heterogeneity [198], through inhibition of fatty acid synthase
[199], inhibition of pluripotency maintain factors and epitherlial-mesenchymal transition
[200, 201] and metabolic reprogramming [201]. With so many varied effects caused by
resveratrol, it is important to study the effects of resveratrol in different cellular
backgrounds.
A wide variety of resveratrol effects have been seen even within TNBC cell lines.
In MDA-MB-468 cells, resveratrol inhibited TGF-α, PC-cell derived growth factor and
insulin-like growth factor 1 receptor mRNA expression and increased TGF-β mRNA
[202]. In the 4T1 triple negative cell line, resveratrol inhibited proliferation in culture, but
in mice no inhibition of growth or metastasis was seen [203]. Most TNBC data has been
obtained using MDA-MB-231 cells. Proliferation inhibition by resveratrol in MDA-MB-231
cells has been attributed to a decrease of reactive oxygen species [204]. Resveratrol
has been shown to cause non-apoptotic cell death in MDA-MB-231 cells by decreasing
expression and kinase activities of positive G1/S and G2/M cell cycle regulators and
inhibiting ribonucleotide reductase activity with no effect on the low expression of p21,
p27 or mutant p53 levels and causing no cell cycle arrest [205]. In another study,
apoptosis was seen in MDA-MB-231 and attributed to an induction and increased
nuclear localization of COX-2; this study also saw an increase of p53 phosphorylation
though the significance of this is unclear considering the mutant status of p53 in these
Page 40
26
cells [206]. However, resveratrol-induced proliferation inhibition and apoptosis in MDA-
MB-231 cells has also been attributed to an increase of serine palmitoyltransferase and
neutral sphingomyelinase leading to ceramide accumulation [207]. Resveratrol has also
been shown to inhibit the promoter activity of NF-κB, a transcription factor often
constitutively active in cancer cells, in a dose dependent manner in MDA-MB-231 cells
[208]. Notably, resveratrol was shown to inhibit MDA-MB-231 tumor growth and cause
cell death as well as decrease extracellular VEGF, a marker of angiogenesis, in an
ectopic mouse model of TNBC [209]
Figure 4. Molecular Mechanisms of Resveratrol Anti-cancer Activity. Adapted from [161].
The known molecular targets of resveratrol in various human cancers are shown
grouped by type of target or physiological importance.
Resveratrol
Transcription Factors:
AR ↓ AP-1 ↓ NFκB ↓
β-catenin ↓ Egr-1 ↑
Cytokines: NAG-1 ↑ PC-GF ↓ TGF-β ↑
Cytokines: Rb ↓
Cyclin D ↓ Cyclin A ↓
Cdk2 ↑ Cyclin B1 ↓
p21Cip1/WAF1 ↑ p27kip1 ↑
Invasion & Metastasis:
IGF-1R ↓ Tissue Factor ↓
NQO-1 COX-2 ↓ iNOS ↓ 5-LOX ↑
VCAM-1 ↓ ICAM-1 ↓ VEGF ↓
Growth/ Apoptosis:
TGF-α ↓ EGF ↓ TNF ↓ FasL ↑ IL-1β ↓ Bax ↑ Bcl-2
Survivin ↓ p53 ↑ IL-6 ↓
Others: Ribonucleotide reductase ↓
DNA polymerase ↓ CYP1A1 ↓
Kinases: PKC ↓ Syk ↓ CKII ↓ PKD ↓
ERK1/2 ↓
Page 41
27
One mechanism of particular interest for resveratrol-induced apoptosis that has
been generated through various works is through SIRT1 activation (Figure 5).
Resveratrol is a well-known activator of the class III histone deacetylase protein, SIRT1.
Recently, it was shown that resveratrol acts through the cAMP/PKA/AMPK pathway
[210]. This pathway causes a phosphorylation event that dissociates SIRT1 from the
negative protein regulator Deleted in Breast Cancer 1 (DBC1) [211]. Furthermore, SIRT1
activation by resveratrol has been shown to directly deacetylate the survivin promoter,
decreasing survivin transcription [212]. Survivin is an inhibitor of apoptosis protein that
binds and inhibits activated pro-apoptosis caspase 3 and caspase 7. Decreased survivin
protein levels allow activated caspase 3 and caspase 7 to induce apoptosis as well as
paclitaxel-induced apoptosis [81]. This SIRT1/survivin mechanism provides one of many
possible mechanisms of action of resveratrol alone and in combination with other
treatments.
Page 42
28
Figure 5. Hypothesized Mechanism of Resveratrol Induced Apoptosis. A) The survival
pathway, which is hypothesized to be overactive in cancer cells, where DBC1 binds to
SIRT1 and renders SIRT1 inactive allowing for the transcription of survivin. Survivin can
then inhibit activated caspase 3 and 7 leading to cell survival. B) The hypothesized effect
of resveratrol on the survival pathway where action on the cAMP/PKA/AMPK pathway
causes SIRT1 and DBC1 dissociation. Free SIRT1 can then deacetylate the survivin
promoter, which silences survivin expression allowing activated caspase 3 and 7 to
cause apoptosis.
Survivin
DBC1
Survival
Caspase 3/7
SIRT1
SIRT1 Inactive
Survival Pathway Overactive in Cancer
Cells
Resveratrol
Caspase 3/7
SIRT1
Apoptosis
cAMP/PKA/AMPK
Survivin Transcription Silenced
Effect of Resveratrol on the Pathway
A B
Page 43
29
C. Resveratrol Combination Therapy
There is evidence to suggest that resveratrol has the potential to cause both
harmful and beneficial effects when combined with other drugs. Resveratrol is well
known to inhibit a variety of CYPs, which could cause both harmful and beneficial drug
interactions when taken in high doses [213]. One example of a potential positive CYP
interaction is resveratrol was shown to inhibit CYP17A1 and was suggested to be useful
in prostate cancer chemoprevention [214]. An example of a CYP interaction that could
cause beneficial or harmful effects is the ability of resveratrol to inactivate CYP3A4,
which has many substrates [215]. In addition, positive combination effects of resveratrol
and irradiation has been seen in multiple cancer cell lines [216]. Resveratrol has also
been shown to sensitize multiple cancer types to various chemotherapeutics and other
agents [217, 218].
Resveratrol has been shown to have a positive combination effect with paclitaxel
in Non-Hodgkin Lymphoma, multiple myeloma, non-small cell lung cancer, lung cancer
and human oral epidermoid carcinoma cells [217]. However, the combination effect was
attributed to different mechanisms including decreased Bcl-xL expression [219], an
increase in p21 [220], a decrease of survivin [221], and decreases in P-gp and Bcl-2
expression [222]. Conversely, it has also been shown that resveratrol can attenuate
paclitaxel effects in neuroblastoma and bladder cancer cells in other studies [223-225].
These attenuation effects were also attributed to different mechanisms depending on the
cell type such as decreased caspase-7 and caspase-3 expression, decreased PARP
cleavage, Bcl-2 activity, decrease of reactive oxygen species, and effects on the cell
cycle. Of particular interest, in one study resveratrol attenuated paclitaxel treatment in
some breast cancer cells such as triple negatives, but not other breast cancer cells
Page 44
30
[226]. These studies suggest resveratrol combination therapy may be cell type specific
and clearly more research in the area is warranted.
V. Preliminary Work and Study Objectives
In a previous study from our laboratory, resveratrol was shown to have a biphasic
effect on the growth of TNBC cells regardless of BRCA1 status [164]. An effect of
promoting cell proliferation at low resveratrol concentrations and inhibiting growth at high
resveratrol concentrations was observed by analysis of cell morphology, growth, survival
and cell cycle. Interestingly, cells containing truncated, non-functional, mutant BRCA1
were more sensitive to resveratrol than cells with wild-type BRCA1. The difference in
resveratrol effect suggests a role of BRCA1 in resveratrol action and further suggests
resveratrol may be particularly useful in the small subset of TNBCs with mutant BRCA1.
Notably, this data showed for the first time that low micromolar concentrations of
resveratrol could sensitize TNBC cells to paclitaxel (Figure 6). This positive combination
effect was not different between cells with mutant and wild-type BRCA1.
Page 45
31
Figure 6. Resveratrol Sensitizes HCC1937 Cells with Mutant or Wild-type BRAC1 to
Paclitaxel. From [164]. Surviving fraction of HCC1937 cells with mutant or wild-type
BRAC1 after a 24-hour simultaneous treatment of varying concentrations of paclitaxel
and 10 μM resveratrol (n=3). Error bars denote standard deviation. Alone 10 μM
resveratrol treatment had no effect on cell growth after 24 hours.
This work spurred our laboratory to formulate a hypothesis that resveratrol could
be used in TNBC cells both sensitive and resistant to paclitaxel to improve response to
paclitaxel. To study paclitaxel resistance in TNBCs a cellular model was developed that
mimics the selection of resistant cells in a tumor, which can lead to the recurrence of a
resistant tumor. The objectives of this study were to determine the effects of resveratrol
as a single agent and the effects of resveratrol in combination with paclitaxel treatment
in paclitaxel-sensitive and -resistant cells. Here data is presented that shows that
resveratrol induced cell proliferation inhibition, senescence, and apoptosis in paclitaxel-
sensitive and -resistant TNBC cells. Importantly, the data show that resveratrol can be
used in combination with paclitaxel to re-sensitize the resistant cells back to the parental
0
20
40
60
80
100
120
140
160
180
0 0.001 0.01 0.1 1
Surv
ivin
g F
ract
ion
(%
gro
wth
com
pare
d to
con
trol
)
Paclitaxel (mM)
1937+WT (-RES)
1937+WT (+RES)
1937 Mut (-RES)
1937 Mut (+RES)
Page 46
32
level and also to decrease the resistance of both resistant and parental cells below the
original parental level. This effect of resveratrol on the paclitaxel sensitivity of these cells
may be linked to the known ability of resveratrol to inhibit P-gp and CYP2C8 both of
which were found in this study to be involved in the paclitaxel-resistance of our model.
Overall, this work suggests that resveratrol can be used alone and in combination with
paclitaxel in TNBCs regardless of the status of paclitaxel sensitivity.
Page 47
33
CHAPTER 2: MATERIALS and METHODS
I. CELL CULTURE
A. Cell Culture and Reagents
MDA-MB-231 cells (ATCC; Manassas, VA) were cultured in DMEM media
(Corning cellgro; Corning, NY) with 10% Hyclone Cosmic Calf Serum (Thermo Fisher
Scientific; Waltham, MA) at 37°C, 5% CO2 and 95% humidity. For regular cell sub-
culture, cells were washed with 1X Hank's Balanced Salt Solution (HBSS) and removed
from the plate with 0.05% trypsin treatment for approximately 30 seconds. Resveratrol
and paclitaxel (Sigma-Aldrich; St. Louis, MO) were dissolved in DMSO and further
diluted with 1X HBSS. All treatments were conducted in the dark to preserve the stability
of both light-sensitive drugs.
B. Mycoplasma Testing
Cells were periodically tested with the PCR-based VenorGeM Mycoplasma
Detection Kit (Sigma-Aldrich; St. Louis, MO) per manufacturer’s instruction to ensure
mycoplasma contamination was not present. 100 μL samples of media from cell culture
were boiled at 95°C for 5 minutes, centrifuged and put on ice. 25 μL of PCR Mastermix
(1 U Taq Polymerase, and 10% each of 10X reaction buffer, primer/nucleotide mix, and
internal control) was mixed for each reaction. 23 μL of Mastermix was mixed with 2 μL of
sample, positive control or DEPC-water as a negative control. Samples were run on an
Mastercycler PCR machine (Eppendorf; Hamburg, Germany) with the following thermal
cycle program: 1 cycle 94°C for 2 minutes; 39 cycles 94°C for 30 seconds, 55°C for 1
Page 48
34
minute, 72°C for 30 seconds; cool down to 4°C. Samples were then mixed 5 μL to 1 μL
of 6X loading buffer and run on an ethidium bromide agarose gel (1.5% agarose in 1X
TBE, 0.02% ethidium bromide) for 20 minutes at 100V. The gel was then photographed
using a GDS-8000 gel imaging system (UVP; Upland, CA).
II. RESISTANT CELL LINE GENERATION
To generate the paclitaxel-resistant line, an intermittent, stepwise method of
treatment was used [227]. MDA-MB-231 cells were treated with the determined 24-hour
IC30 of paclitaxel for 3-4 days. The drug was then removed for 3-4 days before treating
again. This interval lasted for 2-4 weeks before the treatment was increased to the IC40.
This process was repeated until the cells were growing successfully under IC60 treatment
of paclitaxel. After these cells were obtained, they were no longer grown in the presence
of paclitaxel. Single-cell derived clones were obtained by limiting dilution in which cells
were serially diluted across a 96-well plate and single clones were expanded. Expansion
was conducted by trypsinization of cells and plating cells onto progressively larger
plates.
III. CELL PROLIFERATION ASSAYS
A. Methylene Blue Cell Proliferation Assay
Cells were plated on 96 well plates at 2,000-10,000 cells per well, allowed to
attach to the plate overnight, and treated with paclitaxel or resveratrol for 1-5 days. The
media was aspirated, and cells were fixed in methanol for 15 minutes and then stained
with 50 μL of 0.05% methylene blue stain (Ricca Chemical; Arlington, TX) for 10 minutes
Page 49
35
[228]. The plates were washed with deionized water, dried and de-stained with 100 μL of
0.5 M hydrochloric acid solution. The absorbance was then measured using a plate
reader at 610 nm. For IC50 determinations, cells were treated with a serial dilution of
paclitaxel or resveratrol. GraphPad Prism version 4.00 for Windows (GraphPad
Software; San Diego, CA) was used to calculate IC50 values.
B. Cell Count Proliferation Assay
To measure cell proliferation, total cell counts were completed. In each well of
12-well plates 15,000 cells were plated, allowed to attach to the plate overnight, and
treated with resveratrol or DMSO vehicle control. Cells were collected by trypsinization
and counted with a Z series Coulter Counter Cell and Particle Counter (Beckman
Coulter, Inc.; Pasadena, CA) at 24, 48 and 72 hours post-treatment.
C. Cell Survival Assays
Two colony formation assays were performed. First, a plating efficiency assay
was conducted as previously shown with modification [229]. Cells were plated at a
density of 3x10⁵ on T25 flasks, allowed to attach overnight, and treated with resveratrol
or DMSO vehicle control for 3 days. Cells were then collected by trypsinization and
plated on 6-well plates at 30 cells per well. Cells were allowed to grow for 17 days
undisturbed. Second, a clonogenic cell survival assay was conducted as previously
described with modifications [230]. Cells were plated in 6-well plates at 30 cells per well,
allowed to attach to the plate overnight, and treated with resveratrol or DMSO vehicle
control for 3 days. Treatment was then removed, and the cells were allowed to grow for
17 days undisturbed. For both experiments, after the 17-day incubation, plates were
Page 50
36
then washed with 1X HBSS and fixed with methanol for 15 minutes, stained with crystal
violet for 1 hour and washed with deionized water. Colonies consisting of 50 cells or
more were then counted and scored.
D. Checkerboard Drug Combination Assay
Combination assays were completed using a checkerboard method such that
cells plated onto 96-well plates at a density of 4,000 cells per well were treated for 5
days with a serial dilution of paclitaxel across the plate horizontally and a dilution of
resveratrol across the plate vertically. The plates were processed using the methylene
blue cell proliferation method as described above. It is important for the data analysis
that the serial dilution for both drugs is the same; for example, a one to two dilution was
used for both drugs. This provides constant drug ratios across the diagonal of the plate.
The amount of resveratrol used was the same for both cell lines (2.5-40 μM). The
amount of paclitaxel used was different for both cell lines. An amount of paclitaxel was
chosen to provide a full paclitaxel curve for each cell line. The parental MDA-MB-231
cells, therefore, were treated with less paclitaxel (0.244-31.25 nM) than the resistant
MDA-MB-231/PacR cells (3.906-500 nM). It is important to note that differences in drug
ratio were due to a change in paclitaxel concentration rather than resveratrol ratio.
However, as it is the drug ratios that are compared, paclitaxel concentrations used for
the two cell lines were chosen to provide four drug ratios in common between the two
cell lines. This allowed for direct comparison of effects of these drug ratios between the
two cell lines. The method can be used to determine if a drug combination is
antagonistic, additive, or synergistic by graphing the data as an isobologram with the
axes representing the concentration of one drug versus the other. For example, the IC50
value of resveratrol alone is plotted on the y-axis and IC50 value of paclitaxel alone on
Page 51
37
the x-axis; these two points are connected to provide the line of additivity. Each drug
ratio is represented on the graph as a single point based on the IC50 value for both drugs
at this ratio. Any point that falls on the line of additivity denotes an additive effect, below
the line denotes synergistic effect, and above the line denotes an antagonistic effect of
the drug combination. Antagonism denotes a reduction of drug efficacy, an additive
effect suggests an efficacy that is equal to the effects of the two drugs alone added
together, and synergy denotes an improvement of effect of both drugs compared to each
drug alone. The data were analyzed by determining the IC50 value for the constant drug
ratio curves using the Chou Talalay method [231, 232].
E. Inhibitor Assay
For the P-gp and CYP2C8 inhibitor assays, the methylene blue method was used
as described above. Cells were treated for 5 days with a serial dilution of paclitaxel
either alone or in combination with 1 μM verapamil (Sigma-Aldrich; St. Louis, MO), 25
μM trimethoprim (Sigma-Aldrich; St. Louis, MO) or both. GraphPad Prism version 4.00
for Windows (GraphPad Software; San Diego, CA) was used to calculate IC50 values.
IC50 values from different trials were averaged and compared using Microsoft Excel 2011
version 14.4.1.
IV. MOLECULAR TECHNIQUES
A. Cell Cycle Analysis
To analyze the cells’ cycle phases following resveratrol treatment, cells were
plated at a density of 1x10⁶ in T75 flasks, allowed to attach to the plate overnight, and
Page 52
38
treated with resveratrol or DMSO vehicle control for 48 hours. All cells in the media and
those attached to the plate were collected using trypsinization and centrifugation. Cells
were resuspended in 1X HBSS to wash the pellet and cells were counted. After
centrifugation and removal of the 1X HBSS cells were resuspended in 0.5 mL 1X PBS
and kept on ice. Cells were fixed and permeablized by adding 4.5 mL of 70% ethanol
dropwise while vortexing. Cells were then stored at -20°C. To stain for flow cytometry
analysis, samples were centrifuged for 5 minutes and the supernatant was decanted.
Cells were gently washed with 1X PBS and centrifuged, and the supernatant was
decanted. Cells were resuspended in 100 uL binding buffer (0.1% TritonX-100 in PBS,
0.0002% DNase-free RNase A) and then stained with 5 μL propidium iodide (PI) staining
solution (BD Biosciences; Franklin Lakes, NJ). An unstained control was prepared for
each cell line with cells not treated with resveratrol; these controls are important for
setting up flow cytometry conditions. Cells were gently vortexed and incubated at room
temperature for 15 minutes in the dark. Cells were then diluted with 400 μL binding
buffer. Samples were put through a 35 μm cell strainer and vortexed before mounting
sample tube to flow cytometer. Fluorescence was measured using a LSRII 561 nM laser
flow cytometer (BD Biosciences; San Jose, CA), and data was analyzed with FlowJo
(TreeStar; Ashland, OR).
B. Senescence Staining
Cells were plated at 15,000 cells per well onto 24-well plates, allowed to attach to
the plate overnight, treated with resveratrol or DMSO vehicle control for 3 days, and then
stained using the Senescence Detection Kit (EMD Millipore; Billerica, MA) per
manufacturer’s instructions with modifications. Culture media was aspirated, and the
plates were washed with 1X PBS. Cells were then fixed with 200 μL of Fixative Solution
Page 53
39
at room temperature for 10 minutes. Cells were washed twice with 1X PBS and the
stained at 37 °C overnight with 200 μL Staining Solution. The activity of β-galactosidase
is a hallmark of senescent cells. The staining solution of this kit contains X-gal, which is
cleaved by β-galactosidase to produce a blue dye. Therefore, blue cell staining denotes
a positive result or senescent cell, and no staining denotes a negative result. Positive
and negative cells were counted and scored from images provided using a phase-
contract microscope at 20X. The experiment was conducted three separate times, and
three representative fields for each treatment from each experiment were counted and
scored.
C. Immunofluorescence
Cells were plated on 8-well glass chamber slides at 40,000 cells per well and
were allowed to attach overnight. Media was removed and wells were washed with 1X
HBSS. Cells were fixed to the plate with 100% methanol for 10 minutes and washed
three times with 1X PBS for 5 minutes. The cells were then permeabilized with 0.2%
Triton-X100 in 1X PBS for 10 minutes. Cells were washed again as before. The chamber
was then removed and the cells were mounted to the slide with Vectashield Mounting
Medium with DAPI (Vector Laboratories; Burlingame, CA). A coverslip was then sealed
to the slide. Slides were then visualized with a fluorescence microscope.
D. Annexin V Apoptosis Flow Cytometry
For apoptosis analyses, 1,000,000 cells were plated in T75 flasks, allowed to
attach to the plate overnight, and treated with resveratrol or DMSO vehicle control for 3
or 5 days. All cells in the media and attached to the plate were collected using
Page 54
40
trypsinization and centrifugation. Cells were stained with FITC-conjugated Annexin V
and PI using the FITC Annexin V Apoptosis Detection Kit I (BD Biosciences; Franklin
Lakes, NJ) according to manufacturer’s instructions. Collected cells were washed twice
with 1X HBSS, and 1,000,000 cells were resuspended in 100 μL of 1X Binding Buffer.
To stain the cells, 5 μL of FITC Annexin V and 5 μL of PI were added to the samples. An
unstained, FITC Annexin V only, and PI only control were prepared for each cell line with
cells not treated with resveratrol; these controls are important for setting up flow
cytometry conditions. Samples were then gently vortexed and incubated for 15 minutes
at room temperature in the dark. Samples were diluted with 400 μL of 1X Binding Buffer,
put through a 35 μm cell strainer, and vortexed before mounting sample tube to flow
cytometer. Fluorescence was measured using a LSRII 561 nM laser flow cytometer (BD
Biosciences; San Jose, CA), and data was analyzed with FlowJo (TreeStar; Ashland,
OR).
E. Immunoblotting
Cells were plated on T75 flasks, allowed to attach overnight, and treated with
resveratrol or DMSO vehicle control for 2, 3 or 5 days. Cells were collected by
trypsinization, washed with 1X HBSS, pelleted, and snap frozen in an -80°C freezer.
Pellets were resuspended in RIPA buffer (50 mM Tris-HCl, 150 mM NaCl, 37 mM β
glycerol phosphate, 47 mM NaF, 1% NP-40, 0.1% SDS, 0.5% Na deoxycholate, 10%
glycerol) supplemented with protease inhibitor cocktail (Hoffmann-La Roche;
Switzerland) and phosphatase inhibitor cocktail (Thermo Fisher Scientific; Waltham, MA)
and were lysed by sonication for 10 seconds at 30 amperes. The protein content of the
samples was estimated using a Pierce BCA Protein Assay Kit. A standard curve of
protein concentration was created with lysis buffer, water and 2mg/mL BSA. Protein
Page 55
41
samples were diluted 1:10 and 10 μL of standards and samples were added to a 96-well
plate. 200 μL of a mix of 50 parts Reagent A to 1 part Reagent B was added to each
well and mixed well. The plate was incubated at 37°C for 30 minutes. The plate was then
cooled to room temperature and read on a plate reader at 562 nm. The standard curve
was then used to estimate protein concentration of prepared samples. Ten or 25 μg of
protein was mixed 1:1 with 2X Laemmli Buffer (4% SDS, 20% glycerol, 10% 2-
mercaptoethanol, 0.008% bromphenol blue and 0.125 M Tris HCl pH 6.8) and boiled at
95°C for 5 minutes. Samples were run on 6, 10 or 12% polyacrylamide gels using 1X
Tris/glycine SDS (0.25 M Tris base, 0.96 M glycine, 0.5% SDS, pH 8.3) running buffer.
PVDF membranes (Pall Corporation; Port Washington, NY) and 1X Transfer Buffer (0.25
M Tris base, 0.192 M glycine, 20% methanol, pH 8.3) were used for overnight (13V) or
2-hour (80V) transfer. Blotting was conducted using 5% milk in 0.1% Tween PBST or 5%
BSA in 0.1% Tween TBST for phosphorylated proteins. All blots were incubated with
primary antibody (1:1000-1:5000) at 4°C overnight and secondary antibody (1:5000-
1:10,000) for 0.5-1 hour at room temperature with gentle agitation. Primary antibodies
SIRT1 (Active Motif; Carlsbad, CA), DBC1, Survivin, Caspase 7, Caspase 3, AMPK, and
P-AMPK (Cell Signaling; Danvers, MA) and secondary antibodies anti-mouse and anti-
rabbit (Thermo Fisher Scientific; Waltham, MA) were used according to manufacturer’s
suggestion. Pierce ECL Western Blotting Reagent (Thermo Fisher Scientific; Waltham,
MA) was used to visualize bands on X-ray film per manufacturer’s instructions. An X-ray
film developer was used to develop the film, and ImageJ was used for densitometry
quantification.
Page 56
42
F. siRNA Knockdown
Caspase 7 and Non-Targeting Dharmacon ON-TARGETplus SMARTpool siRNA
constructs were used with Dharmacon lipofection transfection reagent (Thermo Fisher
Scientific; Waltham, MA) according to manufacturer’s instructions. Dharmacon ON-
TARGETplus SMARTpool siRNAs, which contain a pool of 3-4 siRNAs, were
reconstituted with 1X siRNA buffer (60 nM KCl, 6 mM HEPES-pH 7.5, and 0.2 mM
MgCl2) for a final stock concentration of 5 μM. The siRNA and siRNA buffer solution was
mixed gently by pipetting without introduction of bubbles and incubated for 30 minutes at
room temperature with gentle agitation. Aliquotes of siRNA were stored at -20°C. Cells
were plated on 6-well plates at 200,000 cells per well and allowed to attach overnight.
Cells were transfected with 25 nM siRNA and 0.1% transfection reagent. Transfection
media was prepared by gently mixing siRNA and transfection reagent individually with
serum-free media and incubating for 5 minutes at room temperature. The two mixtures
were then gently mixed together and incubated for 20 minutes at room temperature.
Complete media was added to the mixture and cells were treated with 1 mL of
transfection media for 96 hours. The transfection media was then removed and the cells
were then treated with resveratrol or DMSO vehicle control for 48 hours before the cells
were collected and analyzed by immunoblotting as described above.
G. Co-immunoprecipitation
Cells were plated on 10 cm dishes and left to attach overnight. The cells were
then treated for 2 hours with resveratrol or DMSO vehicle control and collected by
scraping in 1 mL of 1X PBS. The cells were pelleted in a centrifuged at 10,000 rpm for 5
minutes and PBS was aspirated. The pellets were resuspended in co-
Page 57
43
immunoprecipitation lysis buffer (25mM Tris, pH 8.0, 150mM NaCl, 0.5 mM EDTA, 0.5
mM EGTA, 1% NP-40) supplemented with protease inhibitor cocktail (Hoffmann-La
Roche; Switzerland). The samples were lysed on ice for 30 minutes with vortexing every
10 minutes. The samples were then spun down as before and the supernatant was put
into a new tube. The protein concentration was then determined as described in the
“Immunoblotting” section. Along with untreated and treatment samples, a “lysate and
bead only” control was prepared with untreated cells as a background control. 1500 μg
of protein was added to a new sample tube for each sample. 2.5 μg of SIRT1 antibody
was added to all but the “lysate and bead only” control. The total volume of each sample
was brought up to 1 mL with lysis buffer, and the samples were incubated at 4°C with
gentle agitation overnight. Protein A/G PLUS-Agarose Immunoprecipitation Reagent
(Santa Cruz Biotechnology; Santa Cruz, CA) was used to collect the SIRT1-SIRT1
Antibody complex. A slurry of A/G beads in PBS was made to provide enough beads to
coat the bottom of an Eppendorf tube by adding 37.5 μL of bead slurry. This 37.5 μL of
bead slurry was then added to each sample and incubated for 2 hours at 4°C with gentle
agitation. To collect beads, samples were spun down for 30 seconds at 8,000 rpm and
supernatant was aspirated. Beads were rinsed 3 times with 1 mL cold 1X PBS on ice
and gentle agitation for 10 minutes. After final rinse, 10 μL of cold PBS and 10 uL of 2X
Laemmli Buffer was added to the beads. Samples were boiled on a heat block for 7
minutes at 95°C with vortexing three times during boiling. Samples were then spun down
and the supernatant was loaded onto a polyacrylamide gel to be analyzed by
Immunoblotting as was described above.
Page 58
44
H. RNA Extraction
PCR based assays were used to explore possible mechanisms of resistance,
which required RNA extracts from cell samples. Untreated cells were collected by
trypsinization, washed, pelleted and snap frozen in an -80°C freezer. For all PCR based
assays, RNase Away Decontamination Solution (Thermo Fisher Scientific; Waltham,
MA) was used to keep the working area free of RNase contamination. RNA extraction
was performed according to manufacturer’s instructions using the RNeasy Mini Kit
(Qiagen; Holland). Cell pellets were resuspended in 350 μL of Buffer RLT and the cell
lysates were homogenized by passing the lysates through a blunt 20-gauge needle 5
times. Before addition to the column, 350 μL of 70% ethanol was then added to the
lysates and mixed well. The lysates were then transferred to RNeasy Mini Kit spin
columns placed in a 2 mL collection tube and centrifuged for 15 seconds at 10,000 rpm
to transfer sample to the spin column membrane. Flow-through was discarded and 700
μL Buffer RW1 was added to the columns to wash the membrane. Samples were
centrifuged again and flow-through was discarded. After adding 500 μL Buffer RPE to
the columns to further wash the membrane, the columns were spun and flow-through
discarded again. Another 500 μL Buffer RPE was added to the columns, and the sample
was centrifuged for 2 minutes at 10,000 rpm. The spin columns were then placed in new
2 mL collection tubes and centrifuged at 13,200 rpm for 1 minute. Finally, the spin
columns were placed in new 1.5 mL collection tubes, 40 μL of RNase-free water was
added directly to the spin column membranes, and the samples were spun at 10,000
rpm for 1 minute to elute RNA from the membrane. Another 40 μL was added to the
column and the spin repeated to ensure elution of all RNA. RNA concentration and purity
of the eluate was determined using a NanoDrop spectrophotometer.
Page 59
45
I. cDNA Synthesis
The RT2 First Strand Kit (Qiagen SABiosciences; Holland) was used to
synthesize cDNA from RNA samples for both the RT2 Profiler PCR Array and the RT2
qPCR Primer Assay according to manufacturer’s instructions. Genomic DNA was
eliminated from the RNA samples by mixing 0.5 μg of RNA with 2 uL of Buffer GE and
RNase-free water to 10 μL total volume. This genomic DNA elimination mix was
incubated at 42°C for 5 minutes and then placed immediately on ice for at least 1
minute. Reverse-transcription mix (4 μL 5X Buffer BC3, 1 μL Control P2, 2 μL RE3
Reverse Transcriptase Mix, and 3 μL RNase-free water) was prepared for each reaction
and 10 μL was added to each tube containing 10 μL genomic DNA elimination mix and
mixed gently. Samples were incubated at 42°C for exactly 15 minutes. The reaction was
then immediately stopped by incubating at 95°C for 5 minutes. Finally, 91 μL RNase-free
water was mixed gently into each sample, and the samples were placed on ice or stored
at -20°C.
J. RT2 Profiler PCR Array
The Human Cancer Drug Resistance RT2 Profiler PCR Array (Qiagen
SABiosciences; Holland) was used according to manufacturer’s instructions. The array
was performed a total of three times from the same cDNA sample for each cell line. The
PCR components (50% 2X RT2 SYBR Green Mastermix, 3.8% cDNA and 46.2%
RNase-free water) were mixed for a 96-well array for each cell line at room temperature
and 25 μL of the mixture was added to each well of the array using a 8-channel pipettor
changing pipet tips following each pipetting step to avoid cross-contamination. The array
plate was tightly sealed with optical thin-wall 8-cap strips. The plates were centrifuged
Page 60
46
for 1 minute at 10,000 rpm at room temperature to remove bubbles and were placed on
ice until ready to run real-time PCR. Real-time PCR was performed on an ABI 7500
machine with the following program: 1 cycle 95°C for 10 minutes; 40 cycles 95°C for 15
seconds, 60°C for 1 minute (perform fluorescence data collection); dissociation curve
analysis. The 7500 Software version 2.0.6 was used to determine CT values and the
SABiosciences PCR Array Data Analysis Template Excel was used to analyze the data.
K. RT2 qPCR Primer Assay
Primers for ABCB1, CYP2C8, and actin (Qiagen SABiosciences; Holland) were
used in combination with the corresponding RT2 Primer Assay (Qiagen SABiosciences;
Holland) reagents and used according to manufacturer’s instructions. Three biological
replicates were run in triplicate. The PCR components (50% RT2 SYBR Green
Mastermix, 4% cDNA, 4% 10 μM RT2 qPCR Primer, 42% RNase-free water) were mixed
for a total volume of 25 μL per reaction and were added to 96-well PCR plates. The
plates were sealed with adhesive film, centrifuged for 1 minute at 10,000 rpm at room
temperature to remove bubbles, and placed on ice until ready to run real-time PCR.
Real-time PCR was performed on an ABI 7500 machine with the same program used for
the PCR Array. The 7500 Software version 2.0.6 was used to determine CT values and
the 2^(-ΔΔCT) method [233] was used to determine fold changes of gene expression
between the parental, MDA-MB-231 cells, and the resistant MDA-MB-231/PacR and
MDA-MB-231/PacR-Hi cells. P-values and standard deviations for PCR Array and real-
time RT-PCR validation were calculated based on a Student’s t-test of the replicate 2^(-
ΔCT) values for each gene in the control group and treatment groups as suggested by
the manufacturer.
Page 61
47
V. STATISTICS
Student’s T-Test, two- and one-way ANOVA with Bonferroni correction were
used to determine p-values where appropriate using GraphPad Prism4 software where
p<0.05 was considered statistically significant.
Page 62
48
CHAPTER 3: RESULTS
I. PACLITAXEL-RESISTANT CELLULAR MODEL GENERATION
To provide a cellular model of acquired paclitaxel resistance in MDA-MB-231
breast cancer cells, a paclitaxel resistant cell line was developed by an intermittent,
stepwise treatment with paclitaxel (Figure 7). A continuous, stepwise method was also
attempted but the resulting population did not develop as much resistance, based on
IC50 analysis at a 24-hour paclitaxel treatment time, or grow as well as the population
derived from the intermittent, stepwise method. Therefore, we continued experiments
with the population derived by intermittent, stepwise paclitaxel treatment. The cells were
no longer cultured in the presence of paclitaxel after the final population was acquired.
The limiting dilution cloning method was used to provide a more homogeneous
population and yielded 29 clones that could be successfully established as resistant cell
lines. These cells were originally assessed with a 24-hour paclitaxel treatment. The cells
did not lose paclitaxel-resistance even after up to 20 passages post-cloning.
Page 63
49
Figure 7. Schematic of Drug Resistant Cell Line Generation. Cells were treated with a
stepwise increase of the 24-hour paclitaxel IC50 calculated from the methylene blue
proliferation assay. Between each stepwise increase was a 2 to 4 week period of
intermittent treatment. This intermittent treatment was conducted with repeatedly treating
the cells with paclitaxel for 3 to 4 days, removing the drug, and allowing the cells to
recover for 3 to 4 days. The resulting population was then cloned using the limiting
dilution method.
Paclitaxel Treatment
Paclitaxel Removed
IC30
IC40
IC45
IC50
IC55
IC60
2-4 weeks 2-4 weeks 2-4 weeks 2-4 weeks 2-4 weeks
3-4 days 3-4 days 3-4 days 3-4 days
Page 64
50
II. RESVERATROL INDUCES CELL PROLIFERATION INHIBTION, SENESCENCE,
AND APOPTOSIS
A. Resveratrol Inhibits Cell Proliferation
To determine the effects of resveratrol in these paclitaxel-sensitive and -resistant
TNBC cells, the effects of resveratrol on cell proliferation of parental MDA-MB-231 and
highly resistant MDA-MB-231/PacR cells were tested. To determine any correlation
between paclitaxel resistance and resveratrol sensitivity, the 24-hour paclitaxel IC50 and
72-hour resveratrol IC50 were graphed against each other and a ‘line of best fit’ analysis
was performed in Excel (Figure 8). The ‘line of best fit’ analysis resulted in a correlation
coefficient of 0.046, suggesting no correlation. Due to the fact that a 24-hour time point
of resveratrol does not provide a full IC50 curve, a longer time point of 5 days was used
for further experiments. Of the 29 clones, the 12-fold increased resistance clone, MDA-
MB-231/PacR, was selected for further study. The 5-day IC50 value of the parental MDA-
MB-231cells was 5.1 ± 2.3 nM compared to 61.5 ± 9.5 nM for the MDA-MB-231/PacR
cells. In addition, another clone was chosen for use in resistance mechanism
experiments to provide comparison and validate the importance of the mechanism in
more than one clone. The clone chosen, MDA-MB-231/PacR-Hi, was observed to have
a 5-day IC50 value of 117.5 ± 42.7 nM. Though the population doubling of the MDA-MB-
231/PacR cells was increased to 52 hours compared to the MDA-MB-231 cells at 35
hours, 10 and 100 μM resveratrol significantly inhibited the ability of both cell populations
to proliferate (Figure 9). Treatment with 100 μM resveratrol in a colony formation and
clonogenic cell survival assay completely inhibited colony formation in both cell lines,
indicating that resveratrol inhibited the ability of a single cell to proliferate (Figure 10A-B).
In both assays, 10 μM resveratrol treatment decreased colony formation, but the
Page 65
51
decrease was only statistically significant for the surviving fraction in the MDA-MB-
231/PacR cells. The difference in population doubling time between the two cell lines is
illustrated by the larger colony size seen in the MDA-MB-231/PacR cells (Figure 10C).
Page 66
52
Figure 8. Paclitaxel Resistance is Not Correlated to Resveratrol Sensitivity. Each
paclitaxel-resistant clone generated graphed by 24-hour paclitaxel IC50 versus 72-hour
resveratrol IC50. Line represents the line of best fit, and the R2 is the correlation
coefficient of the line of best fit.
R² = 0.0461
0
10
20
30
40
50
60
70
80
90
0 20 40 60 80 100 120
Pacl
itaxe
l IC
50 (μ
M)
Resveratrol 72 hour IC50 (μM)
Page 67
53
Figure 9. Resveratrol Inhibits Cell Proliferation. A) Total cell counts from plates seeded
with 1.5x10⁴ cells 24-72 hours post resveratrol treatment of MDA-MB-231 and B) MDA-
MB-231/PacR. cells (n=3) (UT=untreated; *p<0.05; **p<0.01; ***p<0.001; *p-values
compare treatment to DMSO control).
0
20
40
60
80
100
120
140
0 24 48 72
Tota
l Cel
l Cou
nt (x
1000
)
Time (Hours)
MDA-MB-231/PacR
UT
DMSO
10 µM RES
100 µM RES
***
***
0
20
40
60
80
100
120
140
0 24 48 72
Tota
l Cel
l Cou
nt (x
1000
)
Time (Hours)
MDA-MB-231
UT
DMSO
10 µM RES
100 µM RES
* **
A
B
Page 68
54
Figure 10. Resveratrol Inhibits Colony Formation. A) Plating efficiency and B) Surviving
fraction of cells plated at low density after 72 hours of resveratrol treatment followed by a
17-day incubation without drug (n=3) and C) representative pictures of untreated
colonies from clonogenic, colony formation assay. Error bars signify standard deviation
(UT=untreated; *p<0.05; **p<0.01; ***p<0.001; *p-values compare resveratrol treatment
to DMSO control).
00.050.1
0.150.2
0.250.3
0.350.4
0.45
UT DMSO 10 µMRES
100 µMRES
UT DMSO 10 µMRES
100 µMRES
MDA-MB-231 MDA-MB-231/PacR
Surv
ivin
g Fr
actio
n (c
olon
ies
form
ed/c
ells
pla
ted)
Clonogenic Assay
* **
00.050.1
0.150.2
0.250.3
0.350.4
0.450.5
UT DMSO 10 µMRES
100 µMRES
UT DMSO 10 µMRES
100 µMRES
MDA-MB-231 MDA-MB-231/PacR
Plat
ing
Effic
ienc
y (c
olon
ies
form
ed/c
ells
pla
ted)
Survival Assay
***
***
***
A
B
C
Page 69
55
B. Resveratrol Induces Sub-G1 Phase Accumulation
Due to the inhibition of cell proliferation observed in both cell lines by resveratrol,
we next analyzed the effect of resveratrol on cell cycle profiles in parental MDA-MB-231
and MDA-MB-231/PacR cells. We chose a 48-hour time point based on the cell
proliferation data which indicates a difference between vehicle treated and resveratrol
treated is just becoming evident. In addition, a higher concentration, 300 μM, of
resveratrol was added to evaluate the effects of resveratrol at concentrations previously
used in anti-cancer studies [234, 235] and shown to accumulate in tissues [178]. At 48
hours, neither 100 nor 300 μM resveratrol treatment in either cell line caused any
accumulation in G1, G2/M or S phase compared to vehicle control (Figure 11). There
was a decrease of cells in G1 phase after 300 μM resveratrol treatment in both cell lines.
This population decreased from 46% to 4% in MDA-MB-231 cells and 41% to 8% in
MDA-MB-231/PacR cells. Importantly, there was accumulation in Sub-G1 phase in both
cell lines, which suggests apoptosis. In the MDA-MB-231 cell line, the Sub-G1 phase
increased from 3% in the untreated and DMSO treated to 18% and 49% in the 100 and
300 μM treated cells, respectively. In the MDA-MB-231/PacR cell line, the Sub-G1 phase
increased from 8% in the untreated and DMSO treated to 23% and 34% in the 100 and
300 μM treated cells, respectively. In addition, in both cell lines 300 μM resveratrol
caused accumulation of a peak with higher DNA content than G2/M phase, but not
enough to denote cell aggregation or mitotic catastrophe. The population increased from
10% to 24% in the MDA-MB-231 and 9% to 26% in the MDA-MB-231/PacR cells. Due to
the presence of micronuclei in both cell populations (Figure 12), as well as literature
suggesting micronucleated calls can collect between G1 and G2 phase and after G2/M
phase [236], we hypothesize this peak represents a population of micronucleated cells.
Page 70
56
Figure 11. Resveratrol Induces Sub-G1 Accumulation. Cell cycle analysis measureing PI
staining with flow cytometry showing percent of cells in each phase after 48 hours of
resveratrol treatment in A) MDA-MB-231 and B) MDA-MB-231/PacR cells (n=4).
0%
10%
20%
30%
40%
50%
60%
70%
80%
90%
100%
UT DMSO 10 µM RES 100 µM RES300 µM RES
MDA-MB-231
Micronucleated
Sub-G1
S
G2/M
G1
0%
10%
20%
30%
40%
50%
60%
70%
80%
90%
100%
UT DMSO 10 µM RES 100 µM RES300 µM RES
MDA-MB-231/PacR Micronucleated
Sub-G1
S
G2/M
G1
A
B
Page 71
57
Figure 12. Micronuclei are Present in MDA-MB-231 & MDA-MB-231/PacR Cells. A)
DAPI staining of the nuclei (40X magnification) of MDA-MB-231 cells and B) MDA-MB-
231/PacR cells. White arrows indicate micronuclei.
MDA-MB-231 A
B MDA-MB-231/PacR
Page 72
58
C. Resveratrol Induces Senescence
Because we observed inhibition of cell proliferation without a prominent cell cycle
arrest with 10 or 100 μM resveratrol treatment, we hypothesized resveratrol treatment
was causing senescence in some of the cells. Due to the greatest cell proliferation
difference occurring at 3 days, we used this treatment time to look for senescent cells.
After 100 μM resveratrol treatment, 37% of MDA-MB-231 and 38% of MDA-MB-
231/PacR cells were observed to be senescent by positive β-galactosidase staining
(Figure 13). A treatment of 10 μM resveratrol caused a slight increase in senescence in
both cell lines, but this increase was only statistically significant in the MDA-MB-
231/PacR cells. In these pictures, the hallmark cellular morphology of senescent cells,
an enlarged and flattened appearance [237], can also be seen in the blue stained, β-
galactosidase positive cells.
Page 73
59
Figure 13. Resveratrol Induces Senescence. A) Representative fields of β-Galactosidase
senescence staining after 48 hours of resveratrol treatment. White arrows point to blue
stained, positive cells. Scale bar represents 200 μm. B) Quanitifcation of percent positive
β-Galactosidase cells from three representative fields (n=3). Error bars signify standard
deviation (*p<0.05; **p<0.01; ***p<0.001; *p-values compare treatment to DMSO
control).
MD
A-M
B-23
1 M
DA-
MB-
231/
PacR
UT 100 μM RES A
B
05
101520253035404550
UT
DM
SO
10 μ
M R
ES
100
μM R
ES
UT
DM
SO
10 μ
M R
ES
100
μM R
ES
MDA-MB-231 MDA-MB-231/PacR-Hi
% C
ells
β-G
al P
ositi
ve 3 Days ***
***
**
Page 74
60
D. Resveratrol Induces Apoptosis
To ensure that the accumulated sub-G1 phase cells were apoptotic, Annexin V
flow cytometry was conducted. This method differentiates between early apoptosis and
late apoptosis/necrosis. After 3 days of resveratrol treatment, apoptosis was observed in
both cell lines at 300 μM and in MDA-MB-231 cells at 100 μM resveratrol as well (Figure
14A). In MDA-MB-231 cells treated with 300 μM resveratrol, 59% late apoptosis/necrosis
and 37% early apoptosis was observed for a total of 96% of cells undergoing apoptosis.
In MDA-MB-231/PacR cells, 71% late apoptosis/necrosis and 18% early apoptosis was
observed for a total of 89% of cells undergoing apoptosis. At this 3-day time point, 100
μM of resveratrol caused a statistically significant increase only in MDA-MB-231 cells
when early and late apoptosis were added together (p<0.001). After 5 days of
resveratrol treatment, both 100 and 300 μM treatment caused early and late apoptosis in
both cell lines (Figure 14B). 300 μM resveratrol caused a total 96% of the cells to
undergo apoptosis in both cell lines with 52% and 44% of MDA-MB-231 cells and 58%
and 38% of MDA-MB-231/PacR cells being late and early apoptotic, respectively. When
treated with 100μM resveratrol for 5 days, the percentage of total apoptotic cells was
64% of MDA-MB-231 cells (p < 0.001), made up of 46% late and 18% early apoptotic,
and 53% of MDA-MB-231/PacR cells (p < 0.01), made up of 37% late and 16% early
apoptotic cells.
To determine the importance of caspase 3 and caspase 7 in resveratrol-induced
apoptosis, immunoblotting analysis was utilized. Procaspase, the inactive form, and
cleaved caspase, the active form, were both measured. Caspase activation is a late
apoptosis event. Due to the early and late apoptosis seen at 3 and 5 days we used
these as well as a 48-hour time point to obtain a broad idea of caspase activity after
resveratrol treatment. After 48 hours of 300 μM resveratrol treatment, procaspase 7 was
Page 75
61
significantly decreased and cleaved caspase 7 was significantly increased for both cell
lines (Figure 15). Slight activation of caspase 7 was seen with 100 μM of resveratrol
treatment at this 48-hour time point though it was not statistically significant. After 3 and
5 days of resveratrol treatment, the activation of caspase 7 decreases in the 300 μM
treatment, which is likely due to activated caspases being degraded after activation. In
contrast, Caspase 7 activates in the 100 μM treatment group for both cell lines at 3 and
5 days (Figure 16). In addition, at 48 hours there was a decrease of procaspase 3 and
slight but significant activation of caspase 3 with 300 μM treatment (Figure 17).
Page 76
62
Figure 14. Resveratrol Induces Apoptosis. A) Percent of cells undergoing early (gray)
and late (black) apoptosis measured by Annexin V/PI flow cytometry after 3 days and B)
5 days of resveratrol treatment (n=3). Error bars signify standard deviation (*p<0.05;
**p<0.01; ***p<0.001; *p-values compare treatment to respective DMSO control).
0102030405060708090
100
UT
DM
SO (1
00)
DM
SO (3
00)
100
μM R
ES
300
μM R
ES
UT
DM
SO (1
00)
DM
SO (3
00)
100
μM R
ES
300
μM R
ES
MDA-MB-231 MDA-MB-231/PacR
% C
ells
5 Days Early Apoptosis
Late Apoptosis
*** *** ***
*
***
***
**
A
B
0102030405060708090
100
UT
DM
SO (1
00)
DM
SO (3
00)
100
μM R
ES
300
μM R
ES
UT
DM
SO (1
00)
DM
SO (3
00)
100
μM R
ES
300
μM R
ES
MDA-MB-231 MDA-MB-231/PacR
% C
ells
3 Days Early Apoptosis
Late Apoptosis
*
*** ***
Page 77
63
Figure 15. Caspase 7 Activation Occurs at 48 Hours with 300 μM Resveratrol Treatment.
A) Representative immunoblot from three independent experiments of caspase 7 at 48
hours after resveratrol treatment. B) Densitometry quantification normalized to actin of
procaspase 7 and C) cleaved caspase 7 (n=3). Error bars signify standard deviation
(*p<0.05; **p<0.01; ***p<0.001; *p-values compare treatment to respective DMSO
control).
0
0.1
0.2
0.3
0.4
0.5
0.6
0.7
UT
DM
SO (1
00)
DM
SO (3
00)
100
μM R
ES
300
μM R
ES
UT
DM
SO (1
00)
DM
SO (3
00)
100
μM R
ES
300
μM R
ES
MDA-MB-231 MDA-MB-231/PacR
Rel
ativ
e cl
eave
d ca
spas
e 7
Leve
l (n
orm
aliz
ed to
act
in)
*** ***
0
0.2
0.4
0.6
0.8
1
1.2
1.4
1.6
UT
DM
SO (1
00)
DM
SO (3
00)
100
μM R
ES
300
μM R
ES
UT
DM
SO (1
00)
DM
SO (3
00)
100
μM R
ES
300
μM R
ES
MDA-MB-231 MDA-MB-231/PacR
Rel
ativ
e pr
ocas
pase
7 L
evel
(n
orm
aliz
ed to
act
in)
*** **
*
MDA-MB- 231
UT
DM
SO
(100
) D
MS
O (3
00)
100
µM R
ES
300
µM R
ES
MDA-MB-231/PacR
UT
DM
SO
(100
) D
MS
O (3
00)
100
µM R
ES
300
µM R
ES
actin
cleaved caspase 7
procaspase 7
B C
A
Page 78
64
Figure 16. Caspase 7 Activation Occurs at 3 & 5 Days with 100 μM Resveratrol
Treatment. Densitometry quantification normalized to actin of A) procaspase 7 and B)
cleaved caspase 7 at 3 days and C) procaspase 7 and D) cleaved caspase 7 at 5 days
(n=3). Error bars signify standard deviation (*p<0.05; **p<0.01; ***p<0.001; *p-values
compare treatment to respective DMSO control).
0
0.2
0.4
0.6
0.8
1
1.2
1.4
1.6
UT
DM
SO (1
00)
DM
SO (3
00)
100
μM R
ES
300
μM R
ES
UT
DM
SO (1
00)
DM
SO (3
00)
100
μM R
ES
300
μM R
ES
MDA-MB-231 MDA-MB-231/PacR
Rel
ativ
e pr
ocas
pase
7 L
evel
(n
orm
aliz
ed to
act
in)
3 Days
** 0
0.10.20.30.40.50.60.70.80.9
1
UT
DM
SO (1
00)
DM
SO (3
00)
100
μM R
ES
300
μM R
ES
UT
DM
SO (1
00)
DM
SO (3
00)
100
μM R
ES
300
μM R
ES
MDA-MB-231 MDA-MB-231/PacR
Rel
ativ
e cl
eave
d ca
spas
e 7
Lev
el
(nor
mal
ized
to a
ctin
)
3 Days
**
0
1
2
3
4
5
6
UT
DM
SO (1
00)
DM
SO (3
00)
100
μM R
ES
300
μM R
ES
UT
DM
SO (1
00)
DM
SO (3
00)
100
μM R
ES
300
μM R
ES
MDA-MB-231 MDA-MB-231/PacR
Rel
ativ
e pr
ocas
pase
7 E
xpre
ssio
n (n
orm
aliz
ed to
act
in)
5 Days
* 0
0.2
0.4
0.6
0.8
1
1.2
1.4
1.6
1.8
UT
DM
SO (1
00)
DM
SO (3
00)
100
μM R
ES
300
μM R
ES
UT
DM
SO (1
00)
DM
SO (3
00)
100
μM R
ES
300
μM R
ES
MDA-MB-231 MDA-MB-231/PacR
Rel
ativ
e cl
eave
d ca
spas
e 7
Leve
l (n
orm
aliz
ed to
act
in)
5 Days *
*
A B
C D
Page 79
65
Figure 17. Caspase 3 Activation Occurs Before 48 Hours with 300 μM Resveratrol
Treatment. Densitometry quantification normalized to actin of A) procaspase 3 and B)
cleaved caspase 3 at 48 Hours and C) procaspase 3 at 3 days (n=3). Error bars signify
standard deviation (*p<0.05; **p<0.01; ***p<0.001; *p-values compare treatment to
respective DMSO control; †p-values compare untreated and DMSO control).
00.10.20.30.40.50.60.70.80.9
1
UT
DM
SO (1
00)
DM
SO (3
00)
100
μM R
ES
300
μM R
ES
UT
DM
SO (1
00)
DM
SO (3
00)
100
μM R
ES
300
μM R
ES
MDA-MB-231 MDA-MB-231/PacR
Rel
ativ
e P
roca
spas
e 3
Leve
l (n
orm
aliz
ed to
act
in)
48 Hours
***
††
***
***
†
00.10.20.30.40.50.60.70.80.9
1
UT
DM
SO (1
00)
DM
SO (3
00)
100
μM R
ES
300
μM R
ES
UT
DM
SO (1
00)
DM
SO (3
00)
100
μM R
ES
300
μM R
ES
MDA-MB-231 MDA-MB-231/PacR
Rel
ativ
e cl
eave
d ca
spas
e 3
Leve
l (n
orm
aliz
ed to
act
in)
48 Hours
** **
00.10.20.30.40.50.60.70.80.9
1
UT
DM
SO (1
00)
DM
SO (3
00)
100
μM R
ES
300
μM R
ES
UT
DM
SO (1
00)
DM
SO (3
00)
100
μM R
ES
300
μM R
ES
MDA-MB-231 MDA-MB-231/PacR
Rel
ativ
e pr
ocas
pase
3 L
evel
(n
orm
aliz
ed to
act
in)
3 Days
*
A B
C
Page 80
66
E. Resveratrol Decreases Survivin Protein Expression at High Concentration
To explore possible mechanisms of resveratrol action, survivin and SIRT1
pathways were examined as these have been shown to be important in other cancer
cells [212]. Complete inhibition of survivin protein expression was achieved with 300 μM
resveratrol at 48 hours and persisted for at least 5 days (Figure 18). However, while
apoptosis occurred at 3 and 5 days of 100 μM treatment, there was no significant
difference in survivin protein levels, suggesting survivin may not be critical in resveratrol-
induced apoptosis in these cells at this lower concentration (Figure 18C-D).
Furthermore, the decrease of survivin with 300 μM resveratrol may not be caused by
caspase 7 cleavage activity as neither 40% caspase 7 knockdown in MDA-MB-231 cells
nor 70% in MDA-MB-231/PacR cells resulted in any recovery of survivin levels (Figure
19). This result was further supported by the activation of caspase 7 in both cell lines
treated with 100 μM resveratrol (Figure 16C-D) with no resulting decrease in survivin
expression (Figure 19B). Resveratrol showed no effect on the expression of SIRT1 or
the protein regulator of SIRT1, DBC1, in these cell lines (Figure 20). To determine
activation of AMPK after 2 hours of resveratrol treatment, levels of phosphorylation on
threonine 172 were measured by immunoblotting as this phosphorylation highly
correlates with kinase activity [238]. Although 300 μM resveratrol did activate AMPK
(Figure 21), which has been shown to cause dissociation of SIRT1 and DBC1 [210], co-
immunoprecipitation studies showed little to no association of SIRT1 and DBC1 in these
cells (Figure 22). In MDA-MB-231 cells there was little to no binding in any of the three
separate co-immunoprecipitation experiments conducted. The binding of SIRT1 and
DBC1 in the MDA-MB-231/PacR cells was more pronounced, but very erratic. Although
binding was seen in the untreated DMSO (100) and 100 μM resveratrol group in the first
trial, the second trial only week binding in untreated and DMSO (300). In the final trial,
Page 81
67
association was seen between SIRT1 and DBC1 in only the DMSO (100), 100 μM and
300 μM resveratrol groups. To ensure that our co-immunoprecipitation protocol was not
the cause of the erratic binding, a breast cancer cell line, the MDA-MB-468 cells, that
has been shown to have SIRT1 and DBC1 binding was used (Figure 23). The three
independent experiments with the MDA-MB-468 cells demonstrated more consistent
association between SIRT1 and DBC1. These data provide a possible mechanism for
both 100 and 300 μM resveratrol action that requires further investigation (Figure 24).
Page 82
68
Figure 18. Resveratrol Inhibits Survivin Expression at High Concentration. A)
Representative immunoblot of survivin at 48 hours after resveratrol treatment B)
Densitometry quantification normalized to actin of survivin after 48 hours C) 3 days and
D) 5 days (n=3). Error bars signify standard deviation (*p<0.05; **p<0.01; ***p<0.001; *p-
values compare treatment to respective DMSO control).
0
1
2
3
4
5
6
UT
DM
SO (1
00)
DM
SO (3
00)
100
μM R
ES
300
μM R
ES
UT
DM
SO (1
00)
DM
SO (3
00)
100
μM R
ES
300
μM R
ES
MDA-MB-231 MDA-MB-231/PacR
Rel
ativ
e su
rviv
in L
evel
(n
orm
aliz
ed to
act
in)
5 Days
*
00.20.40.60.8
11.21.41.61.8
UT
DM
SO (1
00)
DM
SO (3
00)
100
μM R
ES
300
μM R
ES
UT
DM
SO (1
00)
DM
SO (3
00)
100
μM R
ES
300
μM R
ES
MDA-MB-231 MDA-MB-231/PacR
Rel
ativ
e su
rviv
in L
evel
(n
orm
aliz
ed to
act
in)
48 Hours
*** **
A B
C D
0
0.5
1
1.5
2
2.5
UT
DM
SO (1
00)
DM
SO (3
00)
100
μM R
ES
300
μM R
ES
UT
DM
SO (1
00)
DM
SO (3
00)
100
μM R
ES
300
μM R
ES
MDA-MB-231 MDA-MB-231/PacR
Rel
ativ
e su
rviv
in L
evel
(n
orm
aliz
ed to
act
in)
3 Days
**
MDA-MB- 231 U
T D
MS
O (1
00)
DM
SO
(300
) 10
0 µM
RES
30
0 µM
RES
MDA-MB-231/PacR
UT
DM
SO
(100
) D
MS
O (3
00)
100
µM R
ES
300
µM R
ES
actin
survivin
48 Hours
Page 83
69
Figure 19. Caspase 7 Knockdown Does Not Affect Resveratrol-Induced Survivin
Decrease. A) Percent knockdown achieved in three independent experiments using a
pool of 4 siRNAs targeting Caspase 7 at 48 hours post a 96 hour transfection (n=3). B)
Densitometry quantification normalized to actin of survivin expression following 96 hour
siRNA transfection and subsequent 48-hour resveratrol treatment (n=3). Error bars
signify standard deviation (*p<0.05; **p<0.01; ***p<0.001; *p-values compare treatment
to respective DMSO control).
0
10
20
30
40
50
60
70
80
90
100
Non
-Tar
getin
g
Cas
pase
7
Non
-Tar
getin
g
Cas
pase
7
MDA-MB-231 MDA-MB-231/PacR
% K
nock
dow
n (c
ompa
red
to u
ntre
ated
)
0
0.1
0.2
0.3
0.4
0.5
0.6
0.7
0.8
0.9
1
UT
Non
-Tar
getin
g
Cas
pase
7 UT
Non
-Tar
getin
g
Cas
pase
7 UT
Non
-Tar
getin
g
Cas
pase
7 UT
Non
-Tar
getin
g
Cas
pase
7
UT 300 μM UT 300 μM
MDA-MB-231 MDA-MB-231/PacR
Rel
ativ
e su
rviv
in E
xpre
ssio
n (n
orm
aliz
ed to
act
in)
A
B
Page 84
70
Figure 20. Resveratrol Does Not Affect Protein Expression of DBC1 & SIRT1. A)
Representative immunoblots of SIRT1 and DBC1 after 2 hours of resveratrol treatment.
B) Densitometry quantitation normalized to actin of DBC1 and C) of SIRT1. Error bars
signify standard deviation (*p<0.05; **p<0.01; ***p<0.001; *p-values compare treatment
to respective DMSO control; †p-values compare untreated and DMSO control).
00.20.40.60.8
11.2
UT
DM
SO (1
00)
DM
SO (3
00)
100
uM R
ES
300
uM R
ES
UT
DM
SO (1
00)
DM
SO (3
00)
100
uM R
ES
300
uM R
ES
MDA-MB-231 MDA-MB-231/PacR
Rel
etiv
e S
IRT1
Lev
el
(Nor
mal
ized
to a
ctin
)
**
††† ††
00.10.20.30.40.50.60.70.80.9
1
UT
DM
SO (1
00)
DM
SO (3
00)
100
uM R
ES
300
uM R
ES
UT
DM
SO (1
00)
DM
SO (3
00)
100
uM R
ES
300
uM R
ES
MDA-MB-231 MDA-MB-231/PacR
Rel
ativ
e D
BC
1 Le
vel
(Nor
mal
ized
to a
ctin
) B
A
C
MDA-MB-231 MDA-MB-231/PacR
UT
DM
SO
(100
) D
MS
O (3
00)
100
µM R
ES
300
µM R
ES
UT
DM
SO
(100
) D
MS
O (3
00)
100
µM R
ES
300
µM R
ES
actin
SIRT1
DBC1
Page 85
71
Figure 21. Resveratrol Activates AMPK. A) Representative immunoblots of P-AMPK and
AMPK after 2 hours of resveratrol treatment. B) Densitometry quantitation of P-AMPK
normalized to total AMPK (*p<0.05; **p<0.01; ***p<0.001; *p-values compare treatment
to respective DMSO control; †p-values compare untreated and DMSO control).
MDA-MB- 231 MDA-MB-231/PacR
UT
DM
SO
(100
) D
MS
O (3
00)
100
µM R
ES
300
µM R
ES
P-AMPK
AMPK
actin U
T D
MS
O (1
00)
DM
SO
(300
) 10
0 µM
RES
30
0 µM
RES
0
0.5
1
1.5
2
2.5
3
UT
DM
SO (1
00)
DM
SO (3
00)
100
uM R
ES
300
uM R
ES
UT
DM
SO (1
00)
DM
SO (3
00)
100
uM R
ES
300
uM R
ES
MDA-MB-231 MDA-MB-231/PacR
Rel
etiv
e P
-AM
PK
Lev
el
(Nor
mal
ized
to A
MP
K)
***
* †
A
B
Page 86
72
Figure 22. Resveratrol Does Not Affect Binding of DBC1 & SIRT1. Three independent
trails of the immunoprecipitation of SIRT1 from cell lysates treated with resveratrol for 2
hours were conducted. Shown are the immunoblots from each trial probed for both
SIRT1 to show immunoprecipitation and DBC1 to show any co- immunoprecipitation. Far
left labels signify the trial number shown. A 1% lysate control and lysate and bead only
control were included for each trial.
MDA-MB-231 MDA-MB-231/PacR
UT
DM
SO
(100
)
DM
SO
(300
)
100
µM R
ES
300
µM R
ES
UT
DM
SO
(100
)
DM
SO
(300
) 10
0 µM
RES
30
0 µM
RES
SIRT1
DBC1 1%
Lys
ate
1% L
ysat
e
Lysa
te +
Bea
d
SIRT1
DBC1
SIRT1
DBC1
IP: SIRT1
1
2
3
Trial
Page 87
73
1% L
ysat
e
Lysa
te +
Bea
d
IP 1
IP 2
IP 3
SIRT1
DBC1
IP: SIRT1
Figure 23. SIRT1 & DBC1 Co-immunoprecipitate in MDA-MB-468 cells. Three
independent trails of the immunoprecipitation of SIRT1 from MDA-MB-468 cell lysates
treated with resveratrol for 2 hours were conducted. Shown is the immunoblot showing
each trail (IP 1-3 = immunoprecipitation trail 1-3) probed for both SIRT1 to show
immunoprecipitation and DBC1 to show any co- immunoprecipitation. A 1% lysate
control and lysate and bead only control were included.
Page 88
74
Figure 24. Mechanisms of Resveratrol Induced Apoptosis. A) Possible mechanism of
100 μM resveratrol treatment where resveratrol activates caspase 3 and 7 to lead to
apoptosis with no contribution from survivin. B) Possible mechanism of 300 μM
resveratrol treatment based on the data provided in this study showing the inhibition of
survivin expression with AMPK activation possibly upstream of survivin. The inhibition of
survivin allows activated caspase 3 and 7 to cause apoptosis. A “?” implies a gap in
mechanism understanding.
A B
Caspase 3/7
Mechanism of 100 μM Resveratrol
Resveratrol
Apoptosis
? Survivin
Resveratrol
Caspase 3/7
Apoptosis
Mechanism of 300 μM Resveratrol
AMPK?
Page 89
75
III. RESVERATROL AUGMENTS PACLITAXEL TREATMENT
To determine whether resveratrol treatment could re-sensitize the resistant cells
to paclitaxel, checkerboard drug combination assays were conducted as previously
described [231, 232]. The addition of micromolar (2.5-40 μM) amounts of resveratrol
simultaneously with paclitaxel resulted in a significant lowering of the IC50 value of
paclitaxel in both MDA-MB-231and MDA-MB-231/PacR cells without any change in
resveratrol IC50 (Figure 25). By comparing the effects the same ratios had on the
different cell lines, it appeared that less resveratrol was required to achieve similar fold
changes in IC50 in the resistant cells compared to the parental cells. A combination
treatment of 1 part paclitaxel to 2,560 parts resveratrol produced the same IC50 value in
both the MDA-MB-231 and MDA-MB-231/PacR cells; this IC50 value was significantly
lower than the IC50 value of paclitaxel alone in MDA-MB-231 cells. In both cells lines,
there were some ratios that caused a decrease of IC50 value of both drugs, though more
resveratrol was required in the MDA-MB-231 cells compared to the MDA-MB-231/PacR
cells to achieve this (Table 1). Most combinations did not give a synergistic effect, but
rather appear additive or even antagonistic when represented in an isobologram due to
the IC50 value of resveratrol not decreasing (Figure 26). Some combination ratios
resulted in similar IC50 values for both cell lines. In contrast, other combination ratios
significantly decreased the IC50 of the resistant cells but had no effect on the parental
cells suggesting that resveratrol may act on two different mechanisms to have a
combination effect, one that is specific to the resistant cells and one common to both
parental and resistant. Due to these observations, we hypothesized that the mechanism
of resistance of the MDA-MB-231/PacR cells was important for the effect of resveratrol
in combination with paclitaxel in these cells. These data were contrary to a previous
report that showed attenuation of paclitaxel by resveratrol with a 48-hour simultaneous
Page 90
76
treatment [226]. Interestingly, we see similar attenuation at 24 hours in the MDA-MB-231
cells at both 10 and 100 μM resveratrol treatment (Figure 27). For the MDA-MB-
231/PacR cells, 10 μM resveratrol treatment has no effect on paclitaxel whereas there is
no attenuation is seen with 100 μM resveratrol treatment.
Page 91
77
Figure 25. Resveratrol Augments Paclitaxel Treatment in MDA-MB-231 & MDA-MB-
231/PacR Cells. Dose response curves of the constant drug ratios from the 5-day
checkerboard combination assay in A) MDA-MB-231 and B) MDA-MB-231/PacR cells
(n=3). Each drug ratio has two graphs one representing the % inhibition versus the
amount of paclitaxel in the mixture as well as one representing the % inhibition versus
the amount of resveratrol in the mixture. Standard deviations for individual point were
0102030405060708090
100
0.0001 0.001 0.01 0.1 1 10 100
% In
hibi
tion
Paclitaxel in Mixture (μM) Resveratrol in Mixture (μM)
MDA-MB-231 Paclitaxel Alone
Resveratrol Alone
1:2560
1:5120
1:10240
1:20480
1:40960
1:81920
1:163840
Paclitaxel:Resveratrol
* *
* * *
0102030405060708090
100
0.0001 0.001 0.01 0.1 1 10 100
% In
hibi
tion
Paclitaxel in Mixture (μM) Resveratrol in Mixture (μM)
MDA-MB-231/PacR
Paclitaxel Alone
Resveratrol Alone
1:320
1:640
1:1280
1:2560
1:5120
1:10240
Paclitaxel:Resveratrol
*
*
*
A
B
Page 92
78
less than 50% (*p<0.05; **p<0.01; ***p<0.001; *p-values compare combination treatment
IC50 values to the paclitaxel alone treatment IC50 value).
Page 93
79
Paclitaxel:
Resveratrol
Paclitaxel IC50
(nM)
Fold Decrease
compared to
Paclitaxel Alone
Resveratrol IC50
(μM)
Fold Decrease
compared to
Resveratrol Alone
MD
A-M
B-2
31
Alone 4.40 ± 1.49 - 7.79 ± 0.57 -
1:40960 0.16 ± 0.06*** 28.19 6.39 ± 2.58 1.22
1:20480 0.41 ± 0.09*** 10.75 8.38 ± 1.83 0.93
1:10240 0.80 ± 0.11*** 5.53 8.15 ± 1.08 0.96
1:5120 1.48 ± 0.24*** 2.97 7.60 ± 1.22 1.02
1:2560 2.42 ± 0.38* 1.82 6.20 ± 0.98 1.26
1:1280 2.91 ± 0.42 1.51 3.73 ± 0.53* 2.09
1:640 3.34 ± 0.42 1.32 2.14 ± 0.27** 3.64
1:320 2.41 ± 0.21* 1.82 0.77 ± 0.07*** 10.08
M
DA
-MB
-231
/Pac
R
Alone 37.64 ± 13.29 - 9.07 ± 1.57 -
1:2560 2.52 ± 0.61*** 14.93 6.45 ± 1.57 1.41
1:1280 6.77 ± 1.23*** 5.56 8.66 ± 1.58 1.05
1:640 15.28 ± 2.11* 2.46 9.78 ± 1.35 0.93
1:320 25.67 ± 4.21 1.47 8.21 ± 1.35 1.10
1:160 35.96 ± 10.01 1.05 5.75 ± 1.60 1.58
1:80 25.61 ± 9.37 1.47 2.05 ± 0.75*** 4.43
1:40 2.51 ± 2.57*** 15.00 0.10 ± 0.10*** 90.41
1:20 0.16 ± 0.27*** 240.95 0.00 ± 0.01*** 2904.51
Table 1. Combination Treatment Decreases Paclitaxel IC50. IC50 values for paclitaxel and
resveratrol plus or minus the standard deviation and the fold decrease of IC50 compared
to each drug alone of all combination treatments (*p<0.05; **p<0.01; ***p<0.001; *p-
values compare IC50 values of combination treatment to individual drug alone).
Page 94
80
Figure 26. The Combination of Resveratrol and Paclitaxel is not Synergistic.
Isobologram graphs showing the combination effect status of each drug ratio from the 5-
day checkerboard combination assay in A) MDA-MB-231 and B) MDA-MB-231/PacR
cells. The average IC50 values of resveratrol alone on the y-axis and of paclitaxel alone
on the x-axis are connected to provide the line of additivity. Each drug ratio is a single
point based on the average IC50 value for both drugs at this ratio. Any point that falls on
the line of additivity denotes an additive effect, below the line denotes synergistic effect,
and above the line denotes an antagonistic effect of the drug combination.
0.001.002.003.004.005.006.007.008.009.00
10.00
0.00 10.00 20.00 30.00 40.00
Res
vera
trol I
C50
(μM
)
Paclitaxel IC50 (nM)
MDA-MB-231/PacR
Alone
1:2560
1:1280
1:640
1:320
1:160
1:80
1:40
1:20
Paclitaxel:Resveratrol
0.001.002.003.004.005.006.007.008.009.00
10.00
0.00 2.00 4.00 6.00
Res
vera
trol I
C50
(μM
)
Paclitaxel IC50 (nM)
MDA-MB-231
Alone
1:40960
1:20480
1:10240
1:5120
1:2560
1:1280
1:640
1:320
Paclitaxel:Resveratrol
A
B
Page 95
81
Figure 27. Resveratrol Can Attenuate Paclitaxel Treatment with Short-term,
Simultaneous Treatment. Treatment with a 24-hour simultaneous treatment of 100 nM
paclitaxel treatment with 0, 10, or 100 μM resveratrol. Resveratrol A) attenuates
paclitaxel in MDA-MB-231 cells and B) has no effect on MDA-MB-231/PacR cells at 10
μM resveratrol with only a small decrease of growth inhibition at 100 μM resveratrol
(n=3). Error bars represent standard deviation (*p<0.05; **p<0.01; ***p<0.001; *p-values
compare resveratrol treatment to paclitaxel alone treatment).
0
20
40
60
80
100
120
0 10 100Gro
wth
Inhi
bitio
n (%
of u
ntre
ated
con
trol)
Resveratrol (μM)
MDA-MB-231
** *
B A
0
20
40
60
80
100
120
0 10 100Gro
wth
Inhi
bitio
n (%
of u
ntre
ated
con
trol)
Resveratrol (μM)
MDA-MB-231/PacR
*
Page 96
82
IV. UPREGULATION OF P-GLYCOPROTEIN & CYP2C8 CONTRIBUTES TO
PACLITAXEL RESISTANCE IN MDA-MB-231/PacR CELLS
To determine the mechanism of resistance in these cells, a commercial PCR
array for human cancer drug resistance genes was used. Analysis of the PCR array
identified two genes to be highly upregulated in the resistant MDA-MB-231/PacR cells
compared to the parental MDA-MB-231 that are known to be factors in paclitaxel
resistance, ABCB1 and CYP2C8 (Table 2). The full list of genes and the expression
changes are shown in Appendix A. These two genes were focused on because of their
known relevance to paclitaxel resistance in breast cancer. The over-expression ABCB1
and CYP2C8 was validated by real-time RT-PCR and the levels were compared
between the parental MDA-MB-231 and the MDA-MB-231/PacR or MDA-MB-231/PacR-
Hi cells. ABCB1 was overexpressed in MDA-MB-231/PacR and MDA-MB-231/PacR-Hi
cells compared to the parental line (Figure 28A). CYP2C8 was also significantly
upregulated in both cells lines compared to the parental cells (Figure 28B). Interestingly,
there was also a significantly higher expression of CYP2C8 in the MDA-MB-231/PacR
cells compared to the MDA-MB-231/PacR-Hi cells.
Finally, the functional importance of the gene expression data was tested with
inhibitors of the protein products of the genes. Verapamil was used to inhibit P-gp, the
protein product of ABCB1; and trimethoprim was used to selectively inhibit CYP2C8
[239]. Inhibition of P-gp or CYP2C8 alone decreased the resistance of the MDA-MB-
231/PacR cells to paclitaxel, as measured by proliferation assays (Figure 29). The
paclitaxel IC50 for MDA-MB-231/PacR cells alone was 61 nM. After trimethoprim
treatment, the IC50 decreased to 40 nM. After verapamil treatment the IC50 decreased to
8 nM. Simultaneous inhibition of both P-gp and CYP2C8 did not further lower the IC50
value of the MDA-MB-231/PacR cells at 9 nM, likely because verapamil alone lowered
Page 97
83
the paclitaxel IC50 to nearly that of the parental MDA-MB-231 cells, which is 5 nM.
Interestingly, only inhibition of P-gp significantly decreased the resistance to paclitaxel of
the MDA-MB-231/PacR-Hi cells from the paclitaxel IC50 of 117 nM to 12 nM. There was
no statistical difference between the paclitaxel IC50 of MDA-MB-231 and the IC50 values
of the MDA-MB-231/PacR or MDA-MB-231/PacR-Hi cells after verapamil or the
verapamil and trimethoprim treatment. Additionally, there were no differences between
the paclitaxel IC50 values in any of the cells lines between the verapamil and the
verapamil and trimethoprim treatments. Therefore, it seems that although P-gp,
CYP2C8, and possibly other factors are relevant to the resistance, P-gp is likely the
more important factor in both the MDA-MB-231/PacR and MDA-MB-231/PacR-Hi cells.
Page 98
84
Symbol Description Function
Fold Change T-TEST Fold Up- or Down-
Regulation
MDA-MB-
231/PacR /
MDA-MB-231
p-valuea
MDA-MB-
231/PacR / MDA-
MB-231
ABCB1 ATP-binding cassette, sub-family B
(MDR/TAP), member 1
Xenobiotic
metabolism 181.99 0.21 181.99
CYP2C8 Cytochrome P450, family 2, subfamily
C, polypeptide 8
Xenobiotic
metabolism 12.51 0.16 12.51
CYP1A1 Cytochrome P450, family 1, subfamily
A, polypeptide 1
Xenobiotic
metabolism 5.06 0.16 5.06
ATM Ataxia telangiectasia mutated S/T protein kinase 3.35 0.01 3.35
TNFRSF11A Tumor necrosis factor receptor
superfamily, member 11a NFKB activator 3.11 0.00 3.11
APC Adenomatous polyposis coli Tumor repressor 3.11 0.05 3.11
CYP2E1
Cytochrome P450, family 2, subfamily
E, polypeptide 1
Xenobiotic
metabolism 0.03 0.01 -31.07
ERBB4 V-erb-a erythroblastic leukemia viral
oncogene homolog 4 (avian)
Receptor tyrosine
kinase 0.15 0.02 -6.71
AR Androgen receptor Androgen
receptor 0.21 0.04 -4.80
ABCC3 ATP-binding cassette, sub-family C,
member 3
Xenobiotic
metabolism 0.23 0.14 -4.27
ABCG2 ATP-binding cassette, sub-family G,
member 2
Xenobiotic
metabolism 0.24 0.11 -4.11
FOS FBJ murine osteosarcoma viral
oncogene homolog
Transcription
factor 0.32 0.06 -3.16
aP-values were calculated with a Student’s T-Test of the replicate 2^(- ΔCt) values for each gene
Table 2. PCR Array Identified Two Genes, ABCB1 & CYP2C8, Implicated in Breast
Cancer Paclitaxel Resistance.
Page 99
85
F
i
g
Figure 28. ABCB1 & CYP2C8 are overexpressed in MDA-MB-231/PacR & MDA-MB-
231/PacR-Hi Cells. Fold change of gene expression from qPCR measuring mRNA levels
in MDA-MB-231/PacR and MDA-MB-231/PacR-Hi cells compared to MDA-MB-231 cells
A) of ABCB1 B) of CYP2C8 (n=3). Error bars signify standard deviation. P-values were
calculated with a Student’s T-Test of the replicate 2^(- ΔCt) values for each gene and
compare resistant cell line to parental line (*p<0.05; **p<0.01; ***p<0.001; * p-value
compares fold changes of each resistant line and the parental line; † p-value compares
fold changes of MDA-MB-231/PacR to that of MDA-MB-231/PacR-Hi).
0
500
1000
1500
2000
2500
3000
3500
4000
4500
5000
MD
A-M
B-2
31/P
acR
MD
A-M
B-2
31/P
acR
-Hi
Fold
Cha
nge
of A
BCB1
Exp
ress
ion
(com
pare
d to
MD
A-M
B-23
1)
*
**
0
5
10
15
20
25
30
MD
A-M
B-2
31/P
acR
MD
A-M
B-2
31/P
acR
-Hi
Fold
Cha
nge
of C
YP2C
8 Ex
pres
sion
(c
ompa
red
to M
DA
-MB-
231)
**
***
†
A B
Page 100
86
Figure 29. Inhibition of P-glycoprotein & CYP2C8 Re-sensitize MDA-MB-231/PacR Cells
to Paclitaxel. The 5-day IC50 values for MDA-MB-231, MDA-MB-231/PacR and MDA-
MB-231/PacR-Hi cells with paclitaxel alone or in simultaneous combination with the P-gp
inhibitor, verapamil (1 μM), the CYP2C8 inhibitor, trimethoprim (25 μM), or both (n=3).
Error bars signify standard deviation (*p<0.05; **p<0.01; ***p<0.001; *p-values compare
inhibitor treatment to paclitaxel alone treatment). There was no statistical difference
between the MDA-MB-231 and MDA-MB-231/PacR or MDA-MB-231/PacR-Hi cells after
verapamil or the verapamil and trimethoprim treatment. Additionally, there were no
differences between any of the cells lines between the verapamil and the verapamil and
trimethoprim treatments
0
0.02
0.04
0.06
0.08
0.1
0.12
0.14
0.16
0.18
0.2
Paclitaxel Paclitaxel +Verapamil
Paclitaxel +Trimethoprim
Paclitaxel +Verapamil +Trimethoprim
Pacl
itaxe
l IC
50 (μ
M)
MDA-MB-231 MDA-MB-231/PacR MDA-MB-231/PacR-Hi
***
*
*** ** **
Page 101
87
CHAPTER 4: DISCUSSION and FUTURE DIRECTIONS
I. RESISTANT CELLULAR MODEL GENERATION
A novel, paclitaxel-resistant TNBC cell line was successfully developed with a
12-fold resistance to paclitaxel compared to parental cells. The intermittent, stepwise
treatment method (Figure 7) developed a more resistant and better growing population
of resistant cells compared to a continuous treatment method. Furthermore, this
intermittent treatment method mimics acquired paclitaxel resistance that can occur in
patients after intermittent paclitaxel treatment of a primary tumor where any remaining
cancer cells are paclitaxel resistant and can then recur as a paclitaxel-resistant tumor.
Clinically relevant acquired drug resistance spans from 2- to 12-fold increased
resistance compared to cells from tumors prior to treatment [240]. Therefore, this cellular
model more closely mimics what is observed clinically when compared to other
laboratory models, where resistance is so high it is not clinically meaningful [240].
Importantly, this clinically relevant resistance is maintained though the cells are no
longer cultured in paclitaxel unlike other paclitaxel-resistant cell lines that must be
continuously grown in the presence of the drug to maintain resistance [240]. Though
generated cellular models are useful for studying cancer resistance, it is important that
results from such a model system are further studied for their clinical relevance [37].
II. RESVERATROL INDUCES CELL PROLIFERATION INHIBITION, SENESCENCE,
AND APOPTOSIS
The data presented here suggest that resveratrol induces cell proliferation
inhibition, senescence, and apoptosis in TNBC cells regardless of paclitaxel sensitivity.
Page 102
88
The low R2 value, the correlation coefficient of the line of best fit, of the clone paclitaxel
and resveratrol IC50 values analysis indicates that there is no correlation between
paclitaxel resistance and resveratrol sensitivity (Figure 8). Furthermore, there was no
statistically significant difference between the paclitaxel-resistant and -sensitive cells in
any of the studies conducted with resveratrol alone.
In MDA-MB-231 and MDA-MB-231/PacR cells, resveratrol inhibited cell
proliferation and induced senescence and apoptosis (Figures 9-22). In cell count
proliferation (Figure 9) and colony formation assays (Figure 10), 100 μM resveratrol
treatment completely inhibited the ability of the parental and resistant cells to proliferate.
In the cell count assay, 10 μM resveratrol treatment significantly decreased proliferation
in both cell lines (Figure 9) but only significantly decreased colony formation in the
resistant cells in the survival assay (Figure 10A). The differential effect of colony
formation at 10 μM resveratrol between the two methods suggests resveratrol may affect
the ability of MDA-MB-231/PacR, but not MDA-MB-231, cells to attach to the plate after
treatment. In addition, the proliferation data suggest that although 10 μM resveratrol was
able to inhibit proliferation after 3 days (Figure 9), this effect was not irreversible as
evidenced by the ability of colonies to form after removal of resveratrol (Figure 10). This
is in contrast to the effect of 100 μM resveratrol treatment, where cell counts showed
that cells plated were still attached to the plate though they had not proliferated.
Resveratrol alone did not induce cell cycle arrest (Figure 11), which has
previously been shown in multiple cancer cell lines [161]. It is possible, however, that
arrest was missed and occurred before the Sub-G1 accumulation occurred with 300 μM
resveratrol at 48 hours, as no other time points were assessed. Additionally, it is
possible that lower concentrations including, 10 and 100 μM, of resveratrol would have
shown cell cycle arrest at time points longer than 48 hours. Interestingly, a peak was
observed in both cell populations that may suggest micronucleation in these cells. As
Page 103
89
discussed previously, micronucleated cells can accumulate between G1 and S phase as
well as after G2/M phase due to their DNA content [236]. Though we did find the
presence of micronucleated cells in the untreated cell lines (Figure 12), measuring the
increase of micronucleation after 300 μM resveratrol treatment using
immunofluorescence was not possible as very few cells remain attached to a slide.
Micronucleated cells, a sign of genotoxic stress, are common in cancer cell populations;
however, the fate of micronucleated cells is unclear. Micronuclei may re-incorporate into
the nucleus, the cell may destroy the micronucleus and continue to proliferate though
divisions are likely limited, or cell may undergo apoptosis [241]. Consequently, the
significance of resveratrol treatment increasing miconucleation is uncertain.
In the context of the senescence and apoptosis data, the proliferation and cell
cycle data is further explained. After 3 days of treatment, 37% of MDA-MB-231 and 38%
of MDA-MB-231/PacR cells treated with 100 μM resveratrol were senescent (Figure 13).
As senescent cells can arrest in G1, G2/M or S phase [194], this increase in senescence
can explain why there is no cell proliferation and no cell cycle arrest concurrently.
Additionally, at the same 3-day time point, 31% of MDA-MB-231 and 19% of MDA-MB-
231/PacR cells treated with 100 μM resveratrol are undergoing apoptosis (Figure 14).
Therefore, after 3 days of 100 μM resveratrol treatment, approximately 60% of both cell
lines have lost their ability to proliferate as they are either senescent or apoptotic. It is
also possible that by 3 days after treatment, there is also some cell cycle arrest or
autophagy that explains why the remaining cells are not proliferating according to the
cell proliferation data. In further support of additional mechanisms of action, 10 μM
resveratrol treatment in both cell lines showed no cell cycle arrest and little senescence
induction while cell proliferation was significantly inhibited, though this proliferation
inhibition was partially reversible as suggested by colony formation. By 5 days after 100
μM resveratrol treatment, 64% and 53% of MDA-MB-231 and MDA-MB-231/PacR cells,
Page 104
90
respectively, have undergone apoptosis, and so nearly all cells in both cell lines are not
able to divide. After 48 hours of 300 μM resveratrol treatment, 49% and 34% of MDA-
MB-231 and MDA-MB-231/PacR cells respectively, accumulated in Sub-G1 phase,
which is consistent with late apoptosis (Figure 12). Correspondingly, the apoptosis data
shows that by 3 days 300 μM resveratrol treatment, nearly all of the cells in both cell
lines are in either early or late apoptosis (Figure 14).
Though the method of measuring apoptosis used in this study cannot distinguish
between late apoptosis and necrosis, the presence of early apoptosis and the activation
of caspase 3 and caspase 7 indicate that the cells are likely undergoing apoptosis. With
300 μM resveratrol treatment, a large activation of caspase 7 can be seen at 48 hours.
For 100 μM resveratrol treatment, caspase 7 activation began at 48 hours (Figure 15)
and increased through 3 and 5 days suggesting a slow acting caspase response (Figure
16). In contrast, the 48-hour caspase 3 data suggest this time point is likely the end of
activation as none is seen at 3 or 5 days, and so this is a faster process than caspase 7
activation (Figure 17). In addition, these data imply caspase 3 is less important than
caspase 7 in the 100 μM resveratrol as procaspase 3 never decreases and cleaved
caspase 3 was never detected at this treatment concentration. It is important to note that
the early and late apoptosis seen at 5 days may represent the heterogeneity of the cell
population as this time point would suggest delayed onset apoptosis or other forms of
cell death such as autophagy or necroptosis.
The mechanism of resveratrol-induced apoptosis in this model does not appear
to be dependent on the decrease of survivin expression, though a dose-dependent
decrease of survivin has been shown in multiple other human cancer cell lines [212,
242-244]. Survivin protein levels were only decreased by 300 μM resveratrol treatment
(Figure 18). This decrease was complete by 48 hours and was sustained at least
through 5 days. Treatment with 100 μM resveratrol did not decrease survivin even after
Page 105
91
5 days. This is interesting because while apoptosis was observed at 3 and 5 days of 100
μM treatment, there was no significant difference in survivin protein levels, suggesting
survivin may not be critical in resveratrol-induced apoptosis in these cells at this lower
concentration (Figure 18C-D). It is possible there is a dose-dependent relationship with a
small window of efficacy between 100 and 300 μM, but it is also possible the decrease is
an off-target effect of resveratrol. Importantly, knockdown of caspase 7 did not result in
any recovery of survivin protein levels (Figure 19), which implies that the decrease of
survivin is not due to the cleavage activity of caspase 7 leading to the degradation of
survivin protein, which is further supported by the fact that although caspase 7 activation
is seen after 3 and 5 days of 100 μM resveratrol treatment, there is no decrease of
survivin levels. Therefore, survivin may only play a role at high concentration resveratrol
treatment or may be an off-target effect of resveratrol in these cells.
Resveratrol did not affect protein levels of SIRT1 or DBC1 (Figure 20) but did
activate AMPK (Figure 17), as expected if resveratrol were activating SIRT1 by
interrupting the binding of SIRT1 and DBC1. However, we observed little to no binding
between SIRT1 and DBC1 in the MDA-MB-231 cells (Figure 22) in accordance with a
previous study which determined the amount of binding between SIRT1 and DBC1 in
various breast cancer cell lines [245]. However, some stronger binding between SIRT1
and DBC1 was seen in the MDA-MB-231/PacR cells though this binding was very erratic
across independent experiments, making this data difficult to interpret. To ensure the
results seen were not due to an ineffective protocol, the experiment was repeated with a
cell line recognized by Sung et al. to have association between SIRT1 and DBC1. MDA-
MB-468 cells showed much more consistent binding between SIRT1 and DBC1
suggesting that the lack of binding in the co-immunoprecipitation experiment in MDA-
MB-231 was due to little SIRT1 and DBC1 association (Figure 23). However, this does
not explain the erratic binding seen in and MDA-MB-231/PacR cells. Together these
Page 106
92
data suggest the mechanism of resveratrol-induced apoptosis in these cells is not
dependent on decreased survivin expression, changes in SIRT1 and DBC1 levels, nor
the binding of SIRT1 and DBC1. However, it is possible that resveratrol acts through
SIRT1 activation in these cells by allosteric activation [246] or altering SIRT1 localization
[247]. These data provide a mechanism that is still not clearly understood (Figure 24).
Taken together, these studies on the efficacy and mechanism of resveratrol in
this cellular model of paclitaxel-sensitive and -resistant TNBCs point out that resveratrol
is capable of inhibiting cell proliferation at low micromolar amounts and causes
apoptosis at higher concentrations. Although the mechanism of resveratrol-induced
apoptosis is not completely understood, it is possible that survivin and SIRT1 play a role
as suggested previously [212]. Notably, the effects of resveratrol were not significantly
different between the paclitaxel-resistant and -sensitive cells, suggesting resveratrol may
be useful in treating TNBCs regardless of paclitaxel sensitivity.
These findings highlight the need for further examination of the mechanism of
resveratrol as a single agent in these cell lines. It is possible that the cells accumulated
after G2/M phase as well as in S phase are micronucleated cells. Whether the
population is indeed micronucleated cells could be determined with simultaneous flow
cytometry and imaging. This method combined with cell sorting may also help determine
what the fate of the cells may be and how it is important in the context of resveratrol
treatment. In addition, a more complete time course of cell cycle analysis after
resveratrol treatment would further elucidate the timeline of resveratrol effects.
Determination of possible autophagy caused by resveratrol could explain the gap in cell
proliferation, senescence and apoptosis data. Further examination to better understand
what role, if any, survivin has in resveratrol treatment is also needed. Whether there is a
dose-dependent response between 100 and 300 μM concentrations of resveratrol can
be determined with immunoblotting, and whether survivin is required for resveratrol-
Page 107
93
induced apoptosis can be assessed with stable survivin knockdowns. However, further
survivin studies will not provide information on the mechanism of resveratrol-induced
apoptosis at 100 μM treatment as survivin does not appear to important at this
concentration. Therefore, further studies need to be conducted to determine the
mechanism of resveratrol at this lower concentration as well. Considering previous work
on resveratrol action, there are many possibilities for this mechanism that can be
explored, though perhaps the most likely to be important in this model are activation of
ceramide synthesis [207] and inhibition of NF-κB promoter activity [208] as these have
been shown to be important factors in MDA-MB-231 cells. Ceramide is important
mediator in cellular stress response, and the accumulation of ceramide is growth
inhibitory and pro-apoptotic [248]. The inhibition of the oncogenic NF-κB, which is
constitutively activated in MDA-MB-231 cells and many other cancers, can promote
cancer cells to stop proliferating or undergo apoptosis [249]. Finally, there is currently no
way to directly measure SIRT activity within a cell line, which makes determining
resveratrol action on SIRT1 difficult. A common measure of SIRT1 activity in cells is to
measure the amount of p53 that is acetylated using immunobloting with an antibody
specific for aceteylated p53; lower acetylation of p53 suggests higher SIRT1 activity as
p53 is a substrate for SIRT1. This method was attempted in the present study without
success, possibly due to the mutated p53 in the cells. A fluorometric assay using a cell
extract can measure SIRT1 activity directly; however, in the presence of resveratrol, the
fluorescent probe has been shown to affect the results of these assays [250]. An
important study would be the examination of the acetylation status of the survivin
promoter after resveratrol treatment if survivin is shown to be important in resveratrol-
induced apoptosis. A decrease of acetylation would be good evidence of SIRT1
activation by resveratrol as has been previously shown [212]. In addition to this, SIRT1
knockdown would determine the importance of SIRT1 in resveratrol-induced apoptosis.
Page 108
94
Therefore, chromatin immunoprecipitation and stable SIRT1 knockdown would be the
best options for further experiments into SIRT1 activation by resveratrol.
III. RESVERATROL AUGMENTS PACLITAXEL TREATMENT
Importantly, our data show that resveratrol can augment the effects of paclitaxel
when used in simultaneous combination (Figure 25). This is contrary to a previous report
showing resveratrol to attenuate paclitaxel treatment in MDA-MB-231 cells [226].
Interestingly, Fukui et al. used a 48-hour simultaneous treatment, and previous
experiments from the present study showed a 24-hour time point of resveratrol treatment
either had no effect or caused similar attenuation of paclitaxel treatment (Figure 27). The
present study suggests at a 5-day time point resveratrol enhances paclitaxel treatment.
The IC50 values of paclitaxel for both the parental and the resistant cells were lowered
significantly with the addition of resveratrol. Notably, addition of resveratrol decreased
the paclitaxel IC50 value of the resistant MDA-MB-231/PacR cells to the IC50 value of the
parental line. Moreover, the IC50 value could be lowered below that of the parental line
with more resveratrol. A trend emerged in these data suggesting the more resveratrol
that there is in the combination solution, the lower the resulting paclitaxel IC50 value. This
was true in both the parental and the resistant cells. It is most likely that higher amounts
of resveratrol in the MDA-MB-231/PacR cells could lower the IC50 of paclitaxel to similar
levels as the combination treatment achieved in the MDA-MB-231 cells. In addition,
lower concentrations of resveratrol decreased the IC50 value of both drugs compared to
the single drugs alone (Table 1). In fact, with concentrations of resveratrol and paclitaxel
similar to those used by Fukui et al., this study shows that after 5 days the combination
of resveratrol and paclitaxel is synergistic (Figure 26). It is important to note that
although the isobologram analysis shows that these combinations are largely
Page 109
95
antagonistic (Figure 26), this was due to the resveratrol IC50 remaining the same while
the paclitaxel IC50 decreased. Consequently, this is not the most useful measure of
combination success in these circumstances. Critically, the fact that synergy was not
widely achieved is not of concern as a desirable decrease of paclitaxel IC50 was
achieved and necessary amounts of resveratrol are attainable and well tolerated in
humans as well as inexpensive. Both high concentrations of resveratrol decreasing the
paclitaxel IC50 with no change in resveratrol IC50 and lower concentrations of resveratrol
decreasing both paclitaxel and resveratrol IC50 could be useful clinical tools.
Interestingly, some ratios that significantly lowered the resistance of the MDA-MB-
231/PacR cells had no effect on the parental cells. Considered in the context of the trend
of the data, this suggests resveratrol may be acting of two different mechanisms; one
that is specific to the resistance of the cells and one that is common to both the parental
and resistant cells. Together, these data suggest resveratrol could be used to treat
TNBCs in combination with paclitaxel to sensitize paclitaxel-resistance cancers and
decrease the dose of paclitaxel needed without changing the efficacy of treatment. This
proposed regimen could potentially both improve outcomes for patients with paclitaxel-
resistant cancers and decrease the general toxicity caused by paclitaxel in patients with
both paclitaxel-resistant and -sensitive cancers.
Further combination studies are needed to ensure the trend is correct and the
effects of higher amounts of resveratrol in MDA-MB-231/PacR cells as well as the
effects of lower amounts of resveratrol in MDA-MB-231 cells. It will be important to
determine if the combination of resveratrol and paclitaxel not only inhibits cell
proliferation, as was estimated with the checkerboard combination assay, but also
induces apoptosis. Whether the combination can only inhibit growth or can also induce
apoptosis will have important implications in the clinical use of the combination. Better
understanding of the combination effect will help determine the correct treatment
Page 110
96
administration and regimen for in vivo studies, which will need to be conducted to
demonstrate that the combination is effective in tumors. Determination of the
combination mechanism will also be important in order to provide a pharmacodynamic
target that can then be used in animal and human studies to ensure that the intended
target is hit by the treatment.
Due to the classification of resveratrol as a dietary supplement, clinical trials are
a possibility. However, there are important points to consider before human trials are
attempted. The first consideration is that, although resveratrol alone is very well tolerated
in humans, it is possible that the combination of resveratrol and paclitaxel could increase
the toxicity of paclitaxel. Due to the possibility of increasing paclitaxel accumulation by
decreasing P-gp expression, liver toxicity is of concern. Importantly, liver toxicity can be
closely monitored in human subjects. Perhaps of greatest concern is the dose limiting
neurotoxicity of paclitaxel and the effects of the combination treatment on peripheral
neurons, which can be tested in vitro using either dorsal root ganglia from rats or those
derived from induced pluripotent stem cells from humans. Furthermore, as a possible
alternative to doing the extensive mouse studies before clinical trials, the cells used in
this study could be used in 3-dimentional cultures to better estimate the in vivo relevance
of the combination study. Cells are grown in matrigel or low-attachment dishes with
serum free media containing growth factors to promote proliferation and will form
mammospheres in the media [251]. The mammary stem cells in the culture created
provide the multiple cell types and the structure of a tumor that would be present in vivo
[252]. This system mimics tumor drug delivery and effects more closely than cells grown
in 2-dimentional cultures [252].
However, the determination of efficacy and toxicity in mice may still be a critical
step between cell line and human studies. For these studies, the formulation of
resveratrol will have to be carefully considered prior to these in vivo studies. In addition,
Page 111
97
pilot studies would need to be conducted to determine any changes in pharmacokinetics
when the drugs are combined and the best administration method of resveratrol, oral
gavage, which mimics oral dosing in humans, or intraperitoneal injection, which is
common among resveratrol studies. It is likely that daily dosage of resveratrol would be
used due the pharmacokinetic properties, and that paclitaxel in PBS would be
administered as an intraperitoneal injection once a week as this regimen is commonly
used in mice as it mimics the dosing in humans. Depending on whether the treatment
proves to inhibit cell proliferation only or also causes apoptosis will dictate whether these
studies focus on prevention of tumor growth or also tumor shrinking. These studies
would likely be conducted with orthotopic xenograft mouse models implanting the cells
used in this study into the mammary fat pad of the highly immunodeficient NOD.Cg-
Prkdcscid Il2rgtm1Wjl/SzJ (NSG) mice [253] and comparing parental and resistant cells, as
well as mice treated with vehicle, paclitaxel, resveratrol or a combination of paclitaxel
and resveratrol. As an alternative to this model, a more clinically relevant model may be
patient-derived xenografts, where human breast tumor tissue samples are implanted into
the mammary fat pad of mice [254].
IV. UPREGULATION OF P-GLYCOPROTEIN & CYP2C8 CONTRIBUTES TO
PACLITAXEL RESISTANCE IN MDA-MB-231/PacR CELLS
These data show ABCB1 and CYP2C8 genes were highly overexpressed in the
resistant cells compared to the parental cells (Table 2, Figure 28). These two genes
were focused on because of their known relevance to paclitaxel resistance in breast
cancer; however, other genes identified by the PCR array may also play a role in the
resistance mechanism. Only the genes represented in Table 2 will be further discussed
here; see Appendix A for all genes tested. It is unlikely that CYP1A1 as it has no
Page 112
98
reported connection of paclitaxel resistance. However, it is possible that the decrease of
CYP2E1 plays some role as it has been reported that the presence of CYP2E1 can
augment paclitaxel [255]. Though the over expression of ABCC3 and ABCG2 has been
shown to confer paclitaxel resistance in cancer cells [256, 257], the expression of these
genes decreases in the resistant cells compared to the parental cells. The increased
expression of NFκB activator, TNFRSF11A, should not be relevant as NFκB is
constitutively active in these cells [258]. The remaining gene changes in Table 2, ATM,
APC, ERBB4, AR, and FOS, have not been shown to be relevant to triple negative
breast cancers. Therefore, the overexpression of the ABCB1 and CYP2C8 genes are
the most likely factors to be importantin the resistance mechanism.
The product of ABCB1, P-gp, is an efflux pump that can remove paclitaxel from
cells. CYP2C8 is the main metabolizing enzyme for paclitaxel that forms a 30-fold less
active metabolite, 6α-OHP [123]. Interestingly, though overexpression of CYP2C8 has
previously shown to be involved in paclitaxel resistance, this was a transient induction
that was reversed when the cells were no longer grown in the presence of paclitaxel
[137], which is contrary to the more permanent gene amplification seen in this cell model
of paclitaxel resistance. The increased expression of P-gp and CYP2C8 could allow
these resistant cells to both pump paclitaxel out more quickly and to break it down to a
less active metabolite more efficiently than the parental line. This effect would prevent
the accumulation of paclitaxel in the cell, resulting in the need for much higher
concentrations of paclitaxel to kill the cells. Importantly, inhibition of P-gp resulted in a
decrease of paclitaxel resistance of MDA-MB-231/PacR and MDA-MB-231/PacR-Hi cells
(Figure 26). Interestingly, inhibition of CYP2C8 was capable of decreasing the paclitaxel
resistance of MDA-MB-231/PacR cells but not MDA-MB-231/PacR-Hi cells. Considering
that the MDA-MB-231/PacR-Hi cells have higher resistance, lower CYP2C8 gene
expression, and less sensitivity to the CYP2C8 inhibitor compared to the MDA-MB-
Page 113
99
231/PacR cells implies that CYP2C8 is a less important factor in the mechanism of
paclitaxel resistance than P-gp. Additionally, the MDA-MB-231/PacR cells may have
another factor contributing to resistance, as verapamil did not entirely remove paclitaxel
resistance though higher verapamil may have removed all resistance. Collectively, these
results suggest upregulation of P-gp is the most important factor in the paclitaxel
resistance of these cells and pharmacological inhibition of P-gp can overcome the
paclitaxel resistance acquired in these cells.
Resveratrol has been shown to decrease the formation of the less active 6α-
OHP, the main paclitaxel metabolite formed by CYP2C8 [259]. And, critically, resveratrol
has been shown to inhibit ABCB1 gene expression in multiple cancer cell models and,
thereby, increase cellular accumulation of P-gp substrate drugs [222, 260-262]. These
mechanisms may explain the re-sensitizing ability of resveratrol to lower the paclitaxel
IC50 in the resistant cells. Importantly, the inhibitors for P-gp and CYP2C8 do not affect
the paclitaxel IC50 in the parental cells (Figure 29) suggesting that the function of P-gp
and CYP2C8 are not important to paclitaxel sensitivity in the parental cells, which further
supports the suggestion that there is a mechanism of the resveratrol-paclitaxel
combination that is independent of the mechanism by which resveratrol re-sensitizes the
resistant cells to paclitaxel.
Based on our findings, it will be important to validate that resveratrol is affecting
the function of P-gp and CYP2C8 as well as paclitaxel accumulation in these cells using
functional assays. Determination of increased P-gp protein levels is important and was
attempted in this study. However, the immunoblotting was not successful and needs to
be further optimized. To ensure the importance of ABCB1 gene expression, qPCR of
resveratrol treated MDA-MB-231/PacR cells should be conducted to determine whether
resveratrol treatment decreases ABCB1 gene expression in these cells alone and in
combination with paclitaxel. Further, a fluorescent paclitaxel accumulation assay using
Page 114
100
labeled paclitaxel, Oregon green 488 paclitaxel, can be conducted to determine
accumulation in cells and efflux into media in the cells alone and with simultaneous
resveratrol treatment. To determine the importance of CYP2C8, a fluormetric CYP2C8
assay can be conducted using dibenzylfluoresin, which is cleaved to a fluorescent
metabolite by CYP2C8, CYP2C9, CYP2C19 and CYP3A4. This reagent should show the
difference in CYP2C8 metabolism because, of the cytochromes that cleave this
substrate, only CYP2C8 was shown to be different between the parental and resistance
cells in the PCR array. These studies will be particularly important for predicting whether
the combination of resveratrol and paclitaxel will increase toxicities in vivo. If resveratrol
increases paclitaxel accumulation, it is possible that higher paclitaxel accumulation could
occur in other tissues that highly express P-pg and CYP2C8, such as the liver, which
could lead to an increase in paclitaxel toxicity. In addition, genetic manipulation of both
cell lines will be necessary to ensure the importance of these genes in the resistance.
Both knocking out expression in the resistant cells and overexpressing the genes in the
parental cells would be necessary to show these genes are critical for resistance in this
model.
Furthermore, any additional mechanisms that could account for the combination
effect of resveratrol and paclitaxel seen in the parental cells need to be elucidated. The
data suggest that resveratrol is acting on two different mechanisms, one to decrease the
resistance of the resistant cells and another to further sensitize resistant and parental
cells to paclitaxel. This data will also be important in determining whether this
combination therapy will only be useful in TNBCs or in other cancers as well.
Considering data from other cancer cell lines showing a positive resveratrol and
paclitaxel combination, it is possible the decrease of Bcl-xL [219] or Bcl-2 [222] or the
increase of p21 expression could be involved in promoting paclitaxel-induced apoptosis
[220].
Page 115
101
SUMMARY
A novel paclitaxel-resistant TNBC cell line was developed with a stable and
clinically relevant resistance. The paclitaxel resistance had no effect on resveratrol
efficacy. Resveratrol was capable of inhibiting cell proliferation and causing apoptosis in
TNBC cells regardless of paclitaxel sensitivity. Importantly, resveratrol augmented
paclitaxel treatment in both paclitaxel-sensitive and paclitaxel-resistant TNBC cells in
vitro. The effect of resveratrol on the paclitaxel sensitivity of the resistant cells may be
linked to the known ability of resveratrol to inhibit P-gp and CYP2C8 both of which were
found to be involved in the paclitaxel-resistance of our model. Overall these data show
for the first time that resveratrol can re-sensitize resistant TNBC cells to paclitaxel and
can decrease the concentration of paclitaxel needed to produce the same effect as
paclitaxel alone.
This study has some noteworthy limitations. Perhaps the most important
limitation is the use of a laboratory generated cell line model of paclitaxel resistance, the
properties of which may or may not correlate with the clinical presentation of paclitaxel
resistance. In addition, although resveratrol was shown to induce cell proliferation
inhibition, senescence, and apoptosis, the mechanism of resveratrol in these cells is still
not completely understood. Furthermore, resveratrol clearly augments paclitaxel
treatment in these TNBC cells, though the mechanism of the combination is unknown.
Finally, this study does not address the global applicability of this treatment for cancers
and so may prove to only be useful in a very small subset of patients
This study has raised many questions that need to be answered. The most
critical of which are the mechanism of action of the combination and whether resveratrol
augments paclitaxel treatment in vivo. It will be necessary to determine whether the
resistance of the resistant cells is due to the inhibition of paclitaxel accumulation, and
Page 116
102
whether resveratrol acts in these cells by increasing drug accumulation. In addition, the
mechanism of resveratrol and paclitaxel combination that is common to both the parental
and resistant cells will have important implications for the clinical application of this
combination. A clinical trial is a possibility due to the classification of resveratrol as a
dietary supplement. However, toxicity studies using 2- and 3-dimentional cell culture,
studies identifying pharmacodynamic targets, and perhaps also animal studies will be
important steps between cell line studies and human trials because there is a possibility
that the combination could increase paclitaxel toxicity particularly in tissues that highly
express P-gp, such as the liver and in peripheral neurons. The most critical studies will
be the combination treatment in patients with TNBC and, depending on the mechanism
of the combination, other cancers as well. This work and the questions it has raised have
the important clinical implication that resveratrol may be a useful clinical tool as a single
agent or in combination with paclitaxel for patients with TNBC to reverse paclitaxel
resistance as well as decrease the dosages of highly toxic paclitaxel administered
without affecting efficacy.
Page 117
103
APPENDIX: Complete PCR Array Data
Symbol Description
Fold Change T-TEST
Fold Up- or Down-
Regulation MDA-MB-231/PacR / MDA-MB-
231 p-value
MDA-MB-231/PacR / MDA-MB-
231 ABCB1 ATP-binding cassette, sub-family B
(MDR/TAP), member 1 181.99 0.21 181.99
ABCC1 ATP-binding cassette, sub-family C (CFTR/MRP), member 1 0.60 0.94 -1.65
ABCC2 ATP-binding cassette, sub-family C (CFTR/MRP), member 2 0.70 0.81 -1.43
ABCC3 ATP-binding cassette, sub-family C (CFTR/MRP), member 3 0.23 0.14 -4.27
ABCC5 ATP-binding cassette, sub-family C (CFTR/MRP), member 5 1.07 0.44 1.07
ABCG2 ATP-binding cassette, sub-family G (WHITE), member 2 0.24 0.11 -4.11
AHR Aryl hydrocarbon receptor 0.59 0.83 -1.70
AP1S1 Adaptor-related protein complex 1, sigma 1 subunit 0.86 0.65 -1.16
APC Adenomatous polyposis coli 3.11 0.05 3.11 AR Androgen receptor 0.21 0.04 -4.80
ARNT Aryl hydrocarbon receptor nuclear translocator 1.83 0.32 1.83
ATM Ataxia telangiectasia mutated 3.35 0.01 3.35 BAX BCL2-associated X protein 0.99 0.46 -1.01 BCL2 B-cell CLL/lymphoma 2 1.17 0.34 1.17
BCL2L1 BCL2-like 1 0.64 0.75 -1.56 BLMH Bleomycin hydrolase 0.79 0.79 -1.27 BRCA1 Breast cancer 1, early onset 1.15 0.47 1.15 BRCA2 Breast cancer 2, early onset 1.13 0.45 1.13 CCND1 Cyclin D1 0.78 0.70 -1.28 CCNE1 Cyclin E1 0.87 0.90 -1.15 CDK2 Cyclin-dependent kinase 2 2.60 0.19 2.60 CDK4 Cyclin-dependent kinase 4 1.74 0.40 1.74
CDKN1A Cyclin-dependent kinase inhibitor 1A (p21, Cip1) 0.83 0.71 -1.21
CDKN1B Cyclin-dependent kinase inhibitor 1B (p27, Kip1) 2.15 0.06 2.15
CDKN2A Cyclin-dependent kinase inhibitor 2A (melanoma, p16, inhibits CDK4) N/A N/A N/A
CDKN2D Cyclin-dependent kinase inhibitor 2D (p19, inhibits CDK4) 0.93 0.60 -1.08
CLPTM1L CLPTM1-like 0.74 0.61 -1.35
CYP1A1 Cytochrome P450, family 1, subfamily A, polypeptide 1 5.06 0.16 5.06
Page 118
104
Symbol Description
Fold Change T-TEST
Fold Up- or Down-
Regulation MDA-MB-231/PacR / MDA-MB-
231 p-value
MDA-MB-231/PacR / MDA-MB-
231 CYP1A2 Cytochrome P450, family 1,
subfamily A, polypeptide 2 2.67 0.58 2.67
CYP2B6 Cytochrome P450, family 2, subfamily B, polypeptide 6 2.14 0.22 2.14
CYP2C19 Cytochrome P450, family 2, subfamily C, polypeptide 19 1.51 0.28 1.51
CYP2C8 Cytochrome P450, family 2, subfamily C, polypeptide 8 12.51 0.16 12.51
CYP2C9 Cytochrome P450, family 2, subfamily C, polypeptide 9 2.28 0.12 2.28
CYP2D6 Cytochrome P450, family 2, subfamily D, polypeptide 6 2.00 0.16 2.00
CYP2E1 Cytochrome P450, family 2, subfamily E, polypeptide 1 0.03 0.01 -31.07
CYP3A4 Cytochrome P450, family 3, subfamily A, polypeptide 4 2.83 N/A 2.83
CYP3A5 Cytochrome P450, family 3, subfamily A, polypeptide 5 0.59 0.77 -1.69
DHFR Dihydrofolate reductase 1.07 0.75 1.07 EGFR Epidermal growth factor receptor 0.59 0.90 -1.70
ELK1 ELK1, member of ETS oncogene family 0.59 0.66 -1.69
EPHX1 Epoxide hydrolase 1, microsomal (xenobiotic) 0.88 0.69 -1.14
ERBB2
V-erb-b2 erythroblastic leukemia viral oncogene homolog 2, neuro/glioblastoma derived oncogene homolog (avian)
0.90 0.64 -1.11
ERBB3 V-erb-b2 erythroblastic leukemia viral oncogene homolog 3 (avian) 0.53 0.70 -1.88
ERBB4 V-erb-a erythroblastic leukemia viral oncogene homolog 4 (avian) 0.15 0.02 -6.71
ERCC3
Excision repair cross-complementing rodent repair
deficiency, complementation group 3 (xeroderma pigmentosum group B
complementing)
1.28 0.24 1.28
ESR1 Estrogen receptor 1 1.21 0.77 1.21 ESR2 Estrogen receptor 2 (ER beta) 0.54 0.02 -1.85 FGF2 Fibroblast growth factor 2 (basic) 0.89 0.51 -1.12
FOS FBJ murine osteosarcoma viral oncogene homolog 0.32 0.06 -3.16
GSK3A Glycogen synthase kinase 3 alpha 1.35 0.52 1.35 GSTP1 Glutathione S-transferase pi 1 0.69 0.49 -1.46
Page 119
105
Symbol Description
Fold Change T-TEST
Fold Up- or Down-
Regulation MDA-MB-231/PacR / MDA-MB-
231 p-value
MDA-MB-231/PacR / MDA-MB-
231
HIF1A Hypoxia inducible factor 1, alpha
subunit (basic helix-loop-helix transcription factor)
0.70 0.32 -1.44
IGF1R Insulin-like growth factor 1 receptor 1.12 0.55 1.12 IGF2R Insulin-like growth factor 2 receptor 1.35 0.23 1.35
MET Met proto-oncogene (hepatocyte growth factor receptor) 0.40 0.07 -2.48
MSH2 MutS homolog 2, colon cancer, nonpolyposis type 1 (E. coli) 1.69 0.12 1.69
MVP Major vault protein 1.10 0.86 1.10
MYC V-myc myelocytomatosis viral oncogene homolog (avian) 1.37 0.37 1.37
NAT2 N-acetyltransferase 2 (arylamine N-acetyltransferase) 1.86 0.06 1.86
NFKB1 Nuclear factor of kappa light
polypeptide gene enhancer in B-cells 1
0.91 0.64 -1.10
NFKB2 Nuclear factor of kappa light
polypeptide gene enhancer in B-cells 2 (p49/p100)
2.44 0.02 2.44
NFKBIB Nuclear factor of kappa light
polypeptide gene enhancer in B-cells inhibitor, beta
1.74 0.16 1.74
NFKBIE Nuclear factor of kappa light
polypeptide gene enhancer in B-cells inhibitor, epsilon
1.50 0.18 1.50
PPARA Peroxisome proliferator-activated receptor alpha 1.40 0.29 1.40
PPARD Peroxisome proliferator-activated receptor delta 1.08 0.53 1.08
PPARG Peroxisome proliferator-activated receptor gamma 1.39 0.00 1.39
RARA Retinoic acid receptor, alpha 0.56 0.41 -1.78 RARB Retinoic acid receptor, beta 2.61 0.00 2.61 RARG Retinoic acid receptor, gamma 1.89 0.10 1.89 RB1 Retinoblastoma 1 1.60 0.05 1.60
RELB V-rel reticuloendotheliosis viral oncogene homolog B 1.40 0.59 1.40
RXRA Retinoid X receptor, alpha 1.07 0.96 1.07 RXRB Retinoid X receptor, beta 1.67 0.01 1.67 SOD1 Superoxide dismutase 1, soluble 1.65 0.02 1.65
SULT1E1 Sulfotransferase family 1E, estrogen-preferring, member 1 1.77 0.57 1.77
Page 120
106
Symbol Description
Fold Change T-TEST
Fold Up- or Down-
Regulation MDA-MB-231/PacR / MDA-MB-
231 p-value
MDA-MB-231/PacR / MDA-MB-
231
TNFRSF11A Tumor necrosis factor receptor
superfamily, member 11a, NFKB activator
3.11 0.00 3.11
TOP1 Topoisomerase (DNA) I 1.42 0.03 1.42 TOP2A Topoisomerase (DNA) II alpha
170kDa 1.29 0.17 1.29
TOP2B Topoisomerase (DNA) II beta 180kDa 1.59 0.02 1.59
TP53 Tumor protein p53 1.87 0.04 1.87 TPMT Thiopurine S-methyltransferase 0.91 0.63 -1.09
UGCG UDP-glucose ceramide glucosyltransferase 1.38 0.05 1.38
XPA Xeroderma pigmentosum, complementation group A 1.82 0.36 1.82
XPC Xeroderma pigmentosum, complementation group C 1.83 0.34 1.83
ACTB Actin, beta 0.83 0.24 -1.21 B2M Beta-2-microglobulin 1.11 0.37 1.11
GAPDH Glyceraldehyde-3-phosphate dehydrogenase 0.94 0.66 -1.07
HPRT1 Hypoxanthine phosphoribosyltransferase 1 0.82 0.07 -1.21
RPLP0 Ribosomal protein, large, P0 1.41 0.07 1.41 HGDC Human Genomic DNA
Contamination - - - RTC Reverse Transcription Control - - - RTC Reverse Transcription Control - - - RTC Reverse Transcription Control - - - PPC Positive PCR Control - - - PPC Positive PCR Control - - - PPC Positive PCR Control - - -
Page 121
107
REFERENCES
1. Hanahan, D. and R.A. Weinberg, Hallmarks of cancer: the next generation. Cell, 2011. 144(5): p. 646-74.
2. Society, A.C., Cancer Facts & Figures 2014. 2014. 3. Bray, F., et al., Global estimates of cancer prevalence for 27 sites in the adult
population in 2008. Int J Cancer, 2013. 132(5): p. 1133-45. 4. Ferlay, J., et al., Estimates of worldwide burden of cancer in 2008: GLOBOCAN
2008. Int J Cancer, 2010. 127(12): p. 2893-917. 5. Society, A.C. Breast Cancer Facts & Figures 2013-2014. 2013. 6. Al-Benna, S., et al., Diagnosis and management of primary breast sarcoma.
Breast Cancer Res Treat, 2010. 122(3): p. 619-26. 7. Allred, D.C., Ductal carcinoma in situ: terminology, classification, and natural
history. J Natl Cancer Inst Monogr, 2010. 2010(41): p. 134-8. 8. Perou, C.M. and A.L. Borresen-Dale, Systems biology and genomics of breast
cancer. Cold Spring Harb Perspect Biol, 2011. 3(2). 9. Voduc, K.D., et al., Breast cancer subtypes and the risk of local and regional
relapse. J Clin Oncol, 2010. 28(10): p. 1684-91. 10. Carey, L.A., et al., Race, breast cancer subtypes, and survival in the Carolina
Breast Cancer Study. Jama, 2006. 295(21): p. 2492-502. 11. Schwartz, G.F., et al., Proceedings of the international consensus conference on
breast cancer risk, genetics, & risk management, April, 2007. Breast J, 2009. 15(1): p. 4-16.
12. Berry, D.A., et al., Effect of screening and adjuvant therapy on mortality from
breast cancer. N Engl J Med, 2005. 353(17): p. 1784-92. 13. Institute, N.C. National Cancer Institute: PDQ® Breast Cancer Treatment.
February 21, 2014 [cited 2014 March 19]; Available from: http://www.cancer.gov/cancertopics/pdq/treatment/breast/healthprofessional.
14. Carey, L.A., Directed therapy of subtypes of triple-negative breast cancer.
Oncologist, 2011. 16 Suppl 1: p. 71-8. 15. Rouzier, R., et al., Breast cancer molecular subtypes respond differently to
preoperative chemotherapy. Clin Cancer Res, 2005. 11(16): p. 5678-85. 16. Carey, L.A., et al., The triple negative paradox: primary tumor chemosensitivity of
breast cancer subtypes. Clin Cancer Res, 2007. 13(8): p. 2329-34.
Page 122
108
17. Elston, C.W. and I.O. Ellis, Pathological prognostic factors in breast cancer. I. The value of histological grade in breast cancer: experience from a large study with long-term follow-up. Histopathology, 2002. 41(3a): p. 154-61.
18. Bauer, K.R., et al., Descriptive analysis of estrogen receptor (ER)-negative,
progesterone receptor (PR)-negative, and HER2-negative invasive breast cancer, the so-called triple-negative phenotype: a population-based study from the California cancer Registry. Cancer, 2007. 109(9): p. 1721-8.
19. Ayanian, J.Z., et al., The relation between health insurance coverage and clinical
outcomes among women with breast cancer. N Engl J Med, 1993. 329(5): p. 326-31.
20. McWhorter, W.P. and W.J. Mayer, Black/white differences in type of initial breast
cancer treatment and implications for survival. Am J Public Health, 1987. 77(12): p. 1515-7.
21. Breen, N., et al., The relationship of socio-economic status and access to
minimum expected therapy among female breast cancer patients in the National Cancer Institute Black-White Cancer Survival Study. Ethn Dis, 1999. 9(1): p. 111-25.
22. DeSantis, C., A. Jemal, and E. Ward, Disparities in breast cancer prognostic
factors by race, insurance status, and education. Cancer Causes Control, 2010. 21(9): p. 1445-50.
23. Sprague, B.L., et al., Socioeconomic status and survival after an invasive breast
cancer diagnosis. Cancer, 2011. 117(7): p. 1542-51. 24. Wojcik, B.E., M.K. Spinks, and S.A. Optenberg, Breast carcinoma survival
analysis for African American and white women in an equal-access health care system. Cancer, 1998. 82(7): p. 1310-8.
25. Hershman, D.L., et al., Treatment quality and outcomes of African American
versus white breast cancer patients: retrospective analysis of Southwest Oncology studies S8814/S8897. J Clin Oncol, 2009. 27(13): p. 2157-62.
26. Dunn, B.K., et al., Health disparities in breast cancer: biology meets
socioeconomic status. Breast Cancer Res Treat, 2010. 121(2): p. 281-92. 27. Silver, D.P., et al., Efficacy of neoadjuvant Cisplatin in triple-negative breast
cancer. J Clin Oncol, 2010. 28(7): p. 1145-53. 28. Byrski, T., et al., Pathologic complete response rates in young women with
BRCA1-positive breast cancers after neoadjuvant chemotherapy. J Clin Oncol, 2010. 28(3): p. 375-9.
29. Comen, E.A. and M. Robson, Inhibition of poly(ADP)-ribose polymerase as a
therapeutic strategy for breast cancer. Oncology (Williston Park), 2010. 24(1): p. 55-62.
Page 123
109
30. Tutt, A., et al., Oral poly(ADP-ribose) polymerase inhibitor olaparib in patients with BRCA1 or BRCA2 mutations and advanced breast cancer: a proof-of-concept trial. Lancet, 2010. 376(9737): p. 235-44.
31. Carey, L.A., et al., TBCRC 001: randomized phase II study of cetuximab in
combination with carboplatin in stage IV triple-negative breast cancer. J Clin Oncol, 2012. 30(21): p. 2615-23.
32. Miller, K., et al., Paclitaxel plus bevacizumab versus paclitaxel alone for
metastatic breast cancer. N Engl J Med, 2007. 357(26): p. 2666-76. 33. Lang, I., et al., Bevacizumab plus paclitaxel versus bevacizumab plus
capecitabine as first-line treatment for HER2-negative metastatic breast cancer: interim efficacy results of the randomised, open-label, non-inferiority, phase 3 TURANDOT trial. Lancet Oncol, 2013. 14(2): p. 125-33.
34. Liedtke, C., et al., Response to neoadjuvant therapy and long-term survival in
patients with triple-negative breast cancer. J Clin Oncol, 2008. 26(8): p. 1275-81. 35. Wysocki, P.J., et al., Primary resistance to docetaxel-based chemotherapy in
metastatic breast cancer patients correlates with a high frequency of BRCA1 mutations. Med Sci Monit, 2008. 14(7): p. SC7-10.
36. Longley, D.B. and P.G. Johnston, Molecular mechanisms of drug resistance. J
Pathol, 2005. 205(2): p. 275-92. 37. Holohan, C., et al., Cancer drug resistance: an evolving paradigm. Nat Rev
Cancer, 2013. 13(10): p. 714-26. 38. Gottesman, M.M., Mechanisms of cancer drug resistance. Annu Rev Med, 2002.
53: p. 615-27. 39. Fojo, T. and S. Bates, Strategies for reversing drug resistance. Oncogene, 2003.
22(47): p. 7512-23. 40. Schiff, P.B., J. Fant, and S.B. Horwitz, Promotion of microtubule assembly in vitro
by taxol. Nature, 1979. 277(5698): p. 665-7. 41. Jordan, M.A. and L. Wilson, Microtubules as a target for anticancer drugs. Nat
Rev Cancer, 2004. 4(4): p. 253-65. 42. Downing, K.H. and E. Nogales, Crystallographic structure of tubulin: implications
for dynamics and drug binding. Cell Struct Funct, 1999. 24(5): p. 269-75. 43. Mollinedo, F. and C. Gajate, Microtubules, microtubule-interfering agents and
apoptosis. Apoptosis, 2003. 8(5): p. 413-50. 44. Mitchison, T. and M. Kirschner, Dynamic instability of microtubule growth.
Nature, 1984. 312(5991): p. 237-42.
Page 124
110
45. Zhou, J. and P. Giannakakou, Targeting microtubules for cancer chemotherapy. Curr Med Chem Anticancer Agents, 2005. 5(1): p. 65-71.
46. Honore, S., E. Pasquier, and D. Braguer, Understanding microtubule dynamics
for improved cancer therapy. Cell Mol Life Sci, 2005. 62(24): p. 3039-56. 47. Diaz, J.F., et al., Changes in microtubule protofilament number induced by Taxol
binding to an easily accessible site. Internal microtubule dynamics. J Biol Chem, 1998. 273(50): p. 33803-10.
48. Abal, M., J.M. Andreu, and I. Barasoain, Taxanes: microtubule and centrosome
targets, and cell cycle dependent mechanisms of action. Curr Cancer Drug Targets, 2003. 3(3): p. 193-203.
49. Roninson, I.B., E.V. Broude, and B.D. Chang, If not apoptosis, then what?
Treatment-induced senescence and mitotic catastrophe in tumor cells. Drug Resist Updat, 2001. 4(5): p. 303-13.
50. Kingston, D.G., The shape of things to come: structural and synthetic studies of
taxol and related compounds. Phytochemistry, 2007. 68(14): p. 1844-54. 51. Tabata, H., Production of paclitaxel and the related taxanes by cell suspension
cultures of Taxus species. Curr Drug Targets, 2006. 7(4): p. 453-61. 52. Binder, S., Evolution of taxanes in the treatment of metastatic breast cancer. Clin
J Oncol Nurs, 2013. 17 Suppl: p. 9-14. 53. Monsarrat, B., et al., Hepatic metabolism and biliary excretion of Taxol in rats
and humans. J Natl Cancer Inst Monogr, 1993(15): p. 39-46. 54. Monsarrat, B., et al., Modification of paclitaxel metabolism in a cancer patient by
induction of cytochrome P450 3A4. Drug Metab Dispos, 1998. 26(3): p. 229-33. 55. Nabholtz, J.M., et al., Multicenter, randomized comparative study of two doses of
paclitaxel in patients with metastatic breast cancer. J Clin Oncol, 1996. 14(6): p. 1858-67.
56. Einzig, A.I., Review of phase II trials of Taxol (paclitaxel) in patients with
advanced ovarian cancer. Ann Oncol, 1994. 5 Suppl 6: p. S29-32. 57. Millward, M.J., et al., Phase II trial of a 3-hour infusion of paclitaxel in previously
untreated patients with advanced non-small-cell lung cancer. J Clin Oncol, 1996. 14(1): p. 142-8.
58. Fountzilas, G., et al., A phase II study of paclitaxel in advanced breast cancer
resistant to anthracyclines. Eur J Cancer, 1996. 32a(1): p. 47-51. 59. Paridaens, R., et al., Paclitaxel versus doxorubicin as first-line single-agent
chemotherapy for metastatic breast cancer: a European Organization for Research and Treatment of Cancer Randomized Study with cross-over. J Clin Oncol, 2000. 18(4): p. 724-33.
Page 125
111
60. Gonzalez-Angulo, A.M. and G.N. Hortobagyi, Optimal schedule of paclitaxel: weekly is better. J Clin Oncol, 2008. 26(10): p. 1585-7.
61. De Laurentiis, M., et al., Taxane-based combinations as adjuvant chemotherapy
of early breast cancer: a meta-analysis of randomized trials. J Clin Oncol, 2008. 26(1): p. 44-53.
62. Citron, M.L., et al., Randomized trial of dose-dense versus conventionally
scheduled and sequential versus concurrent combination chemotherapy as postoperative adjuvant treatment of node-positive primary breast cancer: first report of Intergroup Trial C9741/Cancer and Leukemia Group B Trial 9741. J Clin Oncol, 2003. 21(8): p. 1431-9.
63. Sparano, J.A., et al., Weekly paclitaxel in the adjuvant treatment of breast
cancer. N Engl J Med, 2008. 358(16): p. 1663-71. 64. Gianni, L., et al., Efficacy and safety of neoadjuvant pertuzumab and
trastuzumab in women with locally advanced, inflammatory, or early HER2-positive breast cancer (NeoSphere): a randomised multicentre, open-label, phase 2 trial. Lancet Oncol, 2012. 13(1): p. 25-32.
65. McGrogan, B.T., et al., Taxanes, microtubules and chemoresistant breast
cancer. Biochim Biophys Acta, 2008. 1785(2): p. 96-132. 66. Murray, S., et al., Taxane resistance in breast cancer: mechanisms, predictive
biomarkers and circumvention strategies. Cancer Treat Rev, 2012. 38(7): p. 890-903.
67. Wiesen, K.M., et al., Wild-type class I beta-tubulin sensitizes Taxol-resistant
breast adenocarcinoma cells harboring a beta-tubulin mutation. Cancer Lett, 2007. 257(2): p. 227-35.
68. Berrieman, H.K., M.J. Lind, and L. Cawkwell, Do beta-tubulin mutations have a
role in resistance to chemotherapy? Lancet Oncol, 2004. 5(3): p. 158-64. 69. Wang, Y., et al., Mutations at leucine 215 of beta-tubulin affect paclitaxel
sensitivity by two distinct mechanisms. Biochemistry, 2006. 45(1): p. 185-94. 70. Derry, W.B., et al., Taxol differentially modulates the dynamics of microtubules
assembled from unfractionated and purified beta-tubulin isotypes. Biochemistry, 1997. 36(12): p. 3554-62.
71. Rouzier, R., et al., Microtubule-associated protein tau: a marker of paclitaxel
sensitivity in breast cancer. Proc Natl Acad Sci U S A, 2005. 102(23): p. 8315-20. 72. Orr, G.A., et al., Mechanisms of Taxol resistance related to microtubules.
Oncogene, 2003. 22(47): p. 7280-95. 73. Alli, E., et al., Effect of stathmin on the sensitivity to antimicrotubule drugs in
human breast cancer. Cancer Res, 2002. 62(23): p. 6864-9.
Page 126
112
74. Anand, S., S. Penrhyn-Lowe, and A.R. Venkitaraman, AURORA-A amplification overrides the mitotic spindle assembly checkpoint, inducing resistance to Taxol. Cancer Cell, 2003. 3(1): p. 51-62.
75. Chabalier, C., et al., BRCA1 downregulation leads to premature inactivation of
spindle checkpoint and confers paclitaxel resistance. Cell Cycle, 2006. 5(9): p. 1001-7.
76. Sudo, T., et al., Dependence of paclitaxel sensitivity on a functional spindle
assembly checkpoint. Cancer Res, 2004. 64(7): p. 2502-8. 77. Swanton, C., et al., Regulators of mitotic arrest and ceramide metabolism are
determinants of sensitivity to paclitaxel and other chemotherapeutic drugs. Cancer Cell, 2007. 11(6): p. 498-512.
78. Takahashi, T., et al., Cyclin A-associated kinase activity is needed for paclitaxel
sensitivity. Mol Cancer Ther, 2005. 4(7): p. 1039-46. 79. Wang, T.H., H.S. Wang, and Y.K. Soong, Paclitaxel-induced cell death: where
the cell cycle and apoptosis come together. Cancer, 2000. 88(11): p. 2619-28. 80. Dong, Q.G., et al., The function of multiple IkappaB : NF-kappaB complexes in
the resistance of cancer cells to Taxol-induced apoptosis. Oncogene, 2002. 21(42): p. 6510-9.
81. Fujie, Y., et al., Oxaliplatin, a potent inhibitor of survivin, enhances paclitaxel-
induced apoptosis and mitotic catastrophe in colon cancer cells. Jpn J Clin Oncol, 2005. 35(8): p. 453-63.
82. Knuefermann, C., et al., HER2/PI-3K/Akt activation leads to a multidrug
resistance in human breast adenocarcinoma cells. Oncogene, 2003. 22(21): p. 3205-12.
83. Schmidt, M., et al., p53 expression and resistance against paclitaxel in patients
with metastatic breast cancer. J Cancer Res Clin Oncol, 2003. 129(5): p. 295-302.
84. Strobel, T., et al., BAX enhances paclitaxel-induced apoptosis through a p53-
independent pathway. Proc Natl Acad Sci U S A, 1996. 93(24): p. 14094-9. 85. Wang, Z., et al., Differential effect of anti-apoptotic genes Bcl-xL and c-FLIP on
sensitivity of MCF-7 breast cancer cells to paclitaxel and docetaxel. Anticancer Res, 2005. 25(3c): p. 2367-79.
86. Yu, D., et al., Overexpression of ErbB2 blocks Taxol-induced apoptosis by
upregulation of p21Cip1, which inhibits p34Cdc2 kinase. Mol Cell, 1998. 2(5): p. 581-91.
87. Dean, M., Y. Hamon, and G. Chimini, The human ATP-binding cassette (ABC)
transporter superfamily. J Lipid Res, 2001. 42(7): p. 1007-17.
Page 127
113
88. Sharom, F.J., The P-glycoprotein efflux pump: how does it transport drugs? J Membr Biol, 1997. 160(3): p. 161-75.
89. Eckford, P.D. and F.J. Sharom, ABC efflux pump-based resistance to
chemotherapy drugs. Chem Rev, 2009. 109(7): p. 2989-3011. 90. Sharom, F.J., ABC multidrug transporters: structure, function and role in
chemoresistance. Pharmacogenomics, 2008. 9(1): p. 105-27. 91. Sharom, F.J., Complex Interplay between the P-Glycoprotein Multidrug Efflux
Pump and the Membrane: Its Role in Modulating Protein Function. Front Oncol, 2014. 4: p. 41.
92. Harmsen, S., et al., PXR-mediated induction of P-glycoprotein by anticancer
drugs in a human colon adenocarcinoma-derived cell line. Cancer Chemother Pharmacol, 2010. 66(4): p. 765-71.
93. Tsuruo, T., et al., Overcoming of vincristine resistance in P388 leukemia in vivo
and in vitro through enhanced cytotoxicity of vincristine and vinblastine by verapamil. Cancer Res, 1981. 41(5): p. 1967-72.
94. Schinkel, A.H., et al., Normal viability and altered pharmacokinetics in mice
lacking mdr1-type (drug-transporting) P-glycoproteins. Proc Natl Acad Sci U S A, 1997. 94(8): p. 4028-33.
95. Alvarez, M., et al., Generation of a drug resistance profile by quantitation of mdr-
1/P-glycoprotein in the cell lines of the National Cancer Institute Anticancer Drug Screen. J Clin Invest, 1995. 95(5): p. 2205-14.
96. Mechetner, E., et al., Levels of multidrug resistance (MDR1) P-glycoprotein
expression by human breast cancer correlate with in vitro resistance to taxol and doxorubicin. Clin Cancer Res, 1998. 4(2): p. 389-98.
97. Leonessa, F. and R. Clarke, ATP binding cassette transporters and drug
resistance in breast cancer. Endocr Relat Cancer, 2003. 10(1): p. 43-73. 98. Vishnukumar, S., et al., P-glycoprotein expression as a predictor of response to
neoadjuvant chemotherapy in breast cancer. Indian J Cancer, 2013. 50(3): p. 195-9.
99. Chintamani, et al., Role of p-glycoprotein expression in predicting response to
neoadjuvant chemotherapy in breast cancer--a prospective clinical study. World J Surg Oncol, 2005. 3: p. 61.
100. Mubashar, M., et al., 99mTc-sestamibi imaging in the assessment of toremifene
as a modulator of multidrug resistance in patients with breast cancer. J Nucl Med, 2002. 43(4): p. 519-25.
101. Kostakoglu, L., et al., Association of tumor washout rates and accumulation of
technetium-99m-MIBI with expression of P-glycoprotein in lung cancer. J Nucl Med, 1998. 39(2): p. 228-34.
Page 128
114
102. Del Vecchio, S., A. Ciarmiello, and M. Salvatore, Clinical imaging of multidrug resistance in cancer. Q J Nucl Med, 1999. 43(2): p. 125-31.
103. Yoon, J.H., et al., Double-phase Tc-99m sestamibi scintimammography to
assess angiogenesis and P-glycoprotein expression in patients with untreated breast cancer. Clin Nucl Med, 1999. 24(5): p. 314-8.
104. Sun, S.S., et al., Expression of mediated P-glycoprotein multidrug resistance
related to Tc-99m MIBI scintimammography results. Cancer Lett, 2000. 153(1-2): p. 95-100.
105. Cayre, A., et al., Single static view 99mTc-sestamibi scintimammography
predicts response to neoadjuvant chemotherapy and is related to MDR expression. Int J Oncol, 2002. 20(5): p. 1049-55.
106. Ozols, R.F., et al., Verapamil and adriamycin in the treatment of drug-resistant
ovarian cancer patients. J Clin Oncol, 1987. 5(4): p. 641-7. 107. Toppmeyer, D., et al., Safety and efficacy of the multidrug resistance inhibitor
Incel (biricodar; VX-710) in combination with paclitaxel for advanced breast cancer refractory to paclitaxel. Clin Cancer Res, 2002. 8(3): p. 670-8.
108. Ruff, P., et al., A randomized, placebo-controlled, double-blind phase 2 study of
docetaxel compared to docetaxel plus zosuquidar (LY335979) in women with metastatic or locally recurrent breast cancer who have received one prior chemotherapy regimen. Cancer Chemother Pharmacol, 2009. 64(4): p. 763-8.
109. Pusztai, L., et al., Phase II study of tariquidar, a selective P-glycoprotein inhibitor,
in patients with chemotherapy-resistant, advanced breast carcinoma. Cancer, 2005. 104(4): p. 682-91.
110. Jakoby, W.B. and D.M. Ziegler, The enzymes of detoxication. J Biol Chem, 1990.
265(34): p. 20715-8. 111. Konig, J., et al., Conjugate export pumps of the multidrug resistance protein
(MRP) family: localization, substrate specificity, and MRP2-mediated drug resistance. Biochim Biophys Acta, 1999. 1461(2): p. 377-94.
112. Homolya, L., A. Varadi, and B. Sarkadi, Multidrug resistance-associated proteins:
Export pumps for conjugates with glutathione, glucuronate or sulfate. Biofactors, 2003. 17(1-4): p. 103-14.
113. Commandeur, J.N., G.J. Stijntjes, and N.P. Vermeulen, Enzymes and transport
systems involved in the formation and disposition of glutathione S-conjugates. Role in bioactivation and detoxication mechanisms of xenobiotics. Pharmacol Rev, 1995. 47(2): p. 271-330.
114. Meunier, B., S.P. de Visser, and S. Shaik, Mechanism of oxidation reactions
catalyzed by cytochrome p450 enzymes. Chem Rev, 2004. 104(9): p. 3947-80.
Page 129
115
115. Neve, E.P. and M. Ingelman-Sundberg, Cytochrome P450 proteins: retention and distribution from the endoplasmic reticulum. Curr Opin Drug Discov Devel, 2010. 13(1): p. 78-85.
116. Nishimura, M., et al., Tissue distribution of mRNA expression of human
cytochrome P450 isoforms assessed by high-sensitivity real-time reverse transcription PCR. Yakugaku Zasshi, 2003. 123(5): p. 369-75.
117. Nebert, D.W. and D.W. Russell, Clinical importance of the cytochromes P450.
Lancet, 2002. 360(9340): p. 1155-62. 118. Guengerich, F.P., Cytochrome p450 and chemical toxicology. Chem Res Toxicol,
2008. 21(1): p. 70-83. 119. Rahman, A., et al., Selective biotransformation of taxol to 6 alpha-hydroxytaxol
by human cytochrome P450 2C8. Cancer Res, 1994. 54(21): p. 5543-6. 120. Harris, J.W., et al., Isolation, structural determination, and biological activity of 6
alpha-hydroxytaxol, the principal human metabolite of taxol. J Med Chem, 1994. 37(5): p. 706-9.
121. Sparreboom, A., et al., Isolation, purification, and biological activity of mono- and
dihydroxylated paclitaxel metabolites from human feces. Cancer Chemother Pharmacol, 1995. 36(4): p. 299-304.
122. Cresteil, T., et al., Taxol metabolism by human liver microsomes: identification of
cytochrome P450 isozymes involved in its biotransformation. Cancer Res, 1994. 54(2): p. 386-92.
123. Harris, J.W., et al., Metabolism of taxol by human hepatic microsomes and liver
slices: participation of cytochrome P450 3A4 and an unknown P450 enzyme. Cancer Res, 1994. 54(15): p. 4026-35.
124. Vaclavikova, R., et al., Different in vitro metabolism of paclitaxel and docetaxel in
humans, rats, pigs, and minipigs. Drug Metab Dispos, 2004. 32(6): p. 666-74. 125. Monsarrat, B., et al., Biotransformation of taxoids by human cytochromes P450:
structure-activity relationship. Bull Cancer, 1997. 84(2): p. 125-33. 126. Kang, M.H., et al., The P-glycoprotein antagonist PSC 833 increases the plasma
concentrations of 6alpha-hydroxypaclitaxel, a major metabolite of paclitaxel. Clin Cancer Res, 2001. 7(6): p. 1610-7.
127. Gray, I.C., et al., A 2.4-megabase physical map spanning the CYP2C gene
cluster on chromosome 10q24. Genomics, 1995. 28(2): p. 328-32. 128. Somlo, G., et al., High-dose paclitaxel in combination with doxorubicin,
cyclophosphamide and peripheral blood progenitor cell rescue in patients with high-risk primary and responding metastatic breast carcinoma: toxicity profile, relationship to paclitaxel pharmacokinetics and short-term outcome. Br J Cancer, 2001. 84(12): p. 1591-8.
Page 130
116
129. Daily, E.B. and C.L. Aquilante, Cytochrome P450 2C8 pharmacogenetics: a review of clinical studies. Pharmacogenomics, 2009. 10(9): p. 1489-510.
130. Rendic, S. and F.J. Di Carlo, Human cytochrome P450 enzymes: a status report
summarizing their reactions, substrates, inducers, and inhibitors. Drug Metab Rev, 1997. 29(1-2): p. 413-580.
131. Shimada, T., et al., Interindividual variations in human liver cytochrome P-450
enzymes involved in the oxidation of drugs, carcinogens and toxic chemicals: studies with liver microsomes of 30 Japanese and 30 Caucasians. J Pharmacol Exp Ther, 1994. 270(1): p. 414-23.
132. Totah, R.A. and A.E. Rettie, Cytochrome P450 2C8: substrates, inhibitors,
pharmacogenetics, and clinical relevance. Clin Pharmacol Ther, 2005. 77(5): p. 341-52.
133. Klose, T.S., J.A. Blaisdell, and J.A. Goldstein, Gene structure of CYP2C8 and
extrahepatic distribution of the human CYP2Cs. J Biochem Mol Toxicol, 1999. 13(6): p. 289-95.
134. Thum, T. and J. Borlak, Gene expression in distinct regions of the heart. Lancet,
2000. 355(9208): p. 979-83. 135. Delozier, T.C., et al., Detection of human CYP2C8, CYP2C9, and CYP2J2 in
cardiovascular tissues. Drug Metab Dispos, 2007. 35(4): p. 682-8. 136. Knupfer, H., et al., CYP2C and IL-6 expression in breast cancer. Breast, 2004.
13(1): p. 28-34. 137. Garcia-Martin, E., et al., Acquired resistance to the anticancer drug paclitaxel is
associated with induction of cytochrome P450 2C8. Pharmacogenomics, 2006. 7(4): p. 575-85.
138. Horneber, M., et al., How many cancer patients use complementary and
alternative medicine: a systematic review and metaanalysis. Integr Cancer Ther, 2012. 11(3): p. 187-203.
139. Molassiotis, A., et al., Use of complementary and alternative medicine in cancer
patients: a European survey. Ann Oncol, 2005. 16(4): p. 655-63. 140. Eschiti, V.S., Lesson from comparison of CAM use by women with female-
specific cancers to others: it's time to focus on interaction risks with CAM therapies. Integr Cancer Ther, 2007. 6(4): p. 313-44.
141. Eng, J., et al., A population-based survey of complementary and alternative
medicine use in men recently diagnosed with prostate cancer. Integr Cancer Ther, 2003. 2(3): p. 212-6.
142. Davidson, R., et al., Psychological characteristics of cancer patients who use
complementary therapies. Psychooncology, 2005. 14(3): p. 187-95.
Page 131
117
143. Hann, D., et al., Long-term breast cancer survivors' use of complementary therapies: perceived impact on recovery and prevention of recurrence. Integr Cancer Ther, 2005. 4(1): p. 14-20.
144. Verhoef, M.J., et al., Complementary therapies for cancer patients: assessing
information use and needs. Chronic Dis Can, 2009. 29(2): p. 80-8. 145. Hanf, V., Complementary Methods in Breast Cancer Therapy. Breast Care
(Basel), 2009. 4(1): p. 5-6. 146. Robinson, A. and M.R. McGrail, Disclosure of CAM use to medical practitioners:
a review of qualitative and quantitative studies. Complement Ther Med, 2004. 12(2-3): p. 90-8.
147. Yates, J.S., et al., Prevalence of complementary and alternative medicine use in
cancer patients during treatment. Support Care Cancer, 2005. 13(10): p. 806-11. 148. Hubner, J. and V. Hanf, Commonly Used Methods of Complementary Medicine
in the Treatment of Breast Cancer. Breast Care (Basel), 2013. 8(5): p. 341-347. 149. Garcia-Cazarin, M.L., et al., Dietary Supplement Research Portfolio at the NIH,
2009-2011. J Nutr, 2014. 150. Kaufman, D.W., et al., Recent patterns of medication use in the ambulatory adult
population of the United States: the Slone survey. Jama, 2002. 287(3): p. 337-44. 151. Tindle, H.A., et al., Trends in use of complementary and alternative medicine by
US adults: 1997-2002. Altern Ther Health Med, 2005. 11(1): p. 42-9. 152. Bailey, R.L., et al., Dietary supplement use in the United States, 2003-2006. J
Nutr, 2011. 141(2): p. 261-6. 153. 103-417, U.P.L., Dietary Supplement Health and Education Act of 1994, r.
Congress, Editor. 1994. 154. Hermann, R. and O. von Richter, Clinical evidence of herbal drugs as
perpetrators of pharmacokinetic drug interactions. Planta Med, 2012. 78(13): p. 1458-77.
155. Barrett, B., D. Kiefer, and D. Rabago, Assessing the risks and benefits of herbal
medicine: an overview of scientific evidence. Altern Ther Health Med, 1999. 5(4): p. 40-9.
156. Cragg, G.M. and D.J. Newman, Plants as a source of anti-cancer agents. J
Ethnopharmacol, 2005. 100(1-2): p. 72-9. 157. Langcake, P. and R.J. Pryce, A new class of phytoalexins from grapevines.
Experientia, 1977. 33(2): p. 151-2.
Page 132
118
158. Schroder, G., J.W. Brown, and J. Schroder, Molecular analysis of resveratrol synthase. cDNA, genomic clones and relationship with chalcone synthase. Eur J Biochem, 1988. 172(1): p. 161-9.
159. Dixon, R.A., Natural products and plant disease resistance. Nature, 2001.
411(6839): p. 843-7. 160. Signorelli, P. and R. Ghidoni, Resveratrol as an anticancer nutrient: molecular
basis, open questions and promises. J Nutr Biochem, 2005. 16(8): p. 449-66. 161. Aggarwal, B.B., et al., Role of resveratrol in prevention and therapy of cancer:
preclinical and clinical studies. Anticancer Res, 2004. 24(5A): p. 2783-840. 162. Iranshahy, M., et al., Method Validation for the One-Month Stability Study of
trans-Resveratrol in Human Plasma. Jundishapur J Nat Pharm Prod, 2013. 8(2): p. 65-9.
163. Tome-Carneiro, J., et al., Resveratrol and clinical trials: the crossroad from in
vitro studies to human evidence. Curr Pharm Des, 2013. 19(34): p. 6064-93. 164. Mangum, C., J.A. Cameron, and B.S. Herbert, Effects of Resveratrol on Triple
Negative (ER-, PR-, HER2-) Breast Cancer Cells. FASEB J., 2008. 22: p. 898.45. 165. Kundu, J.K. and Y.J. Surh, Cancer chemopreventive and therapeutic potential of
resveratrol: mechanistic perspectives. Cancer Lett, 2008. 269(2): p. 243-61. 166. Baur, J.A. and D.A. Sinclair, Therapeutic potential of resveratrol: the in vivo
evidence. Nat Rev Drug Discov, 2006. 5(6): p. 493-506. 167. Jang, M., et al., Cancer chemopreventive activity of resveratrol, a natural product
derived from grapes. Science, 1997. 275(5297): p. 218-20. 168. Le Corre, L., et al., Resveratrol and breast cancer chemoprevention: molecular
mechanisms. Mol Nutr Food Res, 2005. 49(5): p. 462-71. 169. Vang, O., et al., What is new for an old molecule? Systematic review and
recommendations on the use of resveratrol. PLoS One, 2011. 6(6): p. e19881. 170. Cottart, C.H., et al., Resveratrol bioavailability and toxicity in humans. Mol Nutr
Food Res, 2010. 54(1): p. 7-16. 171. Burkon, A. and V. Somoza, Quantification of free and protein-bound trans-
resveratrol metabolites and identification of trans-resveratrol-C/O-conjugated diglucuronides - two novel resveratrol metabolites in human plasma. Mol Nutr Food Res, 2008. 52(5): p. 549-57.
172. Jannin, B., et al., Transport of resveratrol, a cancer chemopreventive agent, to
cellular targets: plasmatic protein binding and cell uptake. Biochem Pharmacol, 2004. 68(6): p. 1113-8.
Page 133
119
173. Aumont, V., et al., Regioselective and stereospecific glucuronidation of trans- and cis-resveratrol in human. Arch Biochem Biophys, 2001. 393(2): p. 281-9.
174. Brown, V.A., et al., Repeat dose study of the cancer chemopreventive agent
resveratrol in healthy volunteers: safety, pharmacokinetics, and effect on the insulin-like growth factor axis. Cancer Res, 2010. 70(22): p. 9003-11.
175. Aires, V., et al., Resveratrol metabolites inhibit human metastatic colon cancer
cells progression and synergize with chemotherapeutic drugs to induce cell death. Mol Nutr Food Res, 2013. 57(7): p. 1170-81.
176. Kenealey, J.D., et al., Resveratrol metabolites do not elicit early pro-apoptotic
mechanisms in neuroblastoma cells. J Agric Food Chem, 2011. 59(9): p. 4979-86.
177. Miksits, M., et al., Antitumor activity of resveratrol and its sulfated metabolites
against human breast cancer cells. Planta Med, 2009. 75(11): p. 1227-30. 178. Patel, K.R., et al., Sulfate metabolites provide an intracellular pool for resveratrol
generation and induce autophagy with senescence. Sci Transl Med, 2013. 5(205): p. 205ra133.
179. Patel, K.R., et al., Clinical trials of resveratrol. Ann N Y Acad Sci, 2011. 1215: p.
161-9. 180. Boocock, D.J., et al., Phase I dose escalation pharmacokinetic study in healthy
volunteers of resveratrol, a potential cancer chemopreventive agent. Cancer Epidemiol Biomarkers Prev, 2007. 16(6): p. 1246-52.
181. Andlauer, W., et al., Assessment of resveratrol bioavailability in the perfused
small intestine of the rat. Drugs Exp Clin Res, 2000. 26(2): p. 47-55. 182. Brill, S.S., et al., Glucuronidation of trans-resveratrol by human liver and
intestinal microsomes and UGT isoforms. J Pharm Pharmacol, 2006. 58(4): p. 469-79.
183. Kuhnle, G., et al., Resveratrol is absorbed in the small intestine as resveratrol
glucuronide. Biochem Biophys Res Commun, 2000. 272(1): p. 212-7. 184. Sabolovic, N., et al., Resveratrol is efficiently glucuronidated by UDP-
glucuronosyltransferases in the human gastrointestinal tract and in Caco-2 cells. Biopharm Drug Dispos, 2006. 27(4): p. 181-9.
185. Walle, T., et al., High absorption but very low bioavailability of oral resveratrol in
humans. Drug Metab Dispos, 2004. 32(12): p. 1377-82. 186. Juan, M.E., E. Gonzalez-Pons, and J.M. Planas, Multidrug resistance proteins
restrain the intestinal absorption of trans-resveratrol in rats. J Nutr, 2010. 140(3): p. 489-95.
Page 134
120
187. Alfaras, I., et al., Involvement of breast cancer resistance protein (BCRP1/ABCG2) in the bioavailability and tissue distribution of trans-resveratrol in knockout mice. J Agric Food Chem, 2010. 58(7): p. 4523-8.
188. Patel, K.R., et al., Clinical pharmacology of resveratrol and its metabolites in
colorectal cancer patients. Cancer Res, 2010. 70(19): p. 7392-9. 189. Cal, C., et al., Resveratrol and cancer: chemoprevention, apoptosis, and chemo-
immunosensitizing activities. Curr Med Chem Anticancer Agents, 2003. 3(2): p. 77-93.
190. Aluyen, J.K., et al., Resveratrol: potential as anticancer agent. J Diet Suppl,
2012. 9(1): p. 45-56. 191. Gehm, B.D., et al., Resveratrol, a polyphenolic compound found in grapes and
wine, is an agonist for the estrogen receptor. Proc Natl Acad Sci U S A, 1997. 94(25): p. 14138-43.
192. Mgbonyebi, O.P., J. Russo, and I.H. Russo, Antiproliferative effect of synthetic
resveratrol on human breast epithelial cells. Int J Oncol, 1998. 12(4): p. 865-9. 193. Nakagawa, H., et al., Resveratrol inhibits human breast cancer cell growth and
may mitigate the effect of linoleic acid, a potent breast cancer cell stimulator. J Cancer Res Clin Oncol, 2001. 127(4): p. 258-64.
194. Blagosklonny, M.V., Cell cycle arrest is not yet senescence, which is not just cell
cycle arrest: terminology for TOR-driven aging. Aging (Albany NY), 2012. 4(3): p. 159-65.
195. Gewirtz, D.A., The four faces of autophagy: implications for cancer therapy.
Cancer Res, 2014. 74(3): p. 647-51. 196. Delmas, D., E. Solary, and N. Latruffe, Resveratrol, a phytochemical inducer of
multiple cell death pathways: apoptosis, autophagy and mitotic catastrophe. Curr Med Chem, 2011. 18(8): p. 1100-21.
197. Zhang, X., et al., Plant natural compounds: targeting pathways of autophagy as
anti-cancer therapeutic agents. Cell Prolif, 2012. 45(5): p. 466-76. 198. Lobo, N.A., et al., The biology of cancer stem cells. Annu Rev Cell Dev Biol,
2007. 23: p. 675-99. 199. Pandey, P.R., et al., Resveratrol suppresses growth of cancer stem-like cells by
inhibiting fatty acid synthase. Breast Cancer Res Treat, 2011. 130(2): p. 387-98. 200. Shankar, S., et al., Resveratrol inhibits pancreatic cancer stem cell
characteristics in human and KrasG12D transgenic mice by inhibiting pluripotency maintaining factors and epithelial-mesenchymal transition. PLoS One, 2011. 6(1): p. e16530.
Page 135
121
201. Shen, Y.A., et al., Resveratrol Impedes the Stemness, Epithelial-Mesenchymal Transition, and Metabolic Reprogramming of Cancer Stem Cells in Nasopharyngeal Carcinoma through p53 Activation. Evid Based Complement Alternat Med, 2013. 2013: p. 590393.
202. Serrero, G. and R. Lu, Effect of resveratrol on the expression of autocrine growth
modulators in human breast cancer cells. Antioxid Redox Signal, 2001. 3(6): p. 969-79.
203. Bove, K., D.W. Lincoln, and M.F. Tsan, Effect of resveratrol on growth of 4T1
breast cancer cells in vitro and in vivo. Biochem Biophys Res Commun, 2002. 291(4): p. 1001-5.
204. Damianaki, A., et al., Potent inhibitory action of red wine polyphenols on human
breast cancer cells. J Cell Biochem, 2000. 78(3): p. 429-41. 205. Pozo-Guisado, E., et al., The antiproliferative activity of resveratrol results in
apoptosis in MCF-7 but not in MDA-MB-231 human breast cancer cells: cell-specific alteration of the cell cycle. Biochem Pharmacol, 2002. 64(9): p. 1375-86.
206. Tang, H.Y., et al., Resveratrol-induced cyclooxygenase-2 facilitates p53-
dependent apoptosis in human breast cancer cells. Mol Cancer Ther, 2006. 5(8): p. 2034-42.
207. Scarlatti, F., et al., Resveratrol induces growth inhibition and apoptosis in
metastatic breast cancer cells via de novo ceramide signaling. Faseb j, 2003. 17(15): p. 2339-41.
208. Mezzanotte, L., et al., A New Multicolor Bioluminescence Imaging Platform to
Investigate NF-kappaB Activity and Apoptosis in Human Breast Cancer Cells. PLoS One, 2014. 9(1): p. e85550.
209. Garvin, S., K. Ollinger, and C. Dabrosin, Resveratrol induces apoptosis and
inhibits angiogenesis in human breast cancer xenografts in vivo. Cancer Lett, 2006. 231(1): p. 113-22.
210. Nin, V., et al., Role of deleted in breast cancer 1 (DBC1) protein in SIRT1
deacetylase activation induced by protein kinase A and AMP-activated protein kinase. J Biol Chem, 2012. 287(28): p. 23489-501.
211. Kim, J.E., J. Chen, and Z. Lou, DBC1 is a negative regulator of SIRT1. Nature,
2008. 451(7178): p. 583-6. 212. Wang, R.H., et al., Interplay among BRCA1, SIRT1, and Survivin during BRCA1-
associated tumorigenesis. Mol Cell, 2008. 32(1): p. 11-20. 213. Detampel, P., et al., Drug interaction potential of resveratrol. Drug Metab Rev,
2012. 44(3): p. 253-65. 214. Oskarsson, A., et al., Inhibition of CYP17A1 activity by resveratrol, piceatannol,
and synthetic resveratrol analogs. Prostate, 2014.
Page 136
122
215. Chan, W.K. and A.B. Delucchi, Resveratrol, a red wine constituent, is a mechanism-based inactivator of cytochrome P450 3A4. Life Sci, 2000. 67(25): p. 3103-12.
216. Kma, L., Synergistic Effect of Resveratrol and Radiotherapy in Control of
Cancers. Asian Pac J Cancer Prev, 2013. 14(11): p. 6197-6208. 217. Gupta, S.C., et al., Chemosensitization of tumors by resveratrol. Ann N Y Acad
Sci, 2011. 1215: p. 150-60. 218. Singh, C.K., J. George, and N. Ahmad, Resveratrol-based combinatorial
strategies for cancer management. Ann N Y Acad Sci, 2013. 1290(1): p. 113-21. 219. Jazirehi, A.R. and B. Bonavida, Resveratrol modifies the expression of apoptotic
regulatory proteins and sensitizes non-Hodgkin's lymphoma and multiple myeloma cell lines to paclitaxel-induced apoptosis. Mol Cancer Ther, 2004. 3(1): p. 71-84.
220. Kubota, T., et al., Combined effects of resveratrol and paclitaxel on lung cancer
cells. Anticancer Res, 2003. 23(5A): p. 4039-46. 221. Zhao, W., et al., Resveratrol down-regulates survivin and induces apoptosis in
human multidrug-resistant SPC-A-1/CDDP cells. Oncol Rep, 2010. 23(1): p. 279-86.
222. Quan, F., et al., Reversal effect of resveratrol on multidrug resistance in KBv200
cell line. Biomed Pharmacother, 2008. 62(9): p. 622-9. 223. Mao, Q.Q., et al., Resveratrol confers resistance against taxol via induction of
cell cycle arrest in human cancer cell lines. Mol Nutr Food Res, 2010. 54(11): p. 1574-84.
224. Nicolini, G., et al., Anti-apoptotic effect of trans-resveratrol on paclitaxel-induced
apoptosis in the human neuroblastoma SH-SY5Y cell line. Neurosci Lett, 2001. 302(1): p. 41-4.
225. Rigolio, R., et al., Resveratrol interference with the cell cycle protects human
neuroblastoma SH-SY5Y cell from paclitaxel-induced apoptosis. Neurochem Int, 2005. 46(3): p. 205-11.
226. Fukui, M., N. Yamabe, and B.T. Zhu, Resveratrol attenuates the anticancer
efficacy of paclitaxel in human breast cancer cells in vitro and in vivo. Eur J Cancer, 2010. 46(10): p. 1882-91.
227. Godwin, A.K., et al., High resistance to cisplatin in human ovarian cancer cell
lines is associated with marked increase of glutathione synthesis. Proc Natl Acad Sci U S A, 1992. 89(7): p. 3070-4.
228. Oliver, M.H., et al., A rapid and convenient assay for counting cells cultured in
microwell plates: application for assessment of growth factors. J Cell Sci, 1989. 92 ( Pt 3): p. 513-8.
Page 137
123
229. Goldblatt, E.M., et al., The telomerase template antagonist GRN163L alters MDA-MB-231 breast cancer cell morphology, inhibits growth, and augments the effects of paclitaxel. Mol Cancer Ther, 2009. 8(7): p. 2027-35.
230. Munshi, A., M. Hobbs, and R.E. Meyn, Clonogenic cell survival assay. Methods
Mol Med, 2005. 110: p. 21-8. 231. Chou, T.C. and P. Talalay, Quantitative analysis of dose-effect relationships: the
combined effects of multiple drugs or enzyme inhibitors. Adv Enzyme Regul, 1984. 22: p. 27-55.
232. Chou, T.C., Drug combination studies and their synergy quantification using the
Chou-Talalay method. Cancer Res, 2010. 70(2): p. 440-6. 233. Schmittgen, T.D. and K.J. Livak, Analyzing real-time PCR data by the
comparative C(T) method. Nat Protoc, 2008. 3(6): p. 1101-8. 234. Joe, A.K., et al., Resveratrol induces growth inhibition, S-phase arrest, apoptosis,
and changes in biomarker expression in several human cancer cell lines. Clin Cancer Res, 2002. 8(3): p. 893-903.
235. Juan, M.E., et al., Resveratrol induces apoptosis through ROS-dependent
mitochondria pathway in HT-29 human colorectal carcinoma cells. J Agric Food Chem, 2008. 56(12): p. 4813-8.
236. Frackowiak, S., et al., Preservation of chromosome integrity during
micronucleation induced by colchicine in PtK1 cells. Chromosoma, 1986. 94(6): p. 468-474.
237. Campisi, J., Aging, cellular senescence, and cancer. Annu Rev Physiol, 2013.
75: p. 685-705. 238. Hawley, S.A., et al., Characterization of the AMP-activated protein kinase kinase
from rat liver and identification of threonine 172 as the major site at which it phosphorylates AMP-activated protein kinase. J Biol Chem, 1996. 271(44): p. 27879-87.
239. Wen, X., et al., Trimethoprim and sulfamethoxazole are selective inhibitors of
CYP2C8 and CYP2C9, respectively. Drug Metab Dispos, 2002. 30(6): p. 631-5. 240. McDermott, M., et al., In vitro Development of Chemotherapy and Targeted
Therapy Drug-Resistant Cancer Cell Lines: A Practical Guide with Case Studies. Front Oncol, 2014. 4: p. 40.
241. Bhatia, A. and Y. Kumar, Cancer cell micronucleus: an update on clinical and
diagnostic applications. Apmis, 2013. 121(7): p. 569-81. 242. Fulda, S. and K.M. Debatin, Sensitization for anticancer drug-induced apoptosis
by the chemopreventive agent resveratrol. Oncogene, 2004. 23(40): p. 6702-11.
Page 138
124
243. Hayashibara, T., et al., Resveratrol induces downregulation in survivin expression and apoptosis in HTLV-1-infected cell lines: a prospective agent for adult T cell leukemia chemotherapy. Nutr Cancer, 2002. 44(2): p. 193-201.
244. Bhardwaj, A., et al., Resveratrol inhibits proliferation, induces apoptosis, and
overcomes chemoresistance through down-regulation of STAT3 and nuclear factor-kappaB-regulated antiapoptotic and cell survival gene products in human multiple myeloma cells. Blood, 2007. 109(6): p. 2293-302.
245. Sung, J.Y., et al., Balance between SIRT1 and DBC1 expression is lost in breast
cancer. Cancer Sci, 2010. 101(7): p. 1738-44. 246. Hubbard, B.P., et al., Evidence for a common mechanism of SIRT1 regulation by
allosteric activators. Science, 2013. 339(6124): p. 1216-9. 247. Jin, Q., et al., Cytoplasm-localized SIRT1 enhances apoptosis. J Cell Physiol,
2007. 213(1): p. 88-97. 248. Hannun, Y.A., C. Luberto, and K.M. Argraves, Enzymes of sphingolipid
metabolism: from modular to integrative signaling. Biochemistry, 2001. 40(16): p. 4893-903.
249. Escarcega, R.O., et al., The transcription factor nuclear factor-kappa B and
cancer. Clin Oncol (R Coll Radiol), 2007. 19(2): p. 154-61. 250. Borra, M.T., B.C. Smith, and J.M. Denu, Mechanism of human SIRT1 activation
by resveratrol. J Biol Chem, 2005. 280(17): p. 17187-95. 251. Manuel Iglesias, J., et al., Mammosphere formation in breast carcinoma cell lines
depends upon expression of E-cadherin. PLoS One, 2013. 8(10): p. e77281. 252. Pampaloni, F., E.G. Reynaud, and E.H. Stelzer, The third dimension bridges the
gap between cell culture and live tissue. Nat Rev Mol Cell Biol, 2007. 8(10): p. 839-45.
253. Shultz, L.D., et al., Human lymphoid and myeloid cell development in NOD/LtSz-
scid IL2R gamma null mice engrafted with mobilized human hemopoietic stem cells. J Immunol, 2005. 174(10): p. 6477-89.
254. Siolas, D. and G.J. Hannon, Patient-derived tumor xenografts: transforming
clinical samples into mouse models. Cancer Res, 2013. 73(17): p. 5315-9. 255. Gut, I., et al., Cytotoxicity of cyclophosphamide, paclitaxel, and docetaxel for
tumor cell lines in vitro: effects of concentration, time and cytochrome P450-catalyzed metabolism. Arch Toxicol, 2000. 74(8): p. 437-46.
256. Ji, N., et al., Developing multidrug-resistant cells and exploring correlation
between BCRP/ABCG2 over-expression and DNA methyltransferase. Acta Biochim Biophys Sin (Shanghai), 2010. 42(12): p. 854-62.
Page 139
125
257. O'Brien, C., et al., Functional genomics identifies ABCC3 as a mediator of taxane resistance in HER2-amplified breast cancer. Cancer Res, 2008. 68(13): p. 5380-9.
258. Nakshatri, H., et al., Constitutive activation of NF-kappaB during progression of
breast cancer to hormone-independent growth. Mol Cell Biol, 1997. 17(7): p. 3629-39.
259. Vaclavikova, R., et al., Paclitaxel metabolism in rat and human liver microsomes
is inhibited by phenolic antioxidants. Naunyn Schmiedebergs Arch Pharmacol, 2003. 368(3): p. 200-9.
260. Nabekura, T., S. Kamiyama, and S. Kitagawa, Effects of dietary
chemopreventive phytochemicals on P-glycoprotein function. Biochem Biophys Res Commun, 2005. 327(3): p. 866-70.
261. Al-Abd, A.M., et al., Resveratrol enhances the cytotoxic profile of docetaxel and
doxorubicin in solid tumour cell lines in vitro. Cell Prolif, 2011. 262. Kim, T.H., et al., Resveratrol enhances chemosensitivity of doxorubicin in
multidrug-resistant human breast cancer cells via increased cellular influx of doxorubicin. Biochim Biophys Acta, 2014. 1840(1): p. 615-25.
Page 140
CURRICULUM VITAE
Alyssa A. Sprouse EDUCATION 2009 – 2014 Doctor of Philosophy, Pharmacology, Indiana University,
Indianapolis, IN (GPA 3.78) 2004 – 2008 Bachelor of Science, Biology, University of Dayton, Dayton, OH
(GPA 3.41) LICENSURE AND CERTIFICATION 2010 Collaborative Institutional Training Initiative (CITI) Responsible
Conduct of Research Module 2010 CITI Animal Care and Use Training PROFESSIONAL ORGANIZATIONS 2014 – Trainee Member, American Society for Clinical Pharmacology and
Therapeutics 2014 – Trainee Member, International Society of Pharmacometrics 2013 – Member, American Association for the Advancement of Science 2011 – Member, Association for Women in Science 2011 – Associate Member, American Association for Cancer Research HONORS AND AWARDS 2013 Mary Frances Picciano Dietary Supplement Research Practicum
Travel Award (see Grants and Fellowships) 2012 Indiana University Purdue University Research Day First Place
Award for Professional and Graduate Student Poster Competition 2009 – 2011 Indiana University School of Medicine Fellowship (see Grants and
Fellowships) 2009 University of Dayton’s Biology Department Learn, Lead and Serve
Award 2007 University of Dayton Learn, Lead and Serve Grant (see Grants
and Fellowships) 2005, 2007 University of Dayton Dean’s List 2005 – 2009 University of Dayton Presidential Scholarship 2005 – 2009 Ohio Student Choice Grant
Page 141
LABORATORY EXPERIENCE 2010 – 2014 Indiana University School of Medicine, Indianapolis, IN, Department of Pharmacology and Toxicology Supervisor: Dr. Brittney-Shea Herbert,
Ph.D. Researcher
Characterizing the mechanism of paclitaxel resistance, the mechanism of action of resveratrol, and the use of resveratrol and paclitaxel in combination in derived paclitaxel-resistant triple negative breast cancer cells.
2010 Indiana University School of Medicine, Indianapolis, IN
Department of Pharmacology and Toxicology Supervisor: Dr. Jian-Ting Zhang, Ph.D. Rotation Student Examined proteome changes in derived gemcitabine-resistant pancreatic cancer cells compared to the parental cells.
2010 Indiana University School of Medicine, Indianapolis, IN
Department of Pharmacology and Toxicology Supervisor: Dr. Karen Pollok, Ph.D. Rotation Student Examined the anti-proliferatrive effects of Nutlin-3a in breast and brain cancer cells.
2009 Indiana University School of Medicine, Indianapolis, IN
Department of Pharmacology and Toxicology Supervisor: Dr. Brittney-Shea Herbert, Ph.D. Rotation Student Extracted Echinacea angustifolia to examine anti-proliferation effects in breast cancer cells.
2008 – 2009 University of Dayton, Dayton, OH Department of Biology Supervisor: Dr. Yiling Hong Researcher Examined the redifferenetiation effects of chemically defined media on melanoma cells and the growth inhibition effects of Echinacea angustifolia extract on breast cancer cells.
2007 – 2009 University of Dayton, Dayton, OH Department of Biology Supervisor: Dr. Yiling Hong
Laboratory Assistant General laboratory maintenance and purchasing.
Page 142
UNIVERSITY SERVICE 2011 Pharmacology and Toxicology Techniques Student Journal Club
Initiator and Coordinator. Activities included starting a techniques journal club, giving presentations, and coordinating fellow student presenters.
2010 – 2014 Pharmacology and Toxicology New Student Orientation Poster
Presentations. 2010 – 2014 Pharmacology and Toxicology Journal Club Series Presenter.
Activities include leading journal club discussions. 2010 – 2014 Student Ambassador to prospective students visiting Indiana
University School of Medicine. Activities include Building Guide, Poster Presentations, accompaniment to dinners and lunches.
OTHER PROFESSIONAL ACTIVITIES: Invited Talks and Seminars: 2014 Division of Clinical Pharmacology Special Seminar, Resveratrol
Augments Paclitaxel Treatment in MDA-MB-231 and Paclitaxel-resistant MDA-MB-231 Breast Cancer Cells. Indianapolis, IN (Seminar)
2013 Department of Pharmacology and Toxicology Student Seminar
Series, Resveratrol Activity in Paclitaxel-sensitive and -resistant Triple Negative Breast Cancer Cells. Indianapolis, IN (Seminar)
2013 Department of Pharmacology and Toxicology Student Seminar
Series, Molecular Mechanisms of Paclitaxel Resistance and Resveratrol Sensitivity in MDA-MB-231 Breast Cancer Cells. Indianapolis, IN (Seminar)
2013 American Association for Cancer Research Annual Meeting,
Molecular Mechanisms of Paclitaxel Resistance and Resveratrol Sensitivity in MDA-MB-231 Breast Cancer Cells. Abstract #876, Washington, D.C. (Poster)
2012 IUSM Cancer Biology Research Club, Molecular Mechanisms of
Paclitaxel Resistance and Resveratrol Sensitivity in MDA-MB-231 Breast Cancer Cells. Indianapolis, IN (Seminar)
2012 IUSCC Cancer Research Day, Effects of Resveratrol on Paclitaxel-sensitive and -resistant Triple Negative Breast Cancer Cells, Indianapolis, IN (Poster)
2012 Department of Pharmacology and Toxicology Student Seminar
Series, Effects of Resveratrol on Paclitaxel-sensitive and -resistant Triple Negative Breast Cancer Cells. Indianapolis, IN (Seminar)
Page 143
2012 IUPUI Research Day, Effects of Resveratrol on Paclitaxel-
sensitive and -resistant Triple Negative Breast Cancer Cells. Indianapolis, IN (Poster)
2012 AACR Annual Meeting, Effects of Resveratrol on Paclitaxel-
sensitive and -resistant Triple Negative Breast Cancer Cells. Abstract #5676, Chicago, IL (Poster)
2011 IUSM Cancer Biology Research Club, Effects of Resveratrol on
Paclitaxel-sensitive and -resistant Triple Negative Breast Cancer Cells. Indianapolis, IN (Seminar)
2011 Department of Pharmacology and Toxicology Student Seminar
Series, Resveratrol as a Cancer Therapeutic. Indianapolis, IN (Seminar)
2009 University of Dayton Stander Symposium, Reprogramming
Melanoma and Breast Cancer Cells with Chemically Defined Media and Echinacea Extract. Dayton, OH (Poster)
Attended Talks and Seminars: 2013 Mary Frances Picciano Dietary Supplement Research Practicum,
Bethesda, MD 2013 AACR 2013 Annual Meeting, Washington D.C. 2012 IUSCC Cancer Research Day, Indianapolis, IN 2012 IUPUI Research Day, Indianapolis, IN 2012 AACR 2012 Annual Meeting, Chicago, IL 2011 Purdue University Center for Cancer Research Drug Delivery and
Cancer: Challenges and New Directions for Cancer Therapy, West Lafayette, IN
2011 Purdue University Breast Cancer Discovery Group Retreat, West
Lafayette, IN 2011 Amelia Project Giving Wings to Research, Indianapolis, IN 2011 Purdue University International Symposium on Breast Cancer
Prevention: Nutrition, Communication, and Public policy, West Lafayette, IN
2009 – 2014 Department of Pharmacology and Toxicology Seminar Series
Page 144
GRANTS AND FELLOWSHIPS Fellowships: 2009 – 2011 Indiana University School of Medicine Fellowship Grants: 2013 Mary Frances Picciano Dietary Supplement Research Practicum
Travel Award 2007 University of Dayton Learn, Lead and Serve Award PEER REVIEWED PUBLICATIONS Koziel JE, Fox MJ, Steding CE, Sprouse AA, Herbert BS (2011). Medical genetics and epigenetics of telomerase. J Cell Mol Med, 15:457-67; PMID: 21323862. Sprouse AA, Steding CE, Herbert BS (2011) Pharmaceutical regulation of telomerase and its clinical potential. J Cell Mol Med. 16(1):1-7; PMID: 21973217. Mangum CN*, Sprouse AA*, Herbert BS (submitted 2013) Effects of Resveratrol on Triple Negative, Mutant BRCA1 Breast Cancer Cell Growth and Paclitaxel Augmentation. BMC Cancer. (*co-first authors) Sprouse AA, Herbert BS (submitted 2014). Resveratrol Augments Paclitaxel Treatment in MDA-MB-231 and Paclitaxel-resistant MDA-MB-231 Breast Cancer Cells. Mol Pharm.
ABSTRACTS 2013 American Association for Cancer Research Annual Meeting,
Molecular mechanisms of paclitaxel resistance and resveratrol sensitivity in MDA-MB-231 breast cancer cells. Abstract #876, Washington D.C.
2012 IUSCC Cancer Research Day, Effects of Resveratrol on
Paclitaxel-sensitive and -resistant Triple Negative Breast Cancer Cells, Indianapolis, IN
2012 IUPUI Research Day, Effects of Resveratrol on Paclitaxel-
sensitive and -resistant Triple Negative Breast Cancer Cells., Indianapolis, IN
2012 American Association for Cancer Research Annual Meeting,
Effects of Resveratrol on Paclitaxel-sensitive and -resistant Triple Negative Breast Cancer Cells. Abstract #5676, Chicago, IL


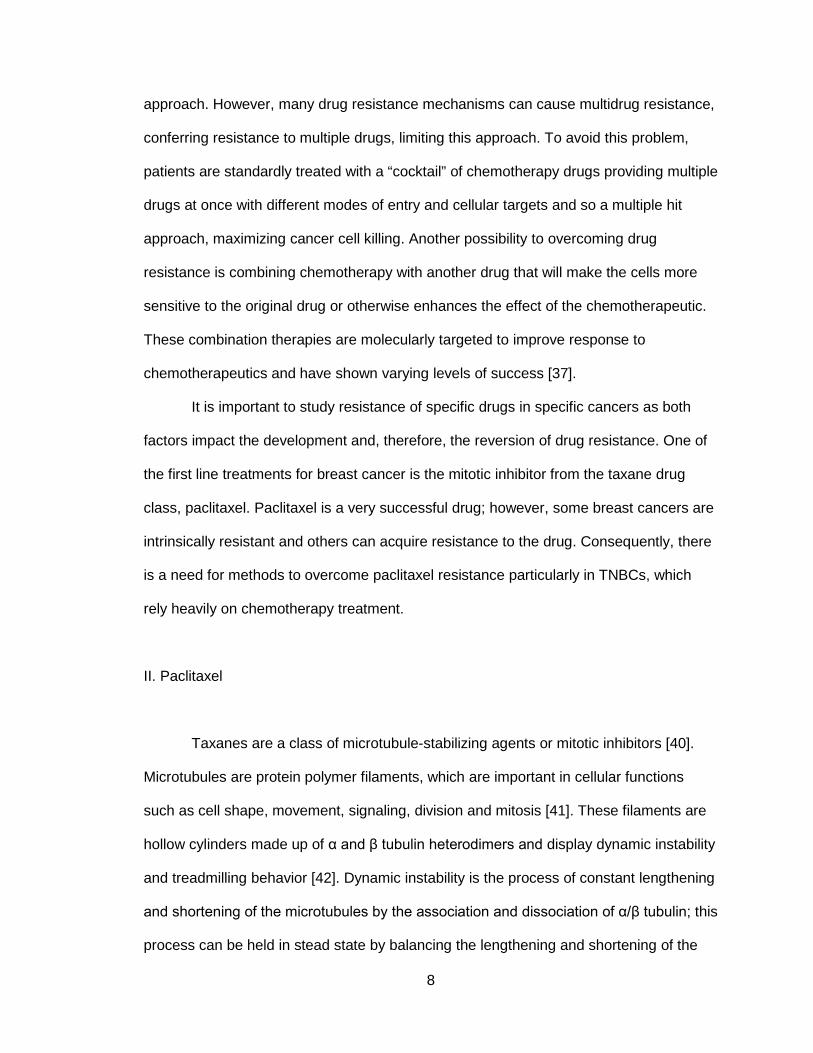


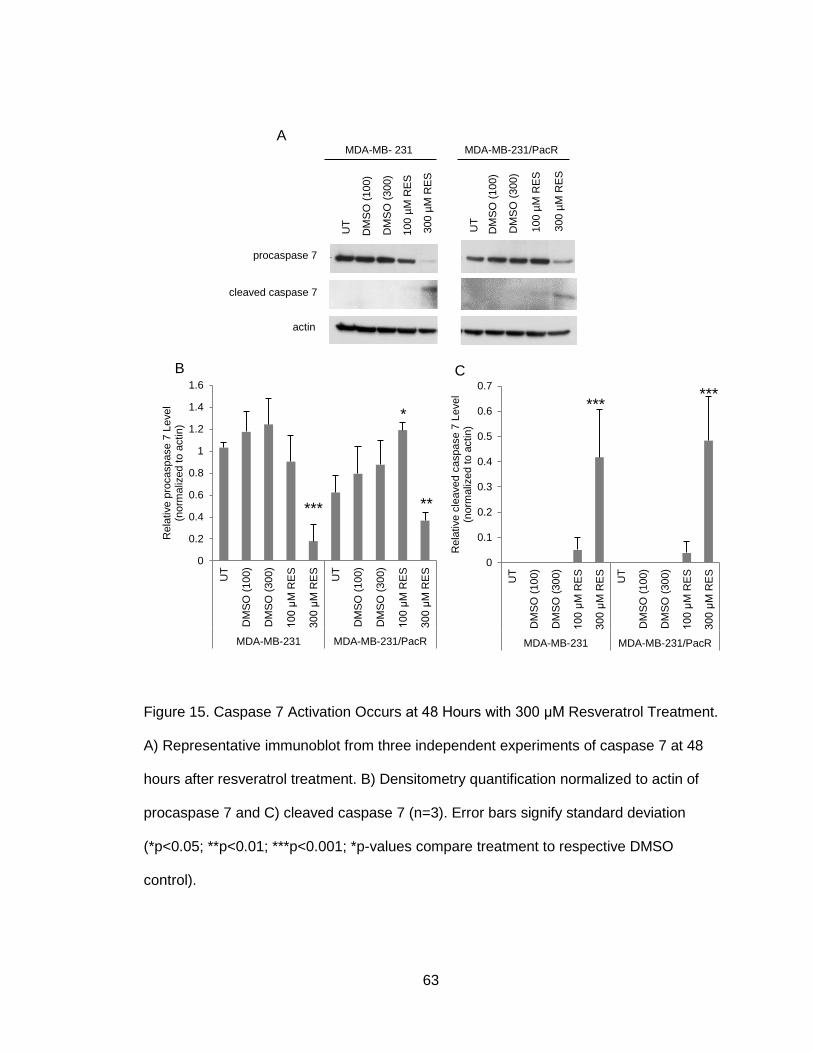


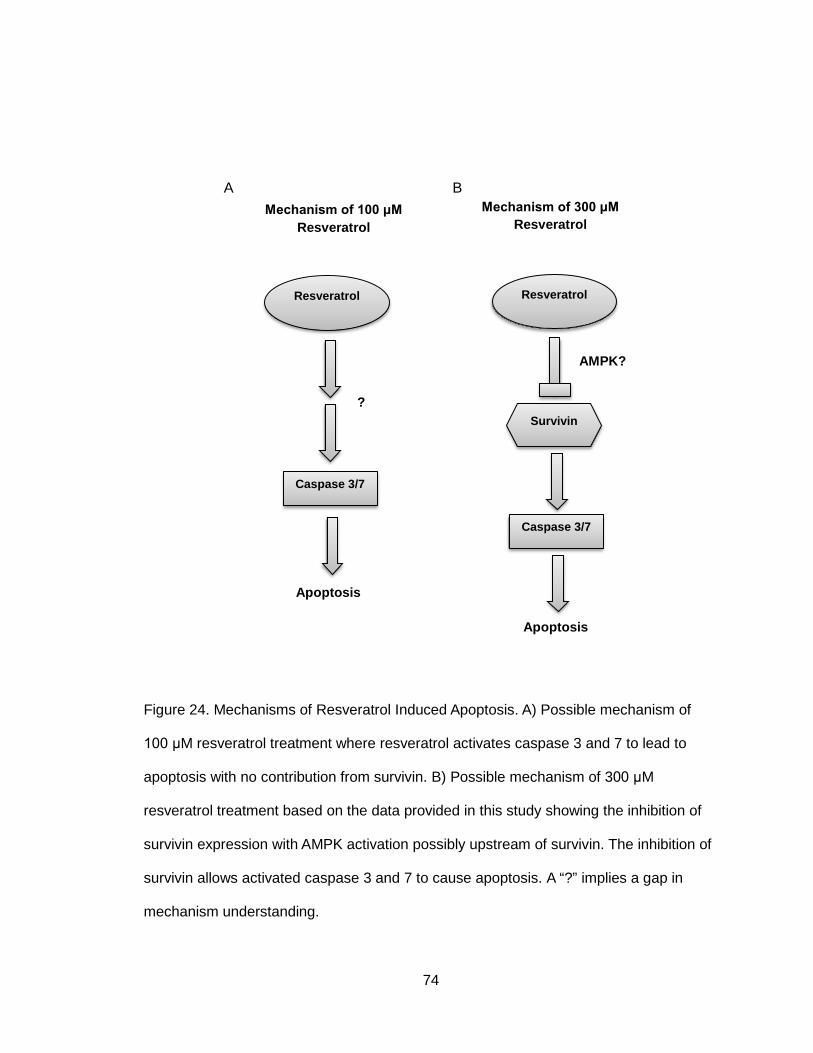


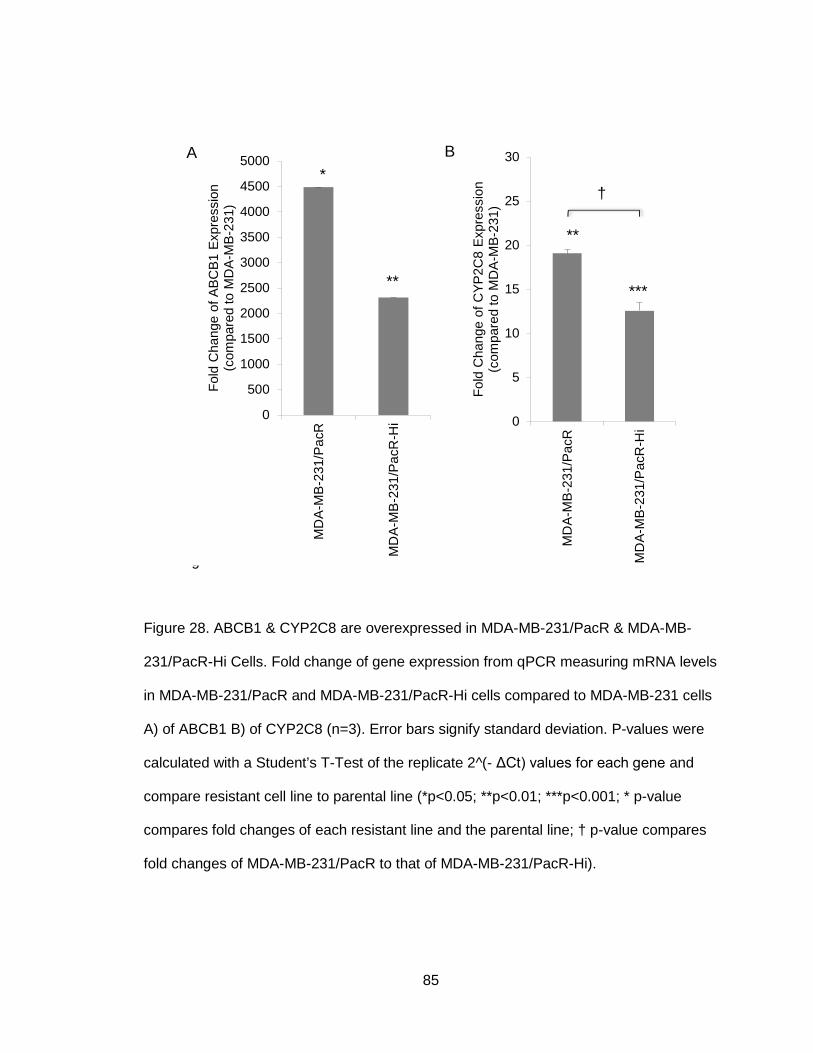
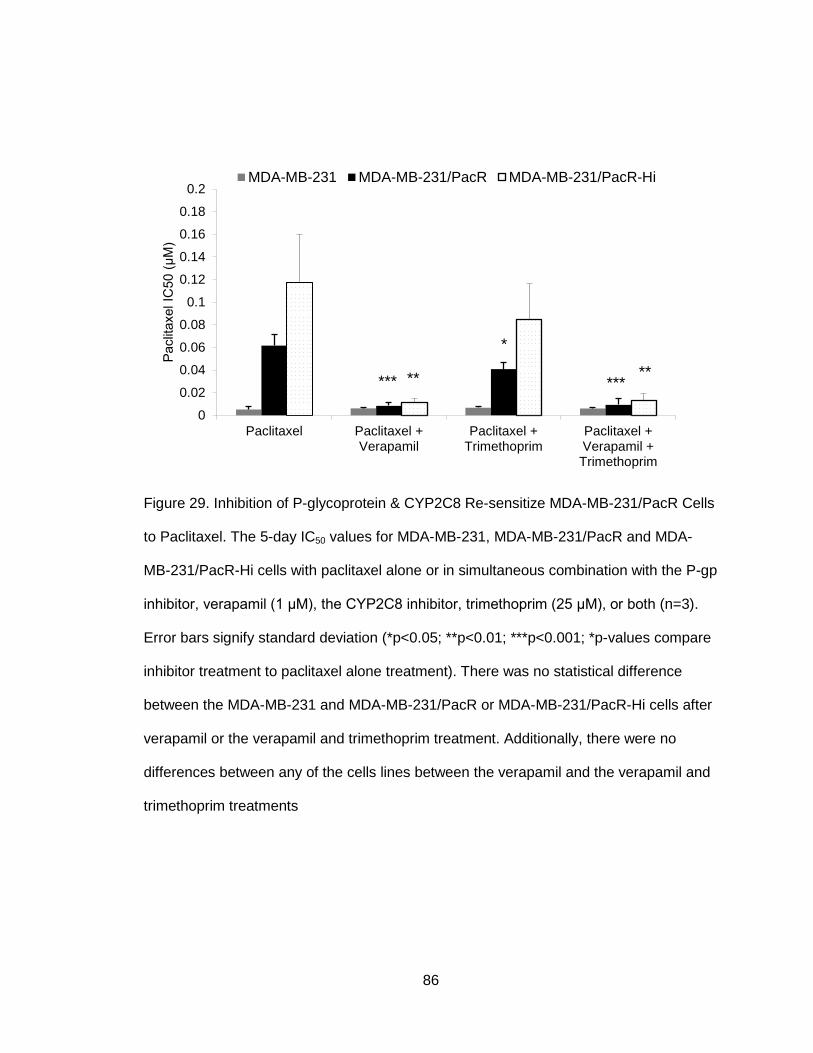


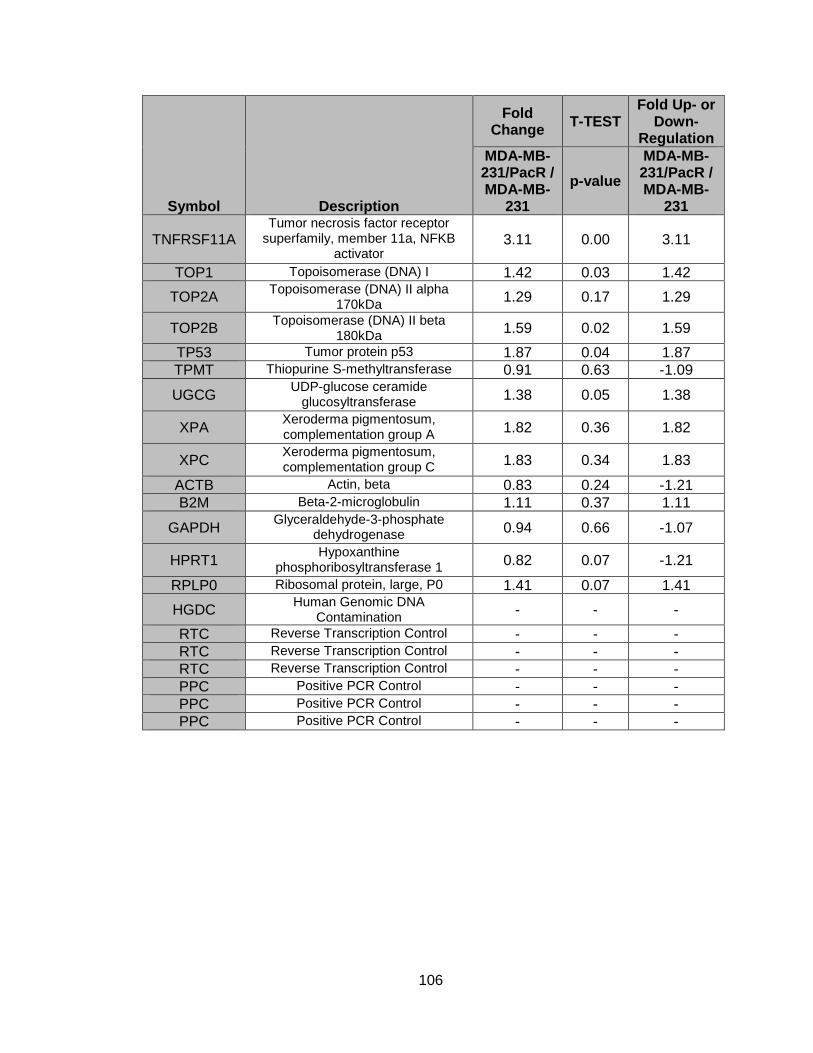


![Original Article Potential biomarkers for paclitaxel ... · Potential biomarkers for paclitaxel sensitivity in ... larynx and oropharynx cancer [5, 15]. ... Biomarkers for paclitaxel](https://static.documents.pub/doc/80x56/5af0f1e17f8b9a572b901a03/original-article-potential-biomarkers-for-paclitaxel-biomarkers-for-paclitaxel.jpg)


