33
Warrington Borough Council Retail and Leisure Study Update 2021 Final Report July 2021
Warrington Borough Council
Retail and Leisure Study
Update 2021
Final Report
July 2021
Warrington Borough Council Retail and Leisure Study Update 2021
Contents
1 Introduction .............................................................................................................................................. 2
Instruction ....................................................................................................................................................................................... 2
Structure of Report ...................................................................................................................................................................... 3
2 Context for the Retail and Leisure Study Update ................................................................................. 4
Emerging Warrington Local Plan ........................................................................................................................................... 4
Principal Findings of 2015 Retail and Leisure Study ...................................................................................................... 5
3 Study Area, Population and Expenditure .............................................................................................. 7
Study Area ....................................................................................................................................................................................... 7
Study Area Population ............................................................................................................................................................... 8
Retail Expenditure ...................................................................................................................................................................... 10
Convenience Goods Expenditure Across the Defined Study Area ................................................................. 13
Comparison Goods Expenditure Across the Defined Study Area ................................................................... 14
4 Updated Assessment of Quantitative Retail Need ............................................................................. 16
General Approach to Estimating Need ............................................................................................................................. 16
Available Expenditure ....................................................................................................................................................... 16
Turnover ................................................................................................................................................................................. 16
Surplus/Deficit ..................................................................................................................................................................... 16
Capacity for Future Convenience Goods Floorspace ................................................................................................... 17
Capacity for Future Comparison Goods Floorspace .................................................................................................... 21
5 Updated Assessment of Leisure Need ................................................................................................. 26
Bingo ............................................................................................................................................................................................... 27
Cinemas ......................................................................................................................................................................................... 28
Ten Pin Bowling .......................................................................................................................................................................... 29
6 Summary and Conclusions .................................................................................................................... 30
Key Findings: Retail Need ....................................................................................................................................................... 30
Key Findings: Leisure Need .................................................................................................................................................... 31
Appendix 1: Study Area Plan
Appendix 2: 2014 Household Survey Results
Appendix 3: Quantitative Capacity Assessment
Warrington Borough Council Retail and Leisure Study Update 2021
2
1 Introduction
Instruction
1.1 Nexus Planning has been instructed by Warrington Borough Council (hereafter referred to as ‘the
Council’) to undertake an Update of the principal findings of the Warrington Retail and Leisure Study
of August 20151. The focus of this 2021 Update is to identify the current position in respect of the
need for additional retail and leisure facilities in the Borough. Our report will assist the Council with
its preparation of the Local Plan Review, which will set out policies and proposals to guide future
development across the Borough over the period to 2038.
1.2 Nexus Planning carried out an earlier Update to the original Retail and Leisure Study in 2019.
However, given the impact of the Covid-19 pandemic on households’ use of retail and leisure facilities
and the fact that the Council are currently updating the Local Plan ahead of a further Regulation 19
consultation, we believe that a further Update is required to appropriately assess future needs.
1.3 The 2021 Update utilises the 2014 shopper survey of 1,000 households2, which informed the 2015
Retail and Leisure Study. Whilst the survey is now over six years old, its continued use is considered
appropriate given that the retail and leisure function located within the Borough remains broadly
similar to that which was apparent at the time of the survey. Furthermore, it is the Council’s view that
the value of a new survey would be limited given the recent trading restrictions associated with the
Covid-19 pandemic and the difficulties inherent in recording established patterns of retail and leisure
use at the current time.
1.4 The Study Area for the household survey comprises ten separate zones, which reflect Warrington’s
principal catchment area. A plan of the Study Area is provided as Appendix 1, and the household
survey results are provided as Appendix 2. The Study Area also includes parts of the neighbouring
authority areas of Cheshire West and Chester, Halton and Trafford, where residents may look to
facilities in Warrington to meet at least some of their retail and leisure needs.
1.5 This Update therefore relies on the 2014 NEMS household survey to identify the market share of
convenience goods and comparison goods shopping trips claimed by venues in Warrington Borough.
As such, we recommend that this report is read with reference to the 2015 Retail and Leisure Study,
1 Originally undertaken by WYG Planning and subsequently the subject of an earlier update by Nexus Planning, dated March
2019. 2 Undertaken by NEMS Market Research in November 2014.
Warrington Borough Council Retail and Leisure Study Update 2021
3
which provides a detailed assessment of identified shopping patterns across the Study Area.
Structure of Report
1.6 Our report firstly summarises the key findings of the previous Study and the local context for the
Update. We then set consider the up-to-date position in respect of future population and
expenditure growth across the Study Area, before providing an updated assessment of retail and
leisure needs. The final section of our report sets out our conclusions, and the implications of the
Update in respect of the emerging Local Plan Review.
1.7 Accordingly, our report is structured as follows:
Section 2 considers the emerging development plan policy context for this updated Retail and
Leisure Study alongside the key findings of the 2015 Study;
Section 3 provides an overview of the current and future population and expenditure levels
within the defined Study Area;
Section 4 set out an updated assessment of retail needs;
Section 5 provides an updated assessment of leisure needs; and
Section 6 provides a summary of our key findings and conclusions.
Warrington Borough Council Retail and Leisure Study Update 2021
4
2 Context for the Retail and Leisure Study Update
Emerging Warrington Local Plan
2.1 The Council is currently preparing a new Local Plan. The Proposed Submission Version of the Local
Plan (PSVLP) was the subject of an eight-week consultation from 15 April to 17 June 2019. In the
period since the publication of the PSVLP (2019), a number of factors have combined to result in the
Council reviewing its draft Local Plan; namely the economic impacts of Brexit and Covid-19, the
Government’s review of the standard housing methodology, the response to the Regulation 19
consultation and the uncertainty over delivery of the level of development proposed in the PSVLP
2019. The Council is therefore preparing a revised PSVLP for consultation in Autumn 2021. The
revised PSVLP will cover the period 2021 to 2038.
2.2 As part of this process, the Council is also undertaking a comprehensive review of the evidence base
that underpins the emerging Local Plan. This Retail and Leisure Study Update has been commissioned
to provide an up-to-date position on retail and leisure needs in the authority area.
2.3 The strategic objectives that are of principal relevance to the Borough’s town centres and to future
retail and leisure provision comprise:
Objective W1, which seeks to meet Warrington’s future development needs through the
regeneration of Inner Warrington, the delivery of strategic and local infrastructure, the
strengthening of existing neighbourhoods, and the creation of new sustainable
neighbourhoods;
Objective W3, which seeks to strengthen and expand the role of Warrington town centre as a
regional employment, retail, leisure, cultural and transport hub, whilst transforming the quality
of the public realm and making the town centre a place where people want to live; and
Objective W4, which seeks to provide for new infrastructure to support Warrington’s growth,
reduce congestion and promote sustainable transport options, and encourage active and
healthy lifestyles.
2.4 In considering the future provision of retail and leisure facilities, it is relevant to note that the
emerging Local Plan proposes the release of Green Belt land in order to meet future needs. It is
proposed that this will take the form of the South East Warrington Urban Extension (SEWUE)with the
potential to accommodate around 2,400 new homes over the plan period and a further 1,800 homes
beyond the plan period. In addition, residential development is proposed at the Fiddlers Ferry
Warrington Borough Council Retail and Leisure Study Update 2021
5
opportunity site, providing 1,300 homes within the plan period with the potential for a further 450
homes beyond the plan period. In both cases, it is envisaged that additional shops and facilities taking
the form of a new centre (or centres) will support the additional dwellings. Further centres are also
proposed to support major development proposals at the Waterfront and at Peel Hall. However, the
purpose of this Update is to review retail and leisure need on an authority-wide basis and the
particular needs arising from each of these proposals may require further consideration as detailed
development proposals come forward in these areas.
2.5 More generally, the emerging Local Plan confirms that the regeneration and evolution of the
Warrington town centre is a priority for the Council. The town centre and the Inner Warrington area
is the Council’s main development focus, in accordance with the priorities identified in the Town
Centre Supplementary Planning Document (SPD), adopted in June 2021.
Principal Findings of 2015 Retail and Leisure Study
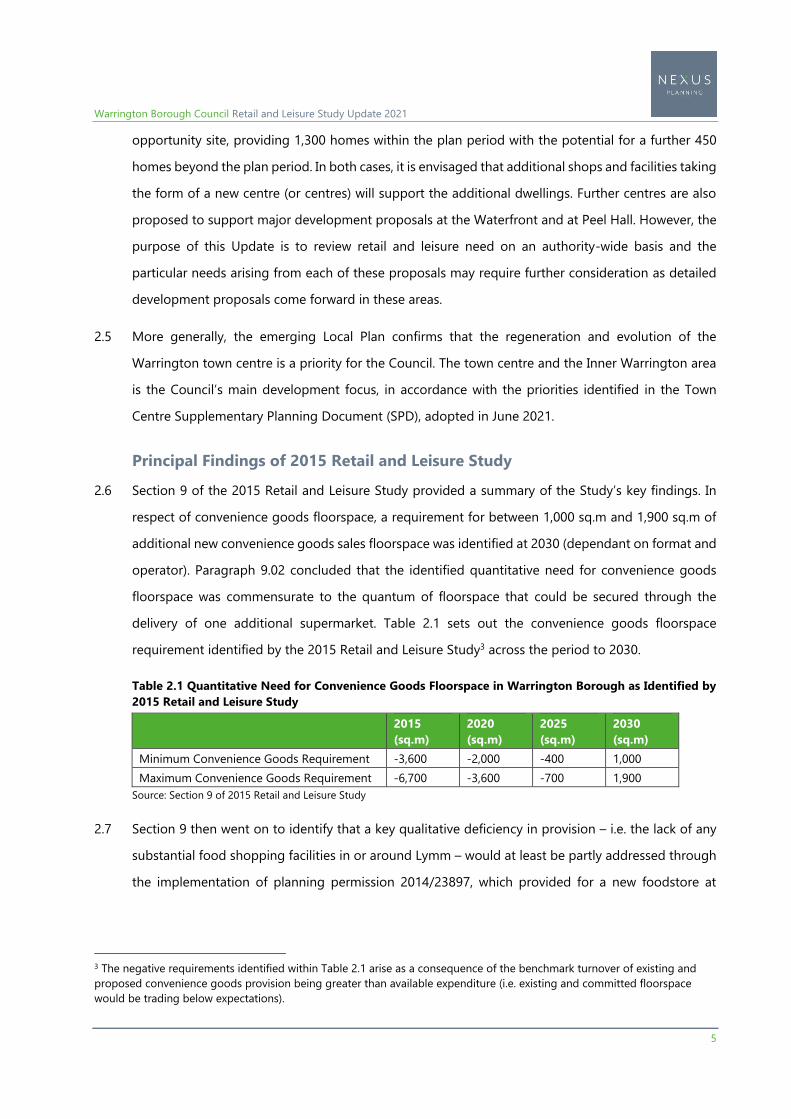
2.6 Section 9 of the 2015 Retail and Leisure Study provided a summary of the Study’s key findings. In
respect of convenience goods floorspace, a requirement for between 1,000 sq.m and 1,900 sq.m of
additional new convenience goods sales floorspace was identified at 2030 (dependant on format and
operator). Paragraph 9.02 concluded that the identified quantitative need for convenience goods
floorspace was commensurate to the quantum of floorspace that could be secured through the
delivery of one additional supermarket. Table 2.1 sets out the convenience goods floorspace
requirement identified by the 2015 Retail and Leisure Study3 across the period to 2030.
Table 2.1 Quantitative Need for Convenience Goods Floorspace in Warrington Borough as Identified by
2015 Retail and Leisure Study
2015
(sq.m)
2020
(sq.m)
2025
(sq.m)
2030
(sq.m)
Minimum Convenience Goods Requirement -3,600 -2,000 -400 1,000
Maximum Convenience Goods Requirement -6,700 -3,600 -700 1,900
Source: Section 9 of 2015 Retail and Leisure Study
2.7 Section 9 then went on to identify that a key qualitative deficiency in provision – i.e. the lack of any
substantial food shopping facilities in or around Lymm – would at least be partly addressed through
the implementation of planning permission 2014/23897, which provided for a new foodstore at
3 The negative requirements identified within Table 2.1 arise as a consequence of the benchmark turnover of existing and
proposed convenience goods provision being greater than available expenditure (i.e. existing and committed floorspace
would be trading below expectations).
Warrington Borough Council Retail and Leisure Study Update 2021
6
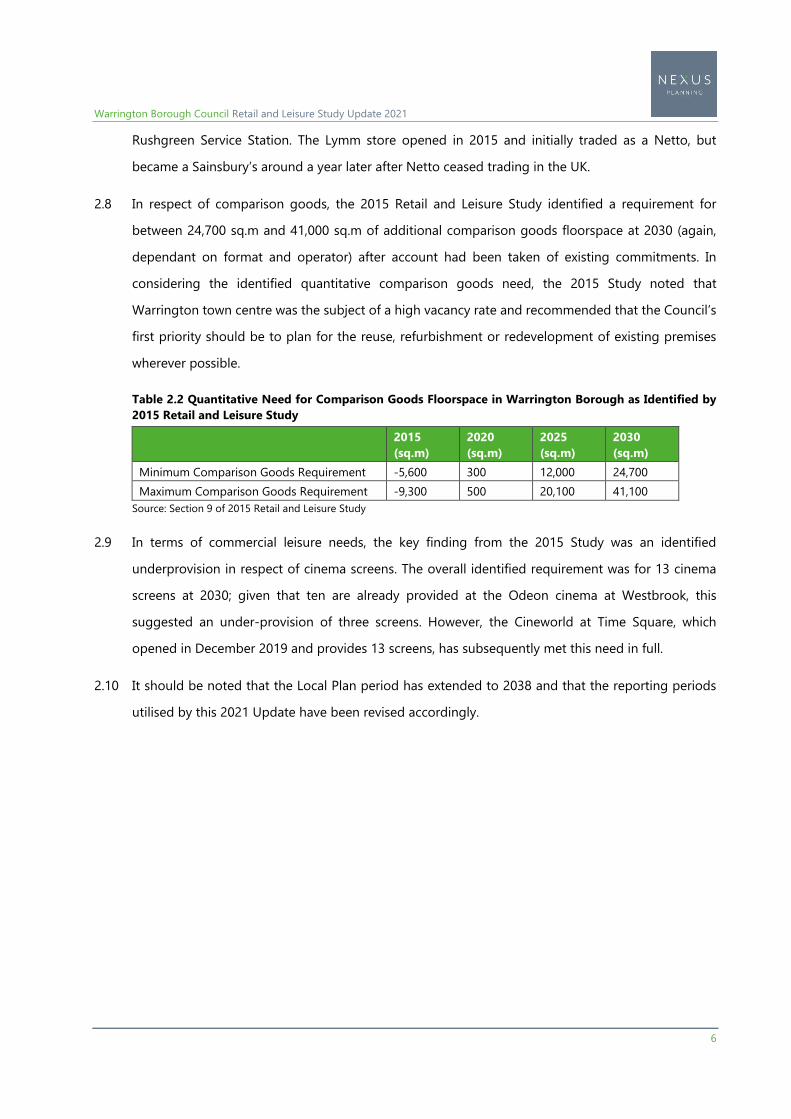
Rushgreen Service Station. The Lymm store opened in 2015 and initially traded as a Netto, but
became a Sainsbury’s around a year later after Netto ceased trading in the UK.
2.8 In respect of comparison goods, the 2015 Retail and Leisure Study identified a requirement for
between 24,700 sq.m and 41,000 sq.m of additional comparison goods floorspace at 2030 (again,
dependant on format and operator) after account had been taken of existing commitments. In
considering the identified quantitative comparison goods need, the 2015 Study noted that
Warrington town centre was the subject of a high vacancy rate and recommended that the Council’s
first priority should be to plan for the reuse, refurbishment or redevelopment of existing premises
wherever possible.
Table 2.2 Quantitative Need for Comparison Goods Floorspace in Warrington Borough as Identified by
2015 Retail and Leisure Study
2015
(sq.m)
2020
(sq.m)
2025
(sq.m)
2030
(sq.m)
Minimum Comparison Goods Requirement -5,600 300 12,000 24,700
Maximum Comparison Goods Requirement -9,300 500 20,100 41,100
Source: Section 9 of 2015 Retail and Leisure Study
2.9 In terms of commercial leisure needs, the key finding from the 2015 Study was an identified
underprovision in respect of cinema screens. The overall identified requirement was for 13 cinema
screens at 2030; given that ten are already provided at the Odeon cinema at Westbrook, this
suggested an under-provision of three screens. However, the Cineworld at Time Square, which
opened in December 2019 and provides 13 screens, has subsequently met this need in full.
2.10 It should be noted that the Local Plan period has extended to 2038 and that the reporting periods
utilised by this 2021 Update have been revised accordingly.
Warrington Borough Council Retail and Leisure Study Update 2021
7
3 Study Area, Population and Expenditure
Study Area
3.1 In November 2014, a survey of 1,000 household was undertaken by NEMS within the defined Study
Area in order to ascertain where residents go to undertake a range of shopping and leisure activities.
The Study Area was drawn by WYG Planning, as author of the original Study, to reflect the area that
looks to facilities within Warrington Borough to help meet their retail and leisure needs. A plan of
Study Area is provided as Appendix 1.
3.2 We confirm that we consider the Study Area to be sufficiently extensive and that the survey is worded
in an appropriate manner, such that it provides an accurate representation of shopping and leisure
behaviour. Whilst the survey was undertaken more than six years ago, we do not believe that any
changes in provision ‘on the ground’ in Warrington and its surrounding area are of sufficient
magnitude that they will likely result in markedly different patterns of behaviour. As such, we believe
that the 2014 survey is able to form an appropriate basis upon which to undertake this Update4.
Furthermore, as stated at paragraph 1.3 of this report, the Council believes that a new survey would
be of limited value at this time due to recent trading restrictions associated with the Covid-19
pandemic and the implications that this may have on shopping patterns and habits. The household
survey questions and full, tabulated responses are provided at Appendix 2.
3.3 The defined Study Area has been broken down into ten different survey zones in accordance with
postcode sectors in order to gain a comprehensive understanding of respondents’ behaviour. The
zones are representative of geographic areas that may accommodate broadly similar patterns of
shopping behaviour. The below Table 3.1 confirms the postcode sectors which define each of the
zones.
4 Appropriate account needs to be taken for retail floorspace that has been implemented subsequent to the undertaking of the
survey; and we explain our methodology in this regard at Section 4 of this report.
Warrington Borough Council Retail and Leisure Study Update 2021
8
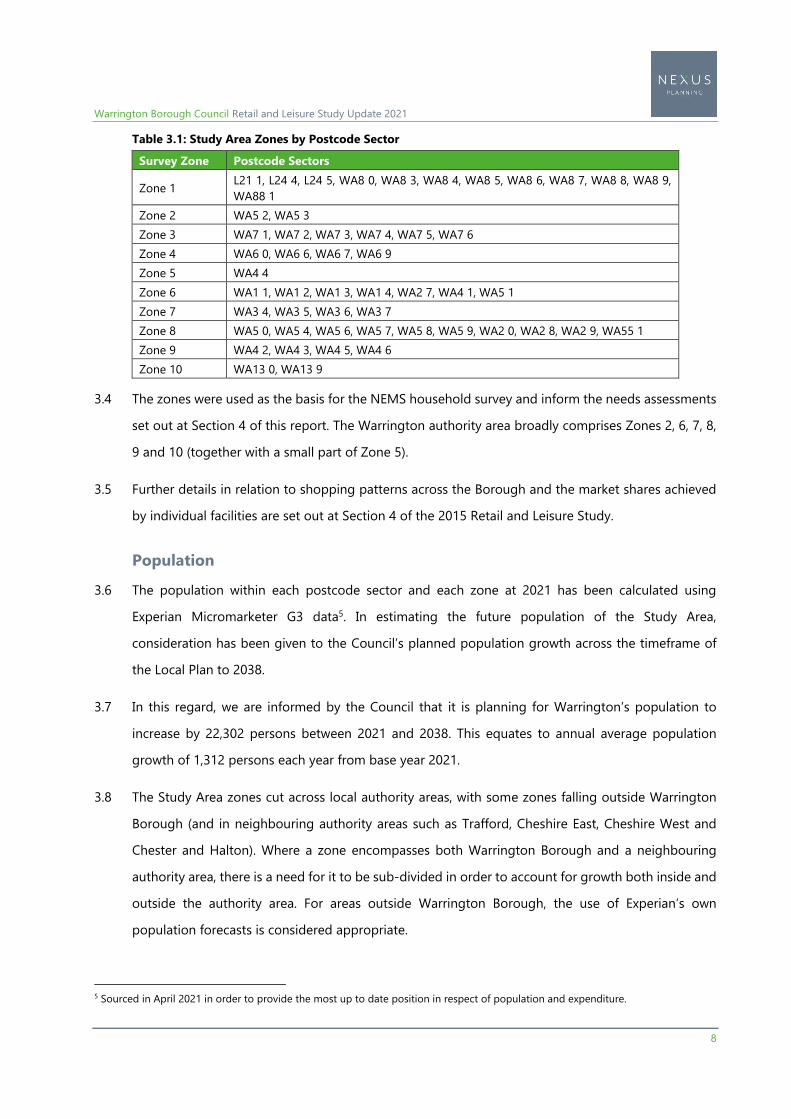
Table 3.1: Study Area Zones by Postcode Sector
Survey Zone Postcode Sectors
Zone 1 L21 1, L24 4, L24 5, WA8 0, WA8 3, WA8 4, WA8 5, WA8 6, WA8 7, WA8 8, WA8 9,
WA88 1
Zone 2 WA5 2, WA5 3
Zone 3 WA7 1, WA7 2, WA7 3, WA7 4, WA7 5, WA7 6
Zone 4 WA6 0, WA6 6, WA6 7, WA6 9
Zone 5 WA4 4
Zone 6 WA1 1, WA1 2, WA1 3, WA1 4, WA2 7, WA4 1, WA5 1
Zone 7 WA3 4, WA3 5, WA3 6, WA3 7
Zone 8 WA5 0, WA5 4, WA5 6, WA5 7, WA5 8, WA5 9, WA2 0, WA2 8, WA2 9, WA55 1
Zone 9 WA4 2, WA4 3, WA4 5, WA4 6
Zone 10 WA13 0, WA13 9
3.4 The zones were used as the basis for the NEMS household survey and inform the needs assessments
set out at Section 4 of this report. The Warrington authority area broadly comprises Zones 2, 6, 7, 8,
9 and 10 (together with a small part of Zone 5).
3.5 Further details in relation to shopping patterns across the Borough and the market shares achieved
by individual facilities are set out at Section 4 of the 2015 Retail and Leisure Study.
Population
3.6 The population within each postcode sector and each zone at 2021 has been calculated using
Experian Micromarketer G3 data5. In estimating the future population of the Study Area,
consideration has been given to the Council’s planned population growth across the timeframe of
the Local Plan to 2038.
3.7 In this regard, we are informed by the Council that it is planning for Warrington’s population to
increase by 22,302 persons between 2021 and 2038. This equates to annual average population
growth of 1,312 persons each year from base year 2021.
3.8 The Study Area zones cut across local authority areas, with some zones falling outside Warrington
Borough (and in neighbouring authority areas such as Trafford, Cheshire East, Cheshire West and
Chester and Halton). Where a zone encompasses both Warrington Borough and a neighbouring
authority area, there is a need for it to be sub-divided in order to account for growth both inside and
outside the authority area. For areas outside Warrington Borough, the use of Experian’s own
population forecasts is considered appropriate.
5 Sourced in April 2021 in order to provide the most up to date position in respect of population and expenditure.
Warrington Borough Council Retail and Leisure Study Update 2021
9
3.9 In order to apportion Warrington’s future population growth in an appropriate manner, the Council
has provided us with a summary schedule setting out the Council’s housing supply at 2021. We have
identified the location of each part of the housing supply and have therefore been able to estimate
the spatial distribution of growth on a zonal basis across the authority area to 2038. Our analysis of
the distribution of future housing growth includes all identified elements of the housing land supply,
including the proposed SEWUE, Fidders Ferry Power Station, Peel Hall, the Waterfront, Thelwall Heys
and development proposed in the settlements.
3.10 By noting the zonal location of each part of the Council’s housing land supply, we are able to identify
how future population growth will likely be delivered across the authority area in the period to 2038
and at a series of five year reporting periods6.
3.11 Outside of Warrington Borough, Experian’s more recent population forecasts have been used7.
Experian’s methodology in calculating projected change in population is based on a ‘demographic
component model’, which takes into consideration birth and death rates, and net migration.
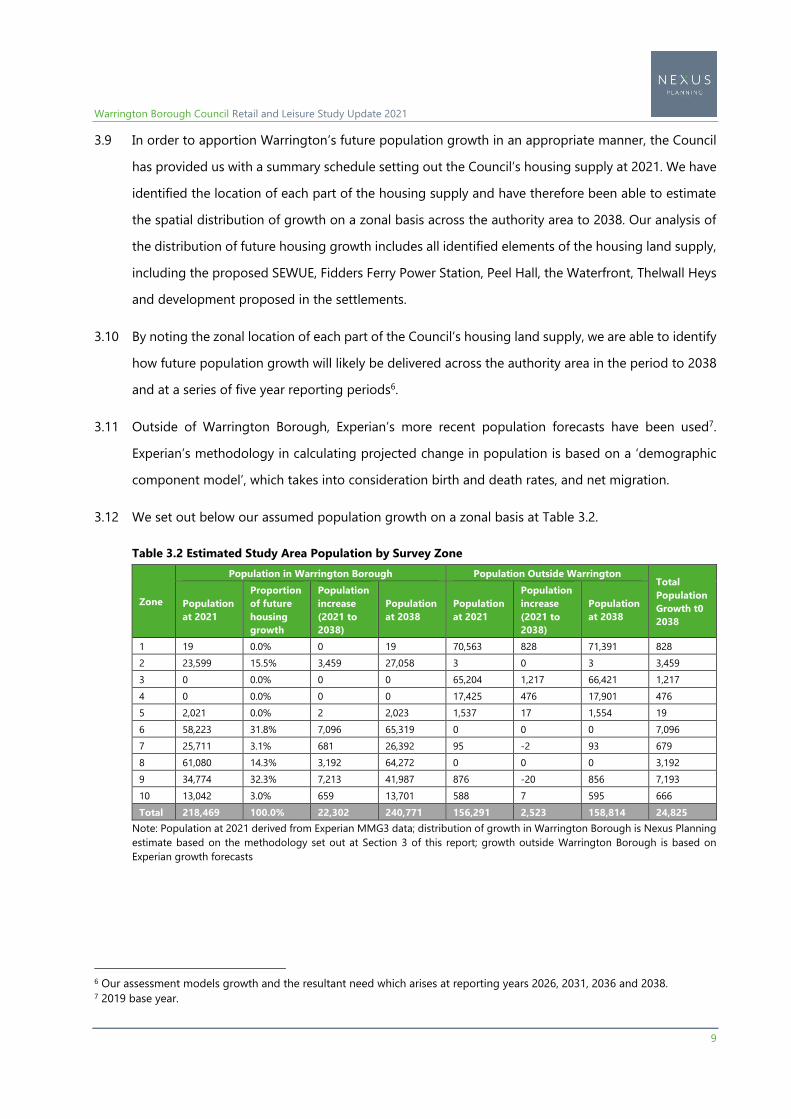
3.12 We set out below our assumed population growth on a zonal basis at Table 3.2.
Table 3.2 Estimated Study Area Population by Survey Zone
Zone
Population in Warrington Borough Population Outside Warrington Total
Population
Growth t0
2038
Population
at 2021
Proportion
of future
housing
growth
Population
increase
(2021 to
2038)
Population
at 2038
Population
at 2021
Population
increase
(2021 to
2038)
Population
at 2038
1 19 0.0% 0 19 70,563 828 71,391 828
2 23,599 15.5% 3,459 27,058 3 0 3 3,459
3 0 0.0% 0 0 65,204 1,217 66,421 1,217
4 0 0.0% 0 0 17,425 476 17,901 476
5 2,021 0.0% 2 2,023 1,537 17 1,554 19
6 58,223 31.8% 7,096 65,319 0 0 0 7,096
7 25,711 3.1% 681 26,392 95 -2 93 679
8 61,080 14.3% 3,192 64,272 0 0 0 3,192
9 34,774 32.3% 7,213 41,987 876 -20 856 7,193
10 13,042 3.0% 659 13,701 588 7 595 666
Total 218,469 100.0% 22,302 240,771 156,291 2,523 158,814 24,825
Note: Population at 2021 derived from Experian MMG3 data; distribution of growth in Warrington Borough is Nexus Planning
estimate based on the methodology set out at Section 3 of this report; growth outside Warrington Borough is based on
Experian growth forecasts
6 Our assessment models growth and the resultant need which arises at reporting years 2026, 2031, 2036 and 2038. 7 2019 base year.
Warrington Borough Council Retail and Leisure Study Update 2021
10
3.13 The above Table 3.2 indicates that the majority of future growth in Warrington Borough is to be
located centrally, with delivery particularly high around Warrington town centre (within Zone 6) and
the part of the Borough that lies to the south of the Manchester Ship Canal (within Zone 9).
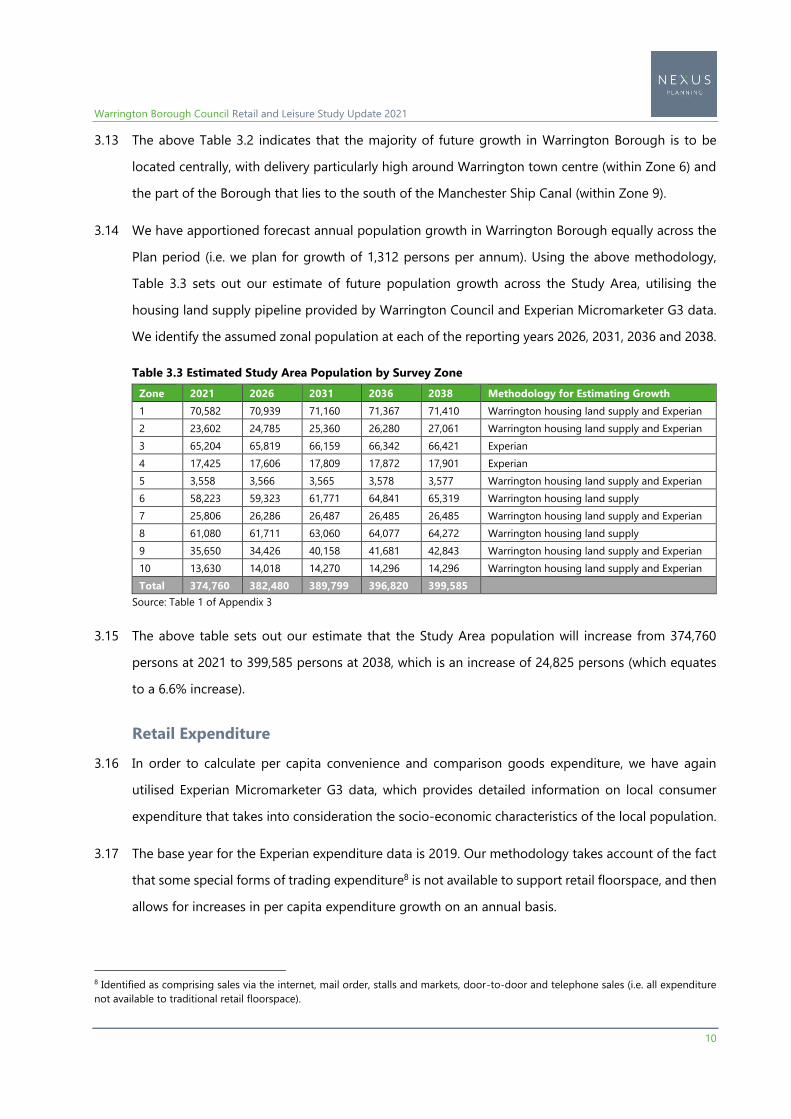
3.14 We have apportioned forecast annual population growth in Warrington Borough equally across the
Plan period (i.e. we plan for growth of 1,312 persons per annum). Using the above methodology,
Table 3.3 sets out our estimate of future population growth across the Study Area, utilising the
housing land supply pipeline provided by Warrington Council and Experian Micromarketer G3 data.
We identify the assumed zonal population at each of the reporting years 2026, 2031, 2036 and 2038.
Table 3.3 Estimated Study Area Population by Survey Zone
Zone 2021 2026 2031 2036 2038 Methodology for Estimating Growth
1 70,582 70,939 71,160 71,367 71,410 Warrington housing land supply and Experian
2 23,602 24,785 25,360 26,280 27,061 Warrington housing land supply and Experian
3 65,204 65,819 66,159 66,342 66,421 Experian
4 17,425 17,606 17,809 17,872 17,901 Experian
5 3,558 3,566 3,565 3,578 3,577 Warrington housing land supply and Experian
6 58,223 59,323 61,771 64,841 65,319 Warrington housing land supply
7 25,806 26,286 26,487 26,485 26,485 Warrington housing land supply and Experian
8 61,080 61,711 63,060 64,077 64,272 Warrington housing land supply
9 35,650 34,426 40,158 41,681 42,843 Warrington housing land supply and Experian
10 13,630 14,018 14,270 14,296 14,296 Warrington housing land supply and Experian
Total 374,760 382,480 389,799 396,820 399,585
Source: Table 1 of Appendix 3
3.15 The above table sets out our estimate that the Study Area population will increase from 374,760
persons at 2021 to 399,585 persons at 2038, which is an increase of 24,825 persons (which equates
to a 6.6% increase).
Retail Expenditure
3.16 In order to calculate per capita convenience and comparison goods expenditure, we have again
utilised Experian Micromarketer G3 data, which provides detailed information on local consumer
expenditure that takes into consideration the socio-economic characteristics of the local population.
3.17 The base year for the Experian expenditure data is 2019. Our methodology takes account of the fact
that some special forms of trading expenditure8 is not available to support retail floorspace, and then
allows for increases in per capita expenditure growth on an annual basis.
8 Identified as comprising sales via the internet, mail order, stalls and markets, door-to-door and telephone sales (i.e. all expenditure
not available to traditional retail floorspace).
Warrington Borough Council Retail and Leisure Study Update 2021
11
3.18 Figure 5 of Appendix 3 of Experian Retail Planner Briefing Note 18 (‘ERPBN18’) (October 2020)
provides forecasts in respect of the proportion of convenience and comparison goods expenditure
that will be committed through special forms of trading both now and in the future. We have ‘stripped
out’ any survey responses which relate to expenditure committed via special forms of trading from
the dataset and have instead made an allowance derived from Experian’s recommendations (which
we consider to be the most appropriate means by which to account for such expenditure).
3.19 In considering special forms of trading, it should be noted that many products which are ordered
online are actually sourced from a store’s shelves or stockroom (particularly in the case of
convenience goods). As such, expenditure committed in this manner acts to sustain shops and can
be considered ‘available’ to support floorspace within the Study Area. Accordingly, in order not to
overstate the influence of special forms of trading on retailers, our methodology utilises Experian’s
‘adjusted’ allowance for special forms of trading (which is provided at Figure 5 of ERPBN18). This
allowance indicates that 4.2% of convenience goods expenditure and 17.5% of comparison goods
expenditure is ‘lost’ from shops at base year 2019 through special forms of trading purchases.
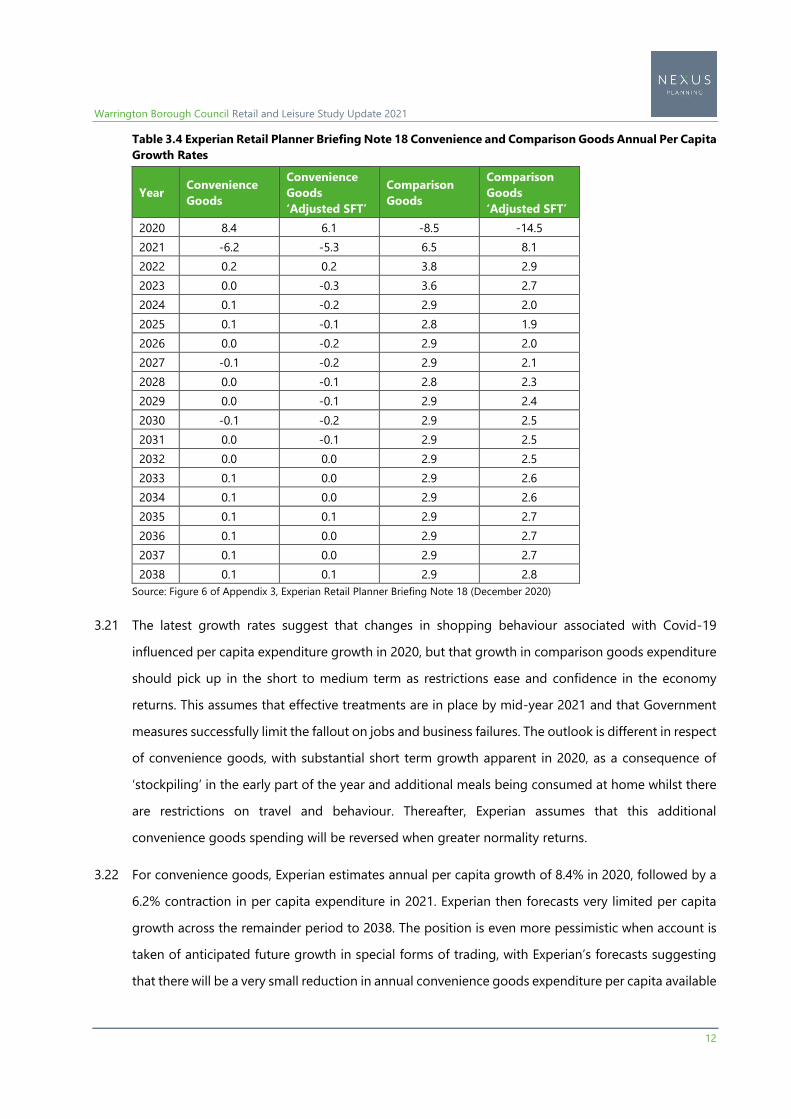
3.20 Having made allowance for special forms of trading, we then take account of projected changes in
expenditure in accordance with the recommendations provided by Figure 6 of Appendix 3 of
ERPBN18. Experian provides overall growth rates and ‘adjusted’ rates, which account for any
additional increases in expenditure lost to special forms of trading. We set out Experian’s expenditure
growth estimates below in Table 3.4.
Warrington Borough Council Retail and Leisure Study Update 2021
12
Table 3.4 Experian Retail Planner Briefing Note 18 Convenience and Comparison Goods Annual Per Capita
Growth Rates
Year Convenience
Goods
Convenience
Goods
‘Adjusted SFT’
Comparison
Goods
Comparison
Goods
‘Adjusted SFT’
2020 8.4 6.1 -8.5 -14.5
2021 -6.2 -5.3 6.5 8.1
2022 0.2 0.2 3.8 2.9
2023 0.0 -0.3 3.6 2.7
2024 0.1 -0.2 2.9 2.0
2025 0.1 -0.1 2.8 1.9
2026 0.0 -0.2 2.9 2.0
2027 -0.1 -0.2 2.9 2.1
2028 0.0 -0.1 2.8 2.3
2029 0.0 -0.1 2.9 2.4
2030 -0.1 -0.2 2.9 2.5
2031 0.0 -0.1 2.9 2.5
2032 0.0 0.0 2.9 2.5
2033 0.1 0.0 2.9 2.6
2034 0.1 0.0 2.9 2.6
2035 0.1 0.1 2.9 2.7
2036 0.1 0.0 2.9 2.7
2037 0.1 0.0 2.9 2.7
2038 0.1 0.1 2.9 2.8
Source: Figure 6 of Appendix 3, Experian Retail Planner Briefing Note 18 (December 2020)
3.21 The latest growth rates suggest that changes in shopping behaviour associated with Covid-19
influenced per capita expenditure growth in 2020, but that growth in comparison goods expenditure
should pick up in the short to medium term as restrictions ease and confidence in the economy
returns. This assumes that effective treatments are in place by mid-year 2021 and that Government
measures successfully limit the fallout on jobs and business failures. The outlook is different in respect
of convenience goods, with substantial short term growth apparent in 2020, as a consequence of
‘stockpiling’ in the early part of the year and additional meals being consumed at home whilst there
are restrictions on travel and behaviour. Thereafter, Experian assumes that this additional
convenience goods spending will be reversed when greater normality returns.
3.22 For convenience goods, Experian estimates annual per capita growth of 8.4% in 2020, followed by a
6.2% contraction in per capita expenditure in 2021. Experian then forecasts very limited per capita
growth across the remainder period to 2038. The position is even more pessimistic when account is
taken of anticipated future growth in special forms of trading, with Experian’s forecasts suggesting
that there will be a very small reduction in annual convenience goods expenditure per capita available
Warrington Borough Council Retail and Leisure Study Update 2021
13
to stores across every year between 2023 and 2031, and only negligible levels of growth apparent
thereafter to 2038. Overall, it is evident that per capita convenience goods expenditure is forecast to
remain very similar across the entire period 2020 to 2038.
3.23 The position in respect of comparison goods expenditure is more positive. Experian forecasts that
per capita comparison goods expenditure growth will recover from a decline of 8.5% at 2020 to grow
by 6.5% in 2021 and 3.8% in 2022, thereafter remaining at 2.8% or 2.9% per annum in the period
from 2023 to 2038. Experian’s forecast suggests that there will be relatively healthy growth in
comparison goods even after accounting for expenditure lost to special forms of trading.
3.24 Growth in expenditure forecasts in the longer term (beyond the next ten years) should be treated
with caution given the inherent uncertainties associated with predicting the performance of the
economy over time (particularly in the current economic climate). As such, quantitative capacity
assessments of this nature should be reviewed on a regular basis in order to ensure that forecasts
over the medium and longer term reflect changing circumstances.
3.25 In this regard, we note that paragraph 85 of the revised NPPF9 requires local planning authorities to
consider likely needs ‘…looking at least ten years ahead’, which differs from the previous requirement
to meet needs across the entire plan period. We believe that this change directly reflects current
economic conditions and changes in the retail sector in recent years.
3.26 By applying Experian’s recommendations in respect of special forms of trading and expenditure
growth, we are able to produce expenditure estimates for each survey zone and the Study Area as a
whole at 2021, 2026, 2031, 2036 and 2038.
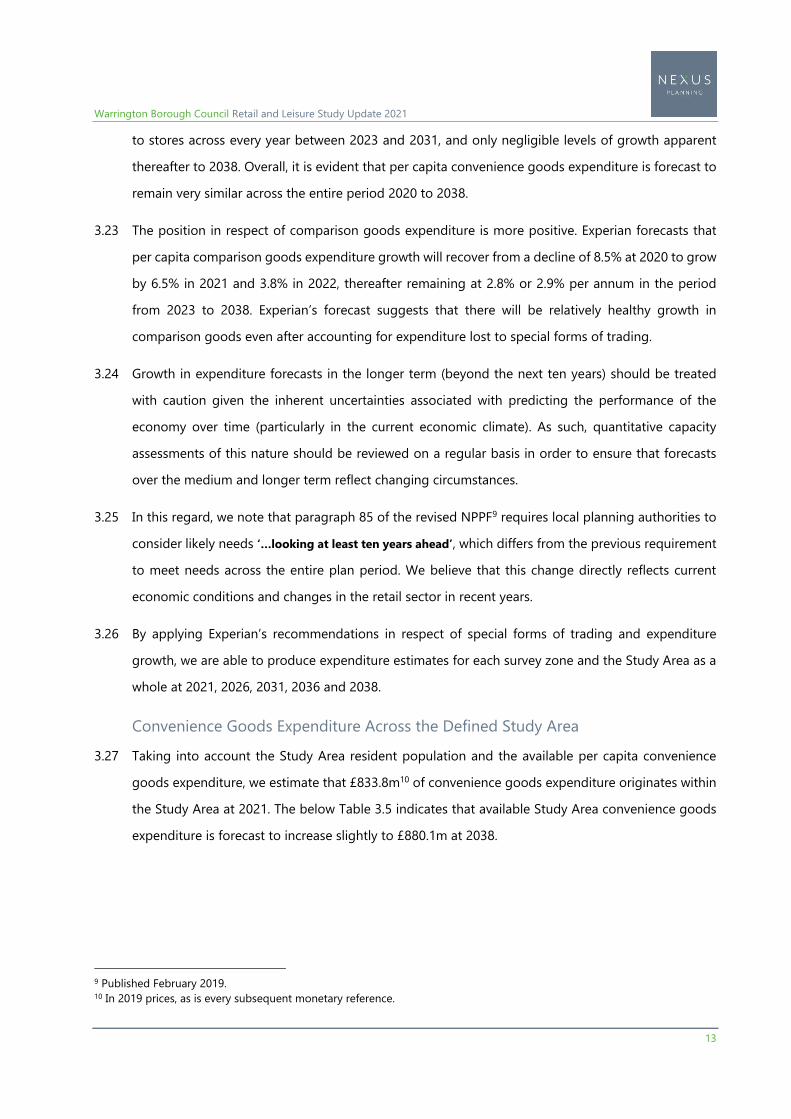
Convenience Goods Expenditure Across the Defined Study Area
3.27 Taking into account the Study Area resident population and the available per capita convenience
goods expenditure, we estimate that £833.8m10 of convenience goods expenditure originates within
the Study Area at 2021. The below Table 3.5 indicates that available Study Area convenience goods
expenditure is forecast to increase slightly to £880.1m at 2038.
9 Published February 2019. 10 In 2019 prices, as is every subsequent monetary reference.
Warrington Borough Council Retail and Leisure Study Update 2021
14
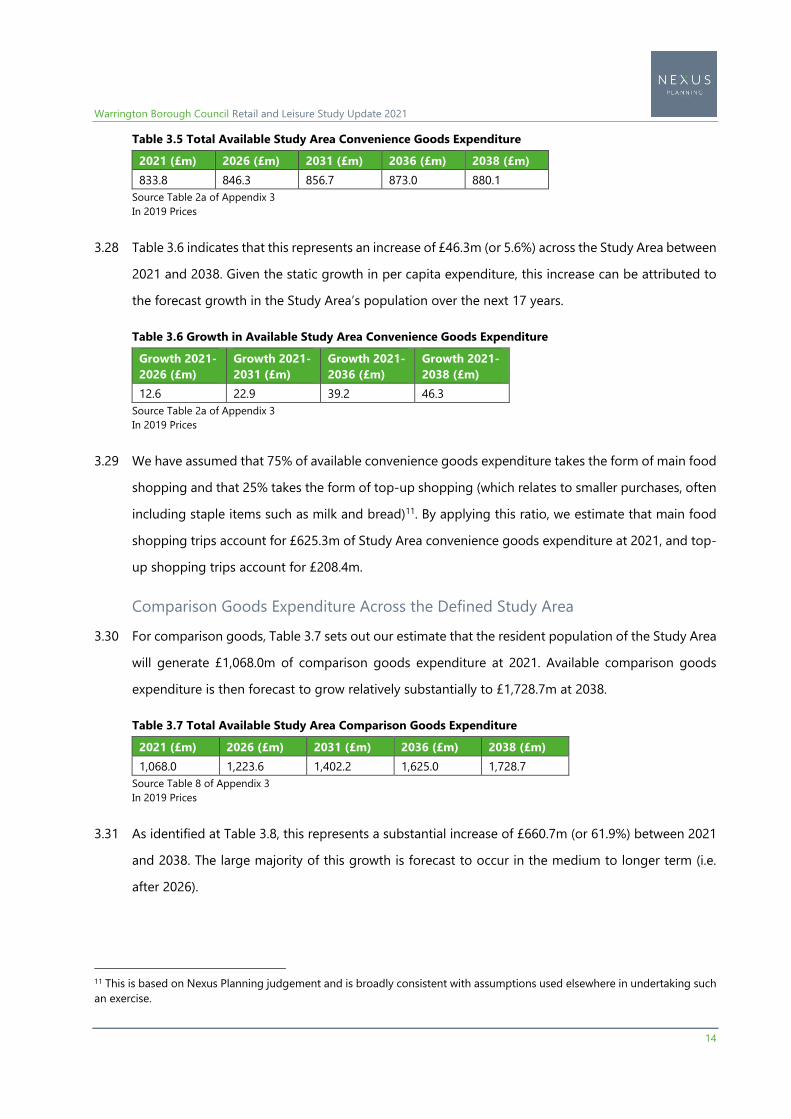
Table 3.5 Total Available Study Area Convenience Goods Expenditure
2021 (£m) 2026 (£m) 2031 (£m) 2036 (£m) 2038 (£m)
833.8 846.3 856.7 873.0 880.1
Source Table 2a of Appendix 3
In 2019 Prices
3.28 Table 3.6 indicates that this represents an increase of £46.3m (or 5.6%) across the Study Area between
2021 and 2038. Given the static growth in per capita expenditure, this increase can be attributed to
the forecast growth in the Study Area’s population over the next 17 years.
Table 3.6 Growth in Available Study Area Convenience Goods Expenditure
Growth 2021-
2026 (£m)
Growth 2021-
2031 (£m)
Growth 2021-
2036 (£m)
Growth 2021-
2038 (£m)
12.6 22.9 39.2 46.3
Source Table 2a of Appendix 3
In 2019 Prices
3.29 We have assumed that 75% of available convenience goods expenditure takes the form of main food
shopping and that 25% takes the form of top-up shopping (which relates to smaller purchases, often
including staple items such as milk and bread)11. By applying this ratio, we estimate that main food
shopping trips account for £625.3m of Study Area convenience goods expenditure at 2021, and top-
up shopping trips account for £208.4m.
Comparison Goods Expenditure Across the Defined Study Area
3.30 For comparison goods, Table 3.7 sets out our estimate that the resident population of the Study Area
will generate £1,068.0m of comparison goods expenditure at 2021. Available comparison goods
expenditure is then forecast to grow relatively substantially to £1,728.7m at 2038.
Table 3.7 Total Available Study Area Comparison Goods Expenditure
2021 (£m) 2026 (£m) 2031 (£m) 2036 (£m) 2038 (£m)
1,068.0 1,223.6 1,402.2 1,625.0 1,728.7
Source Table 8 of Appendix 3
In 2019 Prices
3.31 As identified at Table 3.8, this represents a substantial increase of £660.7m (or 61.9%) between 2021
and 2038. The large majority of this growth is forecast to occur in the medium to longer term (i.e.
after 2026).
11 This is based on Nexus Planning judgement and is broadly consistent with assumptions used elsewhere in undertaking such
an exercise.
Warrington Borough Council Retail and Leisure Study Update 2021
15
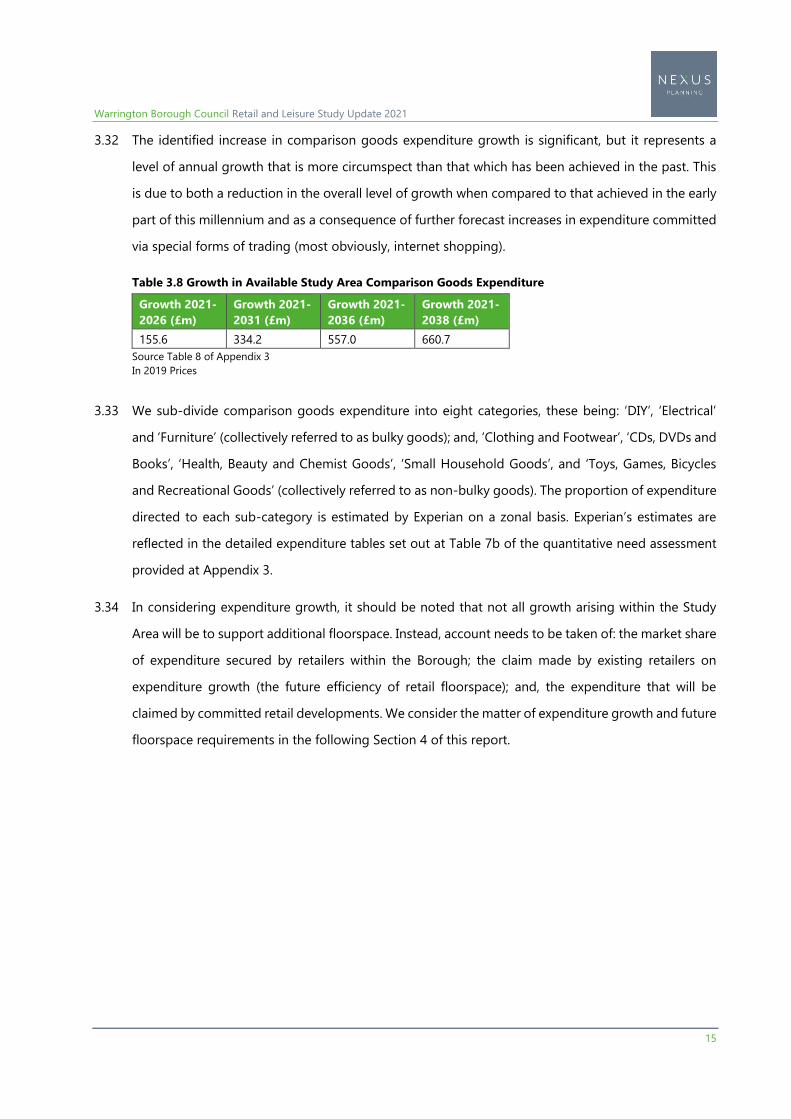
3.32 The identified increase in comparison goods expenditure growth is significant, but it represents a
level of annual growth that is more circumspect than that which has been achieved in the past. This
is due to both a reduction in the overall level of growth when compared to that achieved in the early
part of this millennium and as a consequence of further forecast increases in expenditure committed
via special forms of trading (most obviously, internet shopping).
Table 3.8 Growth in Available Study Area Comparison Goods Expenditure
Growth 2021-
2026 (£m)
Growth 2021-
2031 (£m)
Growth 2021-
2036 (£m)
Growth 2021-
2038 (£m)
155.6 334.2 557.0 660.7
Source Table 8 of Appendix 3
In 2019 Prices
3.33 We sub-divide comparison goods expenditure into eight categories, these being: ‘DIY’, ‘Electrical’
and ‘Furniture’ (collectively referred to as bulky goods); and, ‘Clothing and Footwear’, ‘CDs, DVDs and
Books’, ‘Health, Beauty and Chemist Goods’, ‘Small Household Goods’, and ‘Toys, Games, Bicycles
and Recreational Goods’ (collectively referred to as non-bulky goods). The proportion of expenditure
directed to each sub-category is estimated by Experian on a zonal basis. Experian’s estimates are
reflected in the detailed expenditure tables set out at Table 7b of the quantitative need assessment
provided at Appendix 3.
3.34 In considering expenditure growth, it should be noted that not all growth arising within the Study
Area will be to support additional floorspace. Instead, account needs to be taken of: the market share
of expenditure secured by retailers within the Borough; the claim made by existing retailers on
expenditure growth (the future efficiency of retail floorspace); and, the expenditure that will be
claimed by committed retail developments. We consider the matter of expenditure growth and future
floorspace requirements in the following Section 4 of this report.
Warrington Borough Council Retail and Leisure Study Update 2021
16
4 Updated Assessment of Quantitative Retail Need
4.1 Our detailed retail capacity tables set out our step-by-step approach to estimating quantitative retail
need and are provided at Appendix 3. A summary of our methodological approach, together with
our findings, is provided below.
General Approach to Estimating Need
4.2 Retail capacity modelling follows the basic principle that: Available Expenditure minus Expected
Turnover of Existing and Committed Floorspace equals Expenditure Surplus or Deficit. We summarise
the key considerations relating to each component of the equation below.
Available Expenditure
4.3 As we set out in Section 5 of this report, available expenditure within a zone is calculated by
multiplying the population at a given reporting year by the estimated per capita expenditure. The
available expenditure takes into consideration:
estimated population growth;
forecast increases in per capita expenditure; and
forecast increases in special forms of trading.
Turnover of Existing and Proposed Retail Operations
4.4 The turnover relates to the expenditure claimed by existing retailers (and by future retail operations
supported by extant commitments) in order to ensure that they trade viably. For convenience goods
retailers, the expected ‘benchmark’ turnover of existing convenience goods facilities in calculated
with reference to GlobalData Convenience and Comparison Goods Sales Densities of Major Grocers
2020 and Mintel Retail Rankings 2018 data12.
Surplus/Deficit
4.5 The expenditure surplus (or deficit) is calculated by subtracting the turnover of existing and
committed floorspace from the available expenditure in the Warrington authority area. A surplus
figure effectively represents an underprovision of retail facilities within the Borough (which may
12 These datasets provide independent analysis of key grocery retailers’ declared turnover and the overall floorspace in
their portfolio in order to calculate national average sales densities.
Warrington Borough Council Retail and Leisure Study Update 2021
17
indicate that additional floorspace could be supported), whereas a deficit would suggest a
quantitative overprovision of retail floorspace.
4.6 Although a surplus is presented as a monetary figure, it can be converted to a floorspace requirement
through the application of an appropriate sales density. In this regard, the floorspace requirement
will vary according to operator and the likely sales density they could achieve. For example, in the
case of comparison goods, non-bulky goods retailers tend to achieve higher sales densities than
bulky goods retailers. However, within the bulky goods sector itself there is significant variation, with
electrical retailers typically having higher sales densities than DIY or furniture retailers.
4.7 The turnover of destinations is generally considered with reference to retailers’ net sales areas and
we can confirm that all of the following floorspace figures relate to net sales.
Capacity for Future Convenience Goods Floorspace
4.8 In order to identify the likely need for additional convenience goods floorspace in Warrington
Borough, it is first necessary to consider the performance of the current provision. In this respect,
Warrington is an urbanised Borough, which already accommodates a variety of foodstore operators.
As such, we believe that many of the food shopping trips which originate within the Study Area, but
are directed to facilities outside of Warrington Borough, occur principally because the trip is
convenient (i.e. close to home or work), rather than due to any significant deficiencies in Warrington’s
offer. Consideration of convenience goods shopping patterns on a zonal basis does not suggest that
there is a particular problem with shoppers driving outside the Borough to access convenience goods
shopping facilities. Given this, we believe that Warrington’s existing convenience goods market share
of 54.2% of Study Area convenience goods expenditure is broadly appropriate and is likely to be
sustained in the future.
4.9 Based on the existing market share, we estimate that £452.1m of convenience goods expenditure
which originates within the Study Area is claimed by retailers in Warrington at 2021. For each
convenience goods retail destination, consideration has been given as to whether any of its turnover
is likely to be derived as ‘inflow’ from outside the Study Area. In this regard, we agree with the findings
of the 2015 Retail and Leisure Study and recognise that the Study Area is extensive in its scope, and
that it is therefore unlikely that residents of areas further afield (such as Liverpool, St Helens and
Wigan) will travel to Warrington in very significant numbers to undertake food shopping.
Nevertheless, we consider that some convenience goods retailers in the town centre and larger
Warrington Borough Council Retail and Leisure Study Update 2021
18
foodstore within the Borough will benefit from some trade arising from visitors and commuters who
reside outside the Study Area.
4.10 In line with the approach adopted in the 2015 Retail and Leisure Study, we believe that central and
larger foodstores would be able to secure around 5% of their turnover from outside of the Study
Area. In addition, some facilities at the periphery of the Study Area are likely to benefit from a greater
level of inflow. Such facilities are generally of a small scale (local convenience grocery stores or farm
shops) and have limited bearing on the results of the assessment as a whole. In total, assumed inflow
accounts for £20.3m of convenience goods expenditure at 2021, which equates to 4.3% of the overall
turnover of Warrington’s convenience goods floorspace. This takes the total turnover of such facilities
to £472.5m at 2021. We set out our assumptions in respect of inflow at Table 5 of Appendix 3.
4.11 For each convenience goods retail destination, the identified survey derived turnover is compared to
its expected benchmark performance (which is estimated with reference to company average sales
densities and the estimated net sales areas of individual shops). Our assessment assumes a ‘goods
based’ approach, which disaggregates expenditure by sector, as it is important to recognise that
major foodstore operators generally also sell some comparison goods, such as clothing, household
goods, books and CDs. To account for this, the typical split between convenience and comparison
goods provision for each operator has been identified13 and this multiplier has been applied to the
estimated net floorspace14 of each foodstore. This provides an indication of the likely floorspace
dedicated to the sale of convenience goods at each store and provides for an accurate estimation of
convenience goods benchmark turnover.
4.12 The calculation of the estimated benchmark turnover of individual stores allows an assessment to be
made in respect of individual retailers’ trading performance and whether (on an aggregated basis)
surplus expenditure exists to support additional floorspace. For smaller shops (where it is more
difficult to collate accurate floorspace and sales density data), we assume that stores are trading ‘in
equilibrium’ (i.e. the survey-derived turnover equates to the anticipated benchmark turnover).
4.13 Our assessment is summarised below at Table 4.1 and identifies that convenience goods floorspace
in Warrington Borough has an expected benchmark turnover of £470.3m at 2021, which is very
13 Generally sourced from GlobalData Convenience and Comparison Goods Sales Densities of Major Grocers 2020, except
where the data is not likely representative of how a store trades in practice. Detailed notes in respect of our approach in
calculating net convenience goods sales areas are provided at Table 5 of Appendix 3. 14 It has been assumed that the gross and net sales areas identified by the 2015 Retail and Leisure Study are generally
accurate (the exception is the Asda at Cockhedge Way, where the previously identified net sales area appears too low and
we have instead based our estimate on VOA data).
Warrington Borough Council Retail and Leisure Study Update 2021
19
slightly below the estimated survey derived turnover of £472.5m. As such, taken collectively,
convenience goods floorspace is ‘overtrading’ by just £2.2m.
4.14 In order to appraise the future need for additional convenience goods floorspace, it is necessary to
consider how the performance of stores will be affected by forecast expenditure growth. Accordingly,
Table 4.1 also sets out the anticipated increases in expenditure that will be available to the Borough’s
convenience goods retailers, assuming that their current market share is maintained. We have
assumed that the benchmark turnover of floorspace will change going forward in accordance with
improvements in floorspace efficiency set out in ERPBN18.
4.15 Table 4.1 sets out our estimate that the convenience goods expenditure available to facilities in
Warrington Borough will be £479.6m at 2026, increasing to £485.5m at 2031, to £494.7 at 2036, and
then to £498.7m at 2038. When the forecast increase in available convenience goods expenditure is
compared to growth in the benchmark turnover of such floorspace, the identified estimated
convenience goods surplus equates to £24.7m at 2038.
Table 4.1 Quantitative Need for Convenience Goods Floorspace in Warrington Borough
Year Benchmark
Turnover (£m)
Available
Expenditure (£m)
Surplus Expenditure
(£m)
2021 470.3 472.5 2.2
2026 474.1 479.6 5.5
2031 474.1 485.5 11.4
2036 474.1 494.7 20.6
2038 474.1 498.7 24.7
Source Table 6a of Appendix 3
In 2019 Prices
4.16 When considering the above assessment, it should be noted that the survey only takes account of
retail venues that were trading at November 201415. As such, convenience goods floorspace
implemented subsequent to the undertaking of the survey needs to be accounted for in a similar
manner to retail commitments (i.e. the floorspace will have a claim on future convenience goods
expenditure and, as such, will partly extinguish any identified capacity). We summarise relevant
convenience goods commitments and estimate their likely turnover below at Table 4.2.
15 The Marks & Spencer at Sankey Street in Warrington town centre closed in July 2017 and we have allowed for this closure
in considering the expected benchmark turnover of existing convenience goods floorspace.
Warrington Borough Council Retail and Leisure Study Update 2021
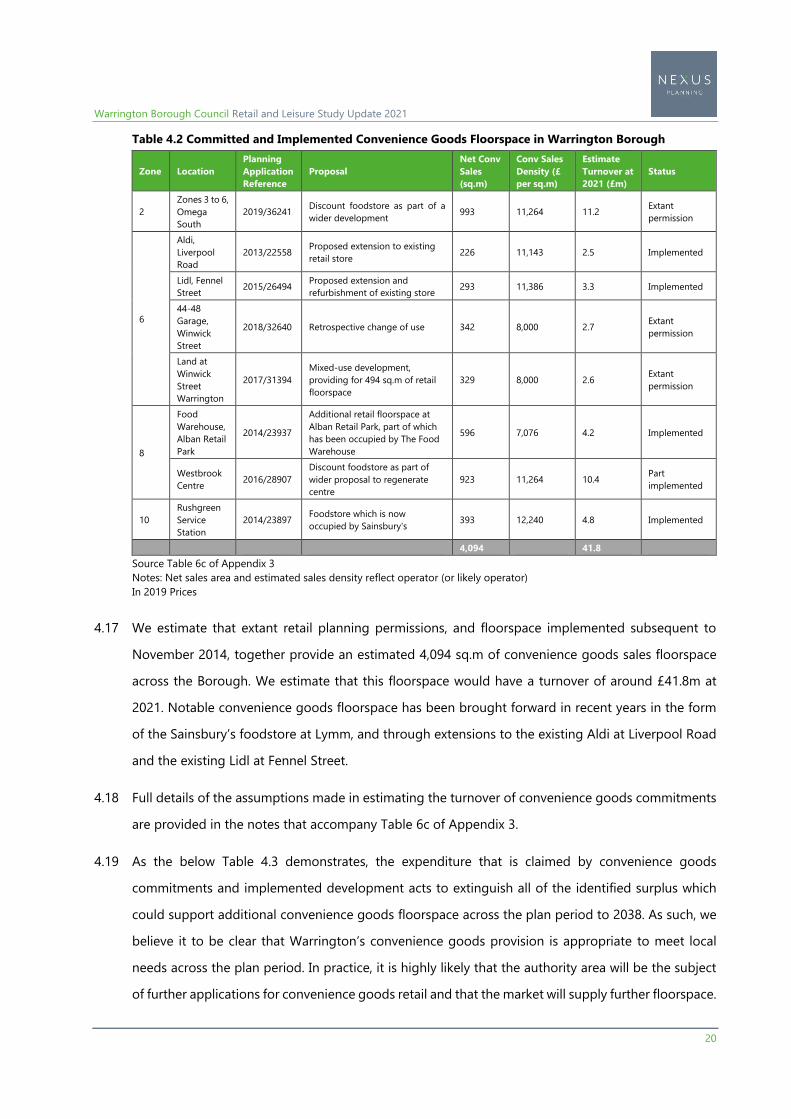
20
Table 4.2 Committed and Implemented Convenience Goods Floorspace in Warrington Borough
Zone Location
Planning
Application
Reference
Proposal
Net Conv
Sales
(sq.m)
Conv Sales
Density (£
per sq.m)
Estimate
Turnover at
2021 (£m)
Status
2
Zones 3 to 6,
Omega
South
2019/36241 Discount foodstore as part of a
wider development 993 11,264 11.2
Extant
permission
6
Aldi,
Liverpool
Road
2013/22558 Proposed extension to existing
retail store 226 11,143 2.5 Implemented
Lidl, Fennel
Street 2015/26494
Proposed extension and
refurbishment of existing store 293 11,386 3.3 Implemented
44-48
Garage,
Winwick
Street
2018/32640 Retrospective change of use 342 8,000 2.7 Extant
permission
Land at
Winwick
Street
Warrington
2017/31394
Mixed-use development,
providing for 494 sq.m of retail
floorspace
329 8,000 2.6 Extant
permission
8
Food
Warehouse,
Alban Retail
Park
2014/23937
Additional retail floorspace at
Alban Retail Park, part of which
has been occupied by The Food
Warehouse
596 7,076 4.2 Implemented
Westbrook
Centre 2016/28907
Discount foodstore as part of
wider proposal to regenerate
centre
923 11,264 10.4 Part
implemented
10
Rushgreen
Service
Station
2014/23897 Foodstore which is now
occupied by Sainsbury's 393 12,240 4.8 Implemented
4,094 41.8
Source Table 6c of Appendix 3
Notes: Net sales area and estimated sales density reflect operator (or likely operator)
In 2019 Prices
4.17 We estimate that extant retail planning permissions, and floorspace implemented subsequent to
November 2014, together provide an estimated 4,094 sq.m of convenience goods sales floorspace
across the Borough. We estimate that this floorspace would have a turnover of around £41.8m at
2021. Notable convenience goods floorspace has been brought forward in recent years in the form
of the Sainsbury’s foodstore at Lymm, and through extensions to the existing Aldi at Liverpool Road
and the existing Lidl at Fennel Street.
4.18 Full details of the assumptions made in estimating the turnover of convenience goods commitments
are provided in the notes that accompany Table 6c of Appendix 3.
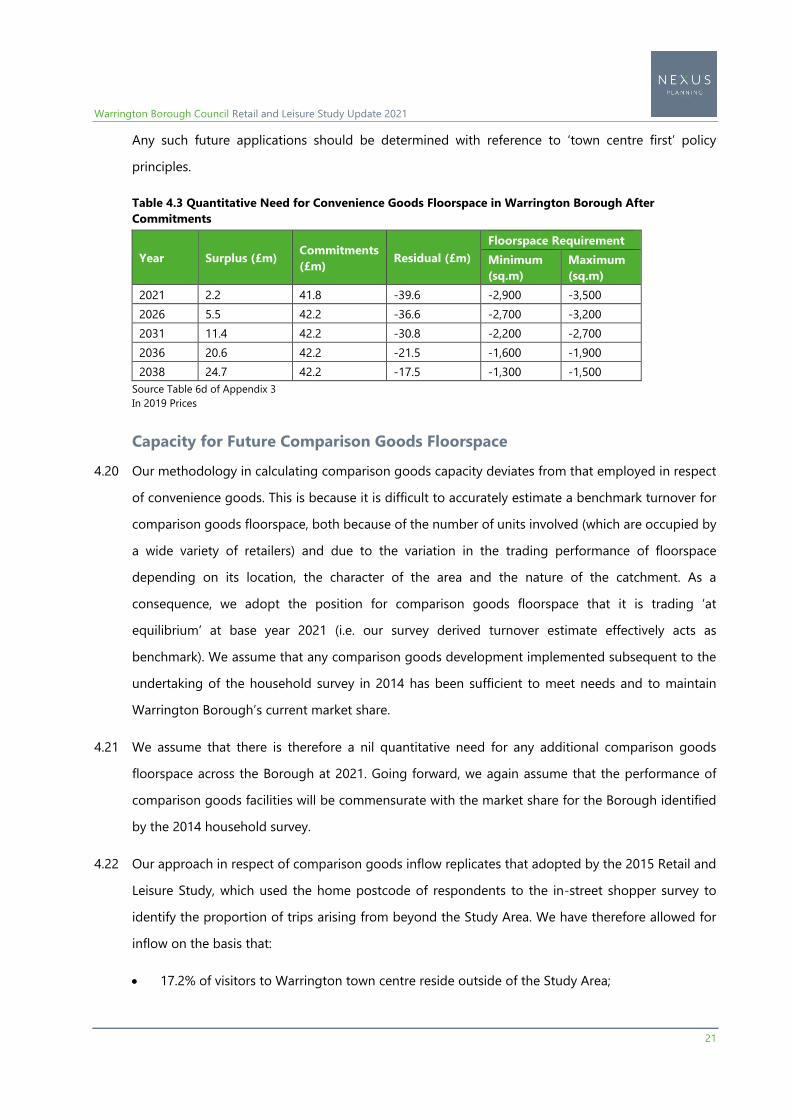
4.19 As the below Table 4.3 demonstrates, the expenditure that is claimed by convenience goods
commitments and implemented development acts to extinguish all of the identified surplus which
could support additional convenience goods floorspace across the plan period to 2038. As such, we
believe it to be clear that Warrington’s convenience goods provision is appropriate to meet local
needs across the plan period. In practice, it is highly likely that the authority area will be the subject
of further applications for convenience goods retail and that the market will supply further floorspace.
Warrington Borough Council Retail and Leisure Study Update 2021
21
Any such future applications should be determined with reference to ‘town centre first’ policy
principles.
Table 4.3 Quantitative Need for Convenience Goods Floorspace in Warrington Borough After
Commitments
Year Surplus (£m) Commitments
(£m) Residual (£m)
Floorspace Requirement
Minimum
(sq.m)
Maximum
(sq.m)
2021 2.2 41.8 -39.6 -2,900 -3,500
2026 5.5 42.2 -36.6 -2,700 -3,200
2031 11.4 42.2 -30.8 -2,200 -2,700
2036 20.6 42.2 -21.5 -1,600 -1,900
2038 24.7 42.2 -17.5 -1,300 -1,500
Source Table 6d of Appendix 3
In 2019 Prices
Capacity for Future Comparison Goods Floorspace
4.20 Our methodology in calculating comparison goods capacity deviates from that employed in respect
of convenience goods. This is because it is difficult to accurately estimate a benchmark turnover for
comparison goods floorspace, both because of the number of units involved (which are occupied by
a wide variety of retailers) and due to the variation in the trading performance of floorspace
depending on its location, the character of the area and the nature of the catchment. As a
consequence, we adopt the position for comparison goods floorspace that it is trading ‘at
equilibrium’ at base year 2021 (i.e. our survey derived turnover estimate effectively acts as
benchmark). We assume that any comparison goods development implemented subsequent to the
undertaking of the household survey in 2014 has been sufficient to meet needs and to maintain
Warrington Borough’s current market share.
4.21 We assume that there is therefore a nil quantitative need for any additional comparison goods
floorspace across the Borough at 2021. Going forward, we again assume that the performance of
comparison goods facilities will be commensurate with the market share for the Borough identified
by the 2014 household survey.
4.22 Our approach in respect of comparison goods inflow replicates that adopted by the 2015 Retail and
Leisure Study, which used the home postcode of respondents to the in-street shopper survey to
identify the proportion of trips arising from beyond the Study Area. We have therefore allowed for
inflow on the basis that:
17.2% of visitors to Warrington town centre reside outside of the Study Area;
Warrington Borough Council Retail and Leisure Study Update 2021
22
8.0% of visitors to Stockton Heath district centre reside outside of the Study Area; and
13.0% of visitors to Westbrook district centre reside outside of the Study Area.
4.23 In accordance with the methodology employed by the 2015 Study, we have typically allowed for out
of centre destinations proximate to Warrington town centre to secure 5.0% of their turnover as inflow.
For Birchwood, given its proximity to the business park, we estimate that around 15.0% of its turnover
is derived as inflow.
4.24 Whilst we recognise that Gemini Retail Park secures a very significant proportion of its trade from
outside the Study Area (this is particularly the case for Ikea), we allow 5.0% inflow for this destination.
This is because much of the inflow to Gemini Retail Park will originate from across the North West of
England and it is not necessarily consistent with the principles of sustainable development to assume
that future expenditure growth arising from visitors to Gemini should be available to support
additional comparison goods floorspace across Warrington Borough as a whole. Indeed, in order to
secure such growth, it would likely require Gemini to expand further in the future. The figure of 5.0%
inflow has been used to account for the fact that a limited amount of inflow will derive from residents
who live just beyond the Study Area and from visitors who are already in the Warrington area for
other purposes.
4.25 As paragraph 7.27 of the 2015 Retail and Leisure Study notes, whilst this approach is:
‘…somewhat cautious, it is considered to be wholly appropriate in the context of the Study, which
principally seeks to consider the needs of those that reside within the Study Area. However…should
planning proposals come forward in the future to provide additional floorspace at Gemini, such
floorspace would not, in its entirety, act to reduce Warrington Borough’s capacity to support additional
comparison goods floorspace.’
4.26 The inflow allowance has the effect of increasing Warrington Borough’s identified estimated
comparison goods turnover from £636.3m to £726.2m (inflow therefore equating to £89.9m at 2021
and representing 12.4% of total turnover).
4.27 The £636.7m of comparison goods expenditure claimed by facilities within Warrington Borough that
originates from inside the Study Area equates to a market share of 59.6% of all such comparison
goods expenditure. By making provision for inflow and ‘rolling forward’ this market share, our
assessment finds that facilities in the Borough will attract £832.0m at 2026, increasing to £953.5m at
2026, to £1,105.0m at 2036, and then to £1,175.5m at 2038.
Warrington Borough Council Retail and Leisure Study Update 2021
23
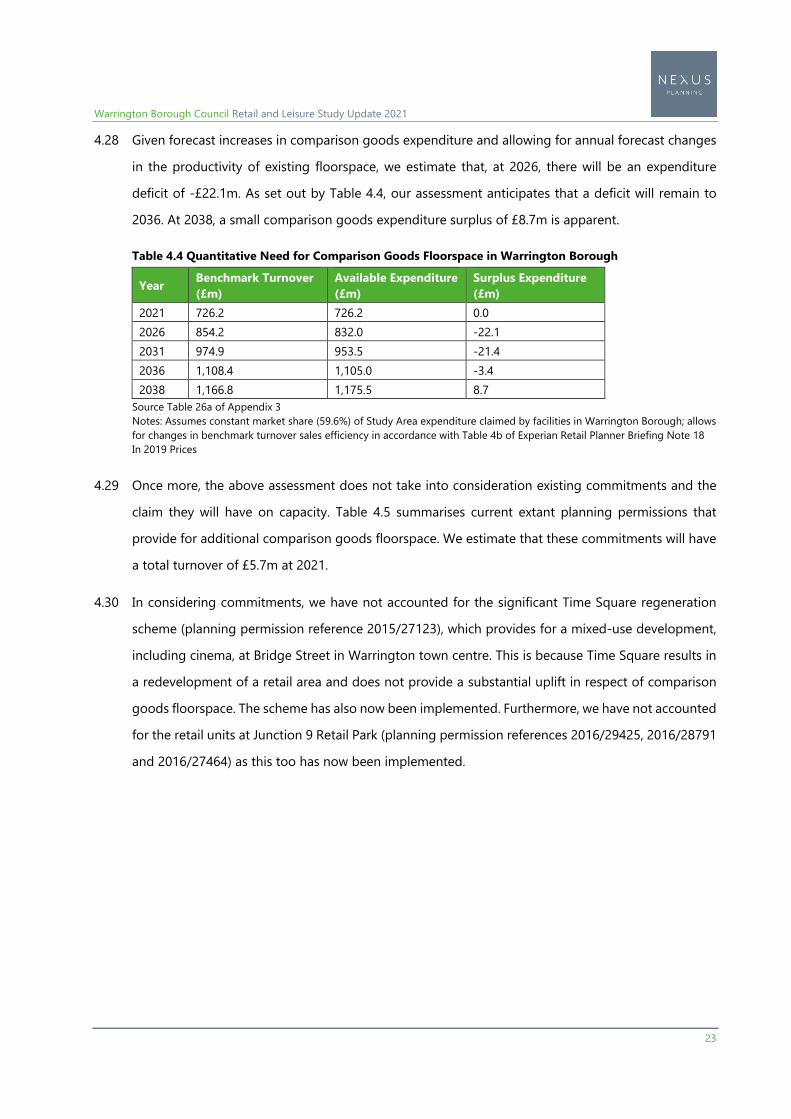
4.28 Given forecast increases in comparison goods expenditure and allowing for annual forecast changes
in the productivity of existing floorspace, we estimate that, at 2026, there will be an expenditure
deficit of -£22.1m. As set out by Table 4.4, our assessment anticipates that a deficit will remain to
2036. At 2038, a small comparison goods expenditure surplus of £8.7m is apparent.
Table 4.4 Quantitative Need for Comparison Goods Floorspace in Warrington Borough
Year Benchmark Turnover
(£m)
Available Expenditure
(£m)
Surplus Expenditure
(£m)
2021 726.2 726.2 0.0
2026 854.2 832.0 -22.1
2031 974.9 953.5 -21.4
2036 1,108.4 1,105.0 -3.4
2038 1,166.8 1,175.5 8.7
Source Table 26a of Appendix 3
Notes: Assumes constant market share (59.6%) of Study Area expenditure claimed by facilities in Warrington Borough; allows
for changes in benchmark turnover sales efficiency in accordance with Table 4b of Experian Retail Planner Briefing Note 18
In 2019 Prices
4.29 Once more, the above assessment does not take into consideration existing commitments and the
claim they will have on capacity. Table 4.5 summarises current extant planning permissions that
provide for additional comparison goods floorspace. We estimate that these commitments will have
a total turnover of £5.7m at 2021.
4.30 In considering commitments, we have not accounted for the significant Time Square regeneration
scheme (planning permission reference 2015/27123), which provides for a mixed-use development,
including cinema, at Bridge Street in Warrington town centre. This is because Time Square results in
a redevelopment of a retail area and does not provide a substantial uplift in respect of comparison
goods floorspace. The scheme has also now been implemented. Furthermore, we have not accounted
for the retail units at Junction 9 Retail Park (planning permission references 2016/29425, 2016/28791
and 2016/27464) as this too has now been implemented.
Warrington Borough Council Retail and Leisure Study Update 2021
24
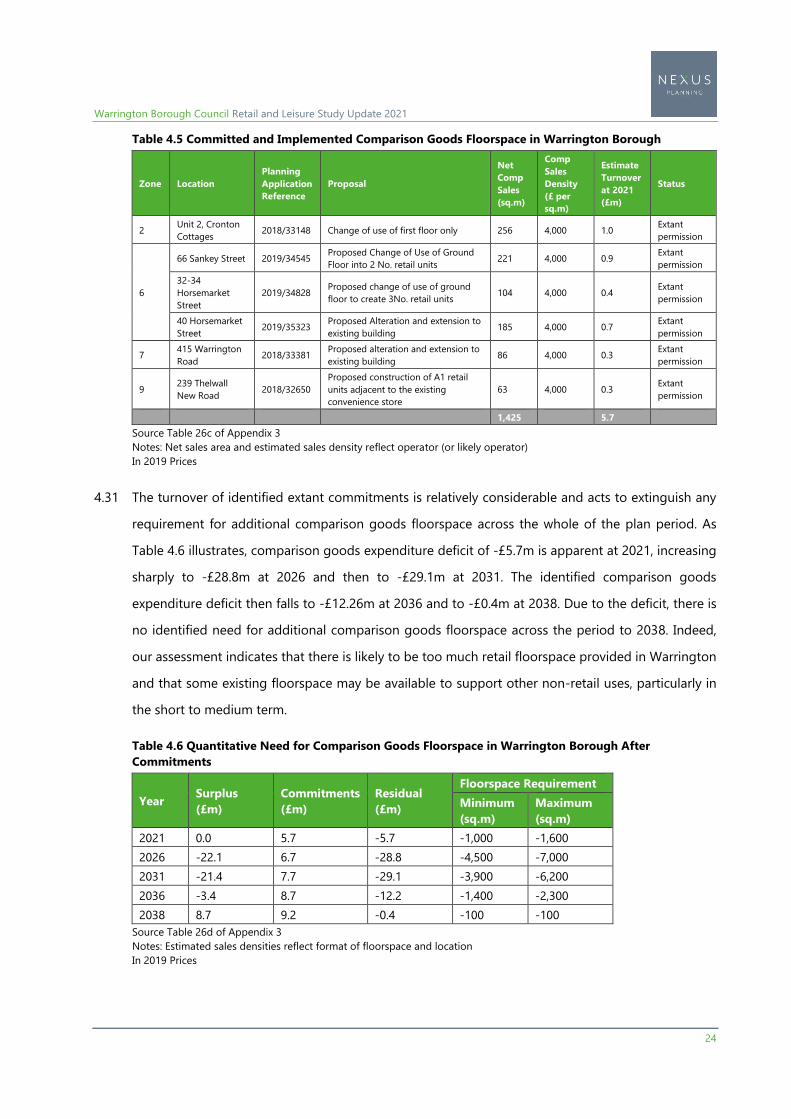
Table 4.5 Committed and Implemented Comparison Goods Floorspace in Warrington Borough
Zone Location
Planning
Application
Reference
Proposal
Net
Comp
Sales
(sq.m)
Comp
Sales
Density
(£ per
sq.m)
Estimate
Turnover
at 2021
(£m)
Status
2 Unit 2, Cronton
Cottages 2018/33148 Change of use of first floor only 256 4,000 1.0
Extant
permission
6
66 Sankey Street 2019/34545 Proposed Change of Use of Ground
Floor into 2 No. retail units 221 4,000 0.9
Extant
permission
32-34
Horsemarket
Street
2019/34828 Proposed change of use of ground
floor to create 3No. retail units 104 4,000 0.4
Extant
permission
40 Horsemarket
Street 2019/35323
Proposed Alteration and extension to
existing building 185 4,000 0.7
Extant
permission
7 415 Warrington
Road 2018/33381
Proposed alteration and extension to
existing building 86 4,000 0.3
Extant
permission
9 239 Thelwall
New Road 2018/32650
Proposed construction of A1 retail
units adjacent to the existing
convenience store
63 4,000 0.3 Extant
permission
1,425 5.7
Source Table 26c of Appendix 3
Notes: Net sales area and estimated sales density reflect operator (or likely operator)
In 2019 Prices
4.31 The turnover of identified extant commitments is relatively considerable and acts to extinguish any
requirement for additional comparison goods floorspace across the whole of the plan period. As
Table 4.6 illustrates, comparison goods expenditure deficit of -£5.7m is apparent at 2021, increasing
sharply to -£28.8m at 2026 and then to -£29.1m at 2031. The identified comparison goods
expenditure deficit then falls to -£12.26m at 2036 and to -£0.4m at 2038. Due to the deficit, there is
no identified need for additional comparison goods floorspace across the period to 2038. Indeed,
our assessment indicates that there is likely to be too much retail floorspace provided in Warrington
and that some existing floorspace may be available to support other non-retail uses, particularly in
the short to medium term.
Table 4.6 Quantitative Need for Comparison Goods Floorspace in Warrington Borough After
Commitments
Year Surplus
(£m)
Commitments
(£m)
Residual
(£m)
Floorspace Requirement
Minimum
(sq.m)
Maximum
(sq.m)
2021 0.0 5.7 -5.7 -1,000 -1,600
2026 -22.1 6.7 -28.8 -4,500 -7,000
2031 -21.4 7.7 -29.1 -3,900 -6,200
2036 -3.4 8.7 -12.2 -1,400 -2,300
2038 8.7 9.2 -0.4 -100 -100
Source Table 26d of Appendix 3
Notes: Estimated sales densities reflect format of floorspace and location
In 2019 Prices
Warrington Borough Council Retail and Leisure Study Update 2021
25
4.32 Paragraph 7.36 of the 2015 Retail and Leisure Study noted that Warrington town centre was the
subject of a higher than average vacancy rate and stated that:
‘…it would be prudent to plan for the reuse, refurbishment or redevelopment of these existing premises
wherever possible rather than grant planning permission for additional comparison goods floorspace
outside of a centre.’
4.33 In our view, the above statement remains relevant. The previous 2019 Retail and Leisure Study Update
provided a healthcheck assessment of Warrington town centre, which identified 23,030 sq.m of
vacant floorspace, equating to 18.5% of total floorspace. In total, 84 units were vacant at that time,
equating to 17.8% of all commercial units. Indeed, since the 2019 healthcheck was undertaken the
town centre has lost a number of large-scale retailers, most notably Debenhams in May 2021. We
believe that the first priority is to secure the reuse, refurbishment or redevelopment of existing units,
before planning for further comparison goods retail floorspace.
4.34 In this regard, we also note that paragraph 85 of the NPPF requires local planning authorities to
consider the need to allocate sites in town centres to meet likely needs, looking at least ten years
ahead. Given the above, there is no requirement for the Council to allocate any additional sites to
meet retail needs.
Warrington Borough Council Retail and Leisure Study Update 2021
26
5 Updated Assessment of Leisure Need
5.1 Our approach to the assessment of commercial leisure needs necessarily departs from our retail
methodology, partly because it is difficult to source some of the required information for the leisure
market. In addition, the commercial leisure sector is different to the retail sector; large-scale leisure
uses are relatively limited in number and customers often expect to travel at least some distance in
order to access them. As such, we believe it is sensible to consider the general appropriateness of
provision on a Study Area and Borough-wide basis, with reference to the typical number of persons
required to support particular uses.
5.2 Our assessment considers the typical population required to support bingo halls, cinema screens and
ten pin bowling alleys. Our approach is generally consistent with that set out in the 2015 Retail and
Leisure Study and the 2019 Retail and Leisure Study Update, and effectively comprises three stages.
5.3 We firstly calculate the expected Study Area16 population for the relevant reporting years (2021, 2026,
2031, 2036 and 3038).
5.4 We then calculate the number of persons required to support a bingo hall, cinema screen and
bowling alleys nationally, across the UK. We have identified the current level of provision across the
UK with reference to the following sources:
Mintel’s Casinos and Bingo UK report (March 2019), which identifies that there are 350 bingo
halls across the UK;
the UK Cinema Association website17 which identifies that there are 4,596 cinema screens across
the UK; and
Mintel’s Ten Pin Bowling UK report (May 2017), which identifies that there are 5,242 bowling
lanes across the UK.
5.5 We then apply the respective ratio to the Study Area population and to Warrington Borough’s
population in order to gauge the ‘benchmark’ level of provision. Our approach updates the findings
of the 2015 Retail and Leisure Study by using up to date population and leisure market data. However,
we do not replicate the market share analysis provided at Section 8 of the 2015 Study, as this is
essentially unchanged given that this Update relies on the same household survey data. However, we
note that the 2015 Study did not identify any particular difficulties in respect of respondents making
16 Derived from Experian MMG3 data. 17 www.cinemauk.org.uk, consulted on 11 May 2021.
Warrington Borough Council Retail and Leisure Study Update 2021
27
long or unusual journeys in order to access particular types of leisure provision. Notwithstanding this,
we recommend that the assessment that follows is read in conjunction with the findings of the 2015
Study should a more detailed overview of the sector be required.
Bingo
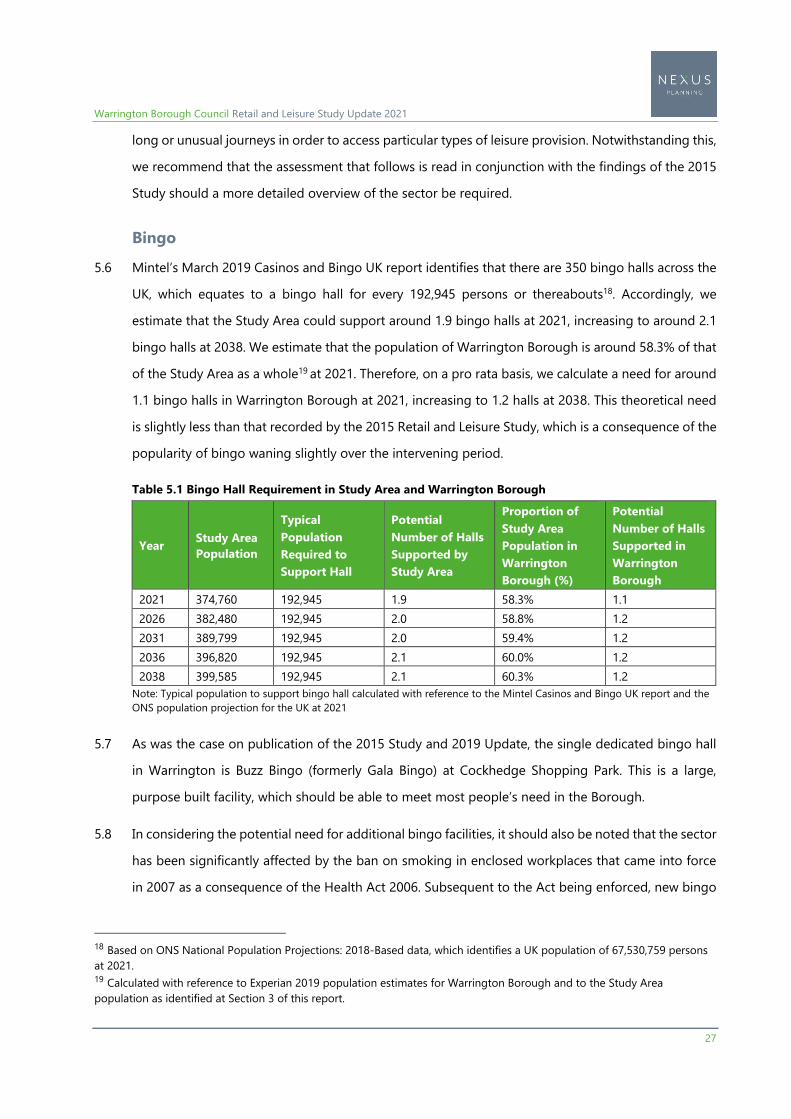
5.6 Mintel’s March 2019 Casinos and Bingo UK report identifies that there are 350 bingo halls across the
UK, which equates to a bingo hall for every 192,945 persons or thereabouts18. Accordingly, we
estimate that the Study Area could support around 1.9 bingo halls at 2021, increasing to around 2.1
bingo halls at 2038. We estimate that the population of Warrington Borough is around 58.3% of that
of the Study Area as a whole19 at 2021. Therefore, on a pro rata basis, we calculate a need for around
1.1 bingo halls in Warrington Borough at 2021, increasing to 1.2 halls at 2038. This theoretical need
is slightly less than that recorded by the 2015 Retail and Leisure Study, which is a consequence of the
popularity of bingo waning slightly over the intervening period.
Table 5.1 Bingo Hall Requirement in Study Area and Warrington Borough
Year Study Area
Population
Typical
Population
Required to
Support Hall
Potential
Number of Halls
Supported by
Study Area
Proportion of
Study Area
Population in
Warrington
Borough (%)
Potential
Number of Halls
Supported in
Warrington
Borough
2021 374,760 192,945 1.9 58.3% 1.1
2026 382,480 192,945 2.0 58.8% 1.2
2031 389,799 192,945 2.0 59.4% 1.2
2036 396,820 192,945 2.1 60.0% 1.2
2038 399,585 192,945 2.1 60.3% 1.2
Note: Typical population to support bingo hall calculated with reference to the Mintel Casinos and Bingo UK report and the
ONS population projection for the UK at 2021
5.7 As was the case on publication of the 2015 Study and 2019 Update, the single dedicated bingo hall
in Warrington is Buzz Bingo (formerly Gala Bingo) at Cockhedge Shopping Park. This is a large,
purpose built facility, which should be able to meet most people’s need in the Borough.
5.8 In considering the potential need for additional bingo facilities, it should also be noted that the sector
has been significantly affected by the ban on smoking in enclosed workplaces that came into force
in 2007 as a consequence of the Health Act 2006. Subsequent to the Act being enforced, new bingo
18 Based on ONS National Population Projections: 2018-Based data, which identifies a UK population of 67,530,759 persons
at 2021. 19 Calculated with reference to Experian 2019 population estimates for Warrington Borough and to the Study Area
population as identified at Section 3 of this report.
Warrington Borough Council Retail and Leisure Study Update 2021
28
hall openings are a rare event and we consider it highly unlikely that there will be any need for
additional provision in the Borough in the foreseeable future. As such, we do not believe that there
is any requirement to plan for additional provision in the period to 2038, but instead recommend
that, should any operator interest be apparent, proposals are judged on their own merits in
accordance with relevant town centre planning policy.
Cinemas
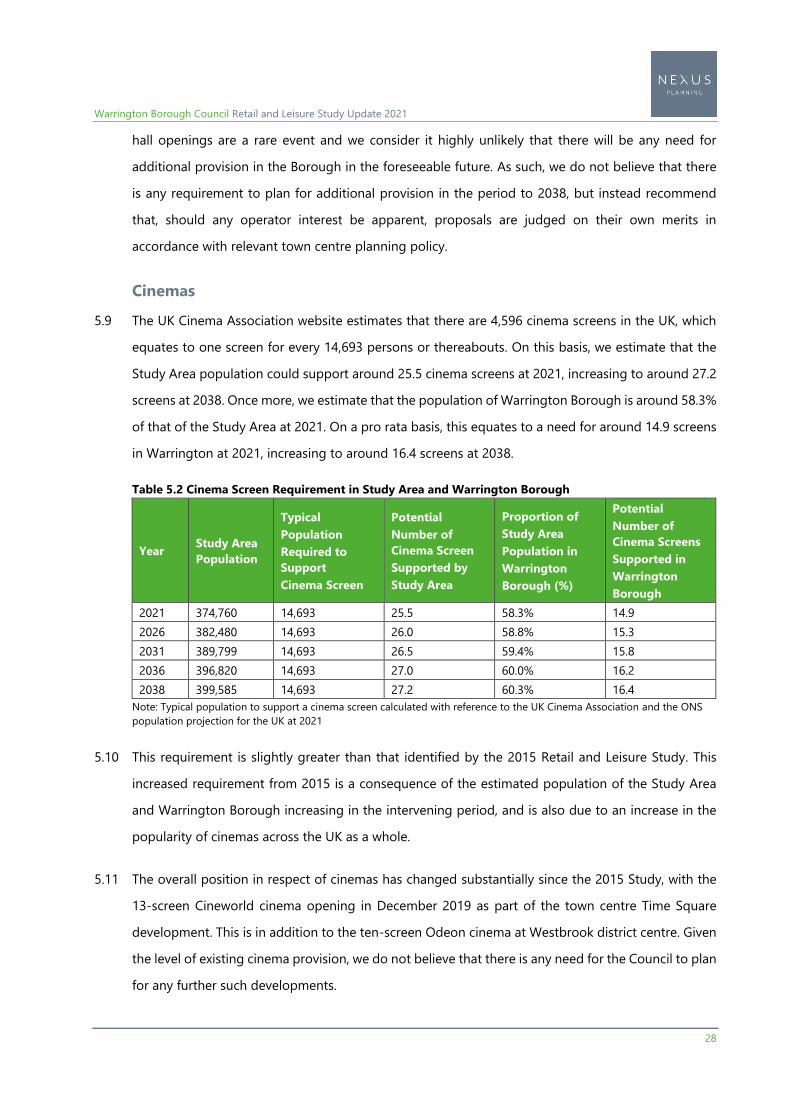
5.9 The UK Cinema Association website estimates that there are 4,596 cinema screens in the UK, which
equates to one screen for every 14,693 persons or thereabouts. On this basis, we estimate that the
Study Area population could support around 25.5 cinema screens at 2021, increasing to around 27.2
screens at 2038. Once more, we estimate that the population of Warrington Borough is around 58.3%
of that of the Study Area at 2021. On a pro rata basis, this equates to a need for around 14.9 screens
in Warrington at 2021, increasing to around 16.4 screens at 2038.
Table 5.2 Cinema Screen Requirement in Study Area and Warrington Borough
Year Study Area
Population
Typical
Population
Required to
Support
Cinema Screen
Potential
Number of
Cinema Screen
Supported by
Study Area
Proportion of
Study Area
Population in
Warrington
Borough (%)
Potential
Number of
Cinema Screens
Supported in
Warrington
Borough
2021 374,760 14,693 25.5 58.3% 14.9
2026 382,480 14,693 26.0 58.8% 15.3
2031 389,799 14,693 26.5 59.4% 15.8
2036 396,820 14,693 27.0 60.0% 16.2
2038 399,585 14,693 27.2 60.3% 16.4
Note: Typical population to support a cinema screen calculated with reference to the UK Cinema Association and the ONS
population projection for the UK at 2021
5.10 This requirement is slightly greater than that identified by the 2015 Retail and Leisure Study. This
increased requirement from 2015 is a consequence of the estimated population of the Study Area
and Warrington Borough increasing in the intervening period, and is also due to an increase in the
popularity of cinemas across the UK as a whole.
5.11 The overall position in respect of cinemas has changed substantially since the 2015 Study, with the
13-screen Cineworld cinema opening in December 2019 as part of the town centre Time Square
development. This is in addition to the ten-screen Odeon cinema at Westbrook district centre. Given
the level of existing cinema provision, we do not believe that there is any need for the Council to plan
for any further such developments.
Warrington Borough Council Retail and Leisure Study Update 2021
29
Ten Pin Bowling
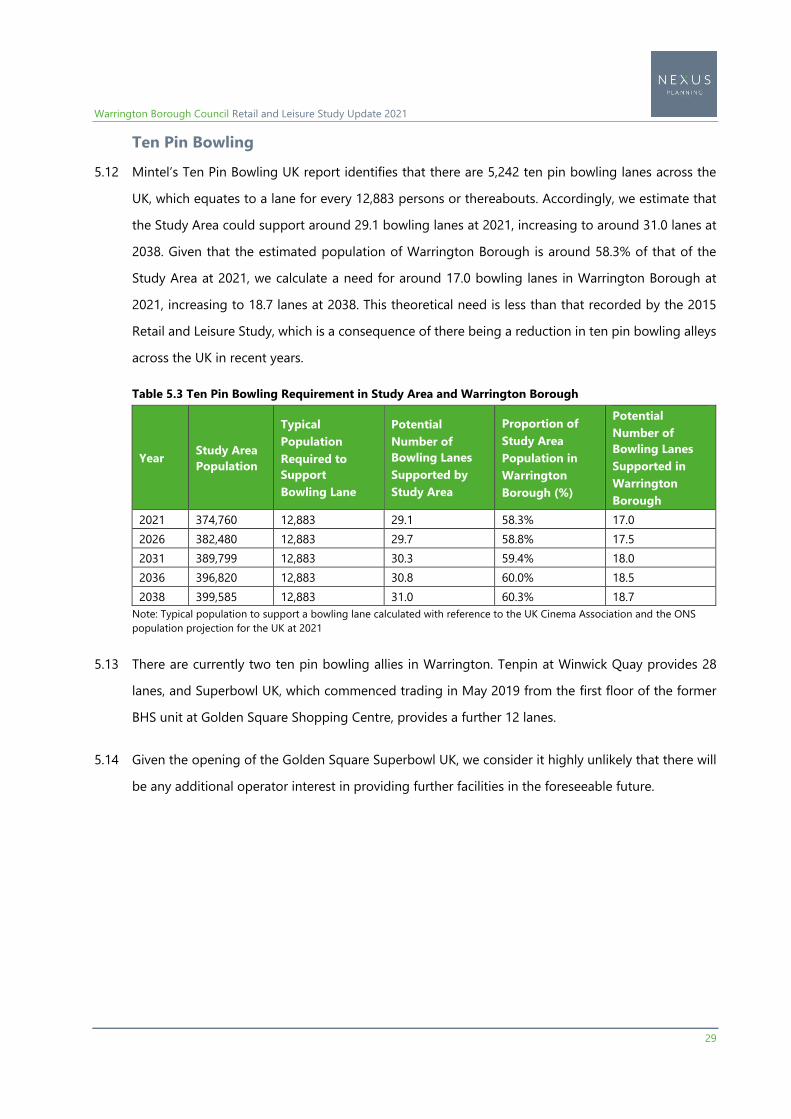
5.12 Mintel’s Ten Pin Bowling UK report identifies that there are 5,242 ten pin bowling lanes across the
UK, which equates to a lane for every 12,883 persons or thereabouts. Accordingly, we estimate that
the Study Area could support around 29.1 bowling lanes at 2021, increasing to around 31.0 lanes at
2038. Given that the estimated population of Warrington Borough is around 58.3% of that of the
Study Area at 2021, we calculate a need for around 17.0 bowling lanes in Warrington Borough at
2021, increasing to 18.7 lanes at 2038. This theoretical need is less than that recorded by the 2015
Retail and Leisure Study, which is a consequence of there being a reduction in ten pin bowling alleys
across the UK in recent years.
Table 5.3 Ten Pin Bowling Requirement in Study Area and Warrington Borough
Year Study Area
Population
Typical
Population
Required to
Support
Bowling Lane
Potential
Number of
Bowling Lanes
Supported by
Study Area
Proportion of
Study Area
Population in
Warrington
Borough (%)
Potential
Number of
Bowling Lanes
Supported in
Warrington
Borough
2021 374,760 12,883 29.1 58.3% 17.0
2026 382,480 12,883 29.7 58.8% 17.5
2031 389,799 12,883 30.3 59.4% 18.0
2036 396,820 12,883 30.8 60.0% 18.5
2038 399,585 12,883 31.0 60.3% 18.7
Note: Typical population to support a bowling lane calculated with reference to the UK Cinema Association and the ONS
population projection for the UK at 2021
5.13 There are currently two ten pin bowling allies in Warrington. Tenpin at Winwick Quay provides 28
lanes, and Superbowl UK, which commenced trading in May 2019 from the first floor of the former
BHS unit at Golden Square Shopping Centre, provides a further 12 lanes.
5.14 Given the opening of the Golden Square Superbowl UK, we consider it highly unlikely that there will
be any additional operator interest in providing further facilities in the foreseeable future.
Warrington Borough Council Retail and Leisure Study Update 2021
30
6 Summary and Conclusions
Key Findings: Retail Need
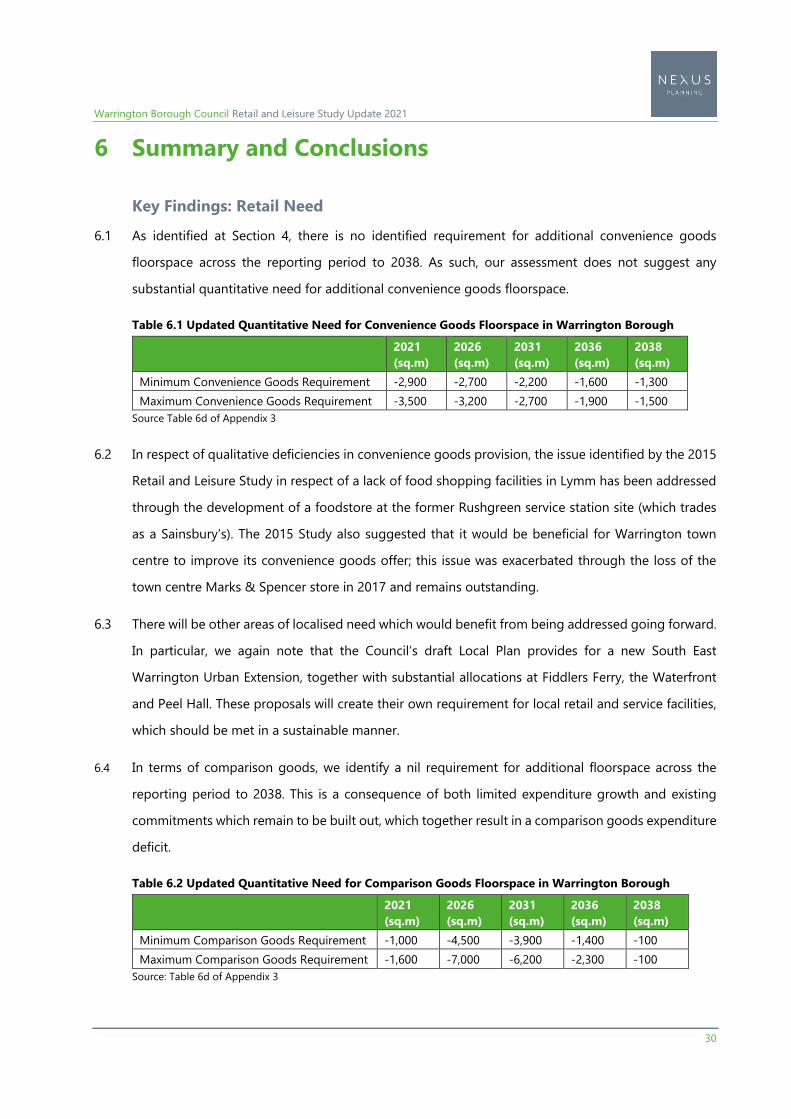
6.1 As identified at Section 4, there is no identified requirement for additional convenience goods
floorspace across the reporting period to 2038. As such, our assessment does not suggest any
substantial quantitative need for additional convenience goods floorspace.
Table 6.1 Updated Quantitative Need for Convenience Goods Floorspace in Warrington Borough
2021
(sq.m)
2026
(sq.m)
2031
(sq.m)
2036
(sq.m)
2038
(sq.m)
Minimum Convenience Goods Requirement -2,900 -2,700 -2,200 -1,600 -1,300
Maximum Convenience Goods Requirement -3,500 -3,200 -2,700 -1,900 -1,500
Source Table 6d of Appendix 3
6.2 In respect of qualitative deficiencies in convenience goods provision, the issue identified by the 2015
Retail and Leisure Study in respect of a lack of food shopping facilities in Lymm has been addressed
through the development of a foodstore at the former Rushgreen service station site (which trades
as a Sainsbury’s). The 2015 Study also suggested that it would be beneficial for Warrington town
centre to improve its convenience goods offer; this issue was exacerbated through the loss of the
town centre Marks & Spencer store in 2017 and remains outstanding.
6.3 There will be other areas of localised need which would benefit from being addressed going forward.
In particular, we again note that the Council’s draft Local Plan provides for a new South East
Warrington Urban Extension, together with substantial allocations at Fiddlers Ferry, the Waterfront
and Peel Hall. These proposals will create their own requirement for local retail and service facilities,
which should be met in a sustainable manner.
6.4 In terms of comparison goods, we identify a nil requirement for additional floorspace across the
reporting period to 2038. This is a consequence of both limited expenditure growth and existing
commitments which remain to be built out, which together result in a comparison goods expenditure
deficit.
Table 6.2 Updated Quantitative Need for Comparison Goods Floorspace in Warrington Borough
2021
(sq.m)
2026
(sq.m)
2031
(sq.m)
2036
(sq.m)
2038
(sq.m)
Minimum Comparison Goods Requirement -1,000 -4,500 -3,900 -1,400 -100
Maximum Comparison Goods Requirement -1,600 -7,000 -6,200 -2,300 -100
Source: Table 6d of Appendix 3
Warrington Borough Council Retail and Leisure Study Update 2021
31
Key Findings: Leisure Need
6.5 In terms of the leisure sector, the additional of Cineworld and Superbowl UK within Warrington town
centre extinguishes any requirement for additional large-scale leisure provision in the Borough. The
substantial recent improvements in commercial leisure provision should also have a beneficial impact
in attracting food and drink operators into the town centre.
Warrington Borough Council Retail and Leisure Study Update 2021
32
Nexus Planning
Manchester
Eastgate
2 Castle Street
Castlefield
Manchester M3 4LZ
Tel: 0161 819 6570
nexusplanning.co.uk


