19
Retail Customer Segmentation using SAS April 2014 Calgary SAS Users Group meeting Jenny Chen Data Science, LoyaltyOne
Retail Customer Segmentation using SAS
April 2014Calgary SAS Users Group meeting
Jenny ChenData Science, LoyaltyOne

Agenda
• Overview • Applications• Objectives • Types of Segmentation• A Real Example with SAS Code• Further Reading

Overview
• Customer Segmentation is the practice of classifying your customers into distinct groups based on the similarities they share with respect to any characteristics you deem relevant to your business
• Key components in developing proper, actionable segmentation• Understand business needs and objectives
Customer satisfactionShare of walletMarket share
• Available customer informationDemographic Geographic BehavioralAttitudinal

Applications Examples
Customer Investment Allocation
• Determine segment’s current and potential profitability• Define differentiated value proposition by segment
Customer Relationship Management
• Better meet customer needs, improve customer satisfaction• Develop customer loyalty to your brand• Improve retention strategy
Tailor Marketing Program
• Build relevant campaign, communication• Optimize marketing channel mix
Guide New Product Development
• Product preference• Potential targeting audience
Guide Product, Service Pricing
• Price sensitivity• Stimulate customer demand
…and many more
Applications

Objectives
Create Relevancy
Change Behavior
Improve Financials
•Better defined target universe •Right offer, communication, channel, time for right customers
• Personalized experience between clients and their customers
• Higher response rates•Combat attrition of high profit customers
• Grooming lower current value high potential customers
• Identify cross-sell & up-sell opportunities by customer
• Measureable improvement in sales, traffic, revenue
• More cost effective campaign deployment and ROI
• Opportunity identification by category, department, store, etc.
Segmentation enables business to increase profitability while positively addressing customer needs
Segmentation Type
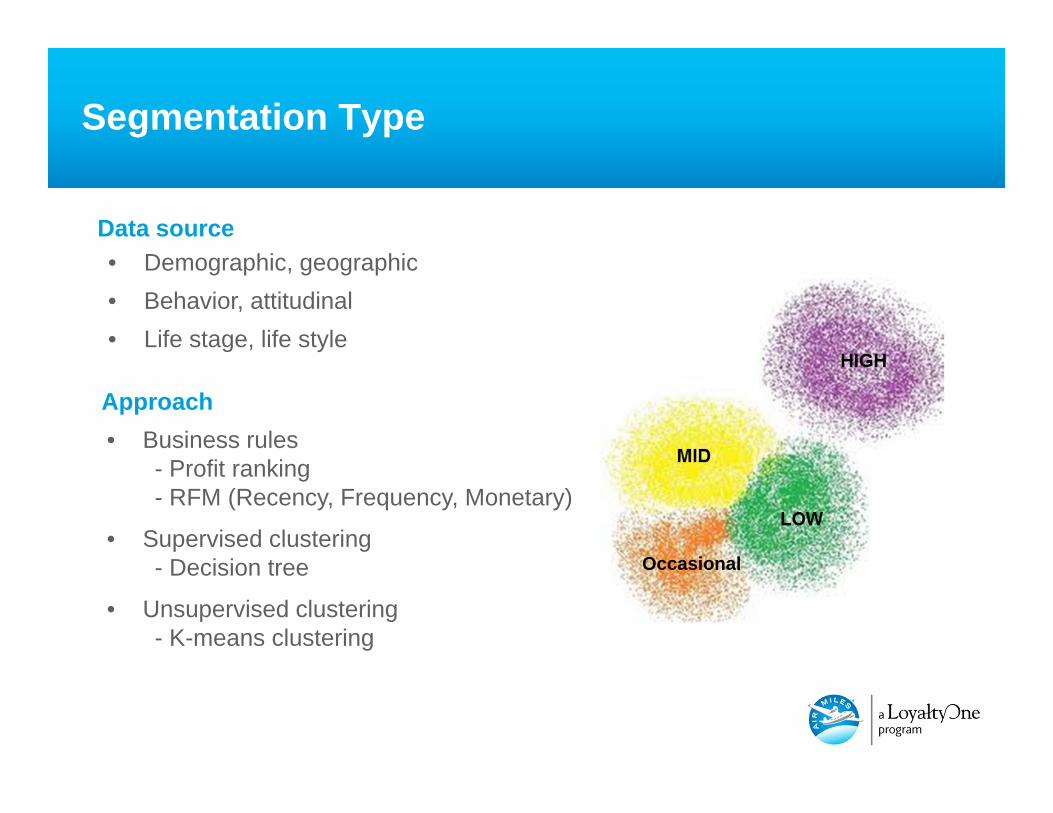
• Demographic, geographic• Behavior, attitudinal• Life stage, life style
Data source
Approach • Business rules
- Profit ranking- RFM (Recency, Frequency, Monetary)
• Supervised clustering- Decision tree
• Unsupervised clustering- K-means clustering
Occasional

Using unsupervised clustering segmentation for a grocery chain which would like better product assortment for its high profitable customers
Potential Inputs
Basket
Time
Location
Value• Basket Size• Visit Frequency
• Spend by category• Type of category• Brand spend (i.e. private label)
• Time of day• Day of week
• Store format• Area population density
Promotions • % bought on targeted promotion• % bought from flyer
Clustering approach
Deal Seeking Mom
Key Differentiators
• Full store shop• High avg. basket size / # trips
• High spend categories- Fresh produce- Organic food- Multipack juice, snack
• High % purchased on promotion• Rewards seeker
A Behavior Based Segmentation Example

Segmentation Building Process I
• Identify high profitable customer groups• Improve product assortment for them • Design relevant, effective marketing campaigns for them• Quantify campaign measurements
Define business objective
Gather information• Customer transactional data• Promotional data• Client store, department, category merchandising hierarchy
Align with client on project scope• Business Objectives• Data Sources• Methodology• Measurement plan

Segmentation Building Process II
• Data merge purge, data cleaning, dealing with missing• Convert all attributes to numeric metrics, cap outliers • Standardize all metrics/variables • Standardization enables each metric have similar contribution to the
future cluster building
Data preparation
PROC STDIZE DATA=SAS_DATA.ALL_INFO OUT=SAS_DATA.STANDARD_STD OUTSTAT=SAS_DATA.SUMMARY (WHERE=(_TYPE_ IN ('LOCATION', 'SCALE')));VAR &ALL_VAR; RUN;

Segmentation Building Process III
• Check descriptive statistics, correlation among all potential variables• Use principle component, factor analysis (PROC PRINCOMP, PROC FACTOR)• Use the Variable Clustering node in SAS Enterprise Miner to create variable
cluster constellation plot and variable cluster tree diagram
Data exploration, variable reduction
Measure similarity among customers
• Using Euclidean distance - this measures the distance between 2 points in multi-dimensional space
• A very common method of unsupervised clustering with large data using Euclidean distance is K-means clustering

Segmentation Building Process IV
K-means clustering• Using the distances to group customers into K clusters where each customer
is with the nearest centroid• The centroid is calculated as the multi-dimensional set of the means of the
variables used for the particular cluster• Pre-determine a range of number of clusters, use bottom-up approach• Test the FASTCLUS procedure repeatedly using different starting points and
different number of clusters until we obtain stabilized centroids and desired distance between clusters
PROC FASTCLUS DATA=SAS_DATA.STANDARD_STD MAXCLUSTERS=29OUT=SAS_DATA.RESULT OUTSEED=SAS_DATA.CENTRES OUTSTAT=SAS_DATA.CLUSTER_STAT REPLACE=RANDOM RANDOM=187413849 CONVERGE=0.001 MAXITER=350;VAR &VAR_LIST; RUN;

Output of K-means Clustering
Cluster Mean
Cluster Var1 Var2 Var3 Var4 Var5 Var6 Var7 Var8 Var9
1 (0.68) (0.28) (0.37) (0.20) (0.77) 0.46 (0.29) 1.11 1.70
2 0.81 0.91 2.44 (0.19) 0.93 0.95 0.41 (0.62) (0.56)
3 (0.68) (0.62) (0.73) (0.44) (0.77) (0.67) (0.53) 1.11 1.66
4 (0.49) (0.54) (0.45) (0.45) (0.51) (0.33) (0.48) (0.46) (0.56)
5 (0.17) 0.04 0.10 (0.02) (0.13) 0.73 0.70 (0.43) (0.55)
…
29 (0.68) (0.68) (0.84) (0.47) (0.77) (1.64) (0.58) 2.27 2.40
Statistics for Variables
Variable RSQ/(1-RSQ)
Var1 13.82
Var2 16.51
Var3 6.69
…
Var 9 56.76
• Centroids info
• Statistics for variable comparison and further variable reduction• RSQ/(1-RSQ) is the ratio of between cluster variance to within cluster variance• Get client’s buy-in for the final list of variables for cluster building

Segmentation Building Process V
Bottom-up approach
PROC CLUSTER DATA=SAS_DATA.CENTRES METHOD=AVE OUTTREE=TREE;VAR &VAR_LIST; RUN;
PROC TREE DATA=TREE;RUN;
• Flexible with how many clusters to choose initially• Aggregate clusters up afterwards using hierarchy clustering PROC CLUSTER• Create a tree diagram for clusters using PROC TREE• Choose proper distance to fit into client’s request of final number of
segments and distribution of segments

Bottom-up ApproachTree diagram to illustrate the arrangement of the clusters
Detailed distinctive clusters
Seg1
Seg2
Seg3
Seg4
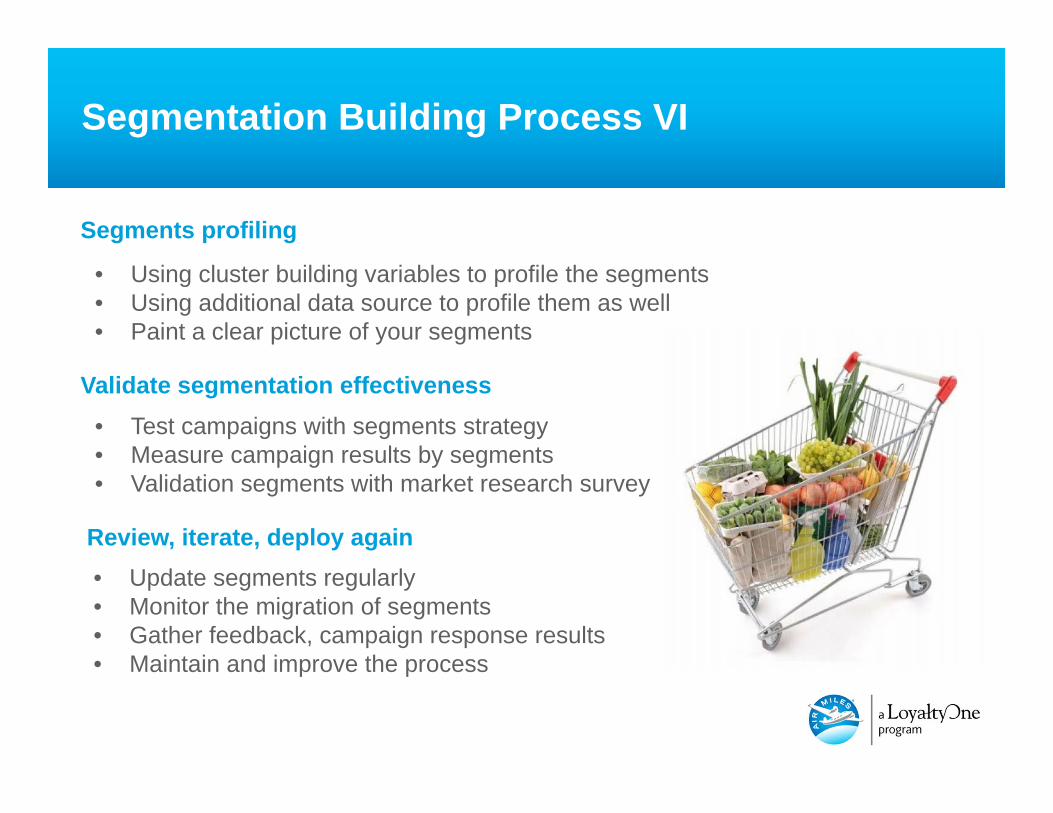
Segmentation Building Process VI
• Test campaigns with segments strategy• Measure campaign results by segments• Validation segments with market research survey
Validate segmentation effectiveness
Review, iterate, deploy again• Update segments regularly• Monitor the migration of segments• Gather feedback, campaign response results• Maintain and improve the process
Segments profiling
• Using cluster building variables to profile the segments• Using additional data source to profile them as well• Paint a clear picture of your segments

Pros and Cons of K-means Clustering
Pros
• Flexible with fewer assumptions about your customer population• Can incorporate many relevant metrics• Provide more comprehensive, diverse segments• Simple algorithm fast to run with large dataset• Prove to work well for behavioral targeting
Cons• Purely data driven• Pre-specify number of clusters or the minimum distance between clusters• Time consuming to maintain: for example, certain metrics used to build the
clusters were changing overtime dramatically• May have difficulty to explain the concept to your marketing clients
Question or Comment

Reference
http://support.sas.com/documentation/
http://www.youtube.com/watch?v=NSed-m3Z8Ik
http://support.sas.com/events/sasglobalforum/previous/online.html
http://support.sas.com/resources/papers/
A video about LoyaltyOne: Enriching Relationships
• http://support.sas.com/resources/papers/proceedings12/103-2012.pdf• http://support.sas.com/resources/papers/proceedings12/200-2012.pdf• http://support.sas.com/resources/papers/proceedings12/329-2012.pdf
SAS website

© 2014 LoyaltyOne, Inc. All rights reserved. No part of this material may be produced in any form without the written permission of the owner. No representation or warranty of any kind is made with respect to the content hereof and no liability is assumed for errors contained herein or for incidental or consequential damages in connection with the furnishing, performance or use of this publication or its contents.


