Page 1
FO
RLEASE LITTLE INDIA CENTER9474 BLACK MOUNTAIN ROAD, SAN DIEGO, CA 92126
Retail Division
1000 Aviara Parkway, Suite 100, Carlsbad, CA 92011
T: +1 760 431 4200 F: +1 760 454 3869
cushmanwakefield.com
Jack Avarello +1 760 431 3851 [email protected] LIC #02081489
Andrew Peterson +1 760 305 6195 [email protected] LIC #01493043
• Property is located in the heart of the Miramar Road Retail Corridor.
• Situated along major commuter thoroughfares, with close proximity to the I-15 freeway on/off ramp.
• Heavy daytime population, with close proximity to other traffic generators: Miramar Air Base, Scripps Ranch.
Property Highlights
Traffic Counts• Black Mtn Rd.: 23,500 ADT
• MIramar Rd.: 60,200 ADT
• Kearny Villa Rd.: 21,200 ADT
For Lease40,226 SF SHOPPING CENTER600 SF - 5,125 SF AVAILABLE
1 MILE 3 MILES 5 MILES
Pop (2020) 13,870 95,171 191,901AHH Income $99,573 $127,576 $145,054Daytime Pop. 10,763 53,367 150,496
Demographics
PROPERTY
Tenants in the area:
VIRTUAL TOUR AVAILABLE
Page 2
FO
RLEASE LITTLE INDIA CENTER9474 BLACK MOUNTAIN ROAD, SAN DIEGO, CA 92126
Retail Division
1000 Aviara Parkway, Suite 100, Carlsbad, CA 92011
T: +1 760 431 4200 F: +1 760 454 3869
cushmanwakefield.com
Jack Avarello +1 760 431 3851 [email protected] LIC #02081489
Andrew Peterson +1 760 305 6195 [email protected] LIC #01493043
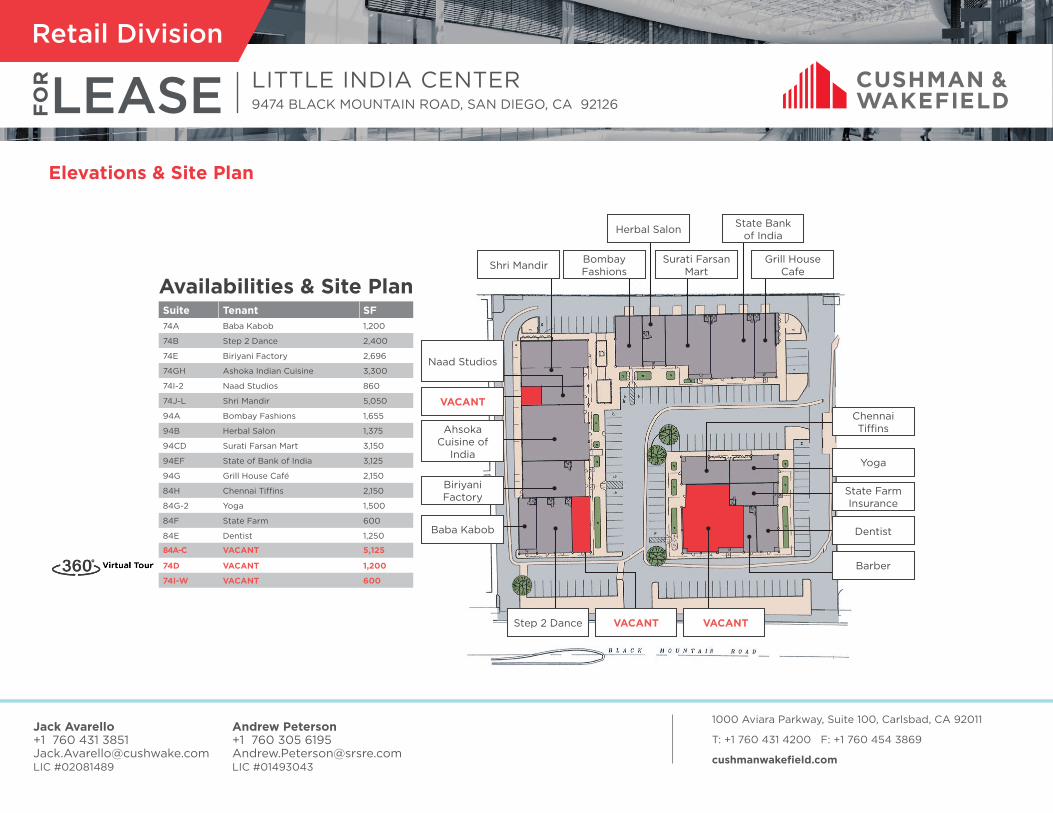
Elevations & Site Plan
Suite Tenant SF74A Baba Kabob 1,200
74B Step 2 Dance 2,400
74E Biriyani Factory 2,696
74GH Ashoka Indian Cuisine 3,300
74I-2 Naad Studios 860
74J-L Shri Mandir 5,050
94A Bombay Fashions 1,655
94B Herbal Salon 1,375
94CD Surati Farsan Mart 3,150
94EF State of Bank of India 3,125
94G Grill House Café 2,150
84H 2,150
84G-2 Yoga 1,500
84F State Farm 600
84E Dentist 1,250
74D VACANT 1,200
74I-W VACANT 600
Availabilities & Site PlanBombay Fashions
Surati Farsan Mart
Grill House Cafe
Herbal Salon State Bank of India
Shri Mandir
Chennai
Yoga
State Farm Insurance
Dentist
Barber
Step 2 Dance VACANT
Biriyani Factory
Ahsoka Cuisine of
India
Naad Studios
Baba Kabob
VACANT
VACANT 5,12584A-C
VACANT
Page 3
FO
RLEASE LITTLE INDIA CENTER9474 BLACK MOUNTAIN ROAD, SAN DIEGO, CA 92126
Retail Division
1000 Aviara Parkway, Suite 100, Carlsbad, CA 92011
T: +1 760 431 4200 F: +1 760 454 3869
cushmanwakefield.com
Jack Avarello +1 760 431 3851 [email protected] LIC #02081489
Andrew Peterson +1 760 305 6195 [email protected] LIC #01493043
Aerial
MIRAMAR NAVALAIR STATION
15
KE
AR
NY
VIL
LA
RD
21,2
00
AD
TK
EA
RN
Y V
ILL
A R
D 2
1,20
0 A
DT
BL
AC
K M
TN
RD
23
,50
0 A
DT
BL
AC
K M
TN
RD
23
,50
0 A
DT
CAMINO RUIZ
CAMINO RUIZ SITE
MIRAMAR ROAD 60,200 A
DT
MIRAMAR ROAD 60,200 A
DT
Page 4
FO
RLEASE LITTLE INDIA CENTER9474 BLACK MOUNTAIN ROAD, SAN DIEGO, CA 92126
Retail Division
1000 Aviara Parkway, Suite 100, Carlsbad, CA 92011
T: +1 760 431 4200 F: +1 760 454 3869
cushmanwakefield.com
Jack Avarello +1 760 431 3851 [email protected] LIC #02081489
Andrew Peterson +1 760 305 6195 [email protected] LIC #01493043
Demographic and Income Profile9474 Black Mountain Rd, San Diego, California, 92126 Prepared by EsriRing: 1 mile radius Latitude: 32.89556
Longitude: -117.12395
Summary Census 2010 2020 2025Population 13,490 13,870 14,016Households 3,582 3,636 3,673Families 2,470 2,495 2,525Average Household Size 2.92 2.93 2.94Owner Occupied Housing Units 1,478 1,496 1,543Renter Occupied Housing Units 2,104 2,140 2,131Median Age 26.0 27.0 27.5
Trends: 2020-2025 Annual Rate Area State NationalPopulation 0.21% 0.55% 0.72%Households 0.20% 0.50% 0.72%Families 0.24% 0.50% 0.64%Owner HHs 0.62% 0.65% 0.72%Median Household Income 1.62% 1.81% 1.60%
2020 2025 Households by Income Number Percent Number Percent
<$15,000 146 4.0% 126 3.4%$15,000 - $24,999 161 4.4% 133 3.6%$25,000 - $34,999 313 8.6% 268 7.3%$35,000 - $49,999 382 10.5% 338 9.2%$50,000 - $74,999 748 20.6% 724 19.7%$75,000 - $99,999 580 16.0% 592 16.1%$100,000 - $149,999 664 18.3% 721 19.6%$150,000 - $199,999 329 9.0% 394 10.7%$200,000+ 314 8.6% 378 10.3%
Median Household Income $77,204 $83,644Average Household Income $99,573 $111,799Per Capita Income $31,335 $34,562
Census 2010 2020 2025 Population by Age Number Percent Number Percent Number Percent
0 - 4 929 6.9% 862 6.2% 885 6.3%5 - 9 719 5.3% 786 5.7% 764 5.5%10 - 14 640 4.7% 642 4.6% 641 4.6%15 - 19 969 7.2% 840 6.1% 896 6.4%20 - 24 3,195 23.7% 3,195 23.0% 3,098 22.1%25 - 34 2,553 18.9% 2,663 19.2% 2,676 19.1%35 - 44 1,621 12.0% 1,692 12.2% 1,746 12.5%45 - 54 1,174 8.7% 1,184 8.5% 1,201 8.6%55 - 64 980 7.3% 937 6.8% 944 6.7%65 - 74 426 3.2% 702 5.1% 664 4.7%75 - 84 205 1.5% 275 2.0% 390 2.8%
85+ 80 0.6% 94 0.7% 109 0.8%Census 2010 2020 2025
Race and Ethnicity Number Percent Number Percent Number PercentWhite Alone 6,801 50.4% 6,449 46.5% 6,231 44.5%Black Alone 1,013 7.5% 1,043 7.5% 1,032 7.4%American Indian Alone 96 0.7% 92 0.7% 88 0.6%Asian Alone 3,535 26.2% 3,956 28.5% 4,210 30.0%Pacific Islander Alone 76 0.6% 76 0.5% 77 0.5%Some Other Race Alone 1,089 8.1% 1,240 8.9% 1,304 9.3%Two or More Races 880 6.5% 1,014 7.3% 1,072 7.6%
Hispanic Origin (Any Race) 2,613 19.4% 2,971 21.4% 3,165 22.6%Data Note: Income is expressed in current dollars.
Source: U.S. Census Bureau, Census 2010 Summary File 1. Esri forecasts for 2020 and 2025.
February 02, 2021
©2021 Esri Page 1 of 6
Demographic and Income Profile9474 Black Mountain Rd, San Diego, California, 92126 Prepared by EsriRing: 3 mile radius Latitude: 32.89556
Longitude: -117.12395
Summary Census 2010 2020 2025Population 88,041 95,171 96,971Households 28,574 30,678 31,172Families 20,997 22,581 23,021Average Household Size 2.96 2.98 2.99Owner Occupied Housing Units 17,570 18,113 18,480Renter Occupied Housing Units 11,004 12,565 12,692Median Age 34.3 36.4 37.4
Trends: 2020-2025 Annual Rate Area State NationalPopulation 0.38% 0.55% 0.72%Households 0.32% 0.50% 0.72%Families 0.39% 0.50% 0.64%Owner HHs 0.40% 0.65% 0.72%Median Household Income 1.36% 1.81% 1.60%
2020 2025 Households by Income Number Percent Number Percent
<$15,000 879 2.9% 770 2.5%$15,000 - $24,999 934 3.0% 783 2.5%$25,000 - $34,999 1,186 3.9% 1,007 3.2%$35,000 - $49,999 2,262 7.4% 1,938 6.2%$50,000 - $74,999 4,166 13.6% 3,744 12.0%$75,000 - $99,999 4,349 14.2% 4,128 13.2%$100,000 - $149,999 8,254 26.9% 8,497 27.3%$150,000 - $199,999 4,523 14.7% 5,242 16.8%$200,000+ 4,124 13.4% 5,062 16.2%
Median Household Income $106,045 $113,481Average Household Income $127,576 $143,342Per Capita Income $41,977 $46,931
Census 2010 2020 2025 Population by Age Number Percent Number Percent Number Percent
0 - 4 5,811 6.6% 5,570 5.9% 5,685 5.9%5 - 9 5,104 5.8% 5,758 6.1% 5,508 5.7%10 - 14 4,979 5.7% 5,787 6.1% 5,562 5.7%15 - 19 5,562 6.3% 5,134 5.4% 5,587 5.8%20 - 24 8,574 9.7% 7,636 8.0% 7,337 7.6%25 - 34 14,979 17.0% 15,564 16.4% 15,035 15.5%35 - 44 12,907 14.7% 14,279 15.0% 15,023 15.5%45 - 54 12,295 14.0% 12,024 12.6% 12,294 12.7%55 - 64 9,914 11.3% 11,034 11.6% 10,754 11.1%65 - 74 4,887 5.6% 7,859 8.3% 8,267 8.5%75 - 84 2,248 2.6% 3,444 3.6% 4,622 4.8%
85+ 780 0.9% 1,083 1.1% 1,298 1.3%Census 2010 2020 2025
Race and Ethnicity Number Percent Number Percent Number PercentWhite Alone 39,303 44.6% 38,181 40.1% 36,763 37.9%Black Alone 3,807 4.3% 4,003 4.2% 3,948 4.1%American Indian Alone 358 0.4% 340 0.4% 329 0.3%Asian Alone 34,248 38.9% 40,537 42.6% 43,244 44.6%Pacific Islander Alone 550 0.6% 559 0.6% 557 0.6%Some Other Race Alone 4,431 5.0% 5,159 5.4% 5,387 5.6%Two or More Races 5,345 6.1% 6,393 6.7% 6,742 7.0%
Hispanic Origin (Any Race) 11,565 13.1% 13,431 14.1% 14,253 14.7%Data Note: Income is expressed in current dollars.
Source: U.S. Census Bureau, Census 2010 Summary File 1. Esri forecasts for 2020 and 2025.
February 02, 2021
©2021 Esri Page 3 of 6
Demographics
Page 5
FO
RLEASE LITTLE INDIA CENTER9474 BLACK MOUNTAIN ROAD, SAN DIEGO, CA 92126
Retail Division
1000 Aviara Parkway, Suite 100, Carlsbad, CA 92011
T: +1 760 431 4200 F: +1 760 454 3869
cushmanwakefield.com
Jack Avarello +1 760 431 3851 [email protected] LIC #02081489
Andrew Peterson +1 760 305 6195 [email protected] LIC #01493043
DemographicsDemographic and Income Profile9474 Black Mountain Rd, San Diego, California, 92126 Prepared by EsriRing: 5 mile radius Latitude: 32.89556
Longitude: -117.12395
Summary Census 2010 2020 2025Population 178,669 191,901 196,669Households 61,088 65,705 67,143Families 45,108 48,241 49,414Average Household Size 2.87 2.86 2.87Owner Occupied Housing Units 39,839 40,914 41,782Renter Occupied Housing Units 21,249 24,791 25,362Median Age 35.7 37.4 38.3
Trends: 2020-2025 Annual Rate Area State NationalPopulation 0.49% 0.55% 0.72%Households 0.43% 0.50% 0.72%Families 0.48% 0.50% 0.64%Owner HHs 0.42% 0.65% 0.72%Median Household Income 1.73% 1.81% 1.60%
2020 2025 Households by Income Number Percent Number Percent
<$15,000 1,968 3.0% 1,761 2.6%$15,000 - $24,999 1,805 2.7% 1,516 2.3%$25,000 - $34,999 2,055 3.1% 1,739 2.6%$35,000 - $49,999 4,021 6.1% 3,450 5.1%$50,000 - $74,999 7,680 11.7% 6,878 10.2%$75,000 - $99,999 8,477 12.9% 8,027 12.0%$100,000 - $149,999 16,015 24.4% 16,106 24.0%$150,000 - $199,999 11,199 17.0% 12,411 18.5%$200,000+ 12,486 19.0% 15,255 22.7%
Median Household Income $116,022 $126,425Average Household Income $145,054 $163,050Per Capita Income $49,953 $55,930
Census 2010 2020 2025 Population by Age Number Percent Number Percent Number Percent
0 - 4 11,753 6.6% 11,078 5.8% 11,410 5.8%5 - 9 11,381 6.4% 11,931 6.2% 11,529 5.9%10 - 14 11,508 6.4% 12,631 6.6% 11,993 6.1%15 - 19 11,350 6.4% 10,909 5.7% 11,478 5.8%20 - 24 14,244 8.0% 13,081 6.8% 12,478 6.3%25 - 34 27,153 15.2% 29,308 15.3% 28,875 14.7%35 - 44 27,686 15.5% 28,538 14.9% 30,802 15.7%45 - 54 27,880 15.6% 26,327 13.7% 26,264 13.4%55 - 64 20,343 11.4% 24,004 12.5% 23,327 11.9%65 - 74 9,483 5.3% 15,437 8.0% 17,177 8.7%75 - 84 4,313 2.4% 6,568 3.4% 8,855 4.5%
85+ 1,576 0.9% 2,087 1.1% 2,480 1.3%Census 2010 2020 2025
Race and Ethnicity Number Percent Number Percent Number PercentWhite Alone 94,626 53.0% 92,291 48.1% 89,719 45.6%Black Alone 5,904 3.3% 6,322 3.3% 6,312 3.2%American Indian Alone 622 0.3% 616 0.3% 601 0.3%Asian Alone 59,726 33.4% 71,420 37.2% 77,432 39.4%Pacific Islander Alone 777 0.4% 812 0.4% 818 0.4%Some Other Race Alone 6,728 3.8% 7,986 4.2% 8,445 4.3%Two or More Races 10,285 5.8% 12,453 6.5% 13,341 6.8%
Hispanic Origin (Any Race) 20,275 11.3% 24,010 12.5% 25,854 13.1%Data Note: Income is expressed in current dollars.
Source: U.S. Census Bureau, Census 2010 Summary File 1. Esri forecasts for 2020 and 2025.
February 02, 2021
©2021 Esri Page 5 of 6