12 th November, 2019 Q2FY20 RESULT UPDATE Retail Equity Research Dr. Reddy's Laboratories Limited Pharmaceuticals BSE CODE: 500124 NSE CODE: DRREDDY Bloomberg CODE: DRRD:IN SENSEX: 40,345 12M Investment period Rating as per Large Cap CMP Rs 2,815 TARGET Rs 2,961 RETURN 5% (Closing: 11-11-19) KEY CHANGES: TARGET RATING EARNINGS HOLD www.geojit.com Proprietary product sales help drive revenue growth Q2FY20 consolidated revenues grew 26.1% YoY to Rs 4,813cr, primarily led by a substantial gain in revenues from proprietary products. The global generics business, accounting for 68.2% of total sales, grew 7.3% YoY to Rs 3,284cr. Pharmaceutical services and Active ingredients (PSAI) revenue grew 10.4% YoY to Rs 860cr. Proprietary products revenue stood at Rs 743cr (+861.8% YoY), comprising of gains made during the quarter amounting to Rs. 723cr from licensing fees for three products. Revenue from other business activities was up 4.3% YoY to Rs 66cr. The company reported a 40.1% YoY increase in EBITDA to Rs 1,064cr. Key concall highlights New product launches – In Q2FY20, eight new products were launched, taking the total in H1FY20 to thirteen. In all, the company expects to launch thirty products in FY20. Europe business revenue rose +44.3% YoY to Rs. 276cr aided by strong growth across the region along with higher contribution from new launches. R&D expenditure currently stands at Rs. 366cr in Q2FY20, aided largely by a reduction in expenditure in the proprietary products segment. Management expects effective tax rate for this year to come in below ten percent owing to the recent changes in corporate tax regime; to further boost bottom line. As of Q2FY19, the company has 99 cumulative filings pending for approval with the USFDA (incl. 96 ANDAs and 3 NDAs). Additionally, seven drug master files were filed globally in this quarter. China expected to be a strong counter amid swings in US business Recently, Dr. Reddy’s became the first Indian generic company to successfully land a contract to supply olanzapine in China’s centralised drug procurement program. The management is gearing towards building a pipeline of products for the Chinese market. This can pave way for China contributing a bigger slice of the revenue pie in the future, turning into a counterweight against an unstable revenue stream from the North American region, especially the US market where the company has been subject to warnings issued by the USFDA affecting sales. Valuation We expect earnings to grow at healthy 12% CAGR over FY19-21E. We assign HOLD rating on the stock with a target price of Rs. 2,961 using a target multiple of 20x P/E on FY21E adj. EPS. Company Data Market Cap (cr) Rs.46,705 Enterprise Value (cr) Rs.48,040 Outstanding Shares (cr) 16.6 Free Float 73.0% Dividend Yield 0.7% 52 week high Rs.2,965 52 week low Rs.2,065 6m average volume(‘000) 0.2 Beta 0.3 Face value Rs.5 Shareholding % Q4FY19 Q1FY20 Q2FY20 Promoters 26.8 26.8 26.8 FII’s 30.9 30.7 30.1 MFs/Insti 14.7 14.0 15.2 Public 22.0 22.0 21.8 Others 5.7 6.5 6.2 Total 100.0 100.0 100.0 Promoter pledge 0.0 0.0 0.0 Price Performance 3 Month 6 Month 1 Year Absolute Return 9.5% -1.4% 17.9% Absolute Sensex 9.4% 4.8% 15.7% Relative Return* 0.1% -6.2% 2.2% *over or under performance to benchmark index Consolidated (cr) FY19A FY20E FY21E Sales 15,448 17,069 18,686 Growth (%) 8.2 10.5 9.5 EBITDA 3,178 3,657 4,172 EBITDA Margin (%) 20.6 21.4 22.3 Adj. PAT 1,950 2,644 2,456 Growth (%) 106.0 35.6 (7.1) Adj. EPS 117.3 159.1 147.8 Growth (%) 105.9 35.6 (7.1) P/E 23.2 17.7 19.0 P/B 3.2 2.9 2.5 EV/EBITDA 15.2 13.1 11.1 ROE (%) 13.9 16.2 13.4 D/E 0.2 0.1 0.0 2,100 2,400 2,700 3,000 Nov-18 Feb-19 May-19 Aug-19 Nov-19 DRRD Sensex Rebased One-off gains lead to better than expected result Dr. Reddy’s Laboratories is an Indian pharmaceutical manufacturer. The company is engaged in manufacturing and marketing of over 190 medications, 60+ APIs, as well as diagnostic kits and other biotechnology products. Revenue grew by a significant 26.1% YoY in Q2FY20 to Rs. 4,813cr, and was above street expectations. EBITDA margin grew 220bps YoY to 22.1% while PAT came in at Rs. 1,107cr (+113% YoY vs. Rs. 518cr in 2QFY19) on one-off tax benefit. 8 new products launched in North America in Q2FY20 and 99 pending approval We estimate earnings to grow at 12% CAGR from FY19-21E We assign HOLD rating on the stock with a target price of Rs 2,961 based on 20x FY21E adj. EPS.
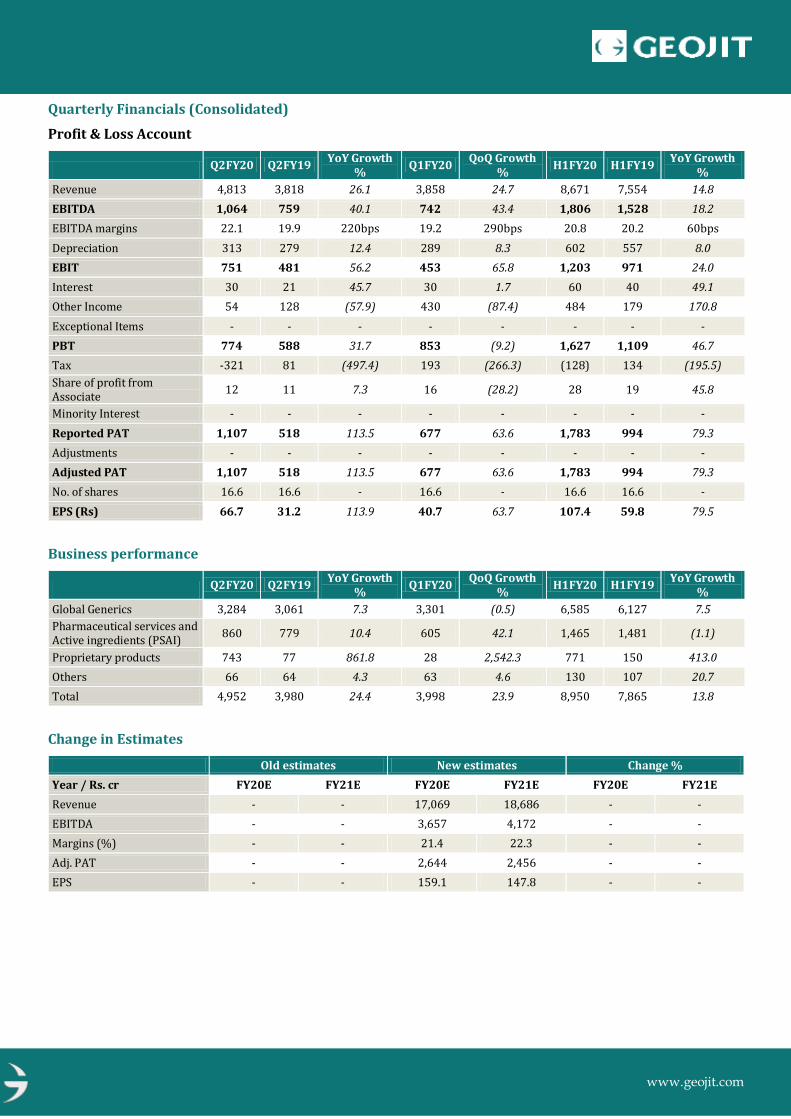
Proprietary product sales help drive revenue growth Q2FY20 consolidated revenues grew 26.1% YoY to Rs 4,813cr, primarily led by a substantial gain in revenues from proprietary products. The global generics business, accounting for 68.2% of total sales, grew 7.3% YoY to Rs 3,284cr. Pharmaceutical services and Active ingredients (PSAI) revenue grew 10.4% YoY to Rs 860cr. Proprietary products revenue stood at Rs 743cr (+861.8% YoY), comprising of gains made during the quarter amounting to Rs. 723cr from licensing fees for three products. Revenue from other business activities was up 4.3% YoY to Rs 66cr. The company reported a 40.1% YoY increase in EBITDA to Rs 1,064cr.
Key concall highlights
New product launches – In Q2FY20, eight new products were launched, taking the total in H1FY20 to thirteen. In all, the company expects to launch thirty products in FY20.
Europe business revenue rose +44.3% YoY to Rs. 276cr aided by strong growth across the region along with higher contribution from new launches.
R&D expenditure currently stands at Rs. 366cr in Q2FY20, aided largely by a reduction in expenditure in the proprietary products segment.
Management expects effective tax rate for this year to come in below ten percent owing to the recent changes in corporate tax regime; to further boost bottom line.
As of Q2FY19, the company has 99 cumulative filings pending for approval with the USFDA (incl. 96 ANDAs and 3 NDAs). Additionally, seven drug master files were filed globally in this quarter.
China expected to be a strong counter amid swings in US business Recently, Dr. Reddy’s became the first Indian generic company to successfully land a contract to supply olanzapine in China’s centralised drug procurement program. The management is gearing towards building a pipeline of products for the Chinese market. This can pave way for China contributing a bigger slice of the revenue pie in the future, turning into a counterweight against an unstable revenue stream from the North American region, especially the US market where the company has been subject to warnings issued by the USFDA affecting sales.
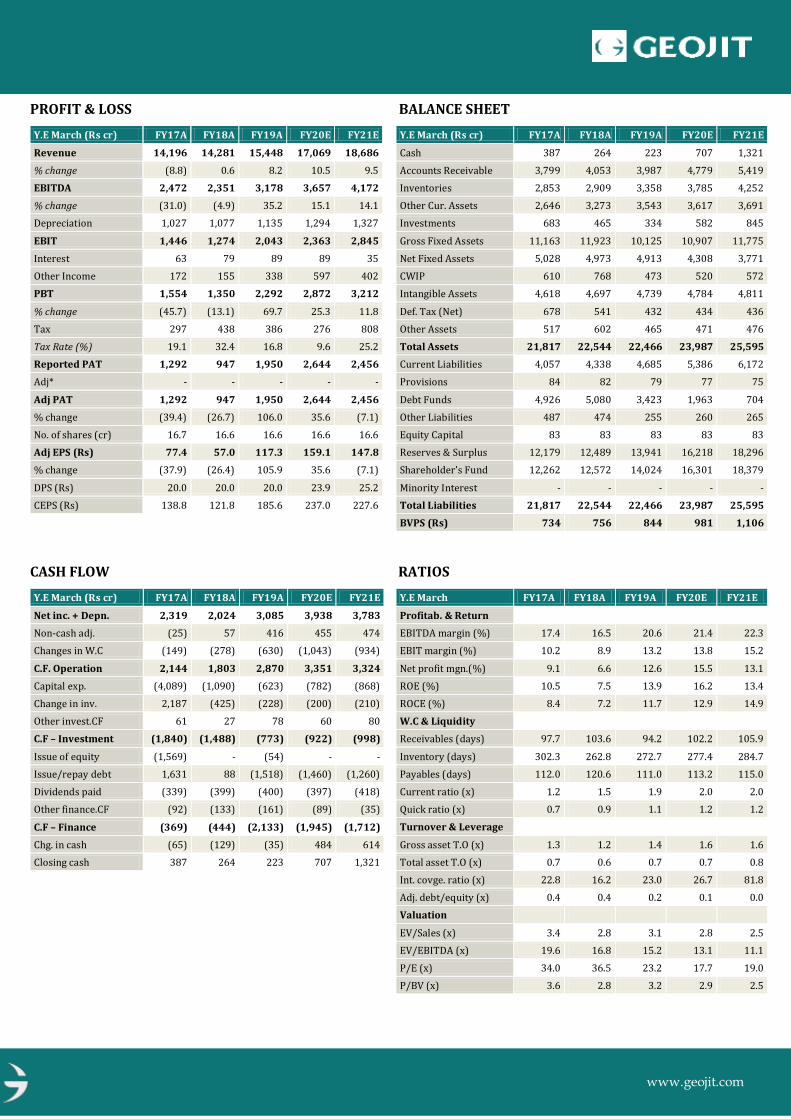
Valuation We expect earnings to grow at healthy 12% CAGR over FY19-21E. We assign HOLD rating on the stock with a target price of Rs. 2,961 using a target multiple of 20x P/E on FY21E adj. EPS.
Company Data Market Cap (cr) Rs.46,705 Enterprise Value (cr) Rs.48,040 Outstanding Shares (cr) 16.6 Free Float 73.0% Dividend Yield 0.7% 52 week high Rs.2,965 52 week low Rs.2,065 6m average volume(‘000) 0.2 Beta 0.3 Face value Rs.5
Dr. Reddy’s Laboratories is an Indian pharmaceutical manufacturer. The company is engaged in manufacturing and marketing of over 190 medications, 60+ APIs, as well as diagnostic kits and other biotechnology products.
Revenue grew by a significant 26.1% YoY in Q2FY20 to Rs. 4,813cr, and was above street expectations.
EBITDA margin grew 220bps YoY to 22.1% while PAT came in at Rs. 1,107cr (+113% YoY vs. Rs. 518cr in 2QFY19) on one-off tax benefit.
8 new products launched in North America in Q2FY20 and 99 pending approval
We estimate earnings to grow at 12% CAGR from FY19-21E
We assign HOLD rating on the stock with a target price of Rs 2,961 based on 20x FY21E adj. EPS.
Shareholder’s Fund 12,262 12,572 14,024 16,301 18,379
Minority Interest - - - - -
Total Liabilities 21,817 22,544 22,466 23,987 25,595
BVPS (Rs) 734 756 844 981 1,106
RATIOS
Y.E March FY17A FY18A FY19A FY20E FY21E
Profitab. & Return
EBITDA margin (%) 17.4 16.5 20.6 21.4 22.3
EBIT margin (%) 10.2 8.9 13.2 13.8 15.2
Net profit mgn.(%) 9.1 6.6 12.6 15.5 13.1
ROE (%) 10.5 7.5 13.9 16.2 13.4
ROCE (%) 8.4 7.2 11.7 12.9 14.9
W.C & Liquidity
Receivables (days) 97.7 103.6 94.2 102.2 105.9
Inventory (days) 302.3 262.8 272.7 277.4 284.7
Payables (days) 112.0 120.6 111.0 113.2 115.0
Current ratio (x) 1.2 1.5 1.9 2.0 2.0
Quick ratio (x) 0.7 0.9 1.1 1.2 1.2
Turnover & Leverage
Gross asset T.O (x) 1.3 1.2 1.4 1.6 1.6
Total asset T.O (x) 0.7 0.6 0.7 0.7 0.8
Int. covge. ratio (x) 22.8 16.2 23.0 26.7 81.8
Adj. debt/equity (x) 0.4 0.4 0.2 0.1 0.0
Valuation
EV/Sales (x) 3.4 2.8 3.1 2.8 2.5
EV/EBITDA (x) 19.6 16.8 15.2 13.1 11.1
P/E (x) 34.0 36.5 23.2 17.7 19.0
P/BV (x) 3.6 2.8 3.2 2.9 2.5
www.geojit.com
Recommendation Summary
Investment Rating Criteria
1,500
1,900
2,300
2,700
3,100
3,500
Nov-16 May-17 Nov-17 May-18 Nov-18 May-19 Nov-19
Dates Rating Target
12-Nov-19 HOLD 2,961
Large Cap Stocks; Buy - Upside is above 10%. Hold - Upside is between 0% - 10%. Reduce - Downside is more than 0%. Neutral - Not Applicable
Mid Cap and Small Cap; Buy - Upside is above 15%. Accumulate - Upside is between 10% - 15%. Hold - Upside is between 0% - 10%. Reduce/Sell - Downside is more than 0%. Neutral - Not Applicable
To satisfy regulatory requirements, we attribute ‘Accumulate’ as Buy and ‘Reduce’ as Sell.
The recommendations are based on 12 month horizon, unless otherwise specified. The investment ratings are on absolute positive/negative return
basis. It is possible that due to volatile price fluctuation in the near to medium term, there could be a temporary mismatch to rating. For reasons of
valuations/return/lack of clarity/event we may revisit rating at appropriate time. Please note that the stock always carries the risk of being upgraded
to BUY or downgraded to a HOLD, REDUCE or SELL.
Neutral- The analyst has no investment opinion on the stock under review
General Disclosures and Disclaimers
CERTIFICATION
I, Dilish K Daniel author of this Report, hereby certify that all the views expressed in this research report reflect our personal views about any or all of the
subject issuer or securities. This report has been prepared by the Research Team of Geojit Financial Services Limited, hereinafter referred to as Geojit.
COMPANY OVERVIEW
Geojit, a publically listed company, is engaged in services of retail broking, depository services, portfolio management and marketing investment products
including mutual funds, insurance and properties. GEOJIT is a SEBI registered Research Entity and as such prepares and shares research data and reports
periodically with clients, investors, stake holders and general public in compliance with Securities and Exchange Board of India Act, 1992, Securities And
Exchange Board Of India (Research Analysts) Regulations, 2014 and/or any other applicable directives, instructions or guidelines issued by the Regulators
from time to time.
DISTRIBUTION OF REPORTS: This document is not for public distribution and has been furnished to you solely for your information and must not be
reproduced or redistributed to any other person. GEOJIT will not treat the recipients of this report as clients by virtue of their receiving this report.
GENERAL REPRESENTATION: The research reports do not constitute an offer or solicitation for the purchase or sale of any financial instruments,
inducements, promise, guarantee, warranty, or as an official confirmation of any transaction or contractual obligations of any kind. This report is provided
for assistance only and is not intended to be and must not alone be taken as the basis for an investment decision. The information contained herein is from
publicly available data or other sources believed to be reliable, but we do not represent that it is accurate or complete and it should not be relied on as such.
We have also reviewed the research report for any untrue statements of material facts or any false or misleading information. While we endeavor to update
on a reasonable basis the information discussed in this material, there may be regulatory, compliance, or other reasons that prevent us from doing so.
RISK DISCLOSURE: GEOJIT and/or its Affiliates and its officers, directors and employees including the analyst/authors shall not be in any way be
responsible for any loss or damage that may arise to any person from any inadvertent error in the information contained in this report. Investors may lose
his/her entire investment under certain market conditions so before acting on any advice or recommendation in these material, investors should consider
whether it is suitable for their particular circumstances and, if necessary, seek professional advice. This report does not take into account the specific
investment objectives, financial situation/circumstances and the particular needs of any specific person who may receive this document. The user assumes
the entire risk of any use made of this information. Each recipient of this report should make such investigation as it deems necessary to arrive at an
independent evaluation of an investment in the securities of companies referred to in this report (including the merits and risks involved). The price, volume
and income of the investments referred to in this report may fluctuate and investors may realize losses that may exceed their original capital.
Source: Bloomberg, Geojit research
www.geojit.com
FUNDAMENTAL DISCLAIMER: We have prepared this report based on information believed to be reliable. The recommendations herein are based on 12 month horizon, unless otherwise specified. The investment ratings are on absolute positive/negative return basis. It is possi ble that due to volatile price fluctuation in the near to medium term, there could be a temporary mismatch to rating. For reasons of valuations/return/lack of clarity/event we may revisit rating at appropriate time. The stocks always carry the risk of being upgraded to buy or downgraded to a hold, reduce or sell. The opinions expressed are subject to change but we have no obligation to tell our clients when our opinions or recommendations change. This report is non-inclusive and does not consider all the information that the recipients may consider material to investments. This report is issued by GEOJIT without any liability/undertaking/commitment on the part of itself or any of its entities. We may have issued or may issue on the compani es covered herein, reports, recommendations or information which is contrary to those contained in this report. The projections and forecasts described in this report should be evaluated keeping in mind the fact that these are based on estimates and assumptions and will vary from actual results over a period of time. The actual performance of the companies represented in the report may vary from those projected. These are not scientifically proven to guarantee certain intended results and hence, are not published as a warranty and do not carry any evidentiary value whatsoever. These are not to be relied on in or as contractual, legal or tax advice. Prospective investors and others are cautioned that any forward-looking statements are not predictions and may be subject to change without notice. CRISIL has provided research support in preparation of this research report and the investment rational contained herein along with financial forecast. The target price and recommendation provided in the report are strictly Geojit’s views and are NOT PROVIDED by CRISIL. Further, CRISIL expresses no opinion on valuation and the associated recommendations. CRISIL has no financial liability whatsoever, to the subscribers / users of this report. JURISDICTION: The securities described herein may not be eligible for sale in all jurisdictions or to all categories of investors. The countries in which the companies mentioned in this report are organized may have restrictions on investments, voting rights or dealings in securities by nationals of other countries. Distributing/taking/sending/dispatching/transmitting this document in certain foreign jurisdictions may be restricted by law, and persons into whose possession this document comes should inform themselves about, and observe any such restrictions. Failure to comply with this restriction may constitute a violation of any foreign jurisdiction laws. Foreign currencies denominated securities are subject to fluctuations in exchange rates that could have an adverse effect on the value or price of or income derived from the investment. Investors in securities such as ADRs, the value of which are influenced by foreign currencies effectively assume currency risk. REGULATORY DISCLOSURES: GEOJIT’s Associates consists of privately held companies such as Geojit Technologies Private Limited (GTPL- Software Solutions provider), Geojit Credits Private Limited (GCPL- NBFC Services provider), Geojit Investment Services Limited (GISL- Corporate Agent for Insurance products), Geojit Financial Management Services Private Limited (GFMSL) & Geojit Financial Distribution Private Limited (GFDPL), (Distributors of Insurance and MF Units).In the context of the SEBI Regulations on Research Analysts (2014), GEOJIT affirms that we are a SEBI registere d Research Entity and in the course of our business as a stock market intermediary, we issue research reports /research analysis etc that are prepared by our Research Analysts. We also affirm and undertake that no disciplinary action has been taken against us or our Analysts in connection with our business activities. In compliance with the above mentioned SEBI Regulations, the following additional disclosures are also provided which may be considered by the reader before making an investment decision: 1. Disclosures regarding Ownership*: GEOJIT confirms that: It/its associates have no financial interest or any other material conflict in relation to the subject company (ies) covered herein. It/its associates have no actual beneficial ownership greater than 1% in relation to the subject company (ies) covered herein. Further, the Analyst confirms that: He, his associates and his relatives have no financial interest in the subject company (ies) covered herein, and they have no other material conflict in the subject company. He, his associates and his relatives have no actual/beneficial ownership greater than 1% in the subject company covered 2. Disclosures regarding Compensation: During the past 12 months, GEOJIT or its Associates: (a) Have not received any compensation from the subject company; (b) Have not managed or co-managed public offering of securities for the subject company (c) Have not received any compensation for investment banking or merchant banking or brokerage services from the subject company (d) Have not received any compensation for products or services other than investment banking or merchant banking or brokerage services from the subjec t company and is in receipt of compensation from the subject company.” (e) Have not received any compensation or other benefits from the subject company or third party in connection with the research report (f) The subject company is / was not a client during twelve months preceding the date of distribution of the research report. 3. Disclosure by GEOJIT regarding the compensation paid to its Research Analyst: GEOJIT hereby confirms that no part of the compensation paid to the persons employed by it as Research Analysts is based on any specific brokerage services or transactions pertaining to trading in securities of companies contained in the Research Reports. 4. Disclosure regarding the Research Analyst’s connection with the subject company: It is affirmed that I, Dilish K Daniel, Research Analyst(s) of GEOJIT have not served as an officer, director or employee of the subject company 5. Disclosure regarding Market Making activity: Neither GEOJIT/its Analysts have engaged in market making activities for the subject company. Please ensure that you have read the “Risk Disclosure Documents for Capital Market and Derivatives Segments” as prescribed by the Securities and Exchange Board of India before investing.
Geojit Financial Services Ltd. (formerly known as Geojit BNP Paribas Financial Services Ltd.), Registered Office: 34/659-P, Civil Line Road, Padivattom,
Kochi-682024, Kerala, India. Phone: +91 484-2901000, Website: www.geojit.com. For investor queries: [email protected], For grievances: