5 RETAIL FUND MARKET TOTAL FUNDS UNDER MANAGEMENT >> The value of funds held by UK investors was £1,045 billion at the end of 2016, increasing by 13% from 2015. >> The increase in overall funds under management (FUM) was largely due to asset appreciation. >> Overseas investors own £66 billion (7%) of UK domiciled funds and UK investors have £105 billion invested in non-UK domiciled funds. RETAIL SALES FLOWS >> Net retail sales to UK investors totalled £4.7 billion in 2016, a significant drop compared to recent years. >> The shift towards outcome-oriented funds continued in 2016 with retail sales of £8.7 billion. The most popular sector within this asset class was Absolute Return as retail investors allocated £5.1 billion of net new money to it. >> Money Market funds had their best-selling year on record as investors allocated an extra £2.4 billion to them. >> Property and Equity funds fared badly as they had net retail outflows of £2.0 billion and £8.1 billion respectively. The bulk of the outflows were in June and July in response to the Brexit referendum. ASSET MIX >> Equities were still the dominant asset class amongst UK investors with equity funds accounting for 54% of total assets in 2016. >> Within equities, the market share of non-UK equity funds increased to 34% while that of UK equity funds fell to 20%. >> Fixed Income funds made up 18% of the market in 2016, down from 21% in 2012. >> Absolute Return funds gained the most in terms of market share, making up 6% of the UK funds market in 2016, compared to 4% in 2012. PASSIVE INVESTMENTS >> Passive funds remained popular with retail investors in 2016 with net retail sales of £4.9 billion. This was a 27% drop from the record £6.7 billion inflow in 2015. DISTRIBUTION >> Platforms continued to dominate retail sales flows in 2016, accounting for almost half of gross retail sales (47%). >> Sales made directly with the fund manager fell 2.5 percentage points to 8.4% in 2016. RETAIL INVESTOR BEHAVIOUR >> The average holding period for UK retail investors has been between three and four years since 2012. INTERNATIONAL CONTEXT >> The UK remains the fifth largest domicile in Europe with 10% of assets by domicile. >> However, the UK is the largest market in Europe in terms of location of asset management activity. KEY FINDINGS THE INVESTMENT ASSOCIATION 60
Transcript
5 RETAil FUNd MARKET
totAL FunDs unDer mAnAGement
>> The value of funds held by UK investors was £1,045 billion at the end of 2016, increasing by 13% from 2015.
>> The increase in overall funds under management (FUM) was largely due to asset appreciation.
>> Overseas investors own £66 billion (7%) of UK domiciled funds and UK investors have £105 billion invested in non-UK domiciled funds.
retAiL sALes FLoWs
>> Net retail sales to UK investors totalled £4.7 billion in 2016, a significant drop compared to recent years.
>> The shift towards outcome-oriented funds continued in 2016 with retail sales of £8.7 billion. The most popular sector within this asset class was Absolute Return as retail investors allocated £5.1 billion of net new money to it.
>> Money Market funds had their best-selling year on record as investors allocated an extra £2.4 billion to them.
>> Property and Equity funds fared badly as they had net retail outflows of £2.0 billion and £8.1 billion respectively. The bulk of the outflows were in June and July in response to the Brexit referendum.
Asset miX
>> Equities were still the dominant asset class amongst UK investors with equity funds accounting for 54% of total assets in 2016.
>> Within equities, the market share of non-UK equity funds increased to 34% while that of UK equity funds fell to 20%.
>> Fixed Income funds made up 18% of the market in 2016, down from 21% in 2012.
>> Absolute Return funds gained the most in terms of market share, making up 6% of the UK funds market in 2016, compared to 4% in 2012.
pAssiVe inVestments
>> Passive funds remained popular with retail investors in 2016 with net retail sales of £4.9 billion. This was a 27% drop from the record £6.7 billion inflow in 2015.
Distribution
>> Platforms continued to dominate retail sales flows in 2016, accounting for almost half of gross retail sales (47%).
>> Sales made directly with the fund manager fell 2.5 percentage points to 8.4% in 2016.
retAiL inVestor beHAViour
>> The average holding period for UK retail investors has been between three and four years since 2012.
internAtionAL ConteXt
>> The UK remains the fifth largest domicile in Europe with 10% of assets by domicile.
>> However, the UK is the largest market in Europe in terms of location of asset management activity.
KeY FinDinGs
ThE iNVESTMENT ASSoCiATioN
60
61
uK inVestor FunDs unDer mAnAGement
Funds held by UK investors surpassed the £1 trillion level in August 2016 and had reached £1,045 billion by the end of the year - an increase of 13% from 2015. In the five years since the IA began collecting data on a UK investor basis, funds under management have grown by 66% (see Chart 38).
CHArt 38: inDustrY FunDs unDer mAnAGement (2007-2016)
!"#
$!"#
%!"#
&!"#
'!"#
(!"#
)!"#
*!"#
2007 2008 2009 2010 2011 2012 2013 2014 2015 2016
Retail Investors Institutional Investors
1,200
1,000
800
600
400
200
0
£bn
Looking at the assets UK investors have allocated to UK and overseas domiciled funds, Chart 39 shows that at the end of 2016 £940 billion was held in UK domiciled funds and £105 billion in overseas domiciled funds (see Chart 39). More importantly, the amount of money UK investors are investing in overseas funds has been increasing slowly but steadily in the last five years, rising from 8% in 2012 to 10% in 2016.
ASSET MANAGEMENT SURVEY 2016-17 | retAiL FunD mArKet
5
This Chapter looks at the long-term trends in the UK retail fund market. This includes funds that are available for sale to retail investors in the UK and domiciled either in the UK or overseas. This area of the industry has seen significant growth in sales and investment return since the financial crisis of 2008. The Chapter covers a number of aspects of the retail market with particular focus on asset allocation, retail investor behaviour in terms of sector preferences and holding periods, the evolution of passive funds and the shape and concentration of the market.36
In 2016 the Investment Association changed the way it reports fund data from a UK domiciled basis to a UK investor basis. The UK investor basis provides greater insight into the investment habits of fund investors in the UK by assessing their investments in both UK and overseas domiciled funds. This is done by removing overseas investor flows and holdings from UK-domiciled funds and capturing UK investor flows and holdings in overseas-domiciled funds.
This dataset is the primary source of information for this chapter and includes monthly sales flow and fund asset information for 4,060 funds domiciled in the UK and abroad. The UK investor data set has been backdated to 2012. Prior to that figures are calculated on a UK-domiciled basis.
boX 6: CHAnGes to retAiL FunD mArKet DAtA For 2016
36 Both retail and institutional investors can buy authorised funds; our data shows that in 2016 retail investors accounted for 65% and institutional investors for 35% of gross sales. Retail sales are made through various distribution channels, including sales made direct to the investor by the fund group, via IFAs and wealth managers or through fund platforms and stockbrokers. Sales made by insurance and life companies, pension funds and fund of funds are treated as institutional.
ThE iNVESTMENT ASSoCiATioN
62
CHArt 39: uK inVestor Fum bY FunD DomiCiLe
!"#
$!"#
%!"#
&!"#
'!"#
(!"#
)!"#
*!"#
2012 2013 2014 2015 2016
UK investors in UK domiciled funds UK investors in overseas domiciled fundsProportion of overseas domiciled funds (RH)
1,200
1,000
800
600
400
200
0
£bn
12%
10%
8%
6%
4%
2%
0%
By comparison, looking at the assets in UK domiciled funds, overseas investors held £66 billion at the end of 2016, equivalent to 7% of UK domiciled funds (see Chart 40). This proportion has also increased from five years ago albeit the last three years have been relatively unchanged at 7%.
CHArt 40: uK DomiCiLeD Fum bY inVestor resiDenCe
!"#
$!"#
%!"#
&!"#
'!"#
(!"#
)!"#
*!"#
2012 2013 2014 2015 2016
UK investors in UK domiciled fundsOverseas investors in UK domiciled fundsProportion of overseas investors (RH)
1,200
1,000
800
600
400
200
0
£bn
8%
7%
6%
5%
4%
3%
2%
1%
0
Chart 41 shows the industry FUM from 1980-2016 along with the two drivers of FUM growth, net sales and asset appreciation. Over this time period there has never been a year of negative net sales in the UK funds industry. Moreover, although returns have been volatile, and negative, at times, particularly around the dot com and credit crises, they contributed significantly to the appreciation of industry assets.
Net sales, both retail and institutional, were £11.3 billion in 2016 the lowest since 2008 when total net sales were £202 million. Asset appreciation, however, was the highest on record at £106 billion, providing an equivalent return to investors of 11% over the year.
CHArt 41: DriVers oF inDustrY GroWtH (1980-2016)
!"#
$!"#
%!"#
&!"#
'!"#
(!"#
)!"#
*!"#
1980
1982
1984
1986
1988
1990
1992
1994
1996
1998
2000
2002
2004
2006
2008
2010
2012
2014
2016
Industry funds under management Net Sales Asset appreciation
1,200
1,000
800
600
400
200
0
£bn
STR
ON
G
EQ
UIT
Y M
AR
KE
TS
DO
T.C
OM
CR
ISIS
CR
ED
IT
CR
ISIS
RE
CO
RD
S
ALE
S
RE
CO
VER
Y
Looking at industry growth throughout 2016, the asset appreciation occurred largely in the second half of the year. This reflects the depreciation of sterling that followed the EU referendum.
Chart 42 shows the impact of the cumulative monthly value of net sales and asset appreciation on FUM since the end of 2015.
63
ASSET MANAGEMENT SURVEY 2016-17 | retAiL FunD mArKet
5
CHArt 42: Contribution to Fum GroWtH 2016 (CumuLAtiVe montHLY)
140
120
100
80
60
40
20
0
-20
-40
£bn
Net Sales Asset appreciation Industry funds under management (RHS £ bn)
1,100
1,050
1,000
950
900
850
800Jan Feb Mar Apr May Jun Jul Aug Sep Oct Nov Dec
indUsTry fUnds Under managemenT by asseT class
The asset class breakdown of the UK funds industry has been largely unchanged since 2015, (see Chart 43), with only one exception. The UK equity market share fell by 3% while Non-UK equity funds grew by 2%. There are several reasons for this;
• Although net retail sales of non-UK equity funds were negative in 2016, they were not as negative as UK equity fund sales.
• Equity funds tend not to be currency hedged, and funds invested outside of the UK but valued in sterling benefited from the fact that sterling weakened versus all major currencies in 2016.
CHArt 43: FunDs unDer mAnAGement bY FunD/Asset tYpe
Other 1.5% Non-UK equity
34.1%
UK equity 20.1%
Fixed income 17.6%
Mixed assets16.6%
Other 11.6%
Protected funds 0.1%
Property 2.2%
Targeted absolute return 6.1%
Money market 1.7%
The longer term trend in asset class breakdown is shown in Chart 44. The market share of equity funds has been declining compared to other strategies. Over the last 20 years the equity fund share has fallen from 51% of FUM in 1997 to 20% in 2016. Notably however, Non-UK equities have remained relatively stable over that same time period, ranging between 28%-36%.
Mixed Asset funds grew at a steady rate to reach 17% in 2012, but have fallen below 17% in the last three years and their market share in 2016 stood at 16.6%. The market share of fixed income funds peaked in 2012 at 21% but has been declining slightly since, standing at 17.6% in 2016.
Funds in the Other category include Absolute Return and Property, which have been very popular with investors in recent years, and the IA Unclassified sector.37 Volatility managed funds featured in this sector during 2016. This strategy has seen high growth in recent years and to reflect this change in the industry the IA launched a Volatility Managed sector in April 2017 consisting of 87 funds and accounting for £20 billion in FUM.
37 Funds in the Unclassified sector may not meet the requirements of an existing sector, may not be widely available for retail investment or members may feel are not fairly comparable to mainstream strategies in our sectors.
ThE iNVESTMENT ASSoCiATioN
64
CHArt 44: Asset CLAss Fum % breAKDoWn (1997-2016)
1997
1998
1999
2000
2001
2002
2003
2004
2005
2006
2007
2008
2009
2010
2011
2012
2013
2014
2015
2016
Non-UK Equity UK Equity Fixed IncomeMixed Asset Other
100%
90%
80%
70%
60%
50%
40%
30%
20%
10%
0%
retAiL FunD sALes
Net retail sales were £4.7 billion in 2016, the lowest since 1995 (not adjusted for inflation) and down by 72% from 2015.
CHArt 45: net retAiL sALes (1997-2016)
Actual sales In�ation adjustment Average 5 year in�ow
40
35
30
25
20
15
10
5
0
£bn!"#$
1997
1998
1999
2000
2001
2002
2003
2004
2005
2006
2007
2008
2009
2010
2011
2012
2013
2014
2015
2016
Credit crisisDot.com bubble Brexit
Source: IA, ONS
Chart 46 shows gross annual sales made by UK investors in UK domiciled and overseas domiciled funds. In 2016, 16% of UK Investor sales were made into overseas domiciled funds with the majority of the money going into money market funds. In absolute terms, £29 billion was allocated to overseas funds by UK investors in 2016, up from £22 billion in 2012.
CHArt 46: uK inVestor Gross sALes bY FunD DomiCiLe (2012-2016)
!"#
$!"#
%!"#
&!"#
'!"#
(!"#
)!"#
*!"#
2012 2013 2014 2015 2016
UK investor into UK domiciled UK investor into overseas domiciled Proportion of overseas domiciled funds (RH)
200
160
120
80
40
0
£bn
20%
16%
12%
8%
4%
0%
net retAiL sALes Were
£4.7 billioN
in 2016
65
ASSET MANAGEMENT SURVEY 2016-17 | retAiL FunD mArKet
5
a shifT in invesTor obJecTives
Chart 47 shows the annual net retail sales over 20 years for various strategies; Equity Income, Equity Growth, Outcome and Allocation, Fixed Income and Property.
Outcome and allocation funds are arguably an industry success story as they have received positive annual net retail sales each year in the last two decades. The peak was in 2011 when net retail sales into these funds were £11.4 billion while 2016 was the most successful year since then with £8.7 billion in net retail sales.
Fixed income funds have also been popular since the 2008 financial crisis. 2015 was the only time in the last 20 years that fixed income funds experienced a net retail outflow. 2016 was a better year with a net retail inflow of £3.8 billion.
Notably, 2016 was a clear outlier for Equity Growth and Property funds. The only other year when there was a net retail outflow for these strategies was 2008. Although the outflows from these strategies look severe in this chart it should be noted that these are absolute sales numbers and the industry is three times as large in 2016 as it was in 2008.
CHArt 47: net retAiL sALes bY DiFFerent inVestment objeCtiVe (1997-2016)
Equity Growth Equity Income Fixed IncomeOutcome and allocation Property
35
30
25
20
15
10
5
0
-5
-10
-15
£bn
1997
1998
1999
2000
2001
2002
2003
2004
2005
2006
2007
2008
2009
2010
2011
2012
2013
2014
2015
2016
Looking more closely into the monthly developments in 2016, it is clear that equity growth funds were consistently unpopular throughout 2016, but the large outflows occurred in June and July around the EU referendum, when there were also significant outflows from Property funds (see Chart 48). Flows into Outcome and Allocation funds were positive for the majority of the year, a sign that investors were probably seeking professional asset allocation skills. The relative safety of fixed income was also evident with investors allocating to bonds in the spring and again after the EU referendum.
CHArt 48: net retAiL sALes bY inVestment objeCtiVe (2016)
Equity Growth Equity Income Fixed IncomeOutcome and allocation Property
3
2
1
0
-1
-2
-3
-4
-5
£bn
Jan Feb Mar Apr May Jun Jul Aug Sep Oct Nov Dec
ThE iNVESTMENT ASSoCiATioN
66
The conTinUing demand for income
Chart 49 shows that the demand for income generating investment strategies continues to be strong with a renewed interest in fixed income funds in 2016 despite valuation levels. Across equity, bond and mixed asset income-focused funds there was a total net retail inflow of £5.8 billion.
Investors were allocating to equity income funds even in light of the overall outflows from equity funds altogether in 2016. Demand for fixed income funds reversed from the net retail outflow in 2015, however investor demand for bonds is not necessarily driven by a need for income generation. Mixed Asset income funds are only a small part of the mixed asset universe but still contributed over £1 billion to net retail sales in 2016.
CHArt 49: net retAiL sALes oF inCome-FoCuseD FunDs (2007–2016)
Fixed income funds Equity income funds Mixed Asset income funds
10
8
6
4
2
0
-2
-4
£bn
2007 2008 2009 2010 2011 2012 2013 2014 2015 2016
eQUiTy fUnds
Chart 50 showed that equities suffered their worst year on record in terms of net retail sales as investors pulled £8.1 billion from the asset class in 2016. During the months of June and July, which saw the biggest outflows, only two sectors, Japanese Smaller Companies and North American Smaller Companies had positive net sales with £17 million and £5 million respectively. In July there were small inflows into China, Global and UK Equity Income sectors.
Although 2016 was a difficult year in terms of sales, asset appreciation added £86 billion to the value of equity funds, equivalent to an annual return of 15% so that overall equity FUM increased (see Chart 50). FUM for equity funds, including fund of funds, grew by 5.5%, £30 billion.
CHArt 50: equitY FunDs Contribution to Fum GroWtH (2007-2016)
Net Sales Asset appreciation
150
100
50
0
-50
-100
-150
£bn
2007 2008 2009 2010 2011 2012 2013 2014 2015 2016
67
ASSET MANAGEMENT SURVEY 2016-17 | retAiL FunD mArKet
5
tAbLe 5: sALes AnD Fum oF equitY seCtors Gross Retail Net Retail FUM Sales (£m) Sales (£m) (£m)
Global 13,000 2,458 85,718
UK Equity Income 10,594 935 57,555
Global Emerging Markets 3,122 295 19,032
North American Smaller Companies 557 103 2,210
Japanese Smaller Companies 317 63 641
Unclassified Sector 3,332 29 73,152
Global Equity Income 3,084 -4 15,593
Asia Pacific Including Japan 88 -48 563
Technology and Telecommunications 375 -54 1,741
Specialist 6,954 -133 44,679
China/Greater China 399 -299 2,040
European Smaller Companies 647 -330 2,893
Europe Including UK 195 -348 1,736
UK Smaller Companies 2,013 -495 12,501
North America 8,725 -502 47,314
Asia Pacific Excluding Japan 4,452 -602 30,585
Japan 4,604 -975 19,096
Europe Excluding UK 6,961 -2,890 49,158
UK All Companies 18,222 -5,357 162,982
geographical breaKdown of eQUiTy fUnds
Net retail sales were negative for both UK and non-UK equity funds, however the outflows from non-UK equity funds were smaller (see Chart 51). More importantly, non-UK equity funds have sold more, or lost less, than UK equity funds every year since 2006.
CHArt 51: net retAiL sALes oF uK AnD non-uK equitY FunDs (1997-2016)
UK equity - actual sales UK equity - in�ation adjustmentNon-UK equity - actual sales Non-UK equity - in�ation adjustment
20
15
10
5
0
-5
-10
1997
1998
1999
2000
2001
2002
2003
2004
2005
2006
2007
2008
2009
2010
2011
2012
2013
2014
2015
2016
£bn
In terms of specific geographic regions, Global was the only equity region to record a net retail inflow in 2016 with £2.6 billion of new retail money flowing into that sector (see Chart 52). Within that, Global was the best-selling equity sector in 2016 with a net retail inflow of £2.5 billion. This is indicative of investors’ preference for diversified funds and desire for professional asset allocation decision making, but also the recent strong positive returns.
UK-focused equity funds were the worst affected as investors withdrew £4.9 billion. The UK All Companies sector took the brunt of the outflows with £5.4 billion being redeemed by retail investors. Moreover, UK Smaller Companies also experienced an outflow of £495 million. However, as discussed above, investor demand for income superseded other concerns as investors continued to allocate to the UK Equity Income sector which saw £935 million in net retail sales.
ThE iNVESTMENT ASSoCiATioN
68
CHArt 52: net retAiL sALes oF equitY FunDs bY reGionAL FoCus (2007-2016)
UK North America Japan Europe Asia Global
15
10
5
0
-5
-10
-15
£bn
2007 2008 2009 2010 2011 2012 2013 2014 2015 2016
European equities were particularly unpopular with UK investors in 2016 as they redeemed £3.6 billion from European-focused funds. There were monthly outflows from European equity funds every month in 2016 with the exception of January as investors were put off by the continuing economic problems in Europe and the spectre of another possible banking crisis (see Chart 53).
CHArt 53: net equitY sALes bY reGion (2016)
UK North America Japan Europe Asia Global
1,500
1,000
500
0
-500
-1,000
-1,500
-2,000
-2,500
-3,000
£m
Jan Feb Mar Apr May Jun Jul Aug Sep Oct Nov Dec
fixed income fUnds
Fixed income funds received net retail sales of £3.8 billion in 2016, the highest annual sales into the asset class since 2012 as investors sought safety in bonds. There were negative net retail sales in the first two months of 2016 but flows were then positive until November. The relative safety of bonds and an expected interest rate cut attracted investors to fixed income funds in July and August following the EU Referendum with £1.1 billion and £1.2 billion in net retail sales respectively.
Chart 54 plots net retail sales for fixed income funds vs the benchmark 10 year gilt yield. It shows the trend for positive net sales into fixed income funds during periods of falling bond yields (2010-2012) and subdued sales in 2013 with rising yields. Q3 2015 is an anomaly in this pattern as a spike in corporate bond yields caused investors to reject the asset class.
The trend remains in place in 2016 as gilt yields fell throughout the year, particularly in the second half of the year following a rate cut from the Bank of England, net sales were highly positive.
CHArt 54: ten YeAr GiLt YieLD Vs. FiXeD inCome sALes (2010-2016)
4,000
3,000
2,000
1,000
0
-1,000
-2,000
-3,000
£m
Q1
2010
Q2
2010
Q3
2010
Q4
2010
Q1
2011
Q2
2011
Q3
2011
Q4
2011
Q1
2012
Q2
2012
Q3
2012
Q4
2012
Q1
2013
Q2
2013
Q3
2013
Q4
2013
Q1
2014
Q2
2014
Q3
2014
Q4
2014
Q1
2015
Q2
2015
Q3
2015
Q4
2015
Q1
2016
Q2
2016
Q3
2016
Q4
2016
Fixed Income Net Retail Sales £'s Ten year gilt yield (RH)
4.0
3.5
3.0
2.5
2.0
1.5
1.0
0.5
0.0
%
69
ASSET MANAGEMENT SURVEY 2016-17 | retAiL FunD mArKet
5
tAbLe 6: sALes AnD Fum oF FiXeD inCome seCtors Gross Retail Net Retail FUM sales (£m) sales (£m) (£m)
£ Corporate Bond 11,242 1,583 60,084
£ High Yield 2,295 -247 10,988
£ Strategic Bond 8,526 910 36,827
Global Bonds 5,383 1,020 22,502
Global Emerging Markets Bond 971 -185 5,556
UK Gilts 2,684 728 20,917
UK Index Linked Gilts 1,521 135 5,719
Unclassified Sector 3,703 -138 42,175
CHArt 55: net retAiL sALes oF FiXeD inCome FunDs (1997–2016)
All bonds (pre 2008) Other bonds UK government Global bonds £ Corporate bonds £ Strategic bonds
12
10
8
6
4
2
0
-2
-4
1997
1998
1999
2000
2001
2002
2003
2004
2005
2006
2007
2008
2009
2010
2011
2012
2013
2014
2015
2016
£bn
Chart 56 shows the contribution made to growth in fixed income FUM by sales and asset appreciation. In 2016 we saw that net sales, retail and institutional, contributed £8.7 billion to fixed income funds while assets grew by £14.7 billion, equivalent to a return of 8%. This is in sharp contrast to 2015 when both sales and asset appreciation were negative.
CHArt 56: FiXeD inCome FunDs Contribution to Fum GroWtH (2007-2016)
Net Sales Asset appreciation
30
25
20
15
10
5
0
-5
-10
£bn
2007 2008 2009 2010 2011 2012 2013 2014 2015 2016
ThE iNVESTMENT ASSoCiATioN
70
mixed asseT fUnds
The popularity of mixed asset funds amongst retail investors did not lessen in 2016, as they received £2.6 billion of net inflows (see Chart 57). Mixed Asset funds are popular with regular savers and financial advisers as they can outsource asset allocation and research to professional investors. This has been crucial through recent uncertain times with the ever changing political and economic landscape.
CHArt 57: net retAiL sALes oF Asset ALLoCAtion FunDs (2007–2016)
Annual retail flows into mixed asset funds have never been negative, in fact there have only been five months in the past 15 years where mixed asset funds have experienced a net retail outflow.
tAbLe 7: sALes AnD Fum oF miXeD Asset seCtors Gross Retail Net Retail FUM sales (£m) sales (£m) (£m)
Flexible Investment 3,985 380 24,222
Mixed Investment 0-35% Shares 2,067 855 6,083
Mixed Investment 20-60% Shares 8,594 88 43,518
Mixed Investment 40-85% Shares 6,136 1,070 47,128
UK Equity and Bond Income 254 -143 2,405
Unclassified Sector 13,457 351 69,215
tHe miXeD inVestment 40-85%
sHAres seCtor reCeiVeD tHe HiGHest inFLoW At
£1.1 biLLion
71
ASSET MANAGEMENT SURVEY 2016-17 | retAiL FunD mArKet
5
With the exception of UK Equity and Bond Income, all mixed asset sectors received positive net retail sales in 2016 (see Chart 58).
• The Mixed Investment 40-85% Shares sector received the highest inflow at £1.1 billion, similar to 2015’s inflow.
• The Mixed Investment 0-35% Shares sector received £855 million in 2016, the highest annual net inflow since the sector was launched in 2012.
• £88 million of retail money flowed into the Mixed Asset 20-60% Shares sector, the lowest since the sector was launched, and a significant reduction on recent years when this sector has been the most popular and attracted net flows in the billions.
• Mixed asset funds in the Unclassified sector received £351 million in net retail sales.
CHArt 58: net retAiL sALes oF miXeD Asset FunDs Vs Ftse ALL-sHAre inDeX (2002-2016)
Mixed Investment 0-35% Shares UK Equity and Bond Income Flexible Investment Mixed Investment 20-60% Shares Mixed Investment 40-85% Shares Other FTSE All-Share CR index (RH)
10
8
6
4
2
0
-2
2002
2003
2004
2005
2006
2007
2008
2009
2010
2011
2012
2013
2014
2015
2016
£bn
180
160
140
120
100
80
60
40
20
0
absolUTe reTUrn fUnds
For the second year in a row Targeted Absolute Return was the best-selling sector amongst retail investors with £5.1 billion in net retail sales in 2016.
Chart 59 shows the net retail sales and market share of absolute return funds. Although targeted absolute return funds received a considerable amount of net sales growth they lost market share slightly as long-only funds in the IA’s fund universe experienced higher growth in asset appreciation terms.
CHArt 59: quArterLY net retAiL sALes oF tArGeteD AbsoLute return FunDs Vs tArGeteD AbsoLute return FunDs unDer mAnAGement (2008-2017)
Net retail sales Targeted absolute return funds as percentage of total funds under management (RH)
1,600
1,400
1,200
1,000
800
600
400
200
0
-200
Q2
2008
Q4
2008
Q2
2009
Q4
2009
Q2
2010
Q4
2010
Q2
2011
Q4
2011
Q2
2012
Q4
2012
Q2
2013
Q4
2013
Q2
2014
Q4
2014
Q2
2015
Q4
2015
Q2
2016
Q4
2016
£m
7%
6%
5%
4%
3%
2%
1%
0%
ThE iNVESTMENT ASSoCiATioN
72
money marKeT fUnds
Retail money market funds received their highest annual net retail sales on record in 2016, an indication of cautious investors allocating more of their portfolios to cash. Chart 60 shows UK retail investors allocated an extra £2.4 billion to money market funds in 2016, which was a 236% increase on 2015.
CHArt 60: net retAiL sALes oF moneY mArKet FunDs (2007-2016)
Net Retail Sales FUM (RH)
3
2
2
1
1
0
-1
£bn
16
14
12
10
8
6
4
2
0
£bn
2007 2008 2009 2010 2011 2012 2013 2014 2015 2016
properTy fUnds
Property funds were negatively affected by the result of the EU referendum. Large scale redemptions meant many funds had to take action to slow or stop outflows. Prior to these actions there were net retail outflows of £1 billion and £419 million in June and July respectively.
Chart 61 shows the scale of these flows in historical context and June and July 2016 are clear outliers.38
CHArt 61: net retAiL sALes oF propertY FunDs Vs ipD uK ALL propertY inDeX (1997-2016)
4%
3%
2%
1%
0%
-1%
-2%
-3%
-4%
1997
1998
1999
2000
2001
2002
2003
2004
2005
2006
2007
2008
2009
2010
2011
2012
2013
2014
2015
2016
30%
20%
10%
0%
-10%
-20%
-30%
Net retail sales of property funds as a percentage of property funds under managementAnnual percentage change in IPD UK All Property Index (RH)
passive fUnds
Passive funds had another good year in terms of net retail sales as UK investors allocated £4.9 billion to them (£5.5 billion including fund of funds, which will also capture passively-managed mixed asset funds). FUM for passive products increased by £38 billion, or 33%. As Chart 62 shows asset appreciation was primarily responsible for this growth in assets, contributing £32 billion, a return equivalent to 28%.
CHArt 62: Contribution to FunDs unDer mAnAGement in pAssiVe FunDs (2007-2016)
Asset appreciation Net Sales Tracker funds under management (RH)
180
160
140
120
100
80
60
40
20
0
£bn
2007 2008 2009 2010 2011 2012 2013 2014 2015 2016
50
40
30
20
10
0
-10
-20
£bn
38 Net retail sales of property funds are shown as a six month moving average of net retail sales as a percentage of property funds under management over the period. The IPD UK All Property index performance is charted as the year-on-year change of the monthly total return index.
73
ASSET MANAGEMENT SURVEY 2016-17 | retAiL FunD mArKet
5
Examining how the passive FUM developed over 2016 in more detail, Chart 63 shows the high returns that were on offer in June around the EU referendum when UK equity markets initially dropped and were then boosted by the depreciation of sterling.
CHArt 63: Contribution to pAssiVe Fum GroWtH (montHLY)
Net Sales Asset appreciation Tracker funds under management (RH)
160
140
120
100
80
60
40
20
0
£bn
Jan-
16
Feb-
16
Mar
-16
Apr
-16
May
-16
Jun-
16
Jul-
16
Aug-
16
Sep
-16
Oct
-16
Nov
-16
Dec
-16
16
14
12
10
8
6
4
2
0
-2
-4
-6
£bn
The composition of the passive fund market in the UK has changed considerably over the past ten years. In 2007 UK equities accounted for 70% of funds under management. By 2016 the UK equity market share had fallen to 36% (see Chart 64). The reallocation of assets across sectors is evenly spread, with all increasing their market share over the ten year period except European equities, which have retained a steady 8% market share throughout.
However, equity as an asset class still represents the largest part of the passive fund market with 94 out of 134 funds that account for 71% in passive FUM.
Another notable change is the introduction of mixed asset passive products, which are mainly passively managed funds of funds. The market share of these funds leapt in 2015 from 2% to 9%, and has remained at 9% in 2016.
CHArt 64: FunDs unDer mAnAGement oF pAssiVe FunDs bY inDeX inVestment tYpe
UK equity International/Global equityNorth American equity Fixed incomeMixed Asset European equityOtherTrackers as percentage of industry funds under management (RH)
180
160
140
120
100
80
60
40
20
0
£bn
2007 2008 2009 2010 2011 2012 2013 2014 2015 2016
14%
12%
10%
8%
6%
4%
2%
0%
Chart 65 shows International/Global equity was the top selling sector within passive funds in 2016 as UK clients invested £1.8 billion into these strategies.
CHArt 65: net retAiL sALes oF pAssiVe FunDs bY inDeX inVestment tYpe (2007-2016)
European equity North American equityUK equity Fixed incomeMixed Asset OtherInternational/Global equity
7
6
5
4
3
2
1
0
-1
£bn
2007 2008 2009 2010 2011 2012 2013 2014 2015 2016
ThE iNVESTMENT ASSoCiATioN
74
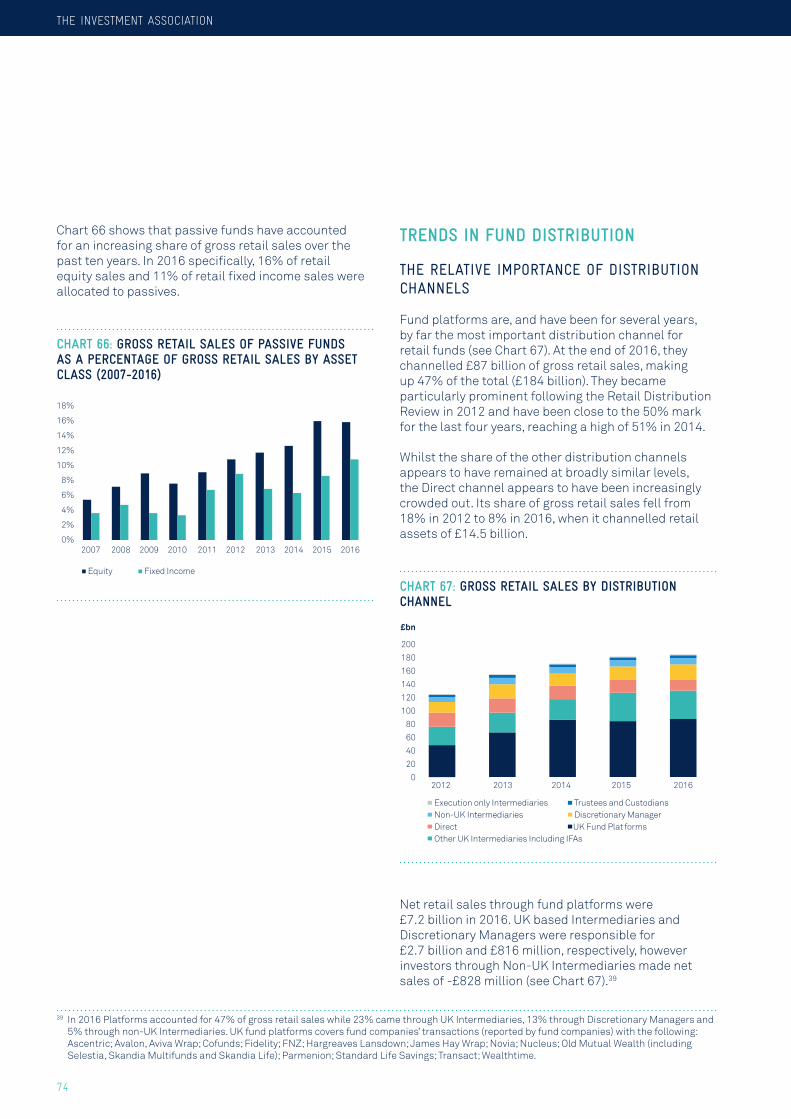
Chart 66 shows that passive funds have accounted for an increasing share of gross retail sales over the past ten years. In 2016 specifically, 16% of retail equity sales and 11% of retail fixed income sales were allocated to passives.
CHArt 66: Gross retAiL sALes oF pAssiVe FunDs As A perCentAGe oF Gross retAiL sALes bY Asset CLAss (2007-2016)
Fund platforms are, and have been for several years, by far the most important distribution channel for retail funds (see Chart 67). At the end of 2016, they channelled £87 billion of gross retail sales, making up 47% of the total (£184 billion). They became particularly prominent following the Retail Distribution Review in 2012 and have been close to the 50% mark for the last four years, reaching a high of 51% in 2014.
Whilst the share of the other distribution channels appears to have remained at broadly similar levels, the Direct channel appears to have been increasingly crowded out. Its share of gross retail sales fell from 18% in 2012 to 8% in 2016, when it channelled retail assets of £14.5 billion.
CHArt 67: Gross retAiL sALes bY Distribution CHAnneL
Execution only Intermediaries Trustees and Custodians Non-UK Intermediaries Discretionary Manager Direct UK Fund Plat formsOther UK Intermediaries Including IFAs
200
180
160
140
120
100
80
60
40
20
0
£bn
2012 2013 2014 2015 2016
Net retail sales through fund platforms were £7.2 billion in 2016. UK based Intermediaries and Discretionary Managers were responsible for £2.7 billion and £816 million, respectively, however investors through Non-UK Intermediaries made net sales of -£828 million (see Chart 67).39
39 In 2016 Platforms accounted for 47% of gross retail sales while 23% came through UK Intermediaries, 13% through Discretionary Managers and 5% through non-UK Intermediaries. UK fund platforms covers fund companies’ transactions (reported by fund companies) with the following: Ascentric; Avalon, Aviva Wrap; Cofunds; Fidelity; FNZ; Hargreaves Lansdown; James Hay Wrap; Novia; Nucleus; Old Mutual Wealth (including Selestia, Skandia Multifunds and Skandia Life); Parmenion; Standard Life Savings; Transact; Wealthtime.
75
ASSET MANAGEMENT SURVEY 2016-17 | retAiL FunD mArKet
5
Net retail sales made directly with the fund management company were negative at -£4.5 billion. This was the third year in a row that direct sales have been negative and it is not altogether a surprising trend as non-advised investors have many more options in the way they can invest their money than they used to, not least due to improvements in technology and the rise in platforms. It may also be the case that investors that formerly invested directly have decided to take on an adviser perhaps after retirement or as their investment needs have become more complex. In any case, this would appear to be consistent with the above finding that Direct has been increasingly crowded out by other distribution channels (see Chart 68).
CHArt 68: net retAiL sALes bY Distribution CHAnneL (AnnuAL)
Execution only Intermediaries Trustees and Custodians Non-UK Intermediaries Discretionary Manager Direct UK Fund Plat formsOther UK Intermediaries Including IFAs
30
25
20
15
10
5
0
-5
-10
£bn
2012 2013 2014 2015 2016
The role of fUnd of fUnds
Chart 69 shows the fund of funds model still proves to be popular with investors as FUM increased to £123 billion in 2016 from £106 billion in 2015. Total sales into fund of funds were £6.1 billion in 2016, with £1.8 billion being through retail channels and £4.3 billion through institutional channels. Asset appreciation contributed £11.5 billion in FUM in 2016 translating to a return of 11% for fund of fund investors.
CHArt 69: Contribution to Fum in FunD oF FunDs (2007-2016)
Net Sales Asset appreciation Fund of funds under management (RHS)
2007 2008 2009 2010 2011 2012 2013 2014 2015 2016
20
15
10
5
0
-5
-10
£bn
140
120
100
80
60
40
20
0
£bn
CHArt 70: net retAiL sALes oF FettereD AnD unFettereD FunD oF FunDs (1997-2016)
8
7
6
5
4
3
2
1
0
1997
1998
1999
2000
2001
2002
2003
2004
2005
2006
2007
2008
2009
2010
2011
2012
2013
2014
2015
2016
Fettered Unfettered
£bn
ThE iNVESTMENT ASSoCiATioN
76
uK retAiL FunDs inDustrY struCture AnD ConCentrAtion
The change in IA reporting from a UK-domiciled to a UK-investor basis has brought about a significant increase in the number of firms reporting to the IA (see Chart 71). In 2011, the last year of UK-domiciled reporting, there were 102 firms reporting data to the IA. This jumped to 144 in 2012 when the data includes the UK investor base of overseas-domiciled funds sold into the UK. This contrasts with the UK domiciled data where there has been a steady decline in the number of firms. There was an increase in 2013 to 150 and then a fall to 147 in 2016.
The decrease is due to M&A activity in the asset management industry and the increased use of third party CIS Operators. Although there have been several new fund company launches in recent years, they are not reflected in the IA’s data as they sit under a third party already represented in the list.
CHArt 71: number oF Firms reportinG to tHe iA
160
140
120
100
80
60
40
20
0
2002
2003
2004
2005
2006
2007
2008
2009
2010
2011
2012
2013
2014
2015
2016
Number of CIS Operators
CHArt 72: top ten uK FunD operAtors bY totAL Fum As At enD oF 2016 (uK-DomiCiLeD FunDs)
M&G
Scottish Widows
BlackRock
Capita
Standard LifeInvestments
Invesco Perpetual
Schroder
Fidelity
ColumbiaThreadneedle
Legal & General
0 10 20 30 40 50 60 70£bn
66.2
60.5
51.1
48.3
48.0
43.1
39.7
36.8
35.9
35.9
CHArt 73: top ten uK FunD operAtors bY retAiL Fum As At enD oF 2016 (uK-DomiCiLeD FunDs)
M&G
BlackRock
Invesco Perpetual
ColumbiaThreadneedle
Fidelity
BNY Mellon
Jupiter
Henderson
Legal & General
Schroder
0 5 10 15 20 25 30 35 40 45 50 55 60 65 70£bn
64.9
49.4
40.4
34.2
31.1
29.3
27.4
27.1
25.0
24.3
In terms of industry concentration the ten largest firms in the retail funds industry accounted for 44% of assets managed on behalf of UK investors in 2016 (see Chart 74). From 2011 to 2012, when the UK investor data was introduced, there has been a three percentage point drop in the Top 10 market share which has been stable since then at around 44%. The market share of the 11-20 section has decreased as well, falling to 24% as of end 2016. The 21-30 section has remained fairly stable at 13%, whilst the ‘remaining firms’ section has slightly increased reaching a market share of 8%.
77
ASSET MANAGEMENT SURVEY 2016-17 | retAiL FunD mArKet
5
CHArt 74: CombineD mArKet sHAres oF top Firms bY Fum (1997-2016)
1997
1998
1999
2000
2001
2002
2003
2004
2005
2006
2007
2008
2009
2010
2011
2012
2013
2014
2015
2016
Top 10 11 to 20 21 to 3031 to 50 Remaining rms
100%
80%
60%
40%
20%
0%
This indicates that despite increasing M&A activity, there is still a large number of fund operators and the top players are not dominating the market as smaller firms have been gaining ground, particularly from the top 11 to 20 firms.
concenTraTion aT asseT class level
Looking more closely at the degree of concentration at asset class level, the market share of the top funds tends to be fairly low. Charts 75, 76 and 77, show the market share of the top equity, fixed income and mixed asset funds respectively and the obvious change in 2012 reflects the one-off increase in the number of funds as we moved to UK Investor data reporting.
An immediate result of capturing the UK investor base of overseas domiciled funds is the decrease in the market share of the largest funds although this seems to be in line with the long-term trends we had already observed when reporting on a UK domicile basis.40 For example, the top 10 equity funds accounted for 19% of gross retail sales in 2010 compared to 17% in 2016.
CHArt 75: CombineD mArKet sHAre oF top equitY FunDs bY Gross retAiL sALes (1997-2016)
1997
1998
1999
2000
2001
2002
2003
2004
2005
2006
2007
2008
2009
2010
2011
2012
2013
2014
2015
2016
Top 10 11 to 20 21 to 5051 to 100 Remaining # Funds (RH)
100%
90%
80%
70%
60%
50%
40%
30%
20%
10%
0%
2000
1800
1600
1400
1200
1000
800
600
400
200
0
The change was more pronounced with fixed income funds. Namely, Chart 75 shows the market share of the top 10 falling from 46% in 2010 to 22% in 2016.
CHArt 76: CombineD mArKet sHAre oF top FiXeD inCome FunDs bY Gross retAiL sALes (1997-2016)
1997
1998
1999
2000
2001
2002
2003
2004
2005
2006
2007
2008
2009
2010
2011
2012
2013
2014
2015
2016
Top 10 11 to 20 21 to 5051 to 100 Remaining # Funds (RH)
100%
90%
80%
70%
60%
50%
40%
30%
20%
10%
0%
700
600
500
400
300
200
100
0
40 See The Investment Association, Asset Management in the UK 2015-2016, September 2016, Charts 69, 70, 71.
THE INVESTMENT ASSOCIATION
78
Chart 77: Combined market share of top mixed asset funds by gross retail sales (1997-2016)
1997
1998
1999
2000
2001
2002
2003
2004
2005
2006
2007
2008
2009
2010
2011
2012
2013
2014
2015
2016
Top 10 11 to 20 21 to 5051 to 100 Remaining # Funds (RH)
100%
90%
80%
70%
60%
50%
40%
30%
20%
10%
0%
1000
900
800
700
600
500
400
300
200
100
0
Chart 78 shows the 2016 net retail sales by fund operator for the 147 firms that report to the IA. In contrast to previous years, there was a certain degree of symmetry in 2016 both in terms of minimum and maximum outflow as well as the number of firms experiencing inflows and outflows. More specifically, the largest net retail inflow for a fund operator was £3.7 billion, and the largest net retail outflow was £3.5 billion. 74 firms reported positive inflows in 2016 totalling £29.8 billion and 73 firms reported a retail outflow totalling £24.6 billion.
Chart 78: fund operator net retail sales 2016
5,000
4,000
3,000
2,000
1,000
0
-1,000
-2,000
-3,000
-4,000
£m
retail inVestor behaViour
The length of time that retail investors hold a particular fund has more than halved over the past 20 years from around eight years in 1997 to three years in 2016 (see Chart 79). The reasons behind this are numerous and include:
• Improved technology, namely platforms, allowing investors to move funds easily at little or no cost.
• Increased engagement as investors take more interest in managing their own money.
• An increase in the availability of independent research which can highlight new trends to investors.
• Increased concentration of fund selection through a variety of professional services designed to help investors and advisers.
Chart 79: aVerage holding periods of retail inVestors (1997–2016)
1997
1998
1999
2000
2001
2002
2003
2004
2005
2006
2007
2008
2009
2010
2011
2012
2013
2014
2015
2016
8
7
6
5
4
3
2
1
0
Years
79
ASSET MANAGEMENT SURVEY 2016-17 | retAiL FunD mArKet
5
isas
Chart 80 shows that subscriptions into stocks and shares ISAs for the tax year ended 4 April 2016 were £21 billion, a slight drop from 2015 when investors put £22 billion into their ISAs. There was also a drop in the number of ISA accounts registered in 2015/6, the first year on year drop since 2008/09.
Cash ISAs still remain a more popular savings vehicle in the UK as, even with seven years of low interest rates, savers placed £59 billion into cash ISAs. However, investors in stocks and shares ISAs invest more on average - £8,322 vs £5,801 in cash ISAs.
CHArt 80: Gross subsCriptions into stoCK AnD sHAres isAs (2007-2016)
2007 2008 2009 2010 2011 2012 2013 2014 2015 2016
25
20
15
10
5
0
£bn
Source: HMRC (tax year)
ISA funds under management in authorised investment funds totalled £198 billion at the end of the 2015/16 tax year, which accounts for 74% of stocks and shares ISA assets (see Chart 81).
CHArt 81: FunDs unDer mAnAGement in isAs (tAX YeAr enDinG ApriL 2007-2016)
2007 2008 2009 2010 2011 2012 2013 2014 2015 2016
300
250
200
150
100
50
0
Authorised investment funds Other
£bn
Source: HMRC
ThE iNVESTMENT ASSoCiATioN
80
internAtionAL ConteXt
Globally, investment funds under management stood at $40.3 trillion at the end of 2016. North America continued to be the largest fund market in the world with $21.1 trillion held in US domiciled funds. European domiciled funds totalled $14.1 trillion and there were $5 trillion in funds domiciled in the Asia-Pacific region.41
Figure 9 shows that, in euro terms, there were €14.1 trillion held in investment funds domiciled in Europe, a 12% increase on the 2015 total of €12.6 trillion.
The UK remained the fifth largest asset management centre in Europe with €1.5 trillion in funds under management (€1.5 trillion in 2015), however, as this is in euro terms, it is affected by the weakened pound. Luxembourg was the most popular European country for hosting funds with €3.7 trillion and Ireland second most popular with €2.1 trillion (see Chart 82).
CHArt 82: FunD Assets bY DomiCiLe, uK, ireLAnD, LuXembourG (2002-2016)
2002
2003
2004
2005
2006
2007
2008
2009
2010
2011
2012
2013
2014
2015
2016
8000
7000
6000
5000
4000
3000
2000
1000
0
€bn
UK Ireland Luxembourg
Source: EFAMA
FiGure 9: europeAn inVestment FunDs bY CountrY oF DomiCiLe (DeCember 2016)
1
2
3
4
56
7
8
10
9
Country Net assets (€bn) Market share
1. Luxembourg 3,701 26.2%
2. Ireland 2,085 14.7%
3. Germany 1,885 13.3%
4. France 1,784 12.6%
5. United Kingdom 1,466 10.4%
6. Netherlands 801 5.7%
7. Switzerland 538 3.8%
8. Sweden 304 2.1%
9. Italy 298 2.1%
10. Denmark 276 2.0%
Other 1,003 7.1%
TOTAL 14,141 100%
Source: EFAMA
41 International fund data figures from EFAMA exclude some European funds. Consequently the European fund figures quoted by EFAMA in their international data do not correspond exactly to the figures quoted for the European funds industry in Figure 9.
81
ASSET MANAGEMENT SURVEY 2016-17 | retAiL FunD mArKet
5
Chart 83 provides some insight on investor choice across European countries.
Investors in the UK and Nordic countries show a clear preference for equity funds. Investors in these countries tend to have high levels of personal wealth in savings and property ownership which would allow greater risk taking.
German investors have traditionally held large amounts of their wealth in bonds, but have over recent years moved toward multi-asset products.
CHArt 83: breAKDoWn oF FunDs unDer mAnAGement bY FunD DomiCiLe