38
D R A F T DRAFT REPORT RETAIL MARKET ANALYSIS COLLEGE TOWN STUDY Presented to: University of Kentucky City of Lexington, Kentucky Presented by: ZHA, Inc. June, 2002
D R A F T
DRAFT REPORT
RETAIL MARKET ANALYSIS
COLLEGE TOWN STUDY
Presented to: University of Kentucky
City of Lexington, Kentucky
Presented by: ZHA, Inc.
June, 2002

D R A F T
I. INTRODUCTION A. STUDY PURPOSE ZHA, Inc. in collaboration with Ayers Saint Gross and Zimmerman/Volk Associates was retained to develop a College Town Plan for the University of Kentucky and the City of Lexington, Kentucky. The Study Area for the College Town Plan is bounded by Euclid Avenue, Rose Street, High Street, and the western edge of Limestone Avenue. ZHA was retained to evaluate the demand for addi-tional retail and eating and drinking establishments in the Study Area. B. DEFINITIONS Lexington MSA: The Lexington Metropolitan Statistical Area (MSA) is com-prised of the Lexington-Fayette Urban County as well as Bourbon, Clark, Jessamine, Madison, Scott, and Woodford counties. Shopping Center-Inclined Retail: As defined by the International Council of Shopping Centers, shopping center-inclined retail consists of general merchandise, apparel, furniture and home furnishings, other retail and home improvement/ building materials stores. These stores are typically found in shopping centers. These stores exclude auto service stations, auto dealers, catalogue sales outlets and eating and drinking establishments Shopper’s Goods Stores: Store types classified as shopper’s goods stores include: general merchandise, apparel, accessories, furniture and home furnishings, electronics, toys, music and book stores and most other stores selling non-conven-ience items. Convenience Goods Stores: Food stores (supermarkets, grocery stores, spe-cialty markets) and drug stores represent convenience goods stores. Eating and Drinking Establishments: Fast food restaurants, take-out food, restaurants and bars are classified as eating and drinking establishments. C. STRUCTURE OF THE REPORT Observations regarding the Study Area’s existing conditions from a retail standpoint are summarized in Section II. A retail market overview is contained in Section III. The Study Area’s development potential by store category (shoppers goods, convenience, and eating and drinking) is presented in Sections IV through VI. Section VII presents ZHA’s conclusions and retail development strategy rec-ommendations.

-2- D R A F T
II. OBSERVATIONS ON EXISTING CONDITIONS THERE IS RELATIVELY LITTLE RETAIL SPACE IN THE STUDY AREA AND IT IS DOMINATED BY EATING AND DRINKING ESTABLISHMENTS There are two retail locations in the Study Area: The Limestone Corridor and the retail cluster at the corner of Euclid Avenue and Rose Street. The Limestone Corridor contains 86 percent of the 103,300 square feet of retail in these two areas. Almost all of the retail on the Limestone Corridor is located between Euclid Avenue and Maxwell Street.
Eating/Retail Drinking Total
Limestone Corridor /1 39,641 48,712 88,353 Corner of Euclid and Rose 4,391 10,563 14,954 Off-Campus 44,032 59,275 103,307
Share of Off-Campus 43% 57%
On-Campus Student Union 16,250 16,300 32,550 Total Off- and On-Campus 60,282 75,575 135,857
Share of Total 44% 56%
1. Includes Kennedy Bookstore.
Source: University of Kentucky; ZHA, Inc.inventory/table
TABLE II-1
RETAIL INVENTORY ESTIMATECOLLEGE TOWN STUDY AREA
2000
The Student Union, on campus, also contains retail. There are approximately 32,550 square feet of retail in the Student Union, half of which is in eating and drinking establishments. Over half of the retail supply both off- and on-campus consists of eating and drinking establishments. There are additional eating and drinking establishments immediately west of the Study Area between Limestone Avenue and Upper Street.

-3- D R A F T
A MAJORITY OF THE RETAIL IN THE STUDY AREA IS IN A LINEAR CONFIGURATION WHICH COMPROMISES RETAIL DEVELOPMENT POTENTIAL A majority of the retail in the Study Area is on the Limestone Corridor. In the core of the Limestone Corridor (between Euclid Avenue and Maxwell Street) retail is located on only one side of the street. This configuration is not good for retail for the following reasons:
• A linear configuration does not take full advantage of the walking radius; • A one-sided corridor limits the opportunities for store synergy because it is
so much harder for the stores to be proximate; • It is difficult to create a quality pedestrian experience on a thoroughfare.
From a retail development standpoint, it will be difficult to create the ambience of a “College Town” if Limestone Avenue is the only retail street. THE PHYSICAL CONDITION OF LIMESTONE AVENUE IS POOR Limestone’s physical environment does not reflect a quality shopping or entertainment environment. The quality of the existing building stock is marginal. There are no street amenities like furniture, attractive paving, or wide sidewalks. Curb cuts interrupt the sidewalk. These conditions certainly reduce patronage from affluent, older households and visitors not associated with the University. These conditions also impede the Area’s ability to market to higher-end retailers. MAXWELL STREET REPRESENTS THE WALKING LIMIT NORTH FROM THE UNIVERSITY MARKET AND SOUTH FROM THE DOWNTOWN MARKET From the University’s Student Center the quarter-mile walking radius extends to Maxwell Street. From the intersection of Vine and Broadway downtown, Market Street is the edge of the quarter-mile radius. The walking radii demonstrate that it will be difficult to pull the University market into the Downtown Core, on one hand, and the Downtown employees to the core of the Limestone Corridor, on the other hand. HIGH STREET IS A PHYSICAL AND PSYCHOLOGICAL BARRIER SEPARATING THE STUDY AREA AND THE DOWNTOWN CORE While within easy walking distance to the Downtown Core, High Street does not function as a part of the Downtown Core but an edge to the Core. High Street is at a higher elevation than Vine and Main Street making it a walk uphill and a street that meets Downtown Core buildings on an upper floor. High Street faces

-4- D R A F T
the back of the Downtown Core buildings. Few buildings on the north side of High Street actually front the Street. As a result, it will be difficult to extend the Down-town Core across High Street to the south. Instead, it is likely that the Study Area and the Downtown Core will operate as separate, albeit related, precincts of the Downtown. THE CURRENT CONDITION AND USE OF THE BLOCK BETWEEN MAXWELL AND HIGH STREETS ON LIMESTONE PROHIBITS FAILS TO LINK THE DOWNTOWN CORE AND THE LIMESTONE CORE Currently, the block between Maxwell and High Street is very weak with vacancy on the west side of the street and Good Samaritan Hospital parking lots on the east side of the street. In-active street fronts make blocks seem longer and compromise the pedestrian experience. To encourage activity between the Down-town Core and the Limestone Core it is imperative that this block be transformed into an active environment with a continuous building edge along the street. LIMESTONE IS AN EATING/DRINKING CORRIDOR LINKING THE DOWNTOWN WITH THE LIMESTONE RETAIL AREA. Eating and drinking establishments are present on Limestone Avenue from Euclid Avenue to Third Street in Downtown. There may be an opportunity to strengthen the identity of this eating and drinking corridor to the benefit of both the Study Area and the Downtown Core. THERE ARE VERY FEW AVAILABLE SITES/BUILDINGS IN THE STUDY AREA WELL POSITIONED FOR RETAIL DEVELOPMENT Undeveloped properties on Limestone Avenue are limited to the Good Samaritan Hospital’s parking lots between Maxwell and High Streets and the Church’s lot on the southeast corner of High Street. Few of the vacant buildings on the west side of Limestone between Maxwell and High Street are well suited for retail in-fill on the ground floor. Other than these few opportunities, the Limestone Corridor is built-out. The Study Area’s lack of land will greatly constrain its ability to draw national retailers. National retailers have specific store specifications that only new devel-opment can accommodate. To attract retail investment in the Study Area it will be necessary to offer a development site on the Limestone corridor. If not, the area with the potential for retail in-fill development is west of Limestone Avenue. Jersey Street to Broadway between Bolivar Street and Maxwell Street possesses land ripe for retail development.

-5- D R A F T
THE NEWTOWN PIKE EXTENSION WILL ENHANCE THE REGIONAL VISIBILITY OF THE AREA WEST OF LIMESTONE AVENUE TO BROADWAY The Newtown Pike extension will culminate immediately west of the Study Area at Bolivar. The Newtown Pike extension will only enhance the retail develop-ment potential of the Limestone Corridor and environs. It will make this area con-venient to Downtown neighborhoods on the west side of town. It will enhance the visibility of the area. This road improvement will particularly enhance the retail development potential of the currently under-utilized land west of Limestone Avenue.

-6- D R A F T
III. MARKET OVERVIEW
A. DEMOGRAPHIC AND ECONOMIC OVERVIEW According to the 2000 Census the Lexington MSA is the 85th most populous metropolitan area in the United States with 479,198 people. The MSA grew by 18 percent or 73,262 people between 1990 and 2000. Of the 280 MSA’s recognized by the Census, Lexington-Fayette ranked 74th in rate of population change during the 1990’s.
Area 1990 2000 Real % Avg. AnnualLexington 180,570 218,686 38,116 21.1% 1.9%Fayette County 225,366 260,512 35,146 15.6% 1.5%Lexington MSA 405,936 479,198 73,262 18.0% 1.7%
Kentucky 3,685,296 4,041,769 356,473 9.7% 0.9%United States (000's) 248,710 281,422 32,712 13.2% 1.2%
Source: US Census Bureau, "2000 Census"; ZHA, Inc.demog/pop
TABLE III-1
POPULATION TRENDSSELECTED AREAS
1990 - 2000
The Lexington-Fayette Urban County grew at a faster rate than both the State and United States. The State of Kentucky actually grew at a slower rate than the country as a whole.

-7- D R A F T
1989 1999 # % Avg. AnnualFayette County $28,112 $45,698 $17,586 63% 5.0%Lexington MSA $26,891 $39,357 $12,466 46% 3.9%Kentucky $22,577 $33,672 $11,095 49% 4.1%United States $30,097 $41,994 $11,897 40% 3.4%
1989 1999 # % Avg. AnnualFayette County $14,975 $23,109 $8,134 54% 4.4%Lexington MSA $13,399 $21,237 $7,838 58% 4.7%Kentucky $11,149 $18,093 $6,944 62% 5.0%United States $14,396 $21,587 $7,191 50% 4.1%
Source: US Census Bureau, "2000 Census"; ZHA, Inc.demog/INCOME
ChangeMEDIAN HOUSEHOLD INCOME
PER CAPITA INCOMEChange
TABLE III-2
INCOME INDICATORSSELECTED AREAS1989 AND 1999
In terms of income, the Lexington MSA has a median household income below the national average. Per capita income in the Metro Area is on par with the nation. Both median household income and per capita income are higher in Fayette County as compared to the Metro Area. Fayette County’s average income data indicate that residents are faring better here than in the State and nation overall. From a social and economic standpoint, the Lexington MSA is moderately sized and experiencing steady growth. It is not an economy that is stagnant, nor is it an economy that is expanding rapidly. B. RETAIL MARKET OVERVIEW 1. Lexington Metropolitan Area Sales, Marketing & Management, Inc. is a company that ranks Metropolitan Areas from the standpoint of buying power. Sales, Marketing, & Management, Inc. defines effective buying income as money income less personal tax and non-tax payments. This is often called “disposable income” or “discretion-ary income”.

-8- D R A F T
The data in the latest “Survey of Buying Power” in 2001, did not have the benefit of the 2000 Census data, thus the data do not fully jibe with the 2000 Cen-sus information summarized in the previous section. This information is, however, useful to the extent that industries in the retail trade often refer to the “Survey of Buying Power” to identify potential markets. Woodford County is not included in Sales, Marketing, & Management’s (SM&M’s) definition of the Lexington MSA. According to the “2001 Survey of Buy-ing Power” the Lexington MSA ranks 108th in population and 147th in median household effective buying income among the SM&M’s 323 metropolitan areas. The MSA’s relatively small size (fewer than one million people) and relatively low median household effective buying income make it a second or third-tier city from a retail development standpoint.
SHOPPING CENTER-INCLINED SALES AS A PERCENT OF INCOME1997 BUSINESS CENSUS
35%
29%
0%
5%
10%
15%
20%
25%
30%
35%
40%
United States MSA

-9- D R A F T
The Lexington MSA is within the top 100 metropolitan areas in the country in retail sales. According to the 1997 Census of Retail Trade, shop-ping center-inclined retail sales as a share of total metropolitan income was higher in the Lexington MSA than the average nationally.
Lexington MSA Retail Sales Patterns2001
0%
20%
40%
60%
80%
100%
120%
140%
Motor E
tc.
Furnitu
re & H
ome F
urnish
ings
Electro
nics &
App
lianc
es
Buildin
g Mate
rials
& Sup
plies
Food &
Bevera
ge
Health
& P
erson
al Care
Clothin
g & A
cces
sorie
s
Sportin
g Goo
ds, H
obby
, Boo
k, Mus
ic
Genera
l Merc
hand
ise
Miscell
aneo
us
Eating
& D
rinkin
g
MSA National Avg.
The Lexington MSA has a relatively high share of its retail spending in the building materials and supply stores and eating and drinking establish-ment categories. Building materials spending likely reflects the demands of the farming and horse industries. The high sales in eating and drinking establishments may reflect the rural character of the region and the pres-ence of the University of Kentucky in Lexington.

-10- D R A F T
2. Fayette County a. Shopping Center-Inclined Stores
FayetteMSA County US
Est. 1997 Population 455,930 225,366 271,180 Est. 1997 Per Capita Income $18,496 $20,289 $19,116Total Income $8,433,050,503 $4,572,410,913 5,184,007,166
Shopping Center-Inclined Sales $2,962,570,000 $1,992,183,000 1,494,245,799 As A % of Income 35% 44% 29%
Source: US Census of Business; ZHA, Inc.retail tables/sales to income
TABLE III-3
SHOPPING CENTER INCLINED SALES TO TOTAL INCOMELEXINGTON AREAS AND UNITED STATES
1997
According to the last retail census in 1997, while representing 55 percent of the MSA population, Fayette County shopping center-inclined retail sales account for two-thirds of the MSA’s sales. The “spoke” configuration of the transportation net places Fayette County and Lexington at the center of the MSA. Lexington-Fayette Urban County is the economic hub of the metropolitan area.

-11- D R A F T
Fayette County ShareMSA County of MSA
Total Income $8,433,050,503 $4,572,410,913 54%National Avg. Shopping Center- Inclined Sales to Total Income 29% 29%Standard Sales Expectation $2,430,754,797 $1,317,958,401 54%
Actual 1997 Sales $2,962,570,000 $1,992,183,000 67%Inflow Sales $531,815,203 18% $674,224,599 34% 127%
Source: US Census of Business; ZHA, Inc.retail tables/inflow
TABLE III-4
RETAIL SALES INFLOWLEXINGTON MSA AND FAYETTE COUNTY
1997
Over one-third of Fayette County’s sales are likely derived from cus-tomers who reside outside of the County. The data indicate that the County is capturing retail sales from MSA residents as well as other visitors to the area.

-12- D R A F T
20011997 Estimate Change
Population 225,366 260,512 35,146 Per Capita Income $20,289 $24,134 $3,845Total Buying Power (000's) $4,572,411 $6,287,100 $1,714,689
Shopping Center-Inclined Sales (000's) $1,992,183 $2,739,267 $747,084 SC-Inclined Share 43.6% 43.6%
% %General Merchandise $521,892 26.2% $717,605 25.2% $195,713Apparel and Accessories $185,771 9.3% $255,437 10.9% $69,666Furniture, Fixtures, & Equipment $215,824 10.8% $296,760 10.4% $80,936Other GAFO $187,474 9.4% $257,778 10.8% $70,304Convenience
Food $396,124 19.9% $544,673 19.2% $148,549Drug $138,264 6.9% $190,114 6.7% $51,850
Home Imp/Bldg Materials $346,834 17.4% $476,899 16.8% $130,065100% 100%
Source: 1997 Census of Retail Trade; Claritas, Inc.; ZHA, Inc.retail tables/2000 estimate
TABLE III-5
POPULATION AND INCOME DRIVEN RETAIL SALES ESTIMATEFAYETTE COUNTY
2001
ZHA estimates that the County’s shopping center-inclined retail sales totaled approximately $2.7 million in 2001. ZHA has slightly adjusted the distribution of sales in 2001 to reflect the presence of the Hamburg Pavilion, a super-regional power center. From 1997 to 2001, ZHA estimates that Fayette County shopping center-inclined sales increased by 37 percent. Net of inflation this amounts to a real growth rate of .75 percent per year.

-13- D R A F T
(Constant $2001)
2001 Est. Change
Population 260,512 275,938 15,426
Per Capita Income $24,134 $25,914 /1 $1,781Total Buying Power (000's) $6,287,100 $7,150,714 $863,614
Shopping Center-Inclined Sales (000's) $2,739,267 $3,115,540 $376,274 SC-Inclined Share 43.6% 43.6%
1. Income projected to grow at the same rate experienced in the 1990's.A 2.5 percent annual inflation rate is assumed. The 2006 data are in constant 2001 dollars.
Source: Claritas, Inc.; ZHA, Inc.retail tables/2006 proj
2006
TABLE III-6
PROJECTED SHOPPING CENTER-INCLINED RETAIL SALESLEXINGTON MSA
2001 to 2006
Applying population projections from Claritas, Inc. and income growth on par with the 1990’s average, ZHA projects that by 2006 there will be demand for $376 million of additional shopping center-inclined retail sales. The shopping center-inclined retail sales potential in 2006 is net of inflation. This magnitude of sales will support approximately 684,000 square feet of additional retail.
-14- D R A F T
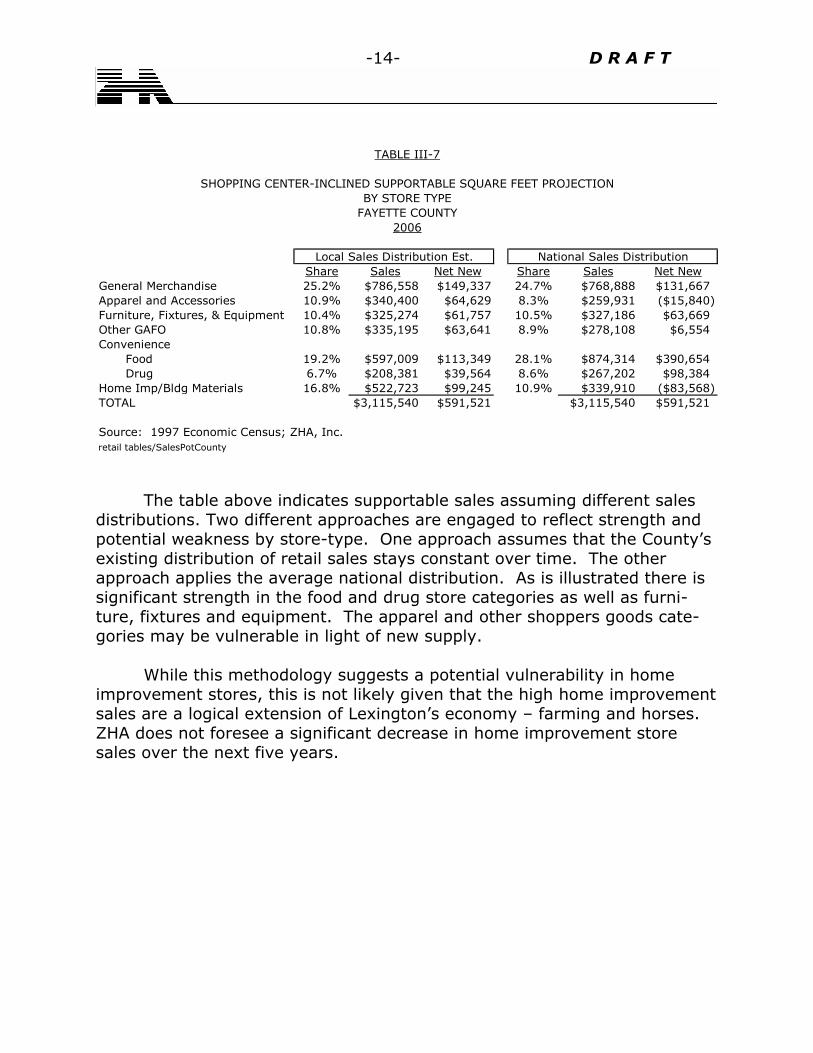
Share Sales Net New Share Sales Net NewGeneral Merchandise 25.2% $786,558 $149,337 24.7% $768,888 $131,667Apparel and Accessories 10.9% $340,400 $64,629 8.3% $259,931 ($15,840)Furniture, Fixtures, & Equipment 10.4% $325,274 $61,757 10.5% $327,186 $63,669Other GAFO 10.8% $335,195 $63,641 8.9% $278,108 $6,554Convenience
Food 19.2% $597,009 $113,349 28.1% $874,314 $390,654Drug 6.7% $208,381 $39,564 8.6% $267,202 $98,384
Home Imp/Bldg Materials 16.8% $522,723 $99,245 10.9% $339,910 ($83,568)TOTAL $3,115,540 $591,521 $3,115,540 $591,521
Source: 1997 Economic Census; ZHA, Inc.retail tables/SalesPotCounty
2006
Local Sales Distribution Est. National Sales Distribution
TABLE III-7
SHOPPING CENTER-INCLINED SUPPORTABLE SQUARE FEET PROJECTIONBY STORE TYPE
FAYETTE COUNTY
The table above indicates supportable sales assuming different sales distributions. Two different approaches are engaged to reflect strength and potential weakness by store-type. One approach assumes that the County’s existing distribution of retail sales stays constant over time. The other approach applies the average national distribution. As is illustrated there is significant strength in the food and drug store categories as well as furni-ture, fixtures and equipment. The apparel and other shoppers goods cate-gories may be vulnerable in light of new supply. While this methodology suggests a potential vulnerability in home improvement stores, this is not likely given that the high home improvement sales are a logical extension of Lexington’s economy – farming and horses. ZHA does not foresee a significant decrease in home improvement store sales over the next five years.

-15- D R A F T
Sales/SF Low High
General Merchandise $344 153,799 199,903 Apparel and Accessories $322 - 92,423 Furniture, Fixtures, & Equipment $345 82,429 87,403 Other GAFO $393 - 74,568 Convenience
Food $430 121,384 700,220 Drug $432 42,172 164,384
Home Improvement/Building Materials $358 - 127,655 TOTAL 399,783 1,446,556
Source: ZHA, Inc.retail tables/sq ft pot county
2001 - 2006
Square Feet
TABLE III-8
SHOPPING CENTER-INCLINED SUPPORTABLE SQUARE FEETBY STORE TYPE
FAYETTE COUNTY
ZHA projects that approximately 680,000 square feet of additional shopping-center inclined retail space is supportable in Lexington-Fayette Urban County over the next five years. b. Eating and Drinking Establishments 2001 eating and drinking sales data published in Sales, Market-ing & Management’s, “2001: Survey of Buying Power” as well as the con-sumer expenditure report indicate that on average nationally, households spend approximately $3,000 per year in eating and drinking establishments.

-16- D R A F T
(000's)Households 110,368 Average Eating/Drinking Expenditure $2,983Potential Eating/Drinking Sale (000's) $329,256,800
Actual 2001 Sales $489,367,000Inflow of Sales $160,110,200 33%
Source: Sales, Marketing and Management, "Survey ofBuying Power, 2001"; ZHA, Inc.retail tables/ed
TABLE III-9
EATING AND DRINKING SALESFAYETTE COUNTY
2001
According to Sales, Marketing & Management, Inc. actual eating and drinking sales amounted to $489 million in 2001. Lexington-Fayette County experiences an inflow of eating and drinking sales. Approximately, one-third of the County’s eating and drinking sales are derived from excess or non-local spending.
Net New Households 2001-2006 2,961 Average Eating/Drinking Expenditure $2,983Local Demand $8,834,335Inflow Factor 133%Net New Eating/Drinking Demand $11,724,737
Supportable SF 33,500
Source: Claritas, Inc.; ZHA, Inc.retail tables/ed proj
TABLE III-10
EATING AND DRINKING SALES PROJECTIONFAYETTE COUNTY
2006

-17- D R A F T
By 2006, $11.7 million of net new eating and drinking sales are supportable in the County. This amounts to a demand for an additional 33,500 square feet of eating and drinking space assuming average sales at $350 per square foot.

-18- D R A F T
IV. COLLEGE TOWN POTENTIAL:
SHOPPERS GOODS STORES A. DEMAND Shoppers goods stores typically function best when they are within an agglomeration of shoppers goods stores. The critical mass of shoppers goods stores establishes a shopping destination and, as such, such agglomerations tend to service a broad market area. Because of the need to penetrate a broad market area, regional transportation access is another important siting consideration for these types of stores. The two retail clusters in the Study Area (the Limestone Corridor and the cor-ner of Euclid and Maxwell) currently offer eating and drinking as well as conven-ience store outlets. There is no concentration of shoppers goods stores in the Study Area. The two primary markets for shoppers goods stores in the Study Area are households within the 40502 zip code and the University student market. 1. 40502 Zip Code Households Interviews reveal that residents in the 40502 zip code are the primary market for shoppers goods stores in the Central Business District. There are cur-rently 27,150 households in this area. According to estimates provided by Claritas, Inc. (Census 2000 income data is not yet available by zip code), the per capita income in the 40502 zip code is almost 70 percent higher than the Lexington-Fayette Urban County average.

-19- D R A F T
(Constant $2001)2001 2006 Sales Potential Sq. Ft.
Population 27,153 27,013 (140) Per Capita Income $40,724 $46,707 $5,983Total Income $1,105,778,772 $1,261,702,714 $155,923,942
Shopping Center-Inclined Sales $295,242,932 $336,874,624.76 $41,631,693
GAFO $154,809,028 $176,638,380 $21,829,352 63,500 Home Imp/Bldg Materials $32,067,584 $36,589,379 $4,521,794 12,600
Source: Claritas, Inc.; ZHA, Inc.retail tables/40502
Change
TABLE IV-1
EXPENDITURE POTENTIAL ZIP 40502SHOPPING CENTER-INCLINED RETAIL
2001 AND 2006
Assuming the same growth in real income (i.e. net of inflation) as estimated during the 1990’s, the 40502 households can support an additional 63,500 square feet of shoppers goods stores and 12,600 square feet of home improvement stores. 2. University Market There is considerable debate regarding the spending habits of Univer-sity students, particularly regarding shoppers goods. Unfortunately, there is no industry average available regarding student spending habits by store type. To approximate student spending potential, ZHA relied on the budget information pub-lished by the University of Kentucky’s Office of Student Financial Aid. It is likely that this data represents the low-end of student spending potential.

-20- D R A F T
Item Spending Share Spending ShareBoard $2,410 59% $4,100 62%Personal $1,082 26% $1,954 29%Books/Supplies $600 15% $600 9%Retail Spending Per Year $4,092 100% $6,654 100%
Source: University of Kentucky, Office of Student Financial Aid; ZHA, Inc.retail tables/student spending
2001
Under Graduate Graduate
TABLE IV-2
STUDENT EXPENDITURESAVERAGE SCHOOL YEAR
FINANCIAL AID DEPARTMENT GUIDELINES
Student books and supplies spending takes place in shoppers goods stores. Spending on board and personal items is captured predominately by convenience stores (food and drug).
2001 2006Students
Undergraduate 17,284 18,672Graduate 7,507 7,675Total 24,791 26,347
Min. Shopper Goods Expend. /Student $600 $600
Min. Shoppers Goods Potential $14,874,600 $15,807,933Sq. Ft. 43,200 46,000
Source: University of Kentucky, Office of Student Financial Aid; ZHA, Inc.retail tables/student shop
(Constant $2001)
TABLE IV-3
UNIVERSITY STUDENT SHOPPERS GOODS SALES POTENTIALUNIVERSITY OF KENTUCKY
2001 AND 2010

-21- D R A F T
The University’s Institutional Research, Planning, and Effectiveness Depart-ment projects enrollment. ZHA calculated the 2006 student population by extrapolating from the University’s 2010 enrollment projection. At a minimum, the student market has the potential to support 46,000 square feet of shoppers goods space by 2006. Given the conservative nature of financial aid budgeting, the shopper’s goods expenditure capacity could be twice this amount. B. SUPPLY Currently, the Study Area is serving a small share of the University market’s shoppers goods spending potential. Only the Kennedy Bookstore and a music store are present on the Limestone Corridor. It is likely that most students’ non-school-book-related shoppers goods spending occurs in the retail shopping clusters in and around the Fayette Mall and the Hamburg Pavilion. Both of these shopping centers are super-regional malls with a concentration of shopper’s goods stores attractive to the student market (Gap, Abercrombie and Fitch, Target, etc.). With over one million square feet, the Fayette Mall is located approximately 3.5 miles from the intersection of Euclid and Martin Luther King. The Fayette Mall offers a broad range of shoppers goods. The Fayette Mall contains a Gap, Abercrombie & Fitch, music stores, and four major department stores. Within the retail cluster surrounding the Fayette Mall there is the Lexington Green Mall, a Target Store, and the South Park and Crossroads shopping centers. Lexington Green contains a Joseph Beth bookstore and Disc Jockey. The South Park strip shopping center contains Value City, Best Buy, Bed Bath & Beyond, and a Toys R Us. The Crossroads shopping center contains Zainy Brainy, OfficeMax Furniture and Jo-Ann Fabrics. Given the character of the Study Area’s existing retail supply, it is obvious that the Study Area is not serving the shoppers goods needs of the residents in the 40502 zip code area. Residents in the 40502 zip code area, patronize the Fayette Mall and environs, the Landsdowne Shopping Center, Downtown, and, possibly, the Hamburg Pavilion. The Landsdowne shopping center is oriented to the affluent market. The shopping center contains specialty food, high end apparel, a small food market and eating and drinking establishments. While small, it is a popular shopping destina-tion for residents in the 40502 zip code area.

-22- D R A F T
In the Downtown, general merchandise, apparel and accessories, furniture/ home furnishings, and other shopper’s goods (GAFO) stores are concentrated in the Victorian Square shopping facility and the Civic Center shops. Other shoppers goods stores are scattered throughout downtown with a small agglomeration on Short Street. Downtown shoppers goods stores are oriented to the mature market residing in the 40502 zip code and/or visitors to Lexington. The shoppers goods stores Downtown are not targeted to the University student market. The Hamburg Pavilion is a recently developed power center located at the intersection of I-75 and Man O’ War. The center is over one million square feet. The power center contains a number of major anchor stores including a Cineplex, Target, Old Navy, Meiers, Kohl’s, and Barnes and Noble. It also includes numerous stand alone restaurants. While not particularly convenient to University students or the 40502 zip code households, it is likely that students and residents do some of their shopping at this new center. The Hamburg Pavilion is primarily targeted to new residential development and Interstate 75 traffic. C. DEVELOPMENT POTENTIAL 1. Considerations Limited Land Available in the Study Area: There is insufficient land within the Study Area boundaries to develop a critical mass of shoppers goods retail. Therefore, development potential will be more likely driven by independent operators than chain retail operations. Condition of the Study Area and Existing Character: The Study Area does not offer a high quality shopping environment. This coupled with the fact that there is too little land available in the Study Area to develop a meaningful shoppers goods cluster will make it very difficult to capitalize on the 40502 market. Downtown Shoppers Goods Stores are Struggling: Both Victorian Square and the Civic Center shops are struggling. Vacancy is high in both of these projects and rents are relatively low at $12.00 to $15.00 per square foot (full ser-vice). Limestone Corridor stores are paying $15.00 to $18.00 per square foot, while the malls are achieving over $25.00 per square foot. Regardless of land availability, Downtown’s weakness will likely deter significant shoppers goods investment in the Study Area.

-23- D R A F T
Newtown Pike Extension and the Area West of Limestone: The area west of Limestone Avenue has a significant amount of vacant land. This area will soon be transformed as a result of the Newtown Pike extension. This area has far greater shopper’s goods potential than the Study Area because of its future access, visibility, available land, and proximity to the University market. 2. Development Potential
200640502 Spending Potential $213,227,759
Study Area Capture 1%Study Area Sales $2,132,278
Min. Student Spending Potential $15,807,933Study Area Capture 40%Total Sales $6,323,173
Total Shoppers Goods Spending Potential $8,455,451Less: Estimated Existing Sales ($5,509,180)Net New Sales Potential $2,946,271Net New Square Feet 8,600
Source: ZHA, Inc.retail tables/shop conc
TABLE IV-4
SHOPPERS GOODS DEVELOPMENT POTENTIALCOLLEGE TOWN STUDY AREA
2006
ZHA concludes that an additional 8,600 square feet of shoppers goods retail can be supported in the Study Area by 2006. This retail will be primarily targeted to the University student market. Book, music, discount clothing, and sports/bike are candidate store types for the Study Area.
-24- D R A F T
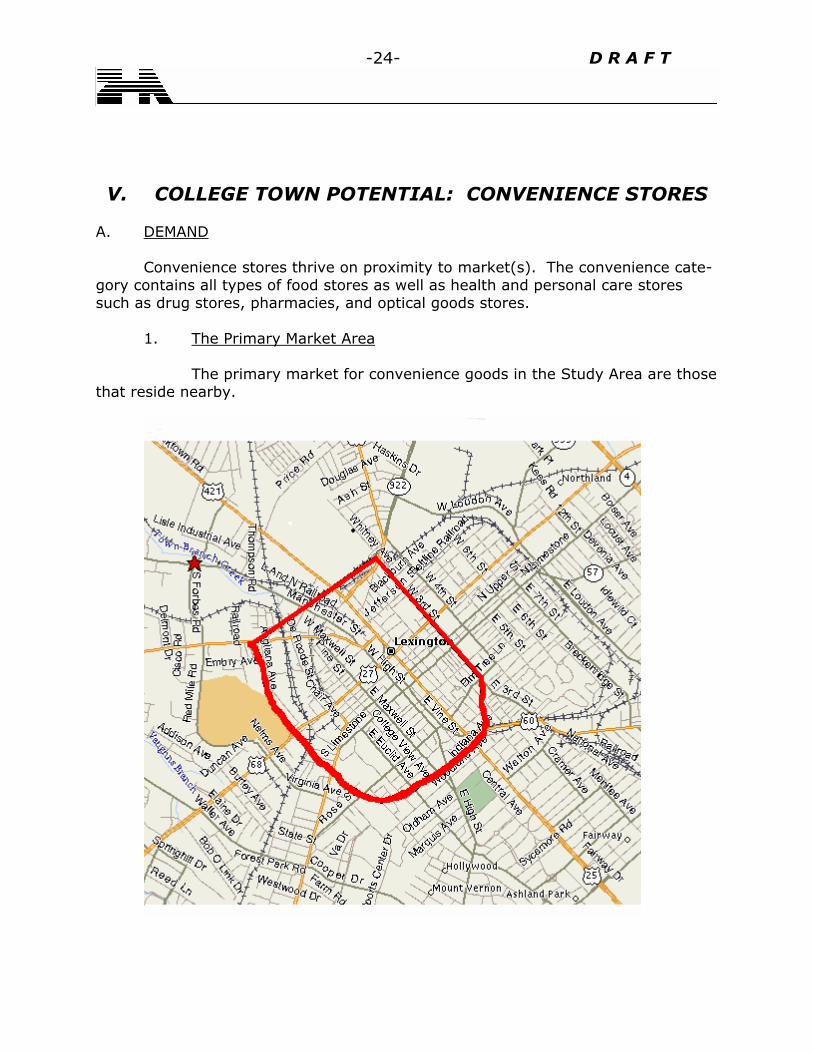
V. COLLEGE TOWN POTENTIAL: CONVENIENCE STORES A. DEMAND Convenience stores thrive on proximity to market(s). The convenience cate-gory contains all types of food stores as well as health and personal care stores such as drug stores, pharmacies, and optical goods stores. 1. The Primary Market Area The primary market for convenience goods in the Study Area are those that reside nearby.

-25- D R A F T
Given the competitive supply of food and drug stores and access issues, ZHA identified the Primary Market Area for Study Area convenience spending.
2001 2006Population 6,355 6,236
Households 2,961 2,890 Students 1,429 1,429
Source: Claritas, Inc.; ZHA, Inc.retail tables/conv demo
TABLE V-1
PRIMARY MARKET AREA DEMOGRAPHICSCONVENIENCE RETAIL
2001 - 2006
According to Claritas, Inc. there are 2,961 households and 1,429 students residing in the Primary Market Area. The Primary Market Area does not contain enough households to support a community retail center.

-26- D R A F T
($2001 Constant)
2001 2006Households 2,961 2,890
Population 6,355 6,236 Per Capita Income $26,396 $33,299Total Income $167,746,580 $207,649,485
Food $12,580,994 7.5% $15,573,711Drug $3,858,171 2.3% $4,775,938Convenience Total $15,613,979 $20,349,649
Students 1,429 1,429 Avg. "Board"/Personal Expenditure $4,773 $4,773Total "Board" Expenditure Potential $6,820,617 $6,820,617
Total Convenience Potential $22,434,596 $27,170,266Square Feet @ $350 /sf 64,099 77,629
Source: University of Kentucky; Claritas, Inc.; International Council of Shopping Centers;ZHA, Inc.retail tables/conv primary
TABLE V-2
CONVENIENCE GOODS SALES POTENTIALPRIMARY MARKET AREA
2001 TO 2006
The Primary Market Area can support between 64,000 and 77,600 square feet of convenience retail. 2. The Secondary Market Area Albeit to a lesser extent, convenience retail in the Study Area will ser-vice students and faculty at the University. Convenience retail in the Study Area will likely not penetrate these markets as deeply as the Primary Market because most convenience spending occurs close to home.

-27- D R A F T
(Constant $2001)
2001 2006Student Market
Provost Area Students /1Under-Graduate 15,799 17,124 Graduate 4,363 4,476
Convenience Spending /StudentUnder-Graduate $3,492 $3,492Graduate $6,054 $6,054
Total Spending Potential $81,578,937 $86,895,887
Faculty MarketFaculty Members 3,750 3,750 Estimated Convenience /Faculty /2 $283 $283Total Faculty Spending Potential $1,059,375 1,059,375
Secondary Convenience Expenditure Potential $82,638,312 $87,955,262
1. Net of resident students in Primary Trade Area.2. Assumes $1.25 per semester day.
Source: University of Kentucky, Office of Student Financial Aid; ZHA, Inc.retail tables/conv sec
TABLE V-3
CONVENIENCE SPENDING POTENTIALSECONDARY MARKET
2001 - 2006
The Secondary Market represents approximately $88 million of convenience retail expenditure potential. B. COMPETITIVE SUPPLY The Primary Market Area’s food needs are currently being satisfied by the Kroger Supermarket on Euclid Avenue, and the Winn Dixie’s on South Broadway and the Meadowthorpe Shopping Center. Many of the supermarkets have drug stores, otherwise there is a drug store downtown and on Euclid Avenue. The University, itself, offers convenience items in the Student Center on Campus.
-28- D R A F T
C. SUPPORTABLE SQUARE FEET 1. Considerations Good, Convenient Existing Supply: There are a number of conven-ience stores within a short drive from the Primary Market Area. These competitive stores and shopping centers are currently serving a majority of the Primary Market Area’s convenience needs. Given the quality of the stores and shopping centers and their location, the competitive supply is satisfactory for a majority of the Primary Market Area’s convenience shopping needs. The Primary Market is Too Small to Support a Full Scale Supermarket: Because convenience retail is available in close proximity to the Study Area, the Primary Market’s size is small. As such there are not enough “rooftops” (or house-holds) to support a full-scale supermarket. There is, however, a demand for food among these closer-in markets. A specialty food market is a store-type that could be successful in the Study Area. The Study Area is well positioned for such a store-type because of its proximity to downtown employees, students, faculty members, and Lexington’s high income neighborhoods. There Are a Number of Visitors To The University That Need Convenience Goods: Visitors can be an important source of convenience sales. The number of visitors to the University Campus is unknown, but there are a significant number of visitors throughout the year. There is Not A Drug Store Within Easy Walking Distance From the University: There may be an opportunity to work with Good Samaritan Hospital to develop a small drug store in the Study Area.

-29- D R A F T
2. Convenience Retail Development Potential
Primary Market Spending Potential $27,170,266Study Area Capture 10%Study Area Sales $2,717,027
Secondary Market Spending Potential $87,955,262Study Area Capture 4%Study Area Sales $3,518,210
Total Convenience Goods Spending Potential $6,235,237Less: Estimated Existing Sales ($715,900)Net New Sales Potential $5,519,337New Supportable Square Feet 15,800
1. Kennedy bookstore convenience goods sales estimate andliquor store.
Source: ZHA, Inc.retail tables/conv conc
TABLE V-4
CONVENIENCE RETAIL DEVELOPMENT POTENTIALCOLLEGE TOWN STUDY AREA
2006
ZHA concludes that an additional 15,800 square feet of convenience retail can be supported in the Study Area. The retail will be targeted to nearby residents and the University market (students, faculty, and visitors). Specialty food stores (like Trader Joe’s or a green grocer), an optical store, and a drug store are candi-date store types for the Study Area.

-30- D R A F T
VI. COLLEGE TOWN POTENTIAL: EATING AND DRINKING A. DEMAND Like shopper’s goods stores, eating and drinking establishments benefit from agglomeration. Districts where a number of restaurants and/or entertainment facilities are present tend to draw from larger trade areas. Restaurant clusters become dining destinations. 1. Primary Market The Primary Market for eating and drinking establishments in the Study Area are proximate residents, students and faculty. If information were available, University visitors would also be included in the Primary Market. It is unlikely that the financial aid budgets contemplate student spending on entertainment. Based on ZHA’s understanding of the student market, ZHA has assumed that the average student spends as much on eating and drinking as the average person in the United States. The Study Area can benefit from this spending during the school year.

-31- D R A F T
a. Primary Market
Primary Market HouseholdsHouseholds 2,890 Average Spending $2,983E/D Expend. Potential $8,621,654
University StudentsResident Students 24,791 Average Spending $2,593E/D Expend. Potential $64,286,813
Faculty 3,750 Average Spending @ $3.75 per School Day $848
$3,178,125
Total Eat/Drink Expenditure Potential $72,908,467Square Feet @ $350 /sf 208,300
Source: Claritas, Inc.; International Council of Shopping Centers; ZHA, Inc.retail tables/ed prim
2006($2001 Constant)
TABLE VI-1
EATING AND DRINKING SALES POTENTIALPRIMARY MARKET AREA AND FACULTY
2006
The Study Area is positioned to capitalize on a phenomenal eating and drink-ing market. There is $73 million of eating and drinking expenditure potential in the Primary Market alone, and this estimate excludes University visitors! The Primary Market alone can support between 208,000 square feet of restaurants and enter-tainment establishments. b. Secondary Market The Secondary Market consists of residents within the 40502 zip code. Many of these households patronize Downtown establishments and are accustom to the urban environment. Eating and drinking establishments in the Study Area are within a 10- to 15-minute drive to most of these households.

-32- D R A F T
2006 Households 27,013 Expenditure /Household $2,983Eat/Drink Expenditure Potential $80,587,110
Sq. Ft. @ $350 /sq. ft. 230,200
Source: Claritas, Inc.; ZHA, Inc.retail tables/ed sec
TABLE VI-2
EATING/DRINK EXPENDITURE POTENTIAL40502 ZIP CODE HOUSEHOLDS
2006
The Secondary Market has the potential to spend between $80.5 million in eating and drinking establishments per year. If a quality pedestrian environment can be established in the Study Area there is the potential to capture a portion of this expenditure potential. B. SUPPLY The student and faculty market are the primary patrons of Study Area eating and drinking establishments. Over half of the retail supply in the Study Area is occupied by eating and drinking establishments. ZHA estimates that the 59,275 of eating and drinking establishments generate approximately $12 million in sales. Immediately west of the Study Area there are additional eating and drinking establishments. ZHA estimates that there is approximately 18,000 square feet of additional eating and drinking space in this area. At an assumed average sales per square foot of $250, these establishments generate $3.6 million in sales. The student and faculty markets also patronize the eating establishments in the Student Center. The University’s Student Center contains approximately 16,300 square feet of eating and drinking space. ZHA has assumed that these establishments experience sales volume similar to a food court. ZHA estimates that this supply generates $8 million in sales. The Downtown is the cultural hub of the Metropolitan Area. There are numerous bars and restaurants in the Central Business District serving the student, near-in resident, Metropolitan households, employees, and visitors. Students patronize a number of these establishments particularly on Limestone Avenue and Short Street.
-33- D R A F T
The 1997 Business Census indicates that eating and drinking and accommo-dation sales in the central business district zip code, 40507, totaled between $25 and $50 million. Specific sales data on eating and drinking establishments alone is not available. Applying the Metropolitan distribution of eating and drinking sales to total eating and drinking and accommodation sales results in $20 to $40 million of eating and drinking sales volume in the Central Business District. A portion of these sales are derived from the Primary and Secondary Markets. The Woodland Avenue area and Chevy Chase are popular eating and drinking establishments for the Primary and Secondary markets. A range of restaurants and bars in relative proximity make these areas dining destinations. Sales are unknown for this area. Eating and drinking sales also occur at the malls and on the major thorough-fares. C. SUPPORTABLE SQUARE FEET 1. Considerations The Study Area is the 100 Percent Location from the University Identity Standpoint: There is no question that Limestone Avenue is where many of the University’s eating and drinking landmarks reside. This economic position is very value and can be built upon. Land, Access and Visibility as well as University Proximity are Present West of the Study Area: Eating and drinking development opportunities are limited on Limestone Avenue south of Maxwell Street. Rather than moving north, it is likely that eating and drinking developers will pursue property to the west of Limestone Avenue. Jersey Street Could Be Transformed Into A Pedestrian Environment Attractive to Eating and Drinking Establishments: Jersey Street is short and protected from through traffic. It also abuts many of the well known establishments in the Study Area. There may be an opportunity to transform Jersey Street into a high quality entertainment district. 2. Eating and Drinking Supportable Square Feet The Study Area’s development potential is influenced by the environ-ment created on Limestone Avenue and its environs. Only with a quality environ-ment will the Study Area penetrate the 40502 market to any meaningful degree. The capture rates herein assume that significant streetscape occurs on Limestone Avenue and adjacent land to the west of the Study Area.

-34- D R A F T
Low HighPrimary Market Area $72,908,467 $72,908,467
Study Area Capture 25% 28%Study Area Sales $18,227,117 $20,414,371
Secondary Market Area $80,587,110 $80,587,110Study Area Capture 5% 7%Study Area Sales $4,029,355 $5,641,098
Total Eat/Drink Supportable Spending $22,256,472 $26,055,469Less: Est. Existing Sales in Study Area
and Environs ($15,455,000) ($15,455,000)Net New Sales Supportable $6,801,472 $10,600,469Net New Square Feet Supportable 19,400 30,300
Conclusion 25,000
Source: ZHA, Inc.retail tables/ed conc
2006
TABLE VI-3
EATING AND DRINKING DEVELOPMENT POTENTIALCOLLEGE TOWN STUDY AREA
2006
ZHA projects that an additional 25,000 square feet of eating and drinking establishments can be supported in the Study Area. This projection reflects that the visitor market is an unknown quantity that contributes significantly to the eat-ing and drinking market in the Study Area. This projection assumes land is avail-able. To capture this level of sales, bars and restaurants will desire a location between Euclid Avenue and Maxwell Street. There are limited development oppor-tunities on Limestone in this area. Therefore, it is likely that a portion of this eating and drinking development potential will occur west of the Study Area to capitalize on land availability, the Newtown Pike extension, and the opportunity to create a quality pedestrian environment.

-35- D R A F T
VII. CONCLUSIONS AND DEVELOPMENT STRATEGY
A. CONCLUSIONS
Square FeetShoppers Goods Stores 8,600 Convenience Stores 15,800 Eating and Drinking Establishments 25,000 Total 49,400
Source: ZHA, Inc.retail tables/retail conc
TABLE VII-1
SUPPORTABLE RETAIL SQUARE FEETCOLLEGE TOWN STUDY AREA
2006
The retail market analysis concludes that there is demand for an additional 49,400 square feet of retail in the College Town Study Area. In the Study Area retail will demand Limestone Avenue frontage. The prime retail location within the Study Area is on Limestone between Euclid Avenue and Maxwell Street as well as corner sites. There may be more retail demand than land available within the com-petitive retail areas of Study Area. B. RETAIL DEVELOPMENT STRATEGY To attract retail investment to the Study Area will require that three initia-tives be aggressively pursued. These initiatives are as follows: Improve the Physical Environment on Limestone Street and Its Environs The streetscape of Limestone Avenue is unattractive and not pedestrian friendly. To attract quality retail investment a College Town “ambience” must be established. The following initiatives are recommended:
• Streetscape Program: Street furniture, quality pavers, wide sidewalks, and a host of other streetscape initiatives will transform the look of Limestone Avenue. The streetscape program should consider extending west to Upper or Broadway to make visible to Newtown Pike the College Town. The street-scape program should also consider extending to the Courts area of the Central Business District to highlight the University/Downtown connection.

-36- D R A F T
• Overlay District: A design and/or land use overlay district will encourage an active street front. Active street fronts often create an environment that makes pedestrians walk further than they would otherwise. This enhances development potential. An overlay district also provides a guarantee to investors that a quality investment will not be undermined by inconsistent design/function.
• Two-Way Traffic On Limestone: Two-way traffic is better for retail than one-
way traffic. It increases market visibility and makes wayfinding easier.
• Jersey Street Transformation: While not in the Study Area, Jersey Street (the alley behind Limestone Avenue uses) has the potential to be a quality pedestrian street. It is a two-way, non-thru street with most of the major existing eating and drinking uses abutting it.
Stabilize and Improve the Land Uses on the Block Between Maxwell Street and High Street The block between Maxwell and High Street is a critical link between the Downtown CBD and the University. Currently, this block is occupied by surface parking lots, vacant and/or for-sale buildings. To really become a precinct of the Downtown, the Study Area must have quality infill development take place on this block. Quality infill will improve the pedestrian connection between the Downtown CBD and the University and it will provide a gateway to the College Town center. ZHA recommends that the following steps be taken:
• Purchase The Kimbell Hotel Property: The Kimbell Hotel property is an important architectural asset. It occupies a prominent site on the Maxwell/High block. If this property were to become distressed due to deferred maintenance it would have dire consequences on the Study Area’s ability to become a viable entertainment district. To support retail and the College Town ambience, the best use of the Kimbell Hotel would be as a University Inn.
• Good Samaritan Hospital and the Church Redevelop Their Surfacing
Parking Lots Into Buildings with Front Doors Facing Limestone: Surface parking lots compromise the pedestrian environment and as such destroy the rhythm necessary for land use synergy.
• Infill Residential Development on Surface Parking Lot South of Kimbell
Hotel: Residential units are active throughout the day and evening. Market rate housing at this location will activate the street, fill in a gap, and contribute to the buying power of the Primary Market.
-37- D R A F T
Obtain Consensus Among the Major Institutions to Actively Pursue the Goals of the College Town Plan. There are major institutions (Hospital, Church, University and City) present in the Study Area. Each of these institutions will, on one hand, suffer if the Study Area declines and, on the other, benefit from its revitalization. It is imperative that these institutions recognize and acknowledge that quality environments do not exist without significant intervention. Each has a role in the revitalization of the Study Area. Proactive initiatives by the institutions alone will transform the Study Area from what it is today. Initiatives include:
• University Allow the Plus Account Card’s Use in the Study Area: The Plus Account Card can only be used on campus currently. Allowing its use in the Study Area will increase student spending potential signifi-cantly.
• Public Sector Initiate Streetscape and Regulatory Change: Streetscape
improvements as well as a design/development overlay zone will con-tribute greatly to the Study Area’s ability to capture retail and eating and drinking sales potential.
• Infill Development on Surface Parking Lots: The Church and the
Hospital own considerable land currently occupied by surface parking. The redevelopment of these blocks will improve the physical character of the Study Area as well as grow the consumer market.
20007\Report 6-28-02


