Retail Market Study Lower Park Avenue District Main Street District Bonanza Park District Prospector District Deer Valley District Park City, Utah June 23, 2011 Prepared for: Park City Municipal Corporation Prepared by: DESIGNWORKSHOP 1390 Lawrence Street #200 Denver, CO 80204 303.623.5186 www.designworkshop.com
Transcript
Retail Market Study
Lower Park Avenue District Main Street District
Bonanza Park District Prospector District Deer Valley District
Park City, Utah
June 23, 2011
Prepared for:
Park City Municipal Corporation
Prepared by:
DESIGNWORKSHOP 1390 Lawrence Street #200
Denver, CO 80204 303.623.5186
www.designworkshop.com
TABLE OF CONTENTS Summary of Findings and Recommendations ....................................................................................... 1 Introduction ............................................................................................................................................... 6
SWOT Analysis ...................................................................................................................................... 7 Demographics, Tourism and Related Trends ........................................................................................ 8
Local Demographics (Residents) ............................................................................................................ 8 Second Home Information .................................................................................................................... 11 Tourism Trends ..................................................................................................................................... 12
Characteristics of Local Versus Regional Retail Districts .................................................................. 18 Summary of Key Trends Impacting Resort Retail .............................................................................. 25 Comparable Resort Community Analysis ............................................................................................ 28 Park City Retail Sales Tax Revenue Trends ........................................................................................ 44 Main Street Retail ................................................................................................................................... 49
Analysis of Current Conditions / Performance ..................................................................................... 49 Tenant Mix Recommendations ............................................................................................................. 54 Future Retail Demand Analysis ............................................................................................................ 56
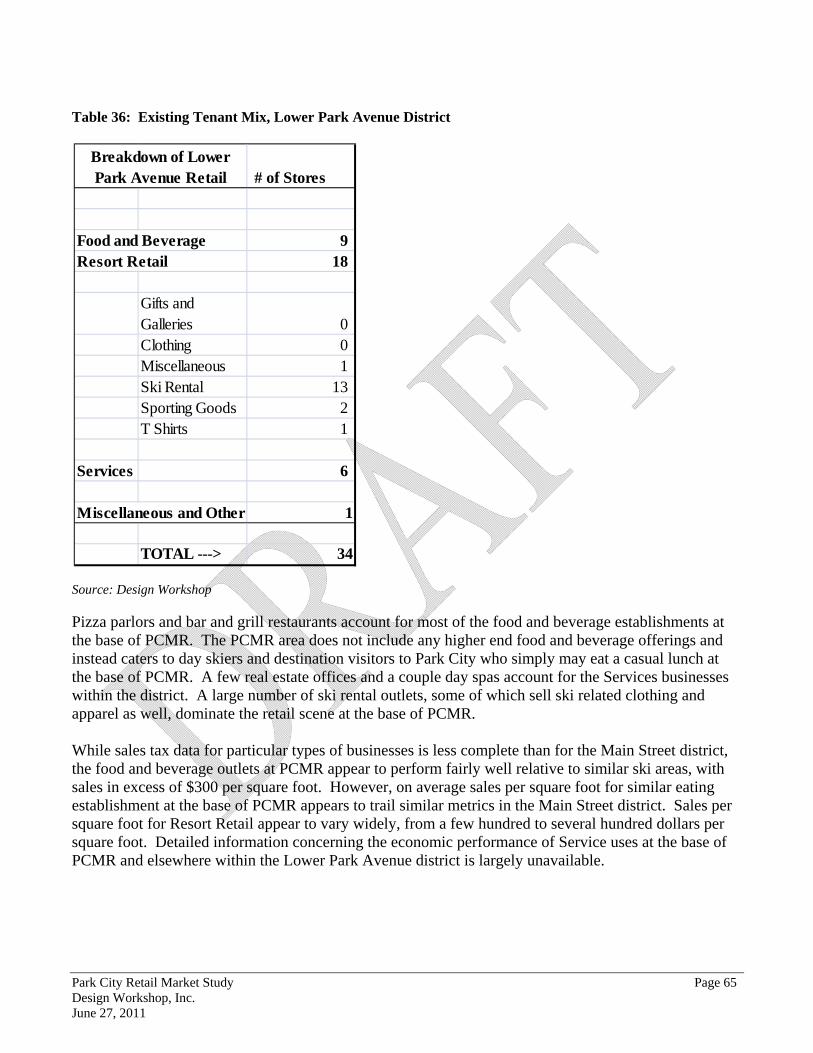
Lower Park Avenue Retail ..................................................................................................................... 61 Analysis of Current Conditions / Performance ..................................................................................... 61 Future Retail Demand Analysis ............................................................................................................ 66 Square Footage and Tenant Mix Recommendations ............................................................................ 69
Prospector Retail ..................................................................................................................................... 70 Analysis of Current Conditions / Performance ..................................................................................... 70 Future Retail Demand Analysis ............................................................................................................ 73 Square Footage and Tenant Mix Recommendations ............................................................................ 76
Bonanza Park Retail ............................................................................................................................... 77 Analysis of Current Conditions / Performance ..................................................................................... 77 Future Retail Demand Analysis ............................................................................................................ 80 Square Footage and Tenant Mix Recommendations ............................................................................ 83
Deer Valley Retail ................................................................................................................................... 85 Analysis of Current Conditions / Performance ..................................................................................... 85 Future Retail Demand Analysis ............................................................................................................ 88 Square Footage and Tenant Mix Recommendations ............................................................................ 91
Overall Conclusions and Recommended Action Items ....................................................................... 92
Park City Retail Market Study Page 1 Design Workshop, Inc. June 27, 2011
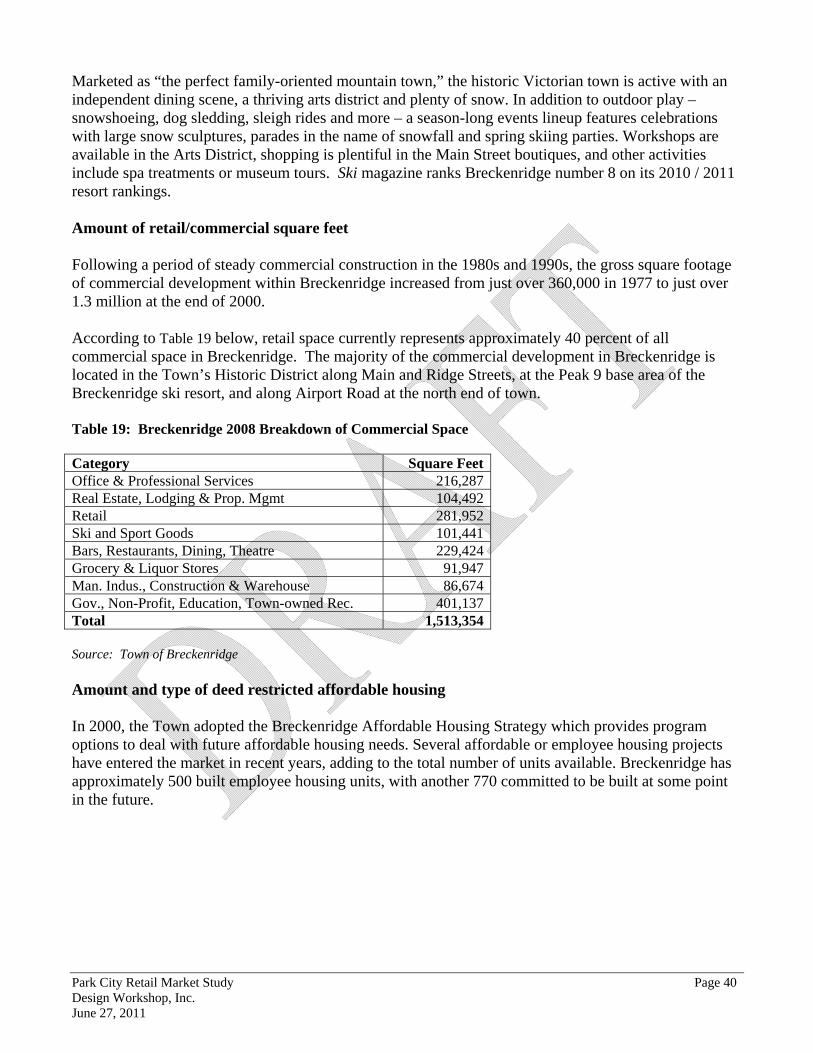
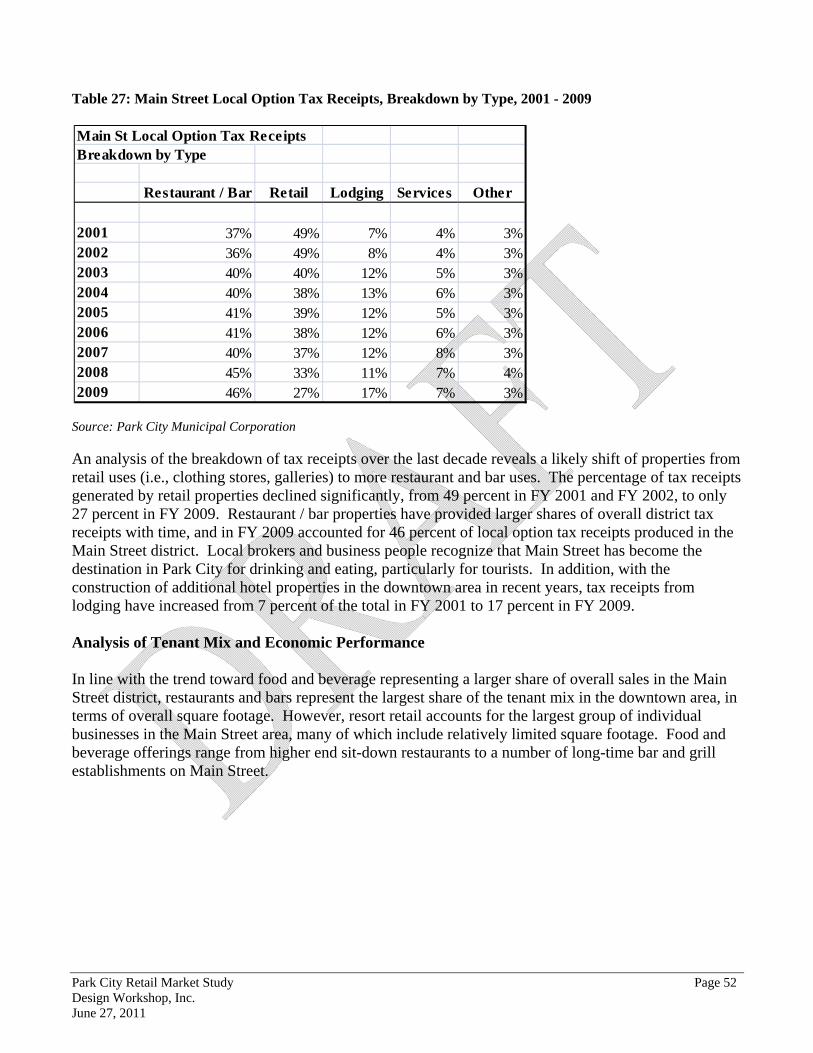
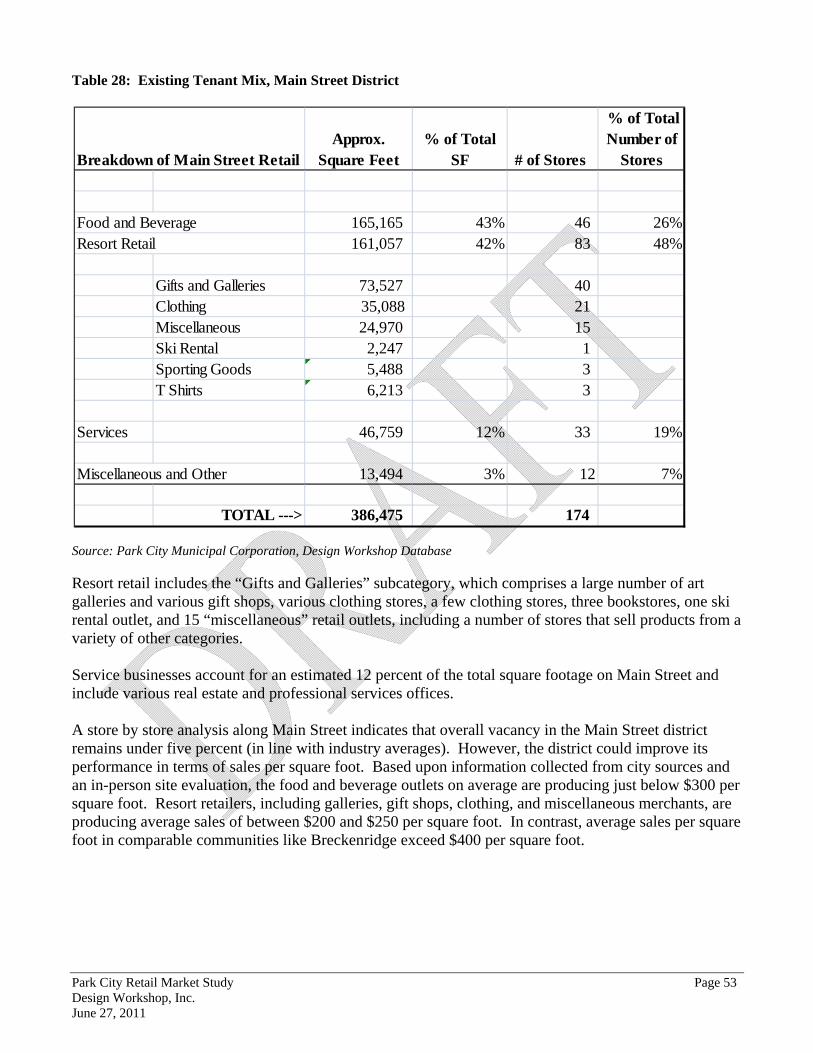
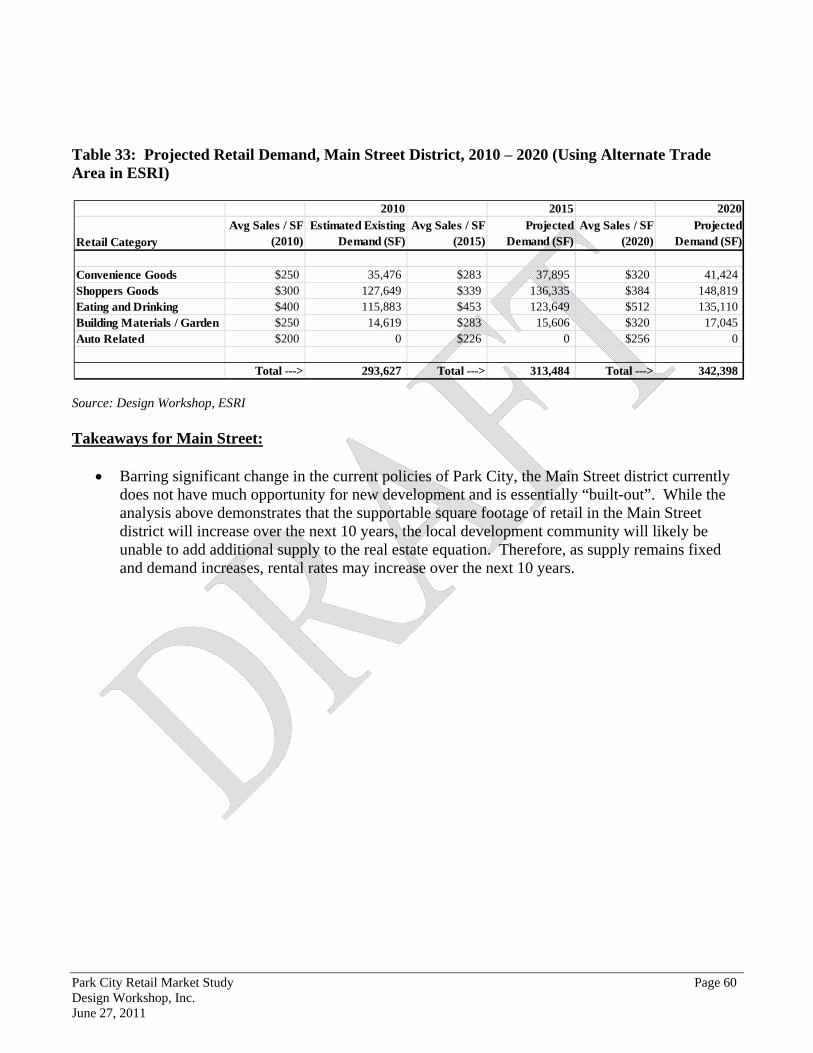
Summary of Findings and Recommendations The following provides a summary of the findings of this market study pertaining to retail in Park City. MAIN STREET: Overall, the Main Street district remains relatively healthy given the national economic condition. The district reports fairly healthy and sustainable levels of vacancy and has fared better than many of its peers around the country, overall. The mix of tenants is fairly good, in that it appeals to a wide range of potential customers, from young people visiting Sundance to vacationing retirees. The district seems to have a disproportionate number of galleries and studios, tenants that typically do not provide much ground level vibrancy. However, Main Street could improve its overall health and regain its position as a district enjoyed by Park City and Summit County residents by doing a better job in appealing to locals. The high season during the third quarter is very important, but the district must carefully serve locals during the winter months as well, so that locals will feel compelled to come back and visit during the non-winter months. Successful resort retail districts simply appreciate the locals year-round. Main Street should work carefully to cultivate local business and build a loyal base of local customers from not only Park City itself, but also from the broader Summit County market and the Salt Lake metro area.
While the Main Street district is essentially built-out and typically has low vacancies, the district has generally not performed as well in terms of sales per square foot compared to similar historic downtowns in mountain resort communities.
The retail mix includes a fairly high number of art galleries and fairly similar gift stores in close proximity along Main Street. Galleries command higher sales per square foot and serve an important role in the retail mix but generally do not support active ground floor retail use. More diversification in the retail mix could improve the visitor experience. In addition, many galleries could reconfigure to include a ground floor entrance and selling space on the second floor, thereby freeing up space on the ground floor for other retail uses.
The continued inclusion of restaurants with a diversified range of menus would continue to strengthen Main Street’s overall marketability and retail position.
In terms of action items, the stakeholders on Main Street and in the community should focus on the following strategies to improve the district.
The City should work with the merchants association and civic leaders to recruit the most appropriate mix of tenants for the district.
The City and merchants association should explore streetscape improvements to enhance the overall look and feel of the district and ensure that it remains updated and attractive to visitors. Streetscape strategies should address lighting, seating and overall walkability.
The City should continue working with property owners and potential developers to integrate design standards with site plans and renovations in the district, in order to ensure that the district retains a consistent, high quality theme.
Park City Retail Market Study Page 2 Design Workshop, Inc. June 27, 2011
The City should work with stakeholders in the Main Street area to identify potential locations and strategies to create additional central gathering places in the district. An opportunity exists to create or define the “heart” of Main Street and to make it a signature location in the district.
In order to promote the concept of “retail as entertainment”, the city should work with merchants and stakeholders to introduce elements of entertainment through the design of the physical space as well as the inclusion of specific entertainment-oriented tenants.
The district should sponsor events and activities specially geared to build loyalty among locals in order to provide for more of a four-season retail district.
LOWER PARK AVENUE:
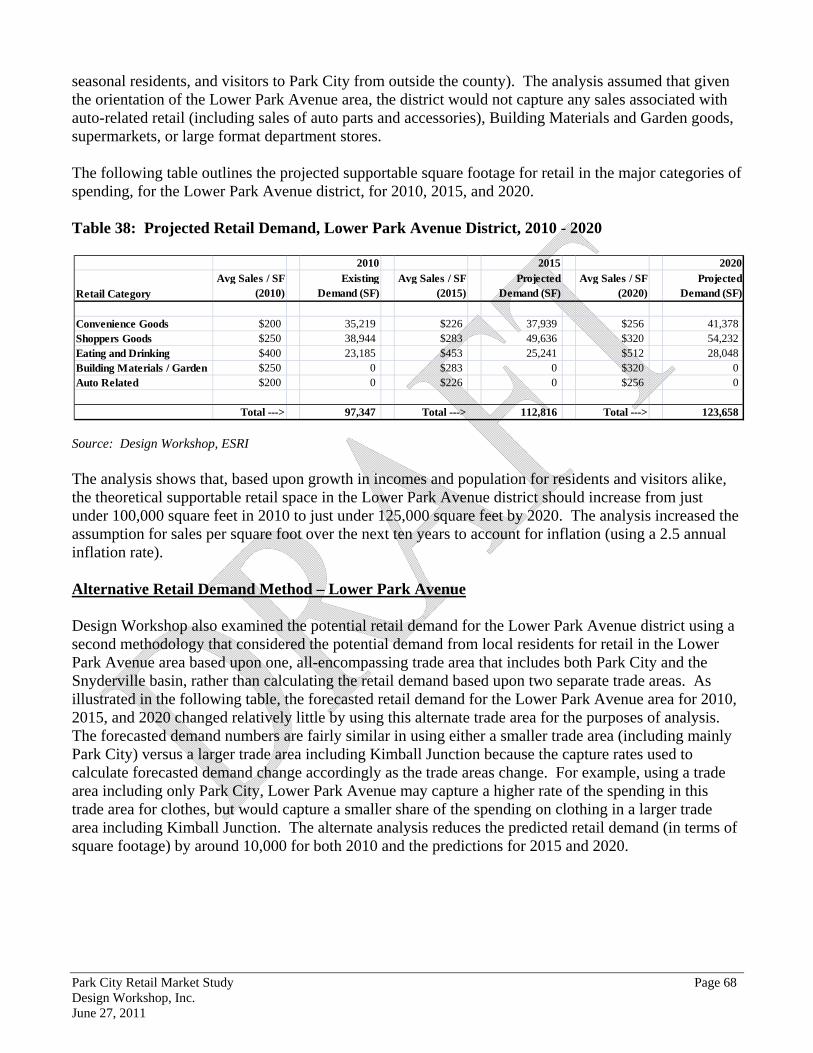
The Lower Park Avenue district, including the area around the Park City Mountain Resort (“PCMR”), has primarily oriented toward day-skiers. While day-skiers will likely remain a stable source of revenue going forward, the study concludes that there are future opportunities to diversify product offerings and add more resort retail to the district. The addition of a wider variety of eating and drinking places, coupled with the introduction of retail and services geared to all visitors and day skiers, will likely result in greater financial returns for property owners and the City.
The PCMR base and areas along Lower Park Avenue must be redeveloped to create a better experience for residents, skiers and visitors. An overall improvement to the aesthetics of the district would enhance PCMR’s marketability and the viability of individual merchants.
This district, including the areas around PCMR, has a tremendous opportunity to redevelop and shape its identity in the Park City marketplace over the next several years. The various property owners should look for opportunities to support both the day skier and destination visitor markets in this part of Park City and should work with PCMR to define development concepts that serve its day skier market while creating a destination district that includes a range of places to eat, shop and have fun that appeal to locals and the greatest variety of tourists possible. At the same time, Lower Park Avenue should look for opportunities to define a distinct identity that does not cannibalize Main Street. One option may involve positioning Lower Park Avenue to specifically target a younger demographic group visiting or living in Park City. The district could feature more tenants and options for entertainment that appeal to younger markets and potentially at lower price points than Main Street. In terms of specific action items, the various property owners and stakeholders should do the following:
Pursue completion of specific projects identified for Lower Park Avenue as part of the city’s visioning processes and extension of the RDA. These projects could tie to transportation improvements, park improvements, streetscape improvements, affordable housing and other city initiatives.
Work with the private sector to confirm site plans for the key gathering places or the main retail “spine” that may develop in the PCMR area.
The City should work with property owners in the area to help identify tenants would help to develop the identity of the district or would result in the greatest levels of business for the district.
Convene meetings regularly as redevelopment progresses to ensure that the district remains united and in order to help create ideas for the identity of the district.
Park City Retail Market Study Page 3 Design Workshop, Inc. June 27, 2011
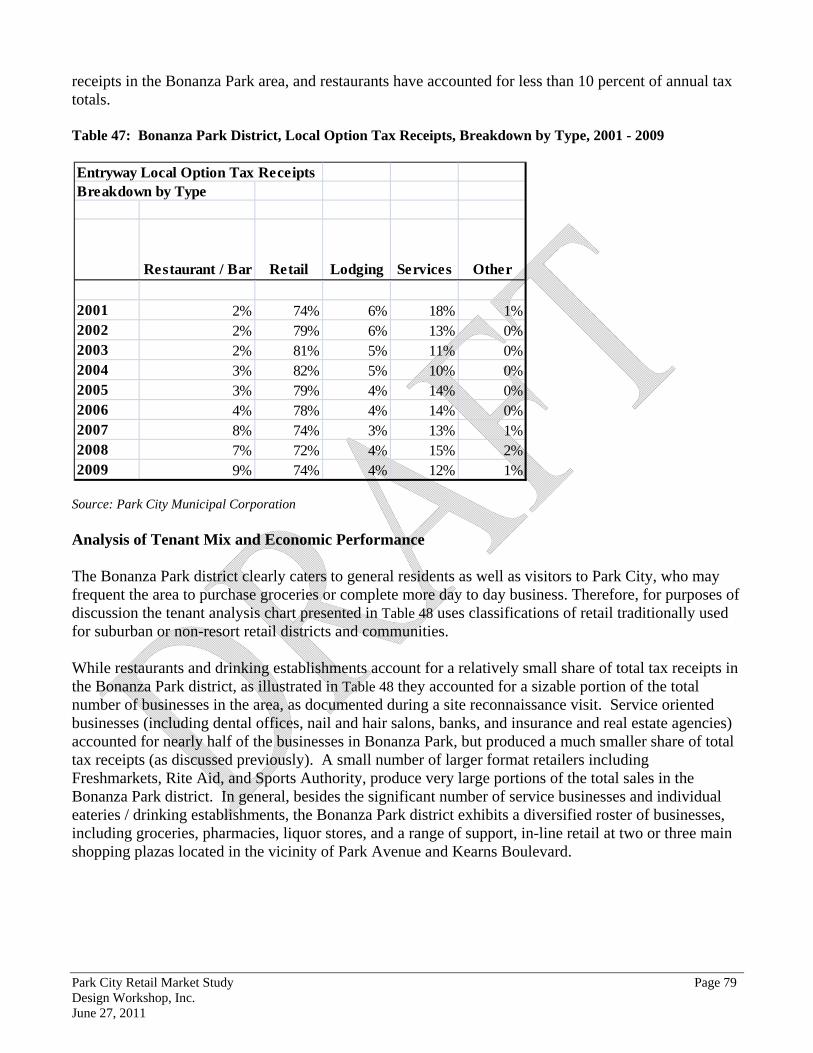
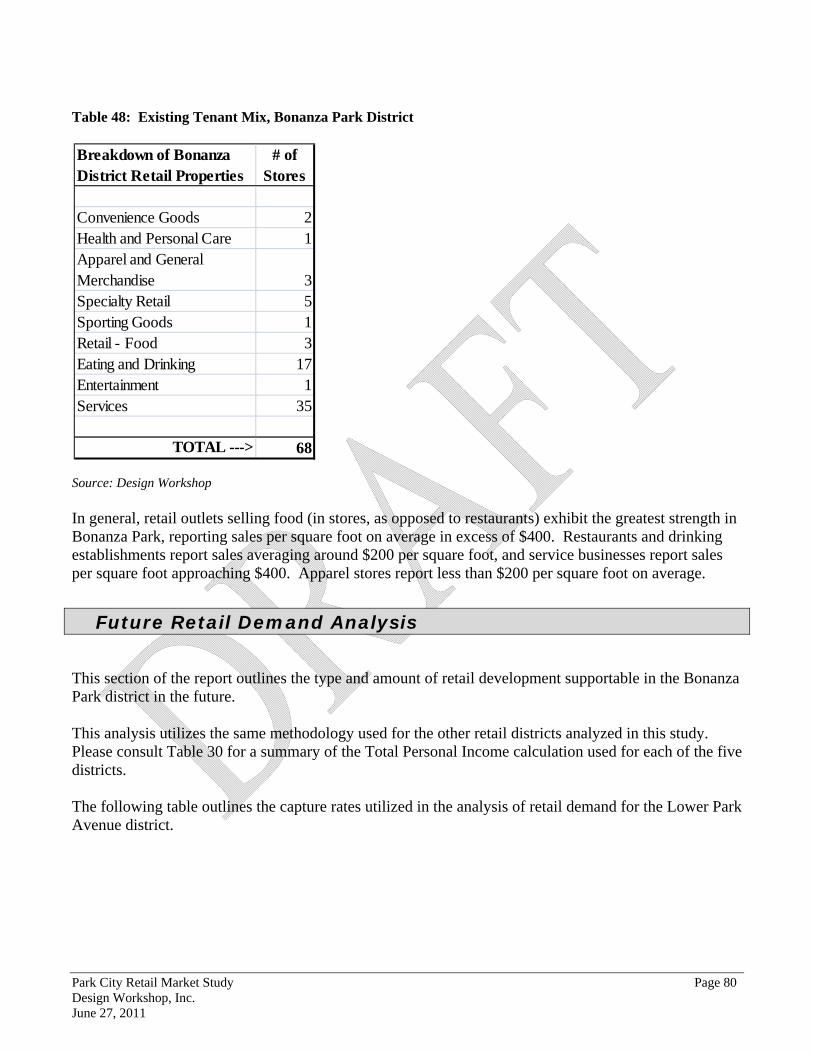
BONANZA PARK: Bonanza Park represents a very vital area of real estate in the community that has and will continue to serve the needs of the local population in Park City. This district should continue to host the businesses and functions that are vital in continuing to operate a full service community with a full-time population. As mentioned earlier, Bonanza Park should have tenants such as the postal service or FedEx that are essential for local businesses. The district should also continue to serve as the home for the main grocery stores, pharmacies, and other everyday uses. The real estate community and the City should continue working to formulate ideas for projects that improve the value proposition and appearance of Bonanza Park, with a focus on local needs. For example, a mixed-use redevelopment in Bonanza Park could include affordable housing units above retail, office or warehouse spaces, and as a result would produce significant benefits to the City in terms of reducing commute times and reducing pollution. The City and stakeholders in the area should work together to develop Bonanza Park as a true neighborhood or district that serves the needs of locals, rather than as a disparate collection of various small shopping plazas and office parks. As part of this effort, the City should work to integrate all of the community features and amenities it would include in any other neighborhood – such as trails, parks and gathering places.
The retail demand analysis confirms Bonanza Park’s status as the largest retail area in the city, serving the day to day needs of residents and visitors with supermarkets, pharmacies, and in-line retail and service offerings. It is important that resident-serving retail and services are maintained in Park City to prevent the further leakage of local dollars to Kimball Junction.
A significant opportunity exists to create a mixed-use program of development and redevelopment in the Bonanza Park area that would include day to day retail and dining, residential (including perhaps affordable housing), and office or business space for companies that require access to the heart of Park City (such as shipping or mail companies or back office operations of restaurants or stores located in the space constrained Main Street district). The Aspen Airport Business Center in Aspen provides a potential model for the community to use going forward in planning for Bonanza Park’s transformation over time into a full-service, mixed-use district.
In terms of specific action items, the City should:
Explore precedent projects or neighborhoods in resort communities that have developed as mixed-use areas that provide housing for residents and also fulfill many of their daily needs. The Aspen Airport Business Center provides a good example that Park City leaders should understand in order to gain insight as they consider options and development projects.
Develop an action list of community improvements (such as streetscape improvements, parks, trails, etc.) the community would desire to integrate with potential redevelopment of portions of Bonanza Park.
The City should work with local property owners and developers to devise strategies to attract a greater diversity of tenants and businesses in the Bonanza Park neighborhood, in order to enhance the overall marketability of the district.
Park City Retail Market Study Page 4 Design Workshop, Inc. June 27, 2011
PROSPECTOR:
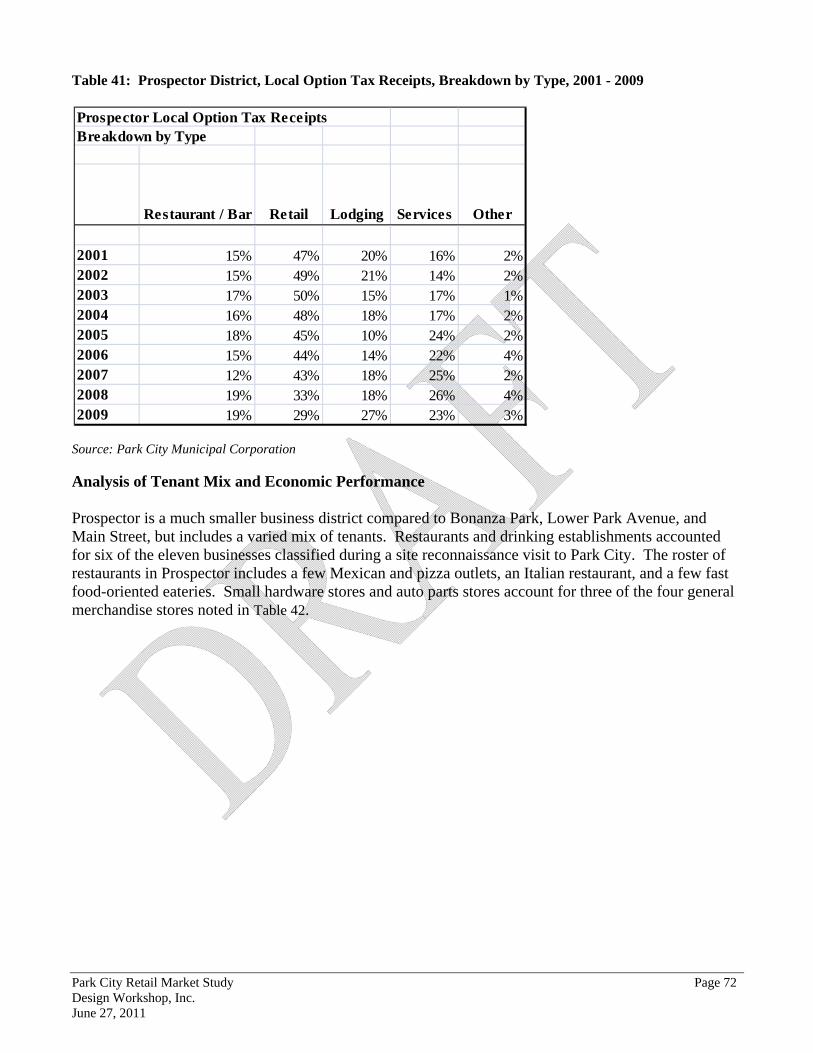
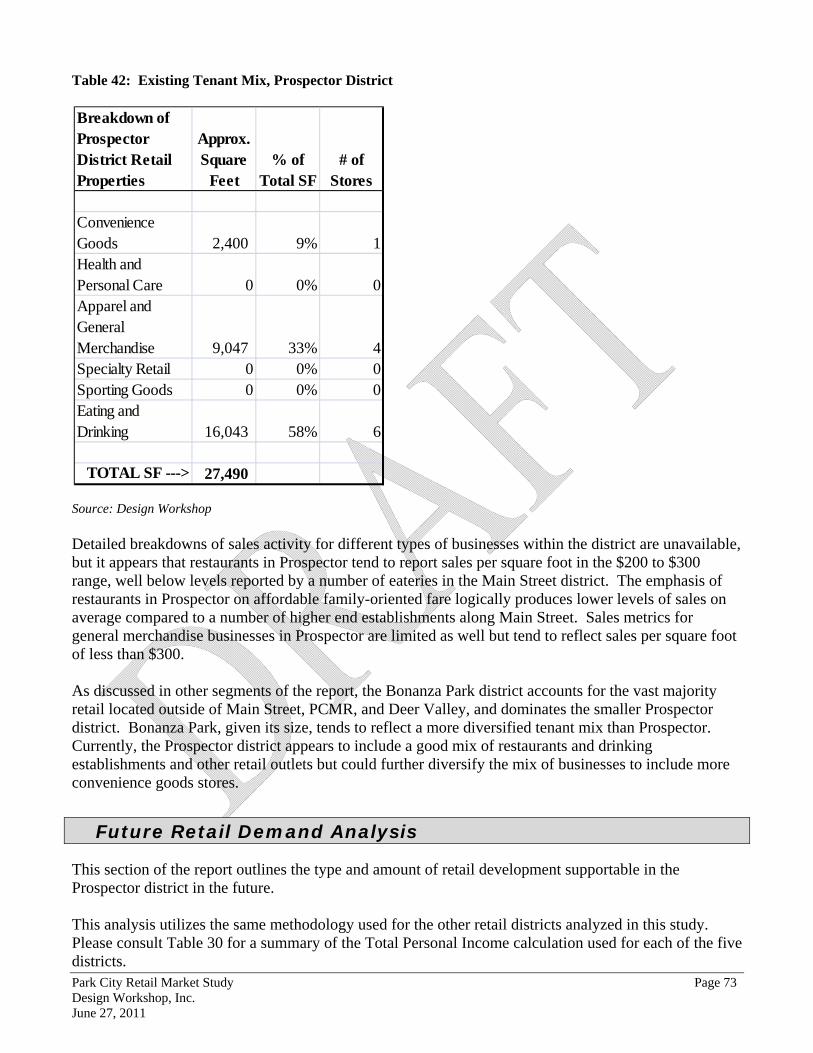
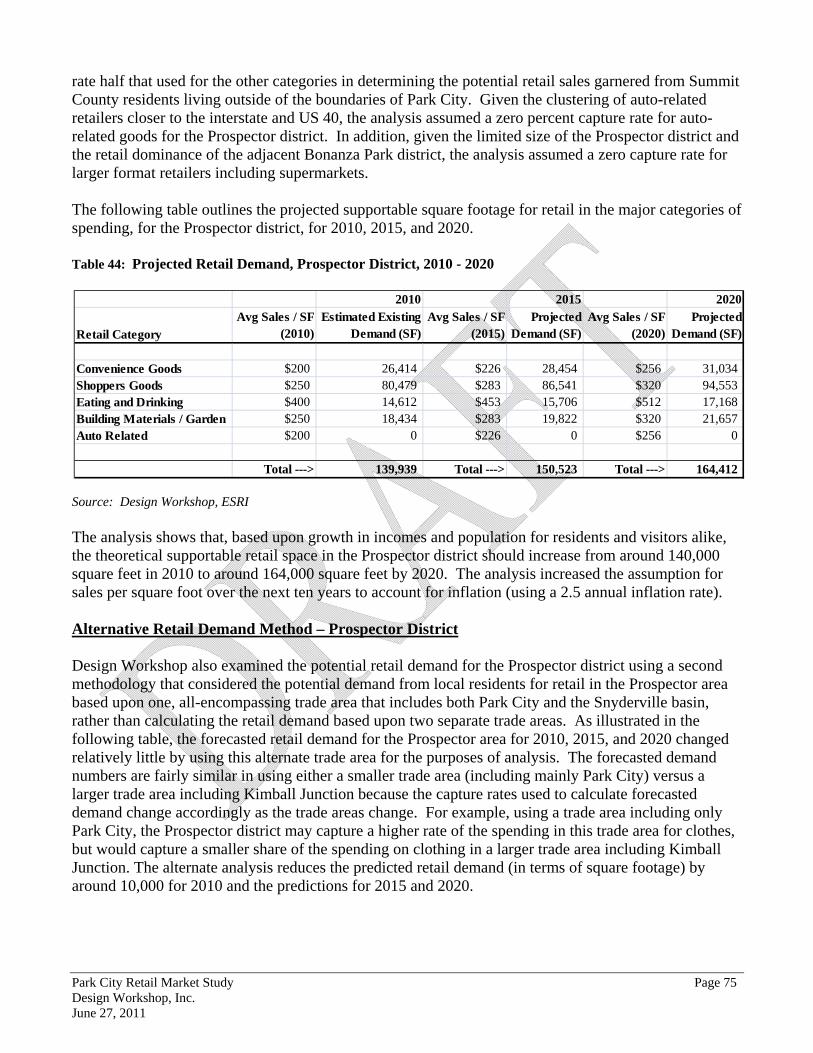
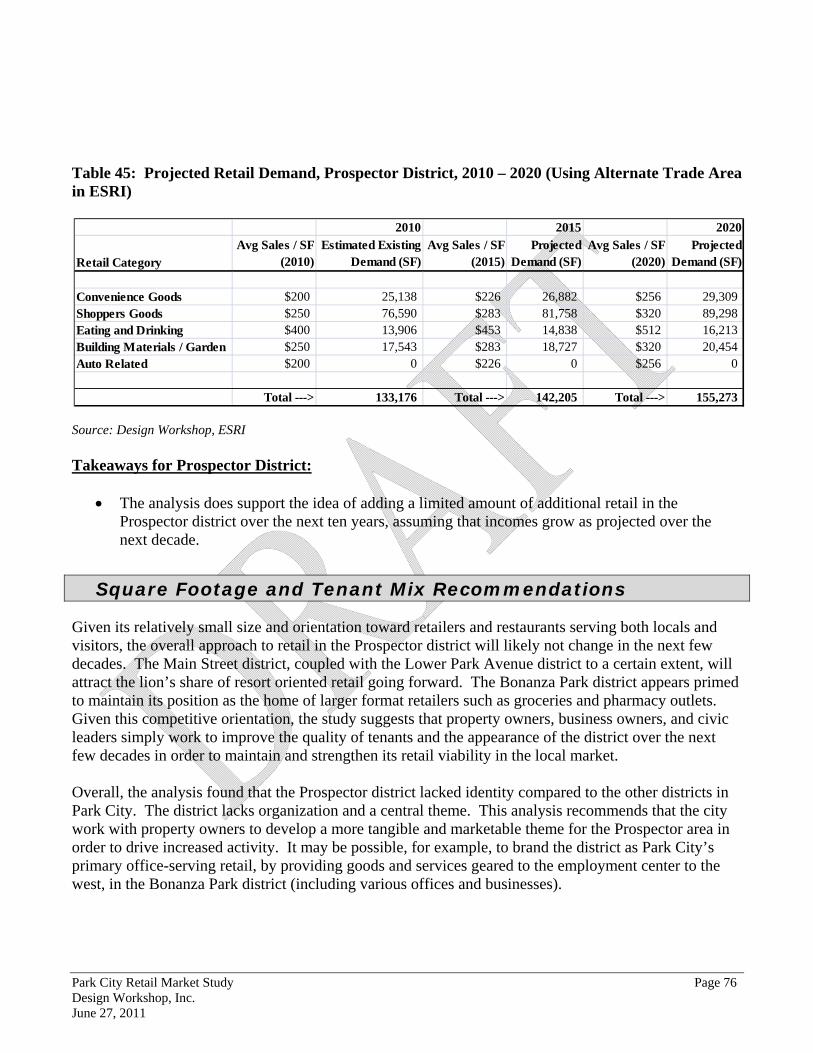
Given its limited size relative to the other retail districts and its location on the periphery of the core of the Park City community, Prospector will likely remain a smaller format retail and office district serving both residents and visitors. While the introduction of new restaurants may enrich the Prospector retail program, the district’s overall emphasis on mid-level restaurants and smaller format retail will likely remain viable for the foreseeable future.
The Prospector district is relatively small compared to neighboring Bonanza Park and appears to function fairly well as the home to smaller restaurants and other businesses that serve visitors from throughout Park City, and in particular those staying at hotels in the Prospector area. The Prospector district also functions fairly well as an office district, as it contains a number of smaller offices for businesses based in Park City. As each of the other retail districts in Park City work to clarify their identity and their role in the local economy, the Prospector district should also work to retain its distinct identity. The district should leverage the adjacency of the area to the rail trail and amenities in the north and east portions of Park City and its adjacency to the larger Bonanza Park area. The City should work with stakeholders to identify improvements that would help improve the viability of the businesses in Prospector as well. Specific recommended action items include:
The City should work with businesses along Sidewinder and other streets within Prospector to solve access or ingress /egress issues that currently face the retailers or office property owners in the district, through traffic management strategies or planned public improvements.
The City should work with the property owners to identify and complete any necessary streetscape improvements, or any open space or trail improvements near the district that would enhance its marketability.
The merchants and business owners should work to increase the name recognition of the Prospector district in Park City and beyond. Enhancing name recognition would help to promote repeat business and higher levels of business.
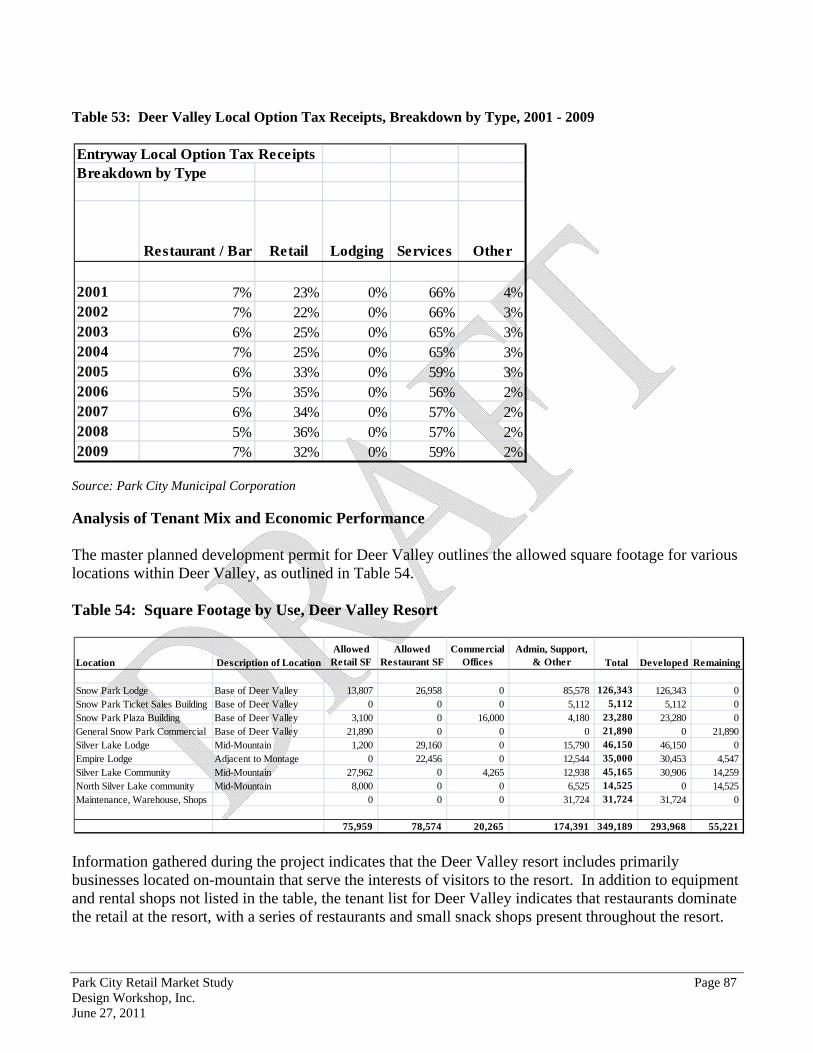
DEER VALLEY: The Deer Valley district includes the retail offerings at the base of the Deer Valley resort as well as shops and restaurants located on the mountain, adjacent to ski runs, and within the resort’s hotels. The resort has the parking area around the base entitled for additional real estate development. The Deer Valley district is relatively small and is relatively isolated from the rest of Park City and Summit County, located behind the Main Street district to the south and east. The retail offerings at Deer Valley appear to have fared fairly well during the economic downturn of the last few years. The priority of Deer Valley in managing this area of retail is how to expand the retail and development program at the appropriate pace to take advantage of an economic upturn, while holding off on speculative development.
Park City Retail Market Study Page 5 Design Workshop, Inc. June 27, 2011
Recommended action items include:
The City should continue working with Deer Valley to ensure that transportation systems in Park City effectively serve the resort from the downtown area. Deer Valley is essentially located in a cul-de-sac location relative to the rest of the community, with only one major route leading out of the resort, and thus must ensure that its transportation connections to Deer Valley Drive and the main part of the community remain functional.
Deer Valley should work to provide the best possible restaurant offerings for guests at the ski resort, as competitor resorts are constantly updating their food service programs and introducing new products to visitors.
Deer Valley should work with City leaders to craft development plans for the parking lot area that satisfy the vision of the community for this part of Park City and also meet market realities.
Park City Retail Market Study Page 6 Design Workshop, Inc. June 27, 2011
Introduction Design Workshop, Inc. (“DW”) was retained by the Park City Municipal Corporation (“City”) to complete a retail market study for five districts within the community (Main Street, Lower Park Avenue, Prospector, Bonanza Park, and Deer Valley) as part of a larger effort to plan for the long-term retail viability of the community over the next few decades. Design Workshop has completed this market study in order to inform larger community planning efforts for the five identified districts and surrounding areas of Park City. Analyzing these districts from a market perspective requires looking beyond the boundaries of the study areas and the Park City area to consider local, regional and national trends impacting Park City and similar ski resort communities in the United States. Understanding and responding to these trends will have a direct impact on the long-term success of planning for retail and commercial success in Park City. The report analyzes current and projected trends for retail uses within the five districts over the near and long term. The report provides profiles of comparable mountain resort communities and draws lessons learned from these communities and the larger U.S. resort market in order to inform recommendations and conclusions for this market study. The report concludes with estimates of projected demand for retail uses within each of the five districts over 5-year and 10-year horizons. All of this information assists the consultant team, city staff, and the public in creating and assessing potential scenarios for the ongoing development and evolution of these five retail districts over the next several years. Study Objectives The following questions were identified by the City as objectives established for this market study:
How has the local real estate market changed over the last few years, and how will recent trends both locally and nationally impact prospective development and improvements within the five retail districts within Park City?
How do recent trends in Park City tied to residential growth, the number of visitors coming to the area, and the second home market impact the five retail districts within Park City?
What mix of retail real estate uses and densities within the five study areas is supported by the local market?
What mix of tenants should each district pursue in order to maximize the retail viability of each district?
How can Park City leverage examples and trends from other resort communities to tailor retail strategies and development policies for each of the five districts within the community, in order to satisfy community-wide goals and maximize economic benefits, both to private property owners and to the City?
Importantly, this retail study is not designed to provide all of the answers for policymakers and elected officials concerning individual development issues or projects. Instead, this document will serve as a tool that the City, various stakeholders, and the public can use going forward in crafting public policy with regard to the overall retail marketplace in Park City and strategies to improve each of the five retail districts outlined in this study.
Park City Retail Market Study Page 7 Design Workshop, Inc. June 27, 2011
SWOT Analysis
An evaluation of the strengths, weaknesses, opportunities and threats (SWOT) facing the five retail districts from a market perspective was completed based upon information gathered during site visits, a review of local market data, and input from discussions with city staff and an advisory committee for the project. For the purposes of this evaluation, strengths and weaknesses are internal factors that the subject of an analysis may control or influence, while opportunities and threats are external factors outside of the control of the subject of an analysis. Strengths:
Significant cultural events (including Sundance and a variety of summer festivals) enhance retail viability.
Opportunity to leverage the convenience of Park City relative to the Salt Lake International Airport.
Opportunity to leverage the strength of PCMR to drive retail growth and redevelopment in the Lower Park Avenue district.
Opportunity to draw retail strength from service and office oriented land uses in the Prospector and Bonanza Park districts.
Addition of five-star hotel accommodations increases high-end clientele. Opportunity to attract and retain support in the Main Street district from locals based upon
increased events and marketing efforts. Weaknesses:
The lack of distinctiveness of retail in the Lower Park Avenue, Prospector, and Bonanza Park districts limits the viability of retail in these areas.
Traffic congestion at peak hours negatively impacts accessibility to / from all five districts. Opportunities:
Park City’s destination appeal has been enhanced as a result of the 2002 Olympics. The significant historical properties and associated appeal of the Main Street district. Opportunity to leverage the convenience of Park City relative to the Salt Lake International
Airport. Threats:
Competing retail at Kimball Junction has limited the viability of local-serving retail in the five subject districts within Park City.
Rising transportation costs (i.e., the price of gasoline and airfares) may decrease travel and associated tourism to Park City.
The potential of continued retail leakage to the Salt Lake City metropolitan area and the Kimball Junction area.
Park City Retail Market Study Page 8 Design Workshop, Inc. June 27, 2011
Demographics, Tourism and Related Trends
Local Demographics (Residents)
This section outlines key demographic trends and projections concerning population, income, age, and other factors pertaining to the permanent residents living in Park City. An evaluation of this information reveals local market trends that impact the viability of retail and other land uses in the Main Street, Deer Valley, Prospector, Bonanza Park and Lower Park Avenue districts in the community. For the purposes of this market study, Design Workshop obtained historical and projected demographic information for the local market area from the U.S. Census as well as data from ESRI Business Solutions (“ESRI”). This organization helps users analyze regions and site locations, visualize and map demographic data, and identify untapped market potential. Based primarily on U.S. Census data along with surveys and other proprietary data sources, ESRI provides historical data and projections of population, median household income, age distribution, and a variety of other metrics relevant to real estate market analysis. This analysis specifically examines the City of Park City and adjoining residential areas in the Deer Valley area as a trade area, as outlined in the map below. This trade area includes all of the areas within the city limits of Park City as well as adjoining residential areas on the west side of U.S. 40, to the east of Deer Valley. This analysis does not include developed unincorporated areas to the north and east, including Snyderville and Kimball Junction. Figure 1: Park City Trade Area
Source: ESRI
Park City Retail Market Study Page 9 Design Workshop, Inc. June 27, 2011
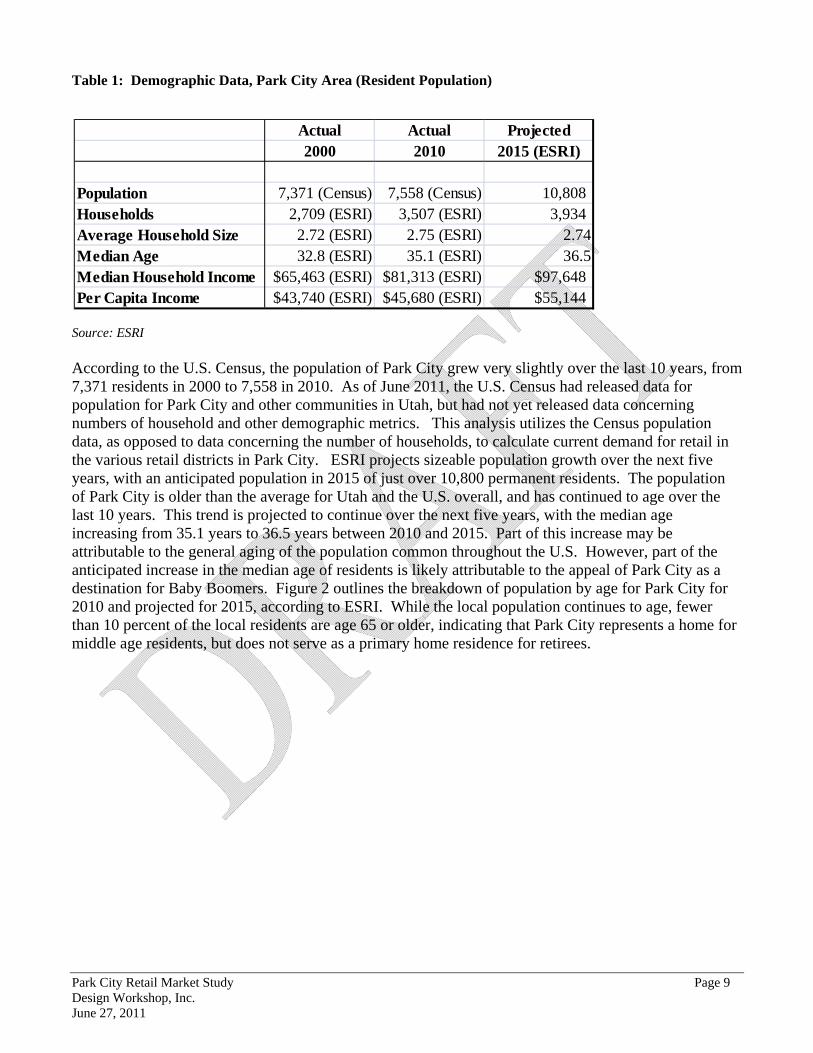
Table 1: Demographic Data, Park City Area (Resident Population)
Source: ESRI According to the U.S. Census, the population of Park City grew very slightly over the last 10 years, from 7,371 residents in 2000 to 7,558 in 2010. As of June 2011, the U.S. Census had released data for population for Park City and other communities in Utah, but had not yet released data concerning numbers of household and other demographic metrics. This analysis utilizes the Census population data, as opposed to data concerning the number of households, to calculate current demand for retail in the various retail districts in Park City. ESRI projects sizeable population growth over the next five years, with an anticipated population in 2015 of just over 10,800 permanent residents. The population of Park City is older than the average for Utah and the U.S. overall, and has continued to age over the last 10 years. This trend is projected to continue over the next five years, with the median age increasing from 35.1 years to 36.5 years between 2010 and 2015. Part of this increase may be attributable to the general aging of the population common throughout the U.S. However, part of the anticipated increase in the median age of residents is likely attributable to the appeal of Park City as a destination for Baby Boomers. Figure 2 outlines the breakdown of population by age for Park City for 2010 and projected for 2015, according to ESRI. While the local population continues to age, fewer than 10 percent of the local residents are age 65 or older, indicating that Park City represents a home for middle age residents, but does not serve as a primary home residence for retirees.
Actual Actual Projected2000 2010 2015 (ESRI)
Population 7,371 (Census) 7,558 (Census) 10,808Households 2,709 (ESRI) 3,507 (ESRI) 3,934Average Household Size 2.72 (ESRI) 2.75 (ESRI) 2.74Median Age 32.8 (ESRI) 35.1 (ESRI) 36.5Median Household Income $65,463 (ESRI) $81,313 (ESRI) $97,648Per Capita Income $43,740 (ESRI) $45,680 (ESRI) $55,144
Park City Retail Market Study Page 10 Design Workshop, Inc. June 27, 2011
Figure 2: Population by Age, Park City Trade Area
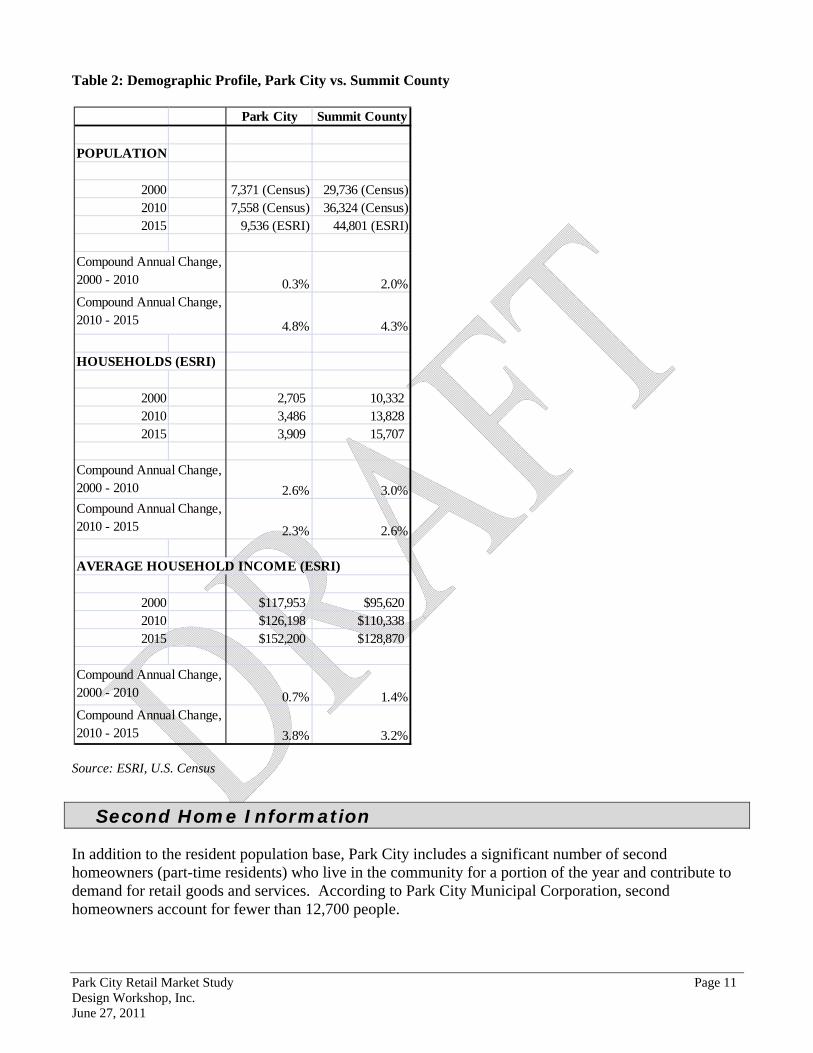
Source: ESRI As outlined in the following table, Summit County as a whole has grown at one of the fastest rates in the state over the last ten years and reached a population of just over 36,000 in 2010 according to the U.S. Census. Overall, the county has a very affluent population, with an average household income in excess of $110,000 in 2010. This significant population and income growth in Summit County, outside of Park City, has helped to stimulate the growth of several retail centers in the Kimball Junction over the last several years, including several projects geared to affluent residents.
Population by Age 2010 2015Park City Trade Area % of Total % of Total
Park City Retail Market Study Page 11 Design Workshop, Inc. June 27, 2011
Table 2: Demographic Profile, Park City vs. Summit County
Source: ESRI, U.S. Census
Second Home Information
In addition to the resident population base, Park City includes a significant number of second homeowners (part-time residents) who live in the community for a portion of the year and contribute to demand for retail goods and services. According to Park City Municipal Corporation, second homeowners account for fewer than 12,700 people.
Park City Retail Market Study Page 12 Design Workshop, Inc. June 27, 2011
Tourism Trends
Visitation to Park City increased markedly during the 1990s and the first half of the 2000s as additional hotels opened in the community and as the national economy continued to expand. Tourism to the city decreased slightly during the recession in 2009 but has rebounded over the last year. Table 3: Overall Trend in Annual Visitors, Park City
Source: Park City Chamber of Commerce Table 4 illustrates the growth in skier days in the Park City area over the last decade. After a period of relatively flat growth during the early part of the 2000s, the number of skier days increased markedly between 2002 and 2005. Skier visits peaked during the 2007-08 ski season at nearly 1.9 million, but then decreased to 1.6 million in 2008-09. The ski market stabilized during the 2009-10 season, with total skier days in excess of 1.7 million.
0
500,000
1,000,000
1,500,000
2,000,000
2,500,000
3,000,000
3,500,000
4,000,000
94959697989900010203040506070809
ANNUAL VISITORS
ANNUAL VISITORS
Park City Retail Market Study Page 13 Design Workshop, Inc. June 27, 2011
Table 4: Park City Skier Days by Year, 1999 – 2010. Includes Deer Valley, PCMR, and Canyons
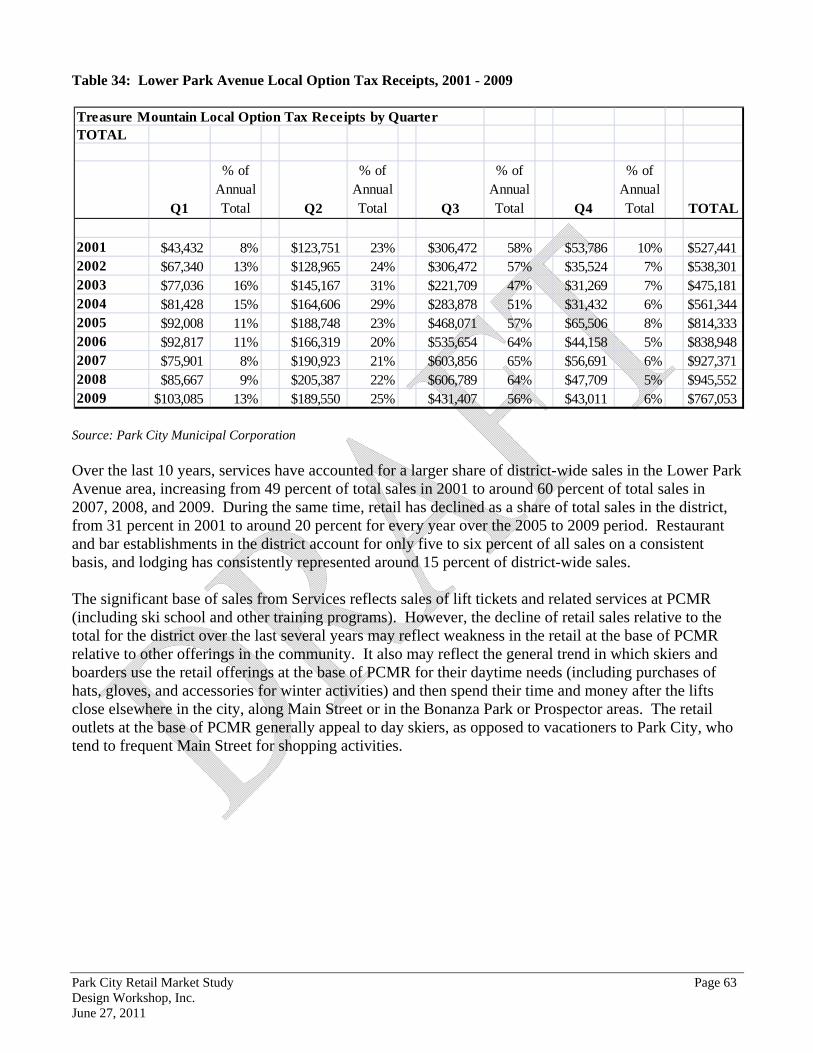
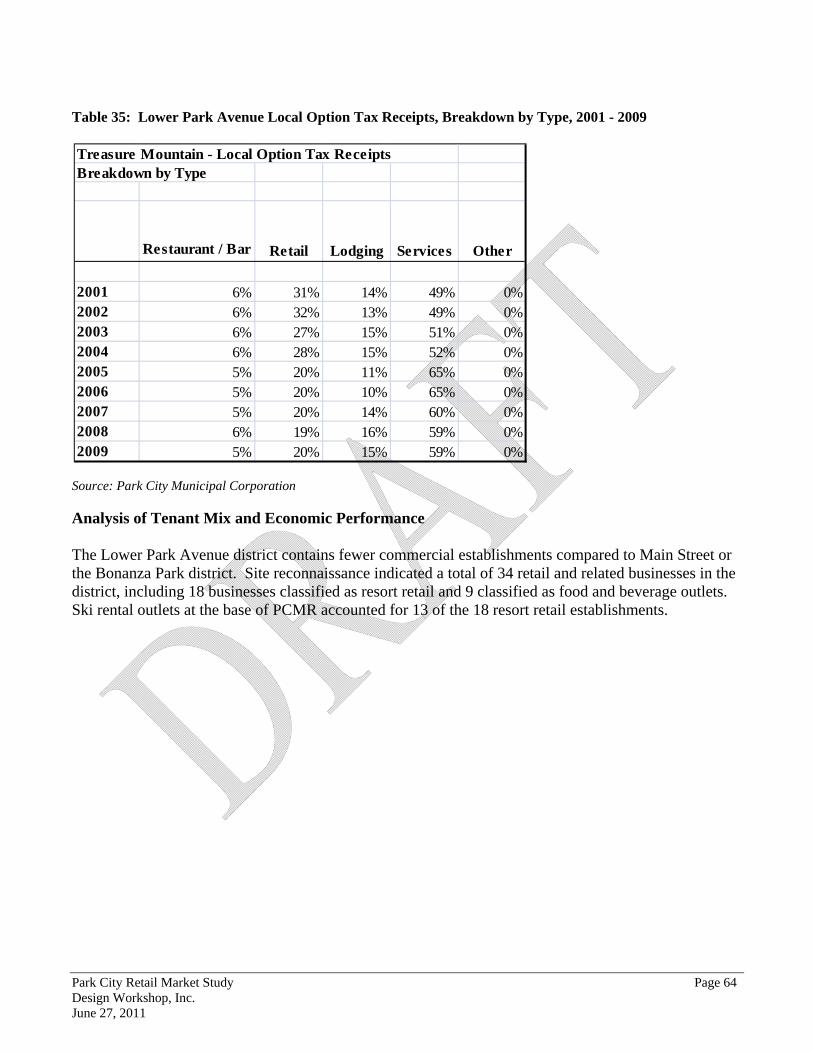
Source: Park City Chamber of Commerce Table 5 illustrates visitor nights in Park City by month from 2000 to 2010. The data indicate that total visitor nights increased steadily from 2000 to 2006, then decreased slightly over the next three years before rebounding slightly in 2010. The first quarter of the year, including the heart of the ski season, has traditionally accounted for 35 to 40 percent of all visitor nights recorded in a given calendar year. Over the last decade, Park City’s seasonality has become less pronounced, with the first quarter’s share of yearly visitor nights decreasing from around 40 percent in 2000 to fewer than 37 percent in 2010. Meanwhile, the second quarter, the slowest quarter traditionally, has increased from around 14 percent of all visitor nights in 2004 to just over 16 percent in 2010. The third quarter continues to consistently average around 26 percent of all visitor nights during a given year, and the fourth quarter averages around 20 percent of visitor nights.
Park City Retail Market Study Page 14 Design Workshop, Inc. June 27, 2011
Table 5: Quarterly Visitor Nights in Park City, 2000 – 2010
Source: Park City Chamber of Commerce / Bureau
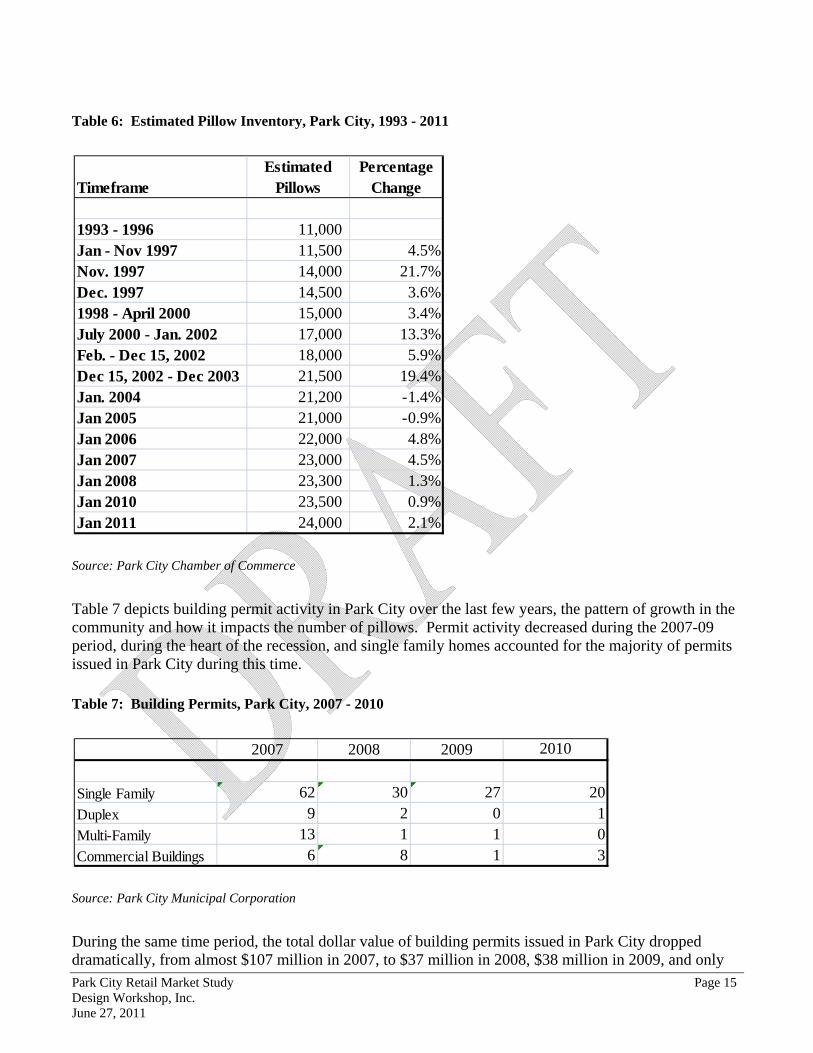
The inventory of pillows available for overnight accommodations, including hotels and rooms in condominiums, houses, and apartments, has continued to grow over the last decade as developers have created a variety of new projects. The following table illustrates this growth in Park City over the last decade. The number of pillows has more than doubled in the last 15 years and as of March 2011, totaled 24,000 pillows city-wide.
4th Quarter Total 469,967 547,997 512,661 529,177 615,744 674,629 654,299 627,431 568,648 563,540 614,8194th Quarter Percentage of Yearly Total 19.8% 20.1% 18.9% 19.9% 21.3% 20.7% 19.5% 19.0% 17.8% 20.0% 20.4%
YEAR TOTAL 2,375,449 2,727,748 2,706,633 2,658,178 2,887,162 3,263,751 3,357,614 3,310,976 3,194,339 2,816,326 3,007,970
Park City Retail Market Study Page 15 Design Workshop, Inc. June 27, 2011
Table 6: Estimated Pillow Inventory, Park City, 1993 - 2011
Source: Park City Chamber of Commerce
Table 7 depicts building permit activity in Park City over the last few years, the pattern of growth in the community and how it impacts the number of pillows. Permit activity decreased during the 2007-09 period, during the heart of the recession, and single family homes accounted for the majority of permits issued in Park City during this time.
Table 7: Building Permits, Park City, 2007 - 2010
Source: Park City Municipal Corporation
During the same time period, the total dollar value of building permits issued in Park City dropped dramatically, from almost $107 million in 2007, to $37 million in 2008, $38 million in 2009, and only
Single Family 62 30 27 20Duplex 9 2 0 1Multi-Family 13 1 1 0Commercial Buildings 6 8 1 3
Park City Retail Market Study Page 16 Design Workshop, Inc. June 27, 2011
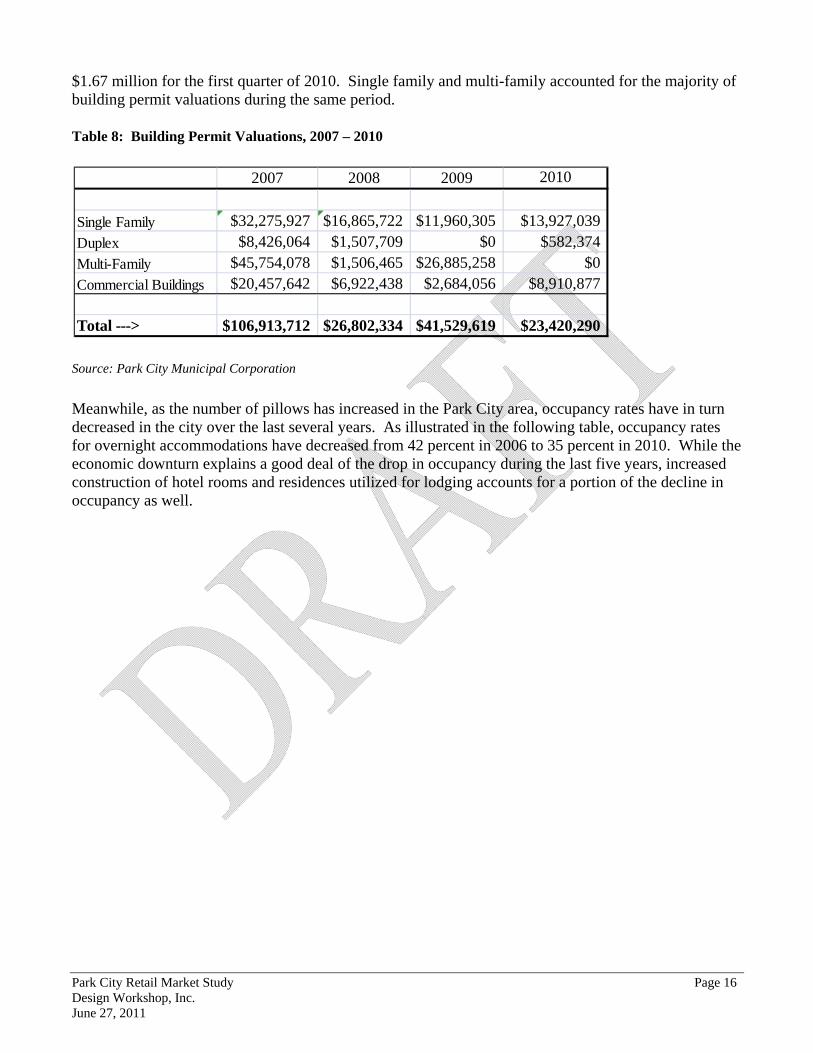
$1.67 million for the first quarter of 2010. Single family and multi-family accounted for the majority of building permit valuations during the same period. Table 8: Building Permit Valuations, 2007 – 2010
Source: Park City Municipal Corporation
Meanwhile, as the number of pillows has increased in the Park City area, occupancy rates have in turn decreased in the city over the last several years. As illustrated in the following table, occupancy rates for overnight accommodations have decreased from 42 percent in 2006 to 35 percent in 2010. While the economic downturn explains a good deal of the drop in occupancy during the last five years, increased construction of hotel rooms and residences utilized for lodging accounts for a portion of the decline in occupancy as well.
2007 2008 2009 2010
Single Family $32,275,927 $16,865,722 $11,960,305 $13,927,039Duplex $8,426,064 $1,507,709 $0 $582,374Multi-Family $45,754,078 $1,506,465 $26,885,258 $0Commercial Buildings $20,457,642 $6,922,438 $2,684,056 $8,910,877
Total ---> $106,913,712 $26,802,334 $41,529,619 $23,420,290
Park City Retail Market Study Page 17 Design Workshop, Inc. June 27, 2011
Table 9: Park City Occupancy Rates, 2000 – 2010
Source: Park City Chamber of Commerce / Bureau
Significance of Resident and Visitor Trends to Park City Retail Districts:
The decreased degree of seasonality in terms of visitor night data may indicate that retailers geared to shoppers in all seasons may begin to perform better than retailers geared only to winter season sales.
The significant increase in pillows in Park City over the last 10 years increases the potential
retail demand in the retail districts, assuming properties associated with the new pillows achieve sustainable occupancy rates over time.
After weathering the recession during the 2008 – 2009 period, visitor totals and skier days have
increased, signaling a period of recovery for the overall Park City economy, including local retailers.
YEAR AVERAGE 41% 44% 41% 34% 37% 43% 42% 40% 37% 33% 35%
Park City Retail Market Study Page 18 Design Workshop, Inc. June 27, 2011
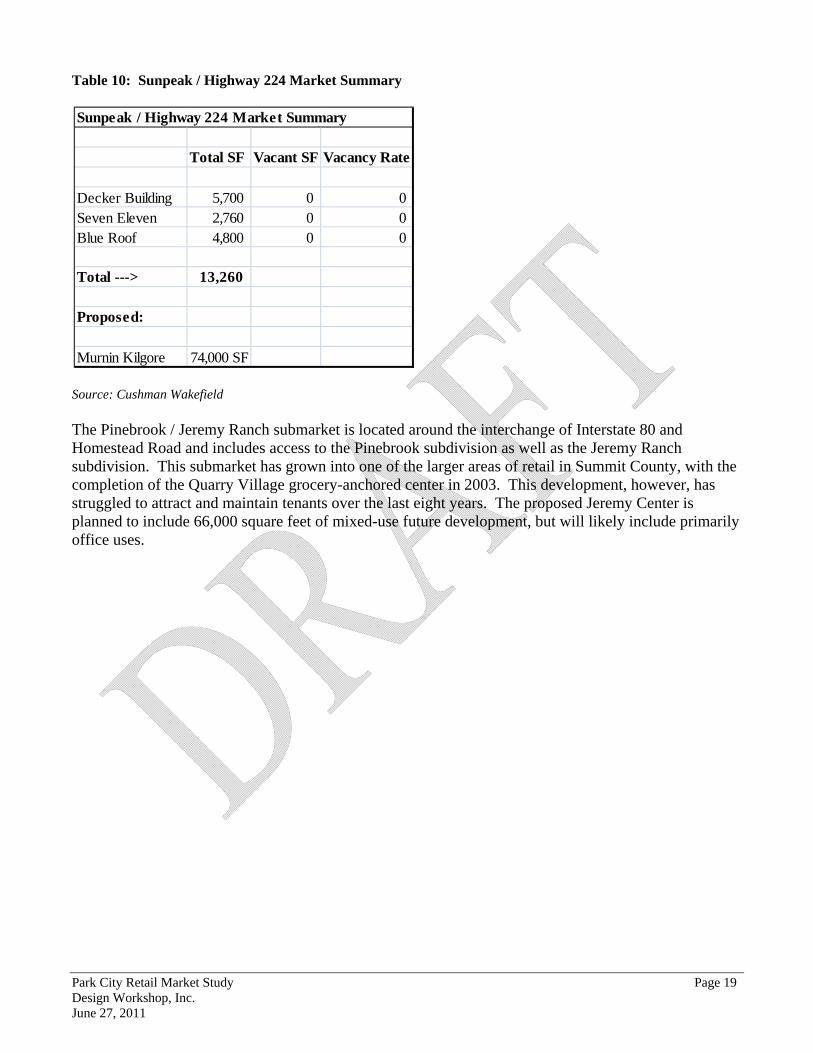
Characteristics of Local Versus Regional Retail Districts While the Main Street, Lower Park Avenue, Prospector, Bonanza Park, and Deer Valley districts primarily appeal to either local residents or visitors to the Park City community, newer retail districts elsewhere in Summit County have appealed to a more regional market with larger format retail. The Kimball Junction area includes a significant outlet mall that draws retail traffic from the nearby Interstate 80, as well as larger format retailers such as Wal-Mart and Best Buy. The Newpark area includes a mixed-use town center that primarily appeals to locals who live to the north of Park City in Summit County and enjoy the new center due to its location and ease of access. However, due to its distance and lack of visibility from Route 224 and the impact of the recession, the Newpark development has experienced significant vacancies for retail space of over 50 percent, according to a study completed by Cushman Wakefield during winter 2011. The adjacent Redstone area, closer to Route 224, includes some limited Main Street or “lifestyle” retailers and similarly appeals to locals living in Summit County, including Park City. Kimball Junction includes around 1.1 million square feet of retail. To the east, near the junction of Interstate 80 and US 40, the Silver Creek area includes around 200,000 square feet of retail, including a Home Depot that comprises around 130,000 square feet and some highway commercial uses (i.e., gas stations, tire shops, etc.). Overall, the Summit County retail market includes around 2.7 million square feet. The various districts within the Park City limits comprise around 1 million square feet. The following outlines the local market inventory for areas located outside of Park City and the associated vacancy rates: Sunpeak / Highway 224 Market Summary This submarket represents the Highway 224 corridor between the Kimball Junction area near Interstate 80 and the Park City limits.
Park City Retail Market Study Page 19 Design Workshop, Inc. June 27, 2011
Table 10: Sunpeak / Highway 224 Market Summary
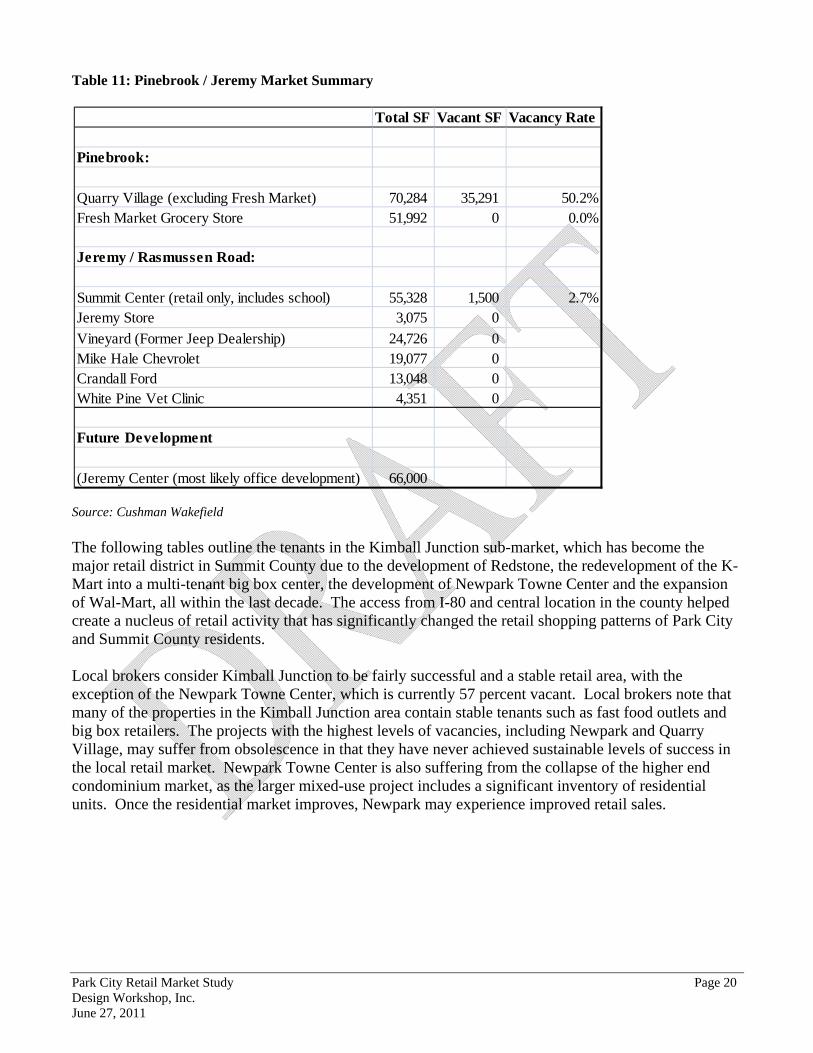
Source: Cushman Wakefield The Pinebrook / Jeremy Ranch submarket is located around the interchange of Interstate 80 and Homestead Road and includes access to the Pinebrook subdivision as well as the Jeremy Ranch subdivision. This submarket has grown into one of the larger areas of retail in Summit County, with the completion of the Quarry Village grocery-anchored center in 2003. This development, however, has struggled to attract and maintain tenants over the last eight years. The proposed Jeremy Center is planned to include 66,000 square feet of mixed-use future development, but will likely include primarily office uses.
Park City Retail Market Study Page 20 Design Workshop, Inc. June 27, 2011
Table 11: Pinebrook / Jeremy Market Summary
Source: Cushman Wakefield The following tables outline the tenants in the Kimball Junction sub-market, which has become the major retail district in Summit County due to the development of Redstone, the redevelopment of the K-Mart into a multi-tenant big box center, the development of Newpark Towne Center and the expansion of Wal-Mart, all within the last decade. The access from I-80 and central location in the county helped create a nucleus of retail activity that has significantly changed the retail shopping patterns of Park City and Summit County residents. Local brokers consider Kimball Junction to be fairly successful and a stable retail area, with the exception of the Newpark Towne Center, which is currently 57 percent vacant. Local brokers note that many of the properties in the Kimball Junction area contain stable tenants such as fast food outlets and big box retailers. The projects with the highest levels of vacancies, including Newpark and Quarry Village, may suffer from obsolescence in that they have never achieved sustainable levels of success in the local retail market. Newpark Towne Center is also suffering from the collapse of the higher end condominium market, as the larger mixed-use project includes a significant inventory of residential units. Once the residential market improves, Newpark may experience improved retail sales.
Total SF Vacant SF Vacancy Rate
Pinebrook:
Quarry Village (excluding Fresh Market) 70,284 35,291 50.2%Fresh Market Grocery Store 51,992 0 0.0%
Jeremy / Rasmussen Road:
Summit Center (retail only, includes school) 55,328 1,500 2.7%Jeremy Store 3,075 0
Vineyard (Former Jeep Dealership) 24,726 0Mike Hale Chevrolet 19,077 0Crandall Ford 13,048 0White Pine Vet Clinic 4,351 0
Future Development
(Jeremy Center (most likely office development) 66,000
Park City Retail Market Study Page 21 Design Workshop, Inc. June 27, 2011
Table 12: Kimball Junction Retail Inventory
Source: Cushman Wakefield
Kimball Junction EastTotal SF Vacant SF Vac. Rate SF by Tenant
Kimball Plaza 37,031 5,292 14%Redstone (with 30,000 SF office) 220,000Redstone - Retail Only 190,000 8,233 4.3%
Landmark - Wirthlin - 6 Pads 61,000Newpark Town Center Pads 10,000
Smith's Pads (2 pad SF estimate) 10,000Total 81,000
WAMU
Park City Retail Market Study Page 23 Design Workshop, Inc. June 27, 2011
The Silver Creek sub-market near the junction of US 40 and I-80 is relatively small and includes an established truck stop and a new multi-tenant retail center anchored by Home Depot. This sub-area has the largest inventory of industrial and flex properties in Summit County, including two buildings of over 100,000 square feet each and ten flex buildings totaling over 150,000 square feet. The area also includes significant acreage zoned for future commercial development along and near the two freeways. The following outlines the retail inventory in Silver Creek. Table 13: Silver Creek Market Summary
Source: Cushman Wakefield Park City has continued to lose retail spending, primarily from local residents, to both the Kimball Junction and Silver Creek areas. In total, the Snyderville Basin includes over 1.5 million square feet of retail space in comparison to just over 1 million in Park City. In general, local brokers consider the Summit County market to not be of sufficient size to absorb more than one location of a given retailer in most categories. In addition, with a total retail inventory in excess of 37 million square feet and including a number of national retailers not present in Summit County, many of the suburban districts in Salt Lake County draw shoppers from throughout Summit County.
Park City Retail Market Study Page 24 Design Workshop, Inc. June 27, 2011
The following table identifies the categories of retail for which Park City is leaking sales. Table 14: Retail Leakage from Park City, 2010
Source: ESRI The Leakage / Surplus Factor presents a snapshot of retail opportunity. This is a measure of the relationship between supply and demand that ranges from +100 (total leakage) to -100 (total surplus). A positive value represents 'leakage' of retail opportunity outside the trade area. A negative value represents a surplus of retail sales, a market where customers are drawn in from outside the trade area. Given the resort orientation of the retail inventory in Park City, the community has traditionally lost retail sales in these categories to areas outside the city limits. Car dealerships, larger format furniture stores, building materials companies such as hardware stores and big box retailers (i.e., general merchandise stores) are located outside of Park City and therefore absorb spending in these categories from the community. Examples of stores that typically contribute to Park City’s retail leakage factor include big box stores such as Home Depot, Wal-Mart, and Target, various car dealers, and larger retail outlets selling furniture and home furnishings. Significance of Regional Retail to Park City Retail Districts:
The emergence of the retail cluster at Kimball Junction has drawn a good deal of the local-oriented retail away from Park City. Therefore, the retail districts in Park City have had to rely more on tourism traffic over the last decade to make up for this retail leakage. In particular, the Prospector and Bonanza Park districts, that traditionally served the local audience more than Main Street or Lower Park Avenue, have suffered from the emergence of significant retail elsewhere in the county.
INDUSTRY GROUPLEAKAGE FACTOR
Motor Vehicle & Parts Dealers 93.9Furniture & Home Furnishings Stores 20.1
Park City Retail Market Study Page 25 Design Workshop, Inc. June 27, 2011
Summary of Key Trends Impacting Resort Retail A number of key trends have impacted resort retail in the major Western resort communities over the last 10 years. While these trends are present in varying degrees in different resort communities (Aspen, Breckenridge, Vail, Jackson Hole, etc.), the following general trends have impacted the region fairly consistently.
Retail offerings catering to residents have tended to move “down valley” or toward satellite towns or locations away from the resort core. For example, the Silverthorne and Frisco areas serve as retail areas for residents in the Summit County, Colorado market (including the Breckenridge and Keystone resort areas), and the Basalt and Carbondale areas largely cater to full-time residents in the Roaring Fork Valley near Aspen.
Restaurants have increased their share of the total retail program in resort communities, and now
include significant higher end restaurant offerings in addition to casual bar and grills in resort areas.
High-end retail stores have tended to command larger shares of resort retail areas (in terms of
sales receipts), including clothing and jewelry stores.
Sporting goods stores now offer a greater variety of clothing and accessories in addition to goods geared to the specific activity in a resort town. For example, ski shops sell more casual wear in addition to selling ski pants and snowboards or ski equipment.
Higher real estate prices (i.e., lease rates) have tended to discourage local and start-up retailers
from launching new ventures in resort areas.
As resort real estate activity accelerated over the last 10 years, space dedicated to real estate sales and service tended to increase in core resort areas such as Aspen and Breckenridge.
Attributes of Successful Resort Retail Retail, including restaurants, in resort communities is one of the most difficult land uses to prove economically sustainable. The turnover of tenants can be frequent, caused by a variety of factors such as the wrong location for a store leading to unsustainable revenues, the failure of a given store to change in response to market desires, a poorly conceived or executed business plan, the under-capitalization of a business, the management of a retail store as a hobby rather than a normal business venture, and a variety of other factors. The success of restaurants and retail businesses has a significant impact on the quality of the visitor experience and overall community vitality. The following list includes attributes of successful retail in a tourism-based community that has a “downtown” or “Main Street” district. Importantly, the municipality does not control or have responsibility for many of these factors. Instead, the initiative and performance of individuals and companies in the private sector control the fate of a retail business or an overall retail district to a great extent.
Park City Retail Market Study Page 26 Design Workshop, Inc. June 27, 2011
Identity Main Street and “downtown” needs to maintain an identifiable image. The identity should be reinforced by providing for consistency in quality of signage, store fronts and merchants.
Ambiance Create ambiance through effective lighting and seating strategies
and the creation of a “sense of place”. “Town Center” Downtown should provide an opportunity for visitors to mix with
local residents. Providing a central meeting place (such as a town square or similar amenity) is also important in creating a successful town center.
Variety of Stores Successful retail districts provide sufficient variety in terms of
stores and the merchandise or services provided by various stores. The degree of retail variety will greatly impact the quality of the visitor experience.
Retail as Entertainment The retail environment and opportunities should be fun and
entertaining. Retail districts may introduce elements of entertainment through the design of the physical space as well as the inclusion of specific entertainment-oriented tenants, such as virtual golf and skiing centers, or shops that show how candles or other goods are made.
Reflect Demographic Profile The tenant mix in a downtown must meet the consumer demands
of its patrons. Retailers should keep close tabs on and respond to the changing demographic profiles of visitors and of residents.
Quality Few visitors come to Park City to buy cheap or poor quality items.
The customer’s purchase should provide a good perceived value for the money spent. Quality is important and items should not be dramatically over-priced.
Be Fun Downtown can be the “fun place” within the community.
Effective tenant strategies, coupled with targeted signage programs, banners, special events, activities, and entertainment, help provide for a fun and lively shopping and visitor experience. Each and every store should exhibit innovation and quality in its offerings.
Only One Ideally, a store located downtown will not have another location
elsewhere in the local area. Resort communities should ensure that they have given the visitor a reason to go to Main Street by creating a distinct retail image and experience. One of a kind tenants help to enhance this experience.
Park City Retail Market Study Page 27 Design Workshop, Inc. June 27, 2011
Easiest Way People tend to take the easiest way into and out of a retail space. Retail located along the “easiest way” route in a given district dramatically benefits from this pattern. Downtowns should include clear pedestrian connections to every retailer throughout the district that are easy to follow, well-signed, and interesting in their appearance.
Satisfy Market Needs Offerings in resort retail districts should include both common
retail merchandise (i.e., souvenirs, sporting goods, etc.) as well as indulgences (i.e., jewelry, art, etc), which offer special opportunities the guest would not typically buy at home. Resort retail districts should target a mix of 35 percent resort retail, 15 percent services, 5 percent entertainment, at least 25 percent restaurant and 20 percent “other commercial” in terms of square footage.
Save the Best for Food The best locations, in terms of pedestrian traffic, visibility and
convenience, should be identified for restaurants and bars. Food drives retail.
Make It Special Offer ongoing special events and activities. Create reasons for
visitors and the public to explore the district. Be Open Many retailers and restaurants in resort towns have traditionally
closed for spring and fall shoulder seasons. Visitors respond by assuming that many places will be closed and stop coming during those months.
Locals are Welcome Retailers and restaurants need local patronage in the off seasons.
Experience in other town’s shows that if locals don’t feel welcome when the tourists are in town, they are not going to shop or dine at an establishment in the low seasons. Being local-friendly is important. Loyalty programs can add to success.
Go Digital Make sure that retail stores and information can be found on
smartphone apps such as “aroundme,” “where,” etc. Use Social Media Send up-to-the-moment news on specials, promotions, and events
via Facebook and Twitter. Celebrate People Hire nice, smart, talented staff. Train them. Treat them well, listen
to them, educate them, and teach them your values and vision.
Park City Retail Market Study Page 28 Design Workshop, Inc. June 27, 2011
Comparable Resort Community Analysis An analysis of retail and associated trends in comparable resort communities, including Vail, Breckenridge, and Aspen, provides lessons learned for Park City in helping to plan for the ongoing economic health of the community. ASPEN Located around four hours by car and 30 minutes by plane from Denver International Airport, Aspen represents one of the oldest and most famous ski resort communities in the world. Aspen developed as a major mining town in the 1800s, then fell on hard times in the early 20th century before emerging as a growing resort community following World War II. The ski area opened its first chairlift, the longest in the world at the time, in 1945. The first Goeth Bicentennial Convocation was held in 1949 and this event led to the founding of the Aspen Institute for Humanistic Studies and the Aspen Music Festival. The community hosted the FIS World Championships in 1950, thereby confirming Aspen’s status as an international ski destination. Active winter sports include skiing, snowboarding, snowshoeing, ice skating, Nordic skiing, and snowmobiling. Shopping in downtown Aspen and après-ski dining and entertainment also account for a higher percentage of visitor spending. Aspen has leveraged a number of cultural events, including the Aspen Music Festival, Aspen Ideas Festival, and a variety of theater and music events, to counter the cyclical nature of ski resort business and create significant demand during the summer months. Key summer activities for visitors include shopping, whitewater rafting, bicycling, hiking, hot air ballooning, horseback riding, jeep tours, paragliding, and kayaking. The Aspen Music School and Festival, which runs for over ten weeks each summer, provides over 80 concerts and musical events annually. The 2010 Census counts 6,529 full time residents. Total residents, including visitors and those who live there year-round, average 14,682. The total of residents and visitors peaks at just over 16,000 people during the December through March time period, according to 2009 data from the Aspen Consolidated District Wastewater Treatment Facility. The four ski mountains of Aspen Mountain, Aspen Highlands, Buttermilk and Snowmass combine for approximately 1.3 million skier visits per year. Market positioning vs. local, regional and national competitors Aspen is internationally recognized and has a substantial number of international visitors in both winter and summer. During the ski season it has international fame as a glitzy playground for the wealthy and famous. Aspen has become a second and third home to many international jet setters. The downtown has evolved into an upscale shopping district that includes high-end restaurants, salons, and boutiques. Aspen shopping includes elite retailers such as Ralph Lauren, Dior, Louis Vuitton, Prada, Gucci, Fendi, Bvlgari, Burberry, Brioni, and Ermenegildo Zegna boutiques. Ski Magazine has ranked Aspen number 7 in its 2010 / 2011 resort rankings.
Park City Retail Market Study Page 29 Design Workshop, Inc. June 27, 2011
Air service Aspen/Pitkin County Airport (ASE) is located three miles from downtown Aspen. Commercial air service is limited. United Airlines flies from Denver and seasonally from Chicago, San Francisco and Los Angeles. Frontier provides service from Denver. Delta has periodically provided service into and out of Aspen on a limited basis but withdrew service in 2010. There are approximately 200,000 commercial enplanements per year. General Aviation is very important to the success of Aspen, as private aircraft arrive from all over the country. Municipal Financial Overview The City of Aspen operates from a $25 million general fund budget, and special revenue funds generate another $29 million annually. These finance budget categories including parks and open space, housing, transportation, the Wheeler Opera House, Kid First Fund and the stormwater fund. Enterprise Funds contribute another $21 million per year. Enterprise Funds include the water, electricity, renewable energy, parking, golf and two project-specific housing funds. Accounting for interfund transfers, Aspen’s annual revenue exceeds $61 million. Affordable Housing Initiatives and Programs Aspen began housing programs in 1974 with dual programs at the city and at the county and the community joined these separate efforts together with the formation of the Aspen / Pitkin County Housing Authority in 1998. Aspen has long been the leader among major resort communities in providing deed-restricted for-sale and for-rent housing. Two main funding sources provide for the housing program -- the Real Estate Transfer Tax (RETT) and a portion of a sales tax. The RETT is a 1 percent transfer tax on the sales price of all real estate sold within the City of Aspen only and does not apply to the first $100,000 of each sale. The RETT alone raises over $3 million per year for the affordable housing program and was extended for a third time in 2001 for an additional 20 years - to December 31, 2024. The Aspen / Pitkin County Housing Authority includes over 1,400 deed-restricted ownership units under its jurisdiction, ranging from studio units to single family homes. In addition, the authority controls approximately 1,000 year-round rental units and 300 seasonal rental units in the program. Key community amenities that drive tourism-based economic activity Skiing remains Aspen’s main attraction and occupancy at area lodging facilities peaks in the months between January and March. The second main focus of the Aspen community is on cultural events during the summer months. Aspen’s natural setting is its key amenity. It sits at the upper end of the Roaring Fork Valley with the Roaring Fork River running through town. It offers rich history, outdoor recreation opportunities, cultural activities and natural scenery. Much of the area around Aspen is public land located within the White River National Forest. The Elk Mountains rise to the south and west of Aspen, with the Williams Mountains and the Sawatch Range to the east. The Maroon Creek, Castle Creek and Hunter Creek Valleys are all accessible from town. Much of the high mountain area surrounding Aspen lies within designated wilderness areas in the Maroon Bells-Snowmass, Hunter-Fryingpan, and Collegiate Peaks wildernesses. Festivals and special events have been instrumental in activating shoulder seasons. Retail
Park City Retail Market Study Page 30 Design Workshop, Inc. June 27, 2011
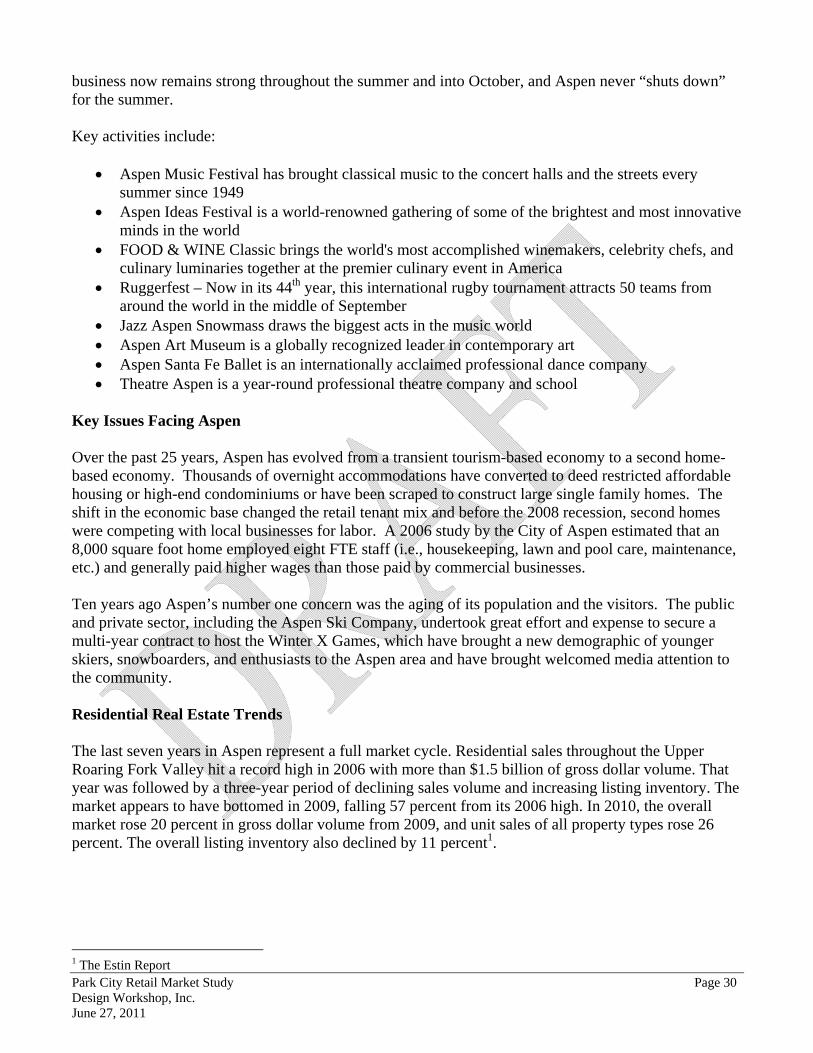
business now remains strong throughout the summer and into October, and Aspen never “shuts down” for the summer. Key activities include:
Aspen Music Festival has brought classical music to the concert halls and the streets every summer since 1949
Aspen Ideas Festival is a world-renowned gathering of some of the brightest and most innovative minds in the world
FOOD & WINE Classic brings the world's most accomplished winemakers, celebrity chefs, and culinary luminaries together at the premier culinary event in America
Ruggerfest – Now in its 44th year, this international rugby tournament attracts 50 teams from around the world in the middle of September
Jazz Aspen Snowmass draws the biggest acts in the music world Aspen Art Museum is a globally recognized leader in contemporary art Aspen Santa Fe Ballet is an internationally acclaimed professional dance company Theatre Aspen is a year-round professional theatre company and school
Key Issues Facing Aspen Over the past 25 years, Aspen has evolved from a transient tourism-based economy to a second home-based economy. Thousands of overnight accommodations have converted to deed restricted affordable housing or high-end condominiums or have been scraped to construct large single family homes. The shift in the economic base changed the retail tenant mix and before the 2008 recession, second homes were competing with local businesses for labor. A 2006 study by the City of Aspen estimated that an 8,000 square foot home employed eight FTE staff (i.e., housekeeping, lawn and pool care, maintenance, etc.) and generally paid higher wages than those paid by commercial businesses. Ten years ago Aspen’s number one concern was the aging of its population and the visitors. The public and private sector, including the Aspen Ski Company, undertook great effort and expense to secure a multi-year contract to host the Winter X Games, which have brought a new demographic of younger skiers, snowboarders, and enthusiasts to the Aspen area and have brought welcomed media attention to the community. Residential Real Estate Trends The last seven years in Aspen represent a full market cycle. Residential sales throughout the Upper Roaring Fork Valley hit a record high in 2006 with more than $1.5 billion of gross dollar volume. That year was followed by a three-year period of declining sales volume and increasing listing inventory. The market appears to have bottomed in 2009, falling 57 percent from its 2006 high. In 2010, the overall market rose 20 percent in gross dollar volume from 2009, and unit sales of all property types rose 26 percent. The overall listing inventory also declined by 11 percent1.
1 The Estin Report
Park City Retail Market Study Page 31 Design Workshop, Inc. June 27, 2011
The median sales price in the Aspen area has fluctuated over the past five years, as expected, but has experienced a gradual increase since the spring of 2010. Average sales prices dramatically decreased starting in November 2008, reflective of national market trends2.
Figure 3: Aspen Residential Sales, 2004 – 2010
Source: The Estin Report Description of Commercial / Retail Base in Aspen The City of Aspen includes approximately 1.4 million square feet of existing commercial space, and city officials estimate that the community is around 90 percent built-out. Officials estimate that around 150,000 square feet of new commercial space could still be built given the physical constraints of the community. Mountain ranges and residential development line the edges of Aspen in all directions, leaving very little room for physical expansion. The following table illustrates the breakdown of retailers in Downtown Aspen over the last 20 years. Clothing stores and service businesses (including salons and spas) have increased in number while the number of home furnishing stores has decreased.
2 Land Title, October 2010
Park City Retail Market Study Page 32 Design Workshop, Inc. June 27, 2011
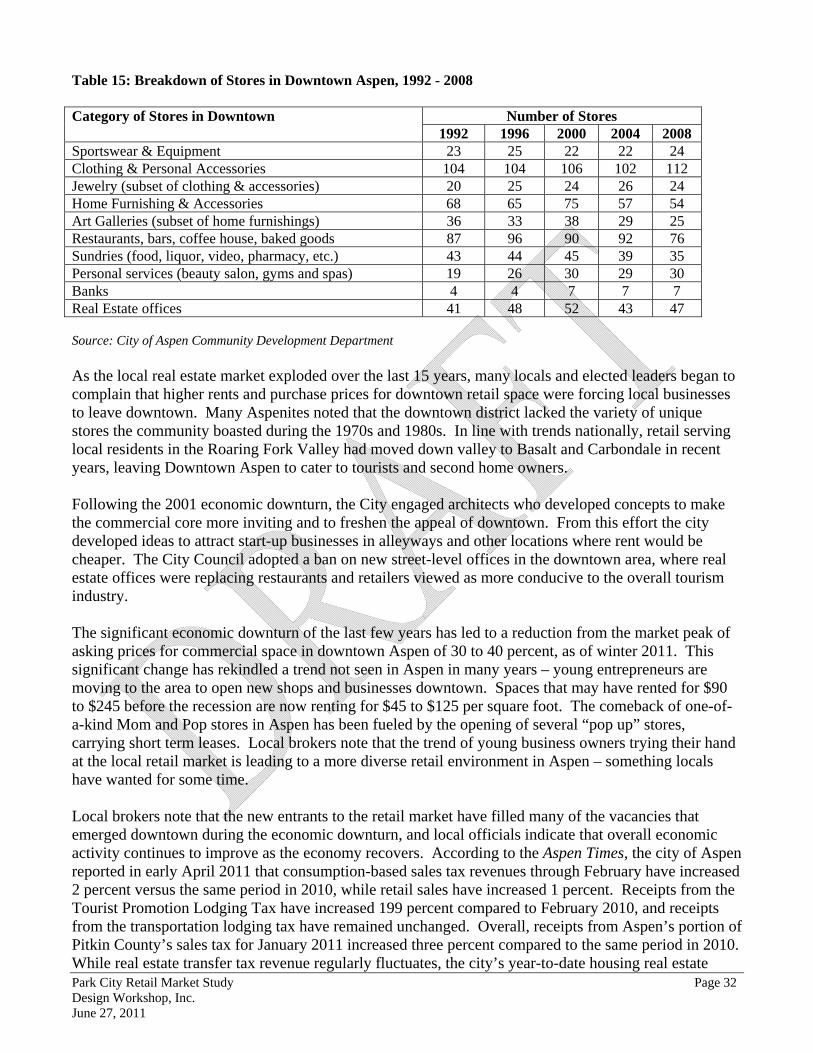
Table 15: Breakdown of Stores in Downtown Aspen, 1992 - 2008 Category of Stores in Downtown Number of Stores
1992 1996 2000 2004 2008 Sportswear & Equipment 23 25 22 22 24 Clothing & Personal Accessories 104 104 106 102 112 Jewelry (subset of clothing & accessories) 20 25 24 26 24 Home Furnishing & Accessories 68 65 75 57 54 Art Galleries (subset of home furnishings) 36 33 38 29 25 Restaurants, bars, coffee house, baked goods 87 96 90 92 76 Sundries (food, liquor, video, pharmacy, etc.) 43 44 45 39 35 Personal services (beauty salon, gyms and spas) 19 26 30 29 30 Banks 4 4 7 7 7 Real Estate offices 41 48 52 43 47 Source: City of Aspen Community Development Department As the local real estate market exploded over the last 15 years, many locals and elected leaders began to complain that higher rents and purchase prices for downtown retail space were forcing local businesses to leave downtown. Many Aspenites noted that the downtown district lacked the variety of unique stores the community boasted during the 1970s and 1980s. In line with trends nationally, retail serving local residents in the Roaring Fork Valley had moved down valley to Basalt and Carbondale in recent years, leaving Downtown Aspen to cater to tourists and second home owners. Following the 2001 economic downturn, the City engaged architects who developed concepts to make the commercial core more inviting and to freshen the appeal of downtown. From this effort the city developed ideas to attract start-up businesses in alleyways and other locations where rent would be cheaper. The City Council adopted a ban on new street-level offices in the downtown area, where real estate offices were replacing restaurants and retailers viewed as more conducive to the overall tourism industry. The significant economic downturn of the last few years has led to a reduction from the market peak of asking prices for commercial space in downtown Aspen of 30 to 40 percent, as of winter 2011. This significant change has rekindled a trend not seen in Aspen in many years – young entrepreneurs are moving to the area to open new shops and businesses downtown. Spaces that may have rented for $90 to $245 before the recession are now renting for $45 to $125 per square foot. The comeback of one-of-a-kind Mom and Pop stores in Aspen has been fueled by the opening of several “pop up” stores, carrying short term leases. Local brokers note that the trend of young business owners trying their hand at the local retail market is leading to a more diverse retail environment in Aspen – something locals have wanted for some time. Local brokers note that the new entrants to the retail market have filled many of the vacancies that emerged downtown during the economic downturn, and local officials indicate that overall economic activity continues to improve as the economy recovers. According to the Aspen Times, the city of Aspen reported in early April 2011 that consumption-based sales tax revenues through February have increased 2 percent versus the same period in 2010, while retail sales have increased 1 percent. Receipts from the Tourist Promotion Lodging Tax have increased 199 percent compared to February 2010, and receipts from the transportation lodging tax have remained unchanged. Overall, receipts from Aspen’s portion of Pitkin County’s sales tax for January 2011 increased three percent compared to the same period in 2010. While real estate transfer tax revenue regularly fluctuates, the city’s year-to-date housing real estate
Park City Retail Market Study Page 33 Design Workshop, Inc. June 27, 2011
transfer tax collections have increased 18 percent from 2010. The table below illustrates that restaurants and bars, along with specialty retail, have helped lead the recovery in the Aspen retail market in recent months. Table 16: February 2011 Year-to-Date Retail Sales, City of Aspen Category YTD retail sales % change prior year Accommodations $35,869,975 2% Restaurants/bars $19,186,951 4% Sports equipment $8,726,292 2% Clothing $10,359,961 -1% Food & drug $8,360,055 -6% Liquor $1,645,285 2% General retail $5,641,707 -2% Specialty retail $5,113,140 9% Jewelry/gallery/fur $2,279,506 1% Utilities $8,017,169 -7% Automobile $2,274,997 6% Miscellaneous $207,391 155% Total $107,682,428 1% Source: City of Aspen Impact of the X Games The X Games have helped provide an overall fiscal impact to Aspen since arriving in town in 2002. ESPN, which runs the event, customarily fills the town’s hotels and lodges with over 300 people about a month in advance of the event and about 1,000 during the two-week period surrounding the games. The Games bring 70,000 to 80,000 fans into Aspen / Snowmass each year, helping the community to sell out its rooms during a period of the season when occupancy usually remains around 70 percent. In 2004, the community estimated the direct and indirect benefits of the X games to be $60 million annually. Perhaps just as important, the X Games has helped to refresh Aspen’s brand image. The community had gained a reputation over the years as ski town destination for an older, wealthier set, and the X Games helped to strengthen Aspen’s appeal to the younger generation of snowboarders and skiers. Officials with the Aspen Ski Company say the X Games have helped introduce the area to new customers and lead to repeat visits and repeat business. Some even have claimed that the X Games, at least for a few weeks, has helped Aspen return to its roots during the 1960s and 1970s as an edgy, hip ski town for young people. Takeaways for Park City:
The significant increase in second homeownership in Aspen decreased the size of the resident population and therefore diminished the appeal of local-serving retail in the downtown area.
In keeping with national trends, local-serving retail in Aspen moved down valley. However, given the physical layout and growth restrictions within the Roaring Fork Valley, the local retail base moved considerably far away from Aspen, to the Basalt area (nearly 20 miles away from Aspen). This transformation further isolated Aspen at the end of the Roaring Fork Valley.
Park City Retail Market Study Page 34 Design Workshop, Inc. June 27, 2011
Local leaders complained that the downtown area had lost variety and diversity in its tenant offerings as service uses including real estate offices took over. However, the recent economic downturn has offered opportunities for new entrants to diversify the local retail marketplace.
VAIL General description Located in the central Colorado mountains around 100 miles west of Denver and 30 miles east of Eagle, Vail boasts the largest ski area in North America in terms of acreage and has continued to grow and reinvent itself during the recent economic downturn. Interstate 70 bisects the community, running through the middle of the Vail Valley, and provides access within a few blocks to Vail Resort and its associated retail and residential offerings. Pete Seibert and Earl Eaton established the foundation for Vail in the mid-1950s with the goal of creating a world-class ski area in the area. Construction of Vail began in 1962, and in 2012 the resort community will celebrate its 50th birthday. Vail Mountain, at 5,289 acres, is the largest single mountain ski resort in the United States. The resort town is a blend of Colorado history, culture, festivals, sports, restaurants and music, which makes this popular destination a world-class resort. Famous celebrities head to Vail to ski in the winter and to vacation in the summer. Vail’s population is 5,561, according to the 2010 Census. The town estimates that it accommodates another 5,000 part-time residents annually. Vail Mountain hosts over 1.5 million skier visits each year. Market Positioning Vail is positioned as a highly upscale, four-season resort community. It is a blend of American and European cultures featuring brick-paved streets and walkways and is consistently rated at the top of the list of ski resorts in the United States. Vail Village and Lionshead form the heart of town with shopping, dining and entertainment. It has instant name recognition due to a high concentration of celebrity visitors and other elite clientele, such as media moguls and politicians. Ski Magazine ranked Vail number 2 in its 2010 / 2011 resort rankings. Vail continues to attract a larger share of international visitors compared to other resorts in the central Colorado region, including Breckenridge, Winter Park, Keystone, and Copper Mountain. Visitors in particular have traveled to Vail from Mexico, Australia, and Europe in recent years, as the dollar has weakened. Local retailers report that business from Mexican customers has remained strong or even has grown slightly during the recession. Mexican customers have remained a core part of Vail’s international audience dating back to the 1960s and the resort has launched special marketing campaigns directly geared to Mexican clientele. Description of air service One of the fastest growing airports in the nation, the Vail/Eagle County Airport services the Vail Valley with year-round jet service from many U.S. cities. Located between Eagle and Gypsum, the airport is 30 minutes from Vail and Beaver Creek. It features non-stop 757 Jet air service from major cities across the country on four of the largest domestic airlines: American, Continental, Delta, and United.
Park City Retail Market Study Page 35 Design Workshop, Inc. June 27, 2011
Amount and type of deed restricted affordable housing Since 1996, the town has helped more than 150 local employees purchase homes within Vail’s boundaries. There are currently 699 deed-restricted rental and for-sale employee housing units within the Town of Vail. Key community amenities that drive tourism-based economic activity in Vail
Well designed and highly used pedestrian access to the ski mountain and restaurants and retail shopping in Vail Village and Lionshead.
The Nature Discovery Center provides family friendly programs that enhance marketability Betty Ford Alpine Garden Ford Amphitheater Diversity among hundreds of shops, ranging from boutiques to ski shops. Stores in Vail offer
everything from cowboy boots and ski boots to jewelry and cocktail dresses, apparel and art. Vail’s retail offerings draw business from nearby Front Range consumers as well as international visitors.
The Vail Film Festival hosts world premieres, independent films, and various forums and parties. Given the national and international draw of Vail, celebrities often attend these various events.
Taste of Vail is the nation's premier spring food and wine festival Vail Valley Music Festival Vail International Dance Festival Vail Jazz Festival
Amount of retail / commercial square feet Design Workshop’s evaluation of information compiled from various sources estimates that existing retail in all of Vail totals 628,371 square feet. Table 17 provides a summary of retail space per category, including the number of tenants in each. Vail Village accounts for over half of all retail space in Vail and represents the oldest and most established retail district in Vail, located at the base of Vail Mountain and directly accessible from the main Vail exit off of Interstate 70. Food and beverage outlets represent the majority of the square footage in this district and approximately one-third of all storefronts in Vail Village. Stores providing clothing apparel for sale and ski equipment for rent represent other significant sectors of the retail program at Vail Village. Other main concentrations of retailers include jewelry stores and galleries. Lionshead Village, on the west end of Vail Mountain, is around one-third the size of Vail Village. Food and beverage account for around half of all square footage and nearly half of all storefronts. Ski equipment shops also dominate the retail program, with 16 stores including nearly 28,000 square feet of space. Lionshead includes less diverse retail offerings overall compared to Vail Village. It does not feature any galleries or art shops and very few clothing outlets, jewelry stores, or gift shops. While Vail Village appeals to a wider audience, Lionshead tends to appeal more directly to visitors accessing the west end of Vail Mountain, with a focus on eating and drinking establishments and shops geared to servicing skiers and snowboarders. West Vail includes retail districts along Interstate 70 toward the west end of the community and includes primarily retail uses that provide day to day items for residents and visitors alike. The district includes a
Park City Retail Market Study Page 36 Design Workshop, Inc. June 27, 2011
total of 175,000 square feet of space, including four grocery or liquor stores, and 11 food or beverage outlets (restaurants or bars). West Vail includes only two ski shops, and 11 additional miscellaneous stores account for around 25,000 square feet of space. Table 17: Breakdown of Vail Area Retailers
Source: Town of Vail, Vail Resorts Municipal Financial Overview The Town of Vail’s annual revenue is approximately $55 million. This comes from a $29 million general fund, $21 million in special revenue funds (i.e., RETF, Vail Marketing Fund, Capital Projects Fund, etc.), a debt service fund, internal service funds and an enterprise service fund (dispatch services). The town's real estate transfer tax collections year to date through March 30, 2011 totaled just over $1 million, around the same amount as collected during the first three months of 2010. While the overall resort real estate market has remained fairly flat, 44 percent of the tax collections in Vail during the first three months of this year derived from sales in the town’s major redevelopment projects, including Landmark, Manor Vail, Mountain View, the Ritz-Carlton Residences, Solaris and The Sebastian. Parking revenue decreased during the winter of 2010 - 2011, with November through February parking pass sales down over $700,000 from the same period a year earlier and daily parking revenues down by over $2.4 million. The overall number of parking transactions, however, increased 4.9 percent year over year in Vail Village and decreased 3.7 percent year over year in Lionshead. Sales Tax Revenue Trends The Town of Vail’s 4 percent sales tax represents the municipality’s single largest revenue source, contributing 31 percent of annual revenues on average. The town reported improved sales tax performance during the second half of 2010, thanks in part to increased summer tourism promotional campaigns and generous early season snow events in fall 2010.
Park City Retail Market Study Page 37 Design Workshop, Inc. June 27, 2011
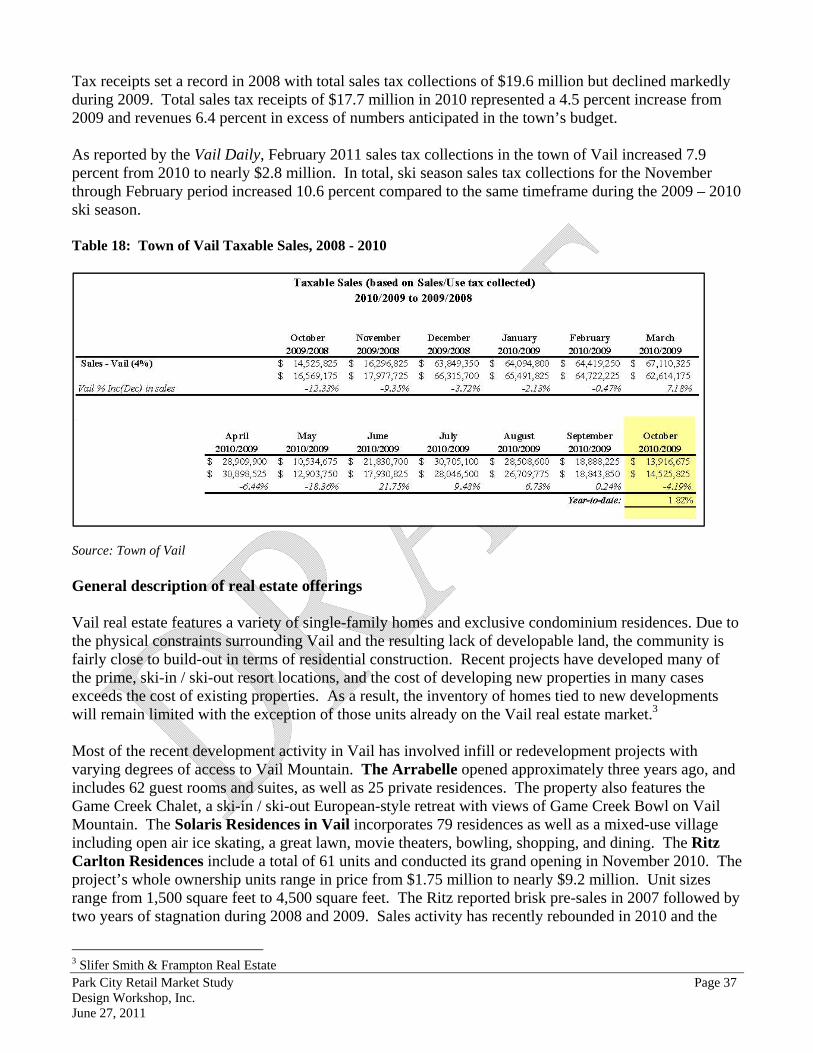
Tax receipts set a record in 2008 with total sales tax collections of $19.6 million but declined markedly during 2009. Total sales tax receipts of $17.7 million in 2010 represented a 4.5 percent increase from 2009 and revenues 6.4 percent in excess of numbers anticipated in the town’s budget. As reported by the Vail Daily, February 2011 sales tax collections in the town of Vail increased 7.9 percent from 2010 to nearly $2.8 million. In total, ski season sales tax collections for the November through February period increased 10.6 percent compared to the same timeframe during the 2009 – 2010 ski season. Table 18: Town of Vail Taxable Sales, 2008 - 2010
Source: Town of Vail General description of real estate offerings Vail real estate features a variety of single-family homes and exclusive condominium residences. Due to the physical constraints surrounding Vail and the resulting lack of developable land, the community is fairly close to build-out in terms of residential construction. Recent projects have developed many of the prime, ski-in / ski-out resort locations, and the cost of developing new properties in many cases exceeds the cost of existing properties. As a result, the inventory of homes tied to new developments will remain limited with the exception of those units already on the Vail real estate market.3 Most of the recent development activity in Vail has involved infill or redevelopment projects with varying degrees of access to Vail Mountain. The Arrabelle opened approximately three years ago, and includes 62 guest rooms and suites, as well as 25 private residences. The property also features the Game Creek Chalet, a ski-in / ski-out European-style retreat with views of Game Creek Bowl on Vail Mountain. The Solaris Residences in Vail incorporates 79 residences as well as a mixed-use village including open air ice skating, a great lawn, movie theaters, bowling, shopping, and dining. The Ritz Carlton Residences include a total of 61 units and conducted its grand opening in November 2010. The project’s whole ownership units range in price from $1.75 million to nearly $9.2 million. Unit sizes range from 1,500 square feet to 4,500 square feet. The Ritz reported brisk pre-sales in 2007 followed by two years of stagnation during 2008 and 2009. Sales activity has recently rebounded in 2010 and the
3 Slifer Smith & Frampton Real Estate
Park City Retail Market Study Page 38 Design Workshop, Inc. June 27, 2011
first part of 2011. The Ritz Destination Club includes 45 units, with Marriott International handling resales. The 121-room Four Seasons project, which opened in December 2010, boasts some of the largest suites in the Vail Valley. The approval process for the Ever Vail Village project has begun to move forward as the economy has recovered, with project backers submitting their development application to the Town of Vail in February 2011. The proposed project includes plans to build a gondola from West Lionshead to Eagle’s Nest, an underground mountain operations facility, 670 public parking spaces, 102 hotel rooms, on-site employee housing, a specialty grocery store, a live music venue, a transit center, deed-restricted and free-market condominiums, and Vail Recreation District space. The project would be built on a 12-acre site that currently houses office buildings. The project’s developers claim in market analysis reports and statements to the public that Ever Vail would largely draw new retail customers to the community and therefore avoid cannibalization. They also note that the amenities and real estate products at Ever Vail will help Vail compete with Whistler, Park City, and other peer communities in the West. Key Issues Vail will celebrate its 50th anniversary next year, and therefore should enjoy significant media coverage nationally. The town plans a number of events to highlight the milestone. Vail and Beaver Creek are preparing to host the 2015 World Championships. The 2015 FIS Alpine World Ski Championships are expected to showcase athletes from over 70 nations, with an estimated 1 billion worldwide television viewers and an onsite media and broadcast entourage of approximately 1,500 members. The Championships’ competitions will run for 13 days, including two weekends. The Town of Vail, Vail Resorts, and private businesses anticipate investing a great deal in new amenities and programs in anticipation of this event, and as a result tourists and residents should benefit. The Town of Vail is focusing on enhancing guest services. The community wants to establish trends nationally and globally in the use of guest services technology and as a result will be investing in improved wayfinding, a new visitors center, and additional guest services training. As summarized in the Vail Daily, the Town of Vail needs to craft a ballot question for how to use its $9.3 million in excess conference center funds soon, and if voters shoot down an initiative for the second time, the town will have to figure out a way to refund the tax money back to the public. The money, which was collected through a special sales and lodging tax in order to increase lodging occupancy and overall economic activity in Vail, has been sitting in a fund since it was collected from 2002 through 2005. In November 2005, voters rejected a ballot initiative asking to use the money to build a conference center. The Town is promoting projects that include a remodel and expansion of the Vail Golf Clubhouse, a Vail Village parking garage welcome center that also would include technology upgrades throughout town for better customer service, and a Ford Park recreation field expansion and upgrade. In addition, the Vail Valley Foundation has proposed using conference center funds to renovate the lower bench of Ford Park, which the Foundation is calling the Ford Park Gardens. While the conference center funds total $9.3 million, the projects as they're proposed now total about $16 million. With the Ford Park Gardens proposal, the projects would cost upward of $20 million. If voters turn the question down, Town Manager Stan Zemler has indicated the town would then be obligated to come up with a refunding mechanism.
Park City Retail Market Study Page 39 Design Workshop, Inc. June 27, 2011
Takeaways for Park City
Given the recent and prospective development projects involving redevelopment sites in or around Vail Village and Lionshead, Vail provides a good example of how a leading mountain resort community is using infill development and additional densification in order to expand its development program and increase overall business.
Vail has successfully leveraged the increased airline capacity at Eagle County, coupled with its
reputation as the largest ski area on the continent, to attract a customer base more heavily weighed to international travelers.
The development constraints facing Vail (the presence of Interstate 70 in the middle of town, and
the mountain ranges on the north and south of the community) are somewhat similar to those facing Park City. Park City may want to further study the redevelopment projects completed in Vail.
BRECKENRIDGE General description Located two hours from Denver International Airport and with access to Interstate 70, Breckenridge benefits from its relative accessibility compared to other Colorado mountain resorts and its family-oriented reputation. Like Aspen, the community evolved from its history as a mining town and grew rapidly following World War II and following the completion of the Eisenhower Tunnel on I-70 during the 1970s. Breckenridge has worked to diversify its entertainment and programming offerings to all four seasons, with a variety of festivals helping to complement the traditional peak of ski resort-oriented business during the winter months. During the summer in particular, outdoor enthusiasts come to the Breckenridge area to enjoy hiking trails, wildflowers, fly fishing in the Blue River, mountain biking, boating at nearby Lake Dillon, whitewater rafting, and alpine slides. The retail offerings along Main Street also help to attract visitors during the off-season. As of January 1, 2009, the Town estimated a permanent resident population of 3,583 with an estimated maximum peak population of 38,624. Census data indicates that the resident population grew an average of 4.5 percent annually during the 1980s and 6.5 percent annually during the 1990s. According to the 2000 Census, the largest age category in the community is the 25 to 55 year old age group, accounting for 45 percent of the community’s residents. The Breckenridge Ski Area reports over 1.6 million skier visits annually. Market positioning vs. local, regional and national competitors Once a mountain mining town decimated and nearly destroyed by river dredging, Breckenridge has bounced back over the last century to become one of Colorado's top year round alpine getaways, with all-seasons activities. Restoration of the river area has led to the creation of hiking trails and greenery in the summer months, but winter is the real draw. Skiers head to the groomed slopes, chutes and bowls of Breckenridge Ski Resort by the millions.
Park City Retail Market Study Page 40 Design Workshop, Inc. June 27, 2011
Marketed as “the perfect family-oriented mountain town,” the historic Victorian town is active with an independent dining scene, a thriving arts district and plenty of snow. In addition to outdoor play –snowshoeing, dog sledding, sleigh rides and more – a season-long events lineup features celebrations with large snow sculptures, parades in the name of snowfall and spring skiing parties. Workshops are available in the Arts District, shopping is plentiful in the Main Street boutiques, and other activities include spa treatments or museum tours. Ski magazine ranks Breckenridge number 8 on its 2010 / 2011 resort rankings. Amount of retail/commercial square feet Following a period of steady commercial construction in the 1980s and 1990s, the gross square footage of commercial development within Breckenridge increased from just over 360,000 in 1977 to just over 1.3 million at the end of 2000. According to Table 19 below, retail space currently represents approximately 40 percent of all commercial space in Breckenridge. The majority of the commercial development in Breckenridge is located in the Town’s Historic District along Main and Ridge Streets, at the Peak 9 base area of the Breckenridge ski resort, and along Airport Road at the north end of town. Table 19: Breckenridge 2008 Breakdown of Commercial Space Category Square FeetOffice & Professional Services 216,287Real Estate, Lodging & Prop. Mgmt 104,492Retail 281,952Ski and Sport Goods 101,441Bars, Restaurants, Dining, Theatre 229,424Grocery & Liquor Stores 91,947Man. Indus., Construction & Warehouse 86,674Gov., Non-Profit, Education, Town-owned Rec. 401,137Total 1,513,354 Source: Town of Breckenridge Amount and type of deed restricted affordable housing In 2000, the Town adopted the Breckenridge Affordable Housing Strategy which provides program options to deal with future affordable housing needs. Several affordable or employee housing projects have entered the market in recent years, adding to the total number of units available. Breckenridge has approximately 500 built employee housing units, with another 770 committed to be built at some point in the future.
Park City Retail Market Study Page 41 Design Workshop, Inc. June 27, 2011
Municipal Financial Overview During 2010, the Town’s major revenue streams (including sales tax, accommodation tax and real estate transfer tax) stabilized and even showed some growth relative to 2009. Revenue Stream 2010 Budget 2010 Actual Sales Tax $11,411,609 $13,969,463Accommodations Tax $1,358,423 $1,470,708Real Estate Transfer Tax $2,500,000 $3,175,124Total $15,270,032 $18,615,295 According to the 2009 Town of Breckenridge Overview, sales tax collections have risen steadily from $9.8 million in 2004 to $13.3 million in 2008. The recession hit the town hard, but the Town reported a 6.8 percent increase in retail sales tax revenue and a 6.6 percent increase in restaurant/bar sales tax revenue during 2010. Table 20: Town of Breckenridge Sales Tax Revenue (2008 – 2010)
Source: Town of Breckenridge Description of Air Service The majority of out-of-state visitors arrive at the Denver International Airport, 100 miles from Breckenridge. A small proportion of the visitors also utilize the Eagle/Vail Airport (60 miles to the west) and Colorado Springs Airport (110 miles to the southeast).
Park City Retail Market Study Page 42 Design Workshop, Inc. June 27, 2011
General description of real estate offerings As of January 1, 2009, Breckenridge had a total of 5,581 housing units (including single family homes, duplexes, condominiums, apartments, employee units and timeshare units) plus 970 lodging/lock off units. 4 Census data from 2000 indicates that seasonal homes account for a large percentage (68.1%) of the total housing base in Breckenridge. A build-out analysis conducted in 2007 by the Community Development Department provided an inventory of units built out in 2007 as well as the ultimate build-out potential in the community based on existing zoning and entitlements. The department estimated that residential development in the Town is approximately 79 percent built out. The current residential mix includes 47 percent multi-family units, 18 percent single family units, 5 percent duplex units, 6 percent Townhomes, 9 percent condominium hotels and 15 percent fractional ownership or lodge rooms. Approximately 38 percent of the units (2,490) are classified as ‘short term’ rentals that are licensed through the Town.5 Additional anticipated residential development in Breckenridge includes the build-out of Shock Hill, Delaware Flats, Main Street Station Buildings E and F, the bases of Peak 7 and 8, and the Gondola Lots, as well as development of the second phase of the Wellington Neighborhood, which is projected to include 160 units. The Block 11 master plan also anticipates additional residential development. Key Community Amenities that Drive Tourism-Based Economic Activity Breckenridge is an all-season recreation and vacation destination. Winter activities include skiing and snowboarding as well as snowshoeing, ice-skating, sleigh rides and snowmobiling. In the summer, activities include hiking, biking, rock-climbing, in-line skating, horseback riding, fishing, golfing and kayaking. In January 2006, the new Breckenridge Welcome Center opened. The facility includes over 2,500 square feet of interpretive exhibits and displays. Breckenridge offers a variety of entertainment options and services including 79 bars and restaurants, 25,000 pillows in the bed base, and 180 retail shops. The Breckenridge Nordic Ski Center is one of the oldest cross-country skiing facilities in Colorado. A day lodge, as well as full-service instruction and rentals are located on site. As part of the Breckenridge Peaks development plan, in December 2006 the resort unveiled the BreckConnect gondola, a resort transit system designed to streamline transportation between downtown and the resort's Peaks 7 and 8. BreckConnect accommodates the volume of guests attracted to the resort while maintaining the historic character and vibrancy of Breckenridge's Main Street and Downtown. Another significant improvement to the town was the rerouting of State Highway 9 on a bypass route to the west of Main Street, between downtown and the ski resort. As a result of this change, the Town has been able to complete various improvements to Main Street that were not allowed by CDOT under its previous jurisdiction. The Riverwalk is a 1,500-foot linear park along the Blue River, which includes walking and bicycling paths, bridges, outdoor seating areas, a performing arts center and an events green. The Riverwalk Center, which was constructed in conjunction with the restored Riverwalk, includes an 800-seat performing arts venue.
4 Town of Breckenridge, 2009 Overview 5 Town of Breckenridge, 2009 Overview
Park City Retail Market Study Page 43 Design Workshop, Inc. June 27, 2011
Key festivals and events in Breckenridge include:
Breckenridge Music Institute and National Repertory Orchestra concerts Hartford Ski Classic Breckenridge Film Festival Winter Ice Sculpting Festival Celebrity Golf Tournament Fourth of July celebration
Key Issues Breckenridge has done a good job enhancing its reputation as a fun place and a desired destination for families. The variety of activities entices children as well as adults during all four seasons and many of the restaurants in town cater to families with appropriate price points and family-friendly atmosphere. A few years ago there was a perception that retail on Main Street was performing poorly. However, upon further study, the town realized that retail stores located in the right locations (in Breckenridge, this is known as “between the lights”) fared rather well. The town concluded from its study that retail situated in locations or building configurations deemed to be less than ideal suffered in the local marketplace. Takeaways for Park City:
Breckenridge provides a good example of a comparable mountain resort town that has leveraged a significant program of activities during all four seasons to retain the family market and sustain growth in the community.
The analysis of retail in the downtown area reveals that strategies and marketing practices of
individual stores (tied to location, merchandising, etc.) can have an overall cumulative effect on a retail district.
Park City Retail Market Study Page 44 Design Workshop, Inc. June 27, 2011
Park City Retail Sales Tax Revenue Trends The Park City Municipal Corporation has regularly compiled sales tax revenue information for the municipality overall, and for seven districts distributed throughout the community. This data reveals a number of trends related to the strength of businesses tied to retail, restaurant / bar operations, and services in different parts of the city. For purposes of analysis, the city has organized its data reporting by districts as outlined in the figure below. Figure 4: Park City Municipal Corporation: Map of Data Reporting by Geography
Source: Park City Municipal Corporation Five of the geographic districts outlined above generally tie to the boundaries of the districts within Park City analyzed in this report. The “Main Street” district outlined in Figure 4 roughly correlates to the boundaries of the Main Street district discussed in this report. The “Mountain Resort” district includes the PCMR area and the lower portions of Park Avenue and roughly correlates to the boundaries of the Lower Park Avenue redevelopment district. The “Entryway” district generally correlates with the
Park City Retail Market Study Page 45 Design Workshop, Inc. June 27, 2011
boundaries of the Bonanza Park district analyzed in this report, and as the name implies, the “Prospector” district generally ties to the Prospector district discussed in this analysis. The “Thaynes” district includes a small amount of retail establishments located west of Highway 248 in the northern portion of the city, and the “Park Meadows” district primarily includes lower density residential areas in the far northern part of the community. As the name implies, the “Deer Valley” district includes the base area of Deer Valley, as well as various residential neighborhoods to the south and east. The following tables illustrate the general breakdown of local option sales tax revenues for different classifications within Park City for the most recent available year of data, Fiscal 2009. Table 21: Total Estimated Taxable Sales for all of Park City, Fiscal Year 2009
Source: Park City Municipal Corporation Overall, the Entryway district produces the greatest share of overall taxable sales in 2009, followed by Main Street, Deer Valley and Mountain Resort. As explained further in subsequent sections of this report, sales generated by larger format retailers such as Rite Aid and Freshmarkets helps drive the overall higher level of sales in the Entryway (or, Bonanza Park) district. Main Street revenue results largely from a mixture of food and beverage sales coupled with resort retail. Sales of lift tickets and associated services and food and beverage at PCMR and the Deer Valley ski area drive sales in the Deer Valley and Mountain Resort districts. It is expected that the addition of the Montage will increase sales tax revenue from Deer Valley. Park City experienced gradual growth in taxable sales between 2001 and 2005, and then a stronger uptick in activity from 2005 to 2008. Sales tax revenue in 2008 set a record for the city, and then revenues declined for fiscal year 2009 to levels on par with the 2004 – 2005 timeframe, as a result of the economic downturn.
TOTAL ESTIMATED TAXABLE SALES, FY 2009
% of Total
Entryway (Bonanza Park) $101,394,649 21%Main Street $92,750,378 19%Deer Valley $91,882,688 19%Mountain Resort (Lower Park Ave) $76,705,288 16%Rest of City $61,886,424 13%Prospector $43,592,461 9%Thaynes $11,843,456 2%Park Meadows $3,551,194 1%
Estimated Total ---> $483,606,538
Park City Retail Market Study Page 46 Design Workshop, Inc. June 27, 2011
Table 22: Local Option Sales Tax Revenue, Park City, 2001 - 2009
Source: Park City Municipal Corporation Table 23: Total Local Option Sales Tax Revenue, FY 2009 by District – from Restaurant / Bar Sales
Source: Park City Municipal Corporation The historic Main Street district produces the majority of restaurant / bar sales tax revenue in the community, followed by the Deer Valley district. The significant base of restaurants, taverns, and related establishments downtown helps to produce this distribution of sales tax revenue.
Main Street $423,887 55%Deer Valley $104,271 13%Entryway (Bonanza Park) $86,805 11%Prospector $80,798 10%Mountain Resort (Lower Park Ave) $41,871 5%Park Meadows $14,447 2%Thaynes $14,084 2%Rest of City $7,609 1%
Total $773,772
Total Local Option Sales Tax Collected Fiscal Year 2009
Restaurant / Bar Sales
Park City Retail Market Study Page 47 Design Workshop, Inc. June 27, 2011
Table 24: Total Local Option Sales Tax Revenue, FY 2009 by District – from Retail Sales
Source: Park City Municipal Corporation Surprisingly, while many people think of the Main Street district as one of the leading retail districts in the city, the Entryway district around Kearns Blvd and Park Avenue generates the largest share of sales taxes from retail sales in Park City, followed by Deer Valley. Main Street produces roughly one-third as much sales tax from retail goods as the Entryway district. Table 25: Local Option Sales Tax Revenue, FY 2009 by District – from Services
Source: Park City Municipal Corporation
District: % of Total
Entryway (Bonanza Park) $745,414 36%Deer Valley $505,913 25%Main Street $247,229 12%Mountain Resort (Lower Park Ave) $156,021 8%Prospector $126,825 6%Thaynes $118,434 6%Rest of City $107,337 5%Park Meadows $35,512 2%
Total $2,042,685
Total Local Option Sales Tax Collected Fiscal Year 2009Retail Sales
District: % of Total
Deer Valley $918,828 50%Mountain Resort (Lower Park Ave) $452,257 25%Thaynes $140,178 8%Prospector $126,825 7%Entryway (Bonanza Park) $122,768 7%Main Street $68,663 4%Rest of City $14,800 1%Park Meadows $1,054 0%
Total $1,845,373
Total Local Option Sales Tax Collected Fiscal Year 2009Sales from Services
Park City Retail Market Study Page 48 Design Workshop, Inc. June 27, 2011
Services, as classified by the Budget department at Park City Municipal Corporation, includes lift ticket sales and associated non-retail, and non-food and beverage, sales. Thus, the Deer Valley district (including the Deer Valley ski area) and the Mountain Resort district (including PCMR), account for the vast majority of sales of services in the city.
Park City Retail Market Study Page 49 Design Workshop, Inc. June 27, 2011
Main Street Retail
Analysis of Current Conditions / Performance
Introduction The consultant team developed an analysis of existing retail on Main Street and in the other study areas within Park City through field visits to these districts and discussions with city officials, local real estate experts, and the Chamber of Commerce. The site visits to the retail districts analyzed physical attributes of the individual retail complexes and buildings such as visual accessibility, physical accessibility, and architectural style and quality. The consultant team also noted special factors which may contribute to the success or failure of individual retail formats or complexes in the different districts within Park City. Physical Attributes Main Street is a pedestrian-oriented environment dominated by people that allows residents and visitors to circulate around the district relatively freely, without significant impediments from automobile traffic. While Main Street remains a public street open to traffic, the lack of parking on Main Street and the availability of parking garage spaces away from Main Street (such as in the parking garage adjacent to the Park City offices) discourages significant vehicular traffic on Main Street. The district today continues to resemble a downtown street from an 1800s frontier town, in that pedestrians are exposed to a variety of shopping and dining experiences along Main Street and are able to move from shop to shop relatively easily and at their leisure. Scale and Views The scale of streets and buildings in the Main Street district is appropriate for the context of the district and encourage pedestrian activity and retail viability. Few of the buildings in the Main Street district exceed three or four stories in height. The alignment of Main Street and the rise in elevation provides strategic views of the surrounding mountains to the east and west. Views from the Main Street district are important because they reinforce the overall circulation throughout the streets of the district. Views provide visitors with a clear sense of direction while navigating the commercial area, preventing them from getting lost. The sidewalks in the Main Street district are narrow compared to contemporary standards and become very crowded during Sundance and other peak times during the year. Architectural Style The architectural style of buildings in the Main Street district contributes to providing for the identity and character of the area. Most of the buildings along Main Street have retained their original Victorian or frontier architecture from the 1800s. Newer buildings and retail complexes along and near Main Street feature more contemporary architectural styles but do not detract from the overall historical theme of the district. Visual Access Generally, retail spaces within the Main Street district enjoy relatively good visual access for pedestrians and motorists traveling through the area. The majority of shops in the district are located directly on
Park City Retail Market Study Page 50 Design Workshop, Inc. June 27, 2011
Main Street, which receives high visitation and traffic during peak seasons. Most of the individual shops feature prominent signage or awnings displaying the business name. Window displays appear to effectively draw attention to individual stores and invite pedestrians to enter into interior shopping spaces. A significant portion of the businesses along Main Street feature night lighting, and provide for night viewing of merchandise window displays. Physical Access to the District While it remains the historic focal point of the Park City community, its location at the southern end of a the basin in the area between two mountain ranges has isolated Main Street from the rest of Park City and the greater Summit County area. Deer Valley Drive provides “bypass” access around lower Park Avenue and therefore a more direct route to the Main Street area from the north. However, with the exception of the Deer Valley resort to the south and east and various residential neighborhoods and developments to the south and west within Park City, Main Street is essentially in a cul-de-sac location. Access to Main Street from U.S. 40 and Interstate 80, the main freeways serving Summit County, is somewhat circuitous, and these freeways are up to a 20 minute drive from the heart of the district. Within Park City, travel from the Lower Park Avenue area and the districts along Kearns Boulevard to Main Street suffers from congestion at various times of the day and in particular during ski season. Main Street’s more secluded location further strengthens the district’s position as a destination district. Public Space Public space in a commercial or retail district provides opportunities for individuals to participate in and with the local environment and enjoy the Park City experience. The Main Street district does not feature a central focal point (such as a town park or a town square) but does include a few smaller gathering places along Main Street and the side streets in the district. These focal points (such as the restroom area along the west side of Main Street, or the fire pit outside the High West Distillery) increase the overall appeal of the Main Street district to both local residents and visitors and help solidify Main Street’s status as a hub of commerce in Park City. Economic Attributes An analysis of the sales tax receipts of various business sectors within the Main Street district, coupled with additional research and observations, provides an overview of the economic strengths and weaknesses of this district.
Park City Retail Market Study Page 51 Design Workshop, Inc. June 27, 2011
Table 26: Main Street Local Option Tax Receipts, 2001 - 2009
Source: Park City Municipal Corporation An analysis of the macro trends of local option sales tax receipts generated by Main Street reveals that the district followed the overall trend in Park City in which sales generally followed the larger economy. Sales peaked as the economy displayed strength in 2001, then fell slightly for a few years, and then increased markedly as the larger U.S. economy grew between 2004 and 2007. In line with other districts in the city, sales decreased during fiscal year 2009. The Main Street district displays greater seasonality than any other district in Park City, indicating that the district relies more heavily on tourism-related trade than other districts in the community. The third quarter, which includes the peak of the ski season, accounted for over 50 percent of all Main Street district tax receipts in 2001 and 2002. However, as the community has worked to provide increased tourism offerings during the summer and during shoulder seasons, the strength of the third quarter relative to the rest of the year has declined. In 2009, the second quarter accounted for 23 percent of tax receipts generated from the Main Street area, and the first quarter accounted for 19 percent. The fourth quarter remains the slowest period during each year on Main Street, with this period continuing to account for only 14 percent of tax receipts in FY 2009 (the same percentage as in FY 2001). While the community has continued to work to spread economic activity more evenly throughout the year, Main Street remains a district more reliant on winter tourism activity than any other in the city.
Park City Retail Market Study Page 52 Design Workshop, Inc. June 27, 2011
Table 27: Main Street Local Option Tax Receipts, Breakdown by Type, 2001 - 2009
Source: Park City Municipal Corporation An analysis of the breakdown of tax receipts over the last decade reveals a likely shift of properties from retail uses (i.e., clothing stores, galleries) to more restaurant and bar uses. The percentage of tax receipts generated by retail properties declined significantly, from 49 percent in FY 2001 and FY 2002, to only 27 percent in FY 2009. Restaurant / bar properties have provided larger shares of overall district tax receipts with time, and in FY 2009 accounted for 46 percent of local option tax receipts produced in the Main Street district. Local brokers and business people recognize that Main Street has become the destination in Park City for drinking and eating, particularly for tourists. In addition, with the construction of additional hotel properties in the downtown area in recent years, tax receipts from lodging have increased from 7 percent of the total in FY 2001 to 17 percent in FY 2009. Analysis of Tenant Mix and Economic Performance In line with the trend toward food and beverage representing a larger share of overall sales in the Main Street district, restaurants and bars represent the largest share of the tenant mix in the downtown area, in terms of overall square footage. However, resort retail accounts for the largest group of individual businesses in the Main Street area, many of which include relatively limited square footage. Food and beverage offerings range from higher end sit-down restaurants to a number of long-time bar and grill establishments on Main Street.
Main St Local Option Tax Receipts Breakdown by Type
Park City Retail Market Study Page 53 Design Workshop, Inc. June 27, 2011
Table 28: Existing Tenant Mix, Main Street District
Source: Park City Municipal Corporation, Design Workshop Database Resort retail includes the “Gifts and Galleries” subcategory, which comprises a large number of art galleries and various gift shops, various clothing stores, a few clothing stores, three bookstores, one ski rental outlet, and 15 “miscellaneous” retail outlets, including a number of stores that sell products from a variety of other categories. Service businesses account for an estimated 12 percent of the total square footage on Main Street and include various real estate and professional services offices. A store by store analysis along Main Street indicates that overall vacancy in the Main Street district remains under five percent (in line with industry averages). However, the district could improve its performance in terms of sales per square foot. Based upon information collected from city sources and an in-person site evaluation, the food and beverage outlets on average are producing just below $300 per square foot. Resort retailers, including galleries, gift shops, clothing, and miscellaneous merchants, are producing average sales of between $200 and $250 per square foot. In contrast, average sales per square foot in comparable communities like Breckenridge exceed $400 per square foot.
Park City Retail Market Study Page 54 Design Workshop, Inc. June 27, 2011
Takeaways for Main Street: The analysis of existing retail space in the Main Street district reveals several key points.
While the Main Street district is essentially built-out and reports low vacancy, the district has generally not performed as well in terms of sales per square foot metrics compared to peer resort districts in similar communities.
The site evaluation revealed a significant number of art galleries and fairly similar gift stores in
close proximity along Main Street. While galleries can command higher sales per square foot, the presence of a significant block of galleries in the downtown area may be crowding out opportunities for newer retailers or more active ground level tenants who could introduce new product offerings to Main Street and therefore improve the district’s overall retail health through diversification.
Tenant Mix Recommendations
While Main Street has continued to contribute to Park City’s success over the last few decades, a transition to a more balanced tenant mix would benefit the district in the long run. A creative mix of tenants, good merchandising, and a sense of ambiance helps drive retail in successful resort village areas similar to Main Street. Retail, restaurant, and entertainment-oriented tenants should address the needs and interests of each market segment and strongly contribute to overall district sales. The tenant mix should meet the needs of guests and should include businesses offering common retail purchases as well as indulgences that guests cannot find at home. The retail / commercial program for the Keystone, Vail Village, Whistler, and Snowmass Village districts have averaged the square footage mix outlined in the table below.
Park City Retail Market Study Page 55 Design Workshop, Inc. June 27, 2011
Table 29: Average Tenant Mix, Comparable Resort Retail Districts
Source: Design Workshop Given the focus of Main Street on resort retail (including various gifts and clothing items) and restaurant / bar uses, the district may never exactly match the average tenant mix exhibited in comparable ski resort retail districts. However, over time the Park City community and Main Street leaders and merchants
USE %
Restaurant / Beverage 25% to 40%
Village Deli Wine / Cheese RestaurantGourmet Restaurant Bakery, Cookies, Ice Cream, CandyCasual Restaurant (Breakfast, Lunch, Apres Ski) Popcorn WagonCasual Restaurant (Lunch, Dinner) Night Club (Bar with entertainment)Skier Beer Deck (or microbrew pub)
Resort Retail 25%
Liquor Clothing Shop (boutique)Drugstore Art Gallery / Studio ArtSports Shop Small Food Store (General Store)Jeweler Video RentalGift / Specialty Children's ToysClothing Shop (sports / casual)
Services 15%
Real Estate Professional OfficesProperty Management Dry Cleaners / Drop OffPhoto / Darkroom Travel AgencyHair Salon Insurance AgencySki Repair Security ServiceBank Transportation Company
Entertainment 5%
Video Arcades Movie TheaterTeen Night Club
Other Commercial 5% to 20%
Hotel Retail Base Skier LodgeHotel Food and Beverage
Miscellaneous 10%
Convenience Stores (with groceries) Stores that do not fit other categories
Park City Retail Market Study Page 56 Design Workshop, Inc. June 27, 2011
should work to diversify the tenant mix as outlined in the table above. Adding services would complement existing lodging and retail uses along Main Street, for example, and additional hotel retail and food and beverage uses would help support other retail, restaurant, and related uses throughout the district.
Future Retail Demand Analysis
This section evaluates the type and amount of retail development supportable in the Main Street district in the future. For this analysis, the following steps were performed: Confirm the appropriate trade area(s) for the analysis. This analysis considers two trade areas: 1)
a trade area encompassing the boundaries of Park City Municipal Corporation, plus adjoining residential areas of Deer Valley and 2) a trade area encompassing most of Summit County, including all of Park City and adjoining outlying areas, including the retail areas in the Kimball Junction area.
Develop projections for supportable retail in the Main Street district based on market factors such as households, visitors and spending patterns.
Methodology The number of households, the average household income, and spending patterns in a given trade area are the primary drivers in determining demand projections for retail development. Specifically, the demand analysis for Main Street accounted for the spending power of four primary segments:
1) Permanent Park City residents 2) Seasonal Park City residents (these individuals may own second homes) 3) Visitors to Park City 4) Summit County permanent residents (who live outside of the boundaries of Park City)
This analysis calculates population forecasts for each of these four segments for 2015 and 2020, based upon assumptions derived from local market research and in part by ESRI projections of income and population over the next several years. By applying average household income to population forecasts, the analysis calculates a total personal income (TPI) for each of the four population segments. Consumer spending characteristics vary across four primary shopping categories including Convenience Goods, Shoppers Goods, Eating and Drinking Establishments, and Building Materials / Nurseries. For the four retail categories, standard spending categories have been applied based on a percentage of TPI to determine the total potential retail revenue. The total revenue is then translated to a measure of potential retail space by applying a capture rate for each retail type and an average sales-per-square foot factor for each shopping category. The following table illustrates the total personal income calculations for various classifications of potential consumers in the Park City and surrounding markets.
Park City Retail Market Study Page 57 Design Workshop, Inc. June 27, 2011
Table 30: Total Personal Income Calculations (TPI), 2010 - 2020
Source: ESRI, Design Workshop The analysis then allocated TPI to various categories of spending (including Convenience Goods, Shoppers Goods, Eating and Drinking, Building Materials and Garden, and Auto Related). From there, the analysis used capture rates for the various categories of spending to determine the total revenue or sales the district would produce in a given year. The following table outlines the capture rates utilized in the analysis of retail demand for the Main Street district.
2010 2015 2020
Park City Permanent Residents $352,865,494 $474,844,871 $643,044,251Park City Seasonal Residents $871,689,172 $1,029,484,722 $1,215,844,854Visitors to Park City $292,840,500 $307,778,309 $323,478,096Summit County Residents (Located Outside Park City) $711,891,936 $936,503,919 $1,269,736,319
TOTAL ---> $2,229,287,101 $2,748,611,821 $3,452,103,519
Park City Retail Market Study Page 58 Design Workshop, Inc. June 27, 2011
Table 31: Retail Capture Rates, Main Street District
Source: Design Workshop
The analysis drew from the history of retail sales and sales tax receipts for the Main Street district in determining the appropriate capture rate for the various categories of spending. For the Convenience Goods and Shoppers Goods categories the analysis utilized capture rates of 12 percent. This capture rate ties with Main Street’s 12 percent share of Park City’s overall retail sales during fiscal year 2009. The analysis used a 50 percent capture rate for eating and drinking establishments, tied to the Main Street district’s 55 percent share of restaurant and bar sales in Park City in fiscal year 2009. To be conservative, the analysis assumed that the Main Street district only garnered a capture rate of 6 percent for Convenience Goods and Shoppers Goods and 25 percent for Eating and Drinking for sales earned from Summit County residents living outside of the borders of Park City (or, roughly half the capture rate for the other sources of revenue including Park City residents, seasonal residents, and visitors to Park City from outside the county). The analysis assumed that given the orientation of the historic downtown area, the Main Street district would not capture any sales associated with auto-related retail
CAPTURE RATES - MAIN STREET DISTRICTPermanent Residents
Seasonal Residents
Visitors to Park City
County Residents
Convenience GoodsSupermarket 0% 0% 0% 0%Convenience 12% 12% 12% 6%Beverage Stores (Coffee / Liquor) 12% 12% 12% 6%Health and Personal Care 5% 5% 5% 3%
Shoppers GoodsGeneral Merchandise (Dept Stores, Other) 12% 12% 12% 6%Clothing and Accessories 12% 12% 12% 6%Furniture and Furnishings 12% 12% 12% 6%Electronics and Appliance 12% 12% 12% 6%Office Supplies and Stationery 12% 12% 12% 6%Pet and Pet Supplies 12% 12% 12% 6%Miscellaneous Retail (gifts, flowers, etc.) 12% 12% 12% 6%
Building Materials and GardenHome Centers 5% 5% 5% 3%Paint and Wallpaper 5% 5% 5% 3%Hardware 5% 5% 5% 3%Lawn and Garden Equipment 5% 5% 5% 3%Other 5% 5% 5% 3%
Auto RelatedAutomobile Dealers 0% 0% 0% 0%Other Motor Vehicles (recreational) 0% 0% 0% 0%Automotive Parts, Accessories and Tires 0% 0% 0% 0%
Park City Retail Market Study Page 59 Design Workshop, Inc. June 27, 2011
(including sales of auto parts and accessories). It also assumed a conservative capture rate of only 5 percent for retail associated with building materials and garden (including hardware and related goods). The following table outlines the projected supportable square footage for retail in the major categories of spending, for the Main Street district, for 2010, 2015, and 2020. Table 32: Projected Retail Demand, Main Street District, 2010 - 2020
Source: Design Workshop, ESRI The analysis shows that, based upon growth in incomes and population for residents and visitors alike, the theoretical supportable retail space in the Main Street district should increase from just over 300,000 square feet in 2010 to just over 360,000 square feet by 2020. The analysis assumes that the average sales per square foot will increase in line with inflation over the next ten years (assuming an annual inflation rate of 2.5 percent). Alternative Retail Demand Method – Main Street Design Workshop also examined the potential retail demand for the Main Street district using a second methodology that considered the potential demand from local residents for retail in the downtown area based upon one, all-encompassing trade area that includes both Park City and the Snyderville basin, rather than calculating the retail demand based upon two separate trade areas. As illustrated in the following table, the forecasted retail demand for Main Street for 2010, 2015, and 2020 changed relatively little by using this alternate trade area for the purposes of analysis. The forecasted demand numbers are fairly similar in using either a smaller trade area (including mainly Park City) versus a larger trade area including Kimball Junction because the capture rates used to calculate forecasted demand change accordingly as the trade areas change. For example, using a trade area including only Park City, Main Street may capture a higher rate of the spending in this trade area for clothes, but would capture a smaller share of the spending on clothing in a larger trade area including Kimball Junction. The alternate analysis reduces the predicted retail demand (in terms of square footage) by around 20,000 for both 2010 and the predictions for 2015 and 2020.
Total ---> 308,277 Total ---> 331,516 Total ---> 362,180
Park City Retail Market Study Page 60 Design Workshop, Inc. June 27, 2011
Table 33: Projected Retail Demand, Main Street District, 2010 – 2020 (Using Alternate Trade Area in ESRI)
Source: Design Workshop, ESRI Takeaways for Main Street:
Barring significant change in the current policies of Park City, the Main Street district currently does not have much opportunity for new development and is essentially “built-out”. While the analysis above demonstrates that the supportable square footage of retail in the Main Street district will increase over the next 10 years, the local development community will likely be unable to add additional supply to the real estate equation. Therefore, as supply remains fixed and demand increases, rental rates may increase over the next 10 years.
Total ---> 293,627 Total ---> 313,484 Total ---> 342,398
Park City Retail Market Study Page 61 Design Workshop, Inc. June 27, 2011
Lower Park Avenue Retail
Analysis of Current Conditions / Performance
Physical Attributes The Lower Park Avenue district currently includes a limited area of retail along Park Avenue (including a 7-11 retail store and a few small retail shops to the south) as well as the retail program at the Park City Mountain Resort (PCMR). The area of retail along Park Avenue features pedestrian access along the street, but the area remains primarily oriented to vehicular traffic. The retail within the PCMR development is contained within the boundaries of the PCMR base area, and is separated from the rest of the town by large parking lots to the north and east. Residential neighborhoods to the south and east separate PCMR from the main part of town as well. Within PCMR, all retail uses are accessed by foot along a series of sidewalks and corridors. This retail area does not resemble a village, “Main Street”, or another traditional shopping district, but instead has the feel of a large multi-purpose complex located at the base of a mountain. Scale and Views The scale of buildings and streets in the Lower Park Avenue district differs based upon location. The limited number of retail buildings along Park Avenue, including the 7-11 and surrounding uses, is primarily single story and oriented in a fairly suburban pattern. The retail within the PCMR complex includes primarily single story buildings oriented around central gathering areas (plazas) within the interior of the complex. The Lower Park Avenue district enjoys some of the most favorable views in the valley, of the mountains to the west and south. The base area at PCMR enjoys views of the mountains to the west as well as of the older portions of Park City below, including the Park Avenue area, the city park, and the Main Street district in the distance to the southeast. Architectural Style A few of the retail buildings along Park Avenue feature Victorian or turn of the century architecture. However, the 7-11 on Park Avenue, as well as the retail located within PCMR, features dated architecture from the 1970s and 1980s that does not match the historical vernacular of the community. Visual Access Given their direct access on Park Avenue, the 7-11 and nearby retail stores have generally good visual access from the street, for both pedestrians and vehicular drivers. The retail within PCMR does not have direct visual access from surrounding streets. A visitor must leave the parking lot and walk within the PCMR base area in order to reach the retail uses within the complex. In addition, the PCMR area does not feature any signage toward the parking lot directing visitors to particular businesses or tenants.
Park City Retail Market Study Page 62 Design Workshop, Inc. June 27, 2011
Physical Access to the District The Lower Park Avenue district has a more central location and therefore improved physical access compared to the Main Street area, but a few factors diminish the overall marketability and accessibility of the district. Motorists accessing the PCMR base area, for example, must navigate a network smaller streets extending to the south and west from the Deer Valley Drive and Park Avenue intersection. During peak periods, accessing PCMR from the north can become difficult. The lack of direct access to PCMR from other parts of Park City and the greater Summit County area limits the marketability of the district to a certain extent. Physical access to the more limited retail program along lower Park Avenue, to the south of Deer Valley Drive, is more straightforward. Anyone able to navigate to the intersection of Kearns Blvd and Park Avenue (State Highways 224 and 248) should be able to locate and access the retail just to the south on Park Avenue fairly easily. Public Space The retail along Park Avenue does not feature any public space or gathering places for shoppers or visitors. The retail located within PCMR does center on gathering places (plazas) within the PCMR complex. However, these gathering places feature merely concrete pavement and benches and do not appear to invite shoppers to linger in these spaces. Economic Attributes Although the area along Park Avenue near Deer Valley Drive contains a few retail and service establishments (including 7-Eleven, a day spa, and a prominent US Bank location), the base area at PCMR accounts for the vast majority of retail located within the Lower Park Avenue district, as defined by this report. Because PCMR’s business follows the cycles of the ski resort business, likewise tax receipts from the Treasure Mountain geographic district (as defined by the City’s budget department) reflect a high degree of seasonality, with sales peaking during the third quarter of each fiscal year. Local option tax receipt data from Park City Municipal from the last several years (illustrated in Table 34) indicates that the pattern of seasonality has remained fairly constant over the 2001 to 2009 period, with the third quarter accounting for between 55 and 65 percent of sales on an annual basis. The second quarter has consistently accounted for 20 to around 30 percent of sales each year. As is the case on a city-wide basis, sales bottom out during the fourth quarter of each fiscal year. Overall, the Lower Park Avenue district’s sales trends over the last nine years have mirrored the city-wide patterns, with a peak of business in fiscal years 2007 and 2008, followed by a decline during FY 2009 as the economic downturn nationally affected business.
Park City Retail Market Study Page 63 Design Workshop, Inc. June 27, 2011
Table 34: Lower Park Avenue Local Option Tax Receipts, 2001 - 2009
Source: Park City Municipal Corporation Over the last 10 years, services have accounted for a larger share of district-wide sales in the Lower Park Avenue area, increasing from 49 percent of total sales in 2001 to around 60 percent of total sales in 2007, 2008, and 2009. During the same time, retail has declined as a share of total sales in the district, from 31 percent in 2001 to around 20 percent for every year over the 2005 to 2009 period. Restaurant and bar establishments in the district account for only five to six percent of all sales on a consistent basis, and lodging has consistently represented around 15 percent of district-wide sales. The significant base of sales from Services reflects sales of lift tickets and related services at PCMR (including ski school and other training programs). However, the decline of retail sales relative to the total for the district over the last several years may reflect weakness in the retail at the base of PCMR relative to other offerings in the community. It also may reflect the general trend in which skiers and boarders use the retail offerings at the base of PCMR for their daytime needs (including purchases of hats, gloves, and accessories for winter activities) and then spend their time and money after the lifts close elsewhere in the city, along Main Street or in the Bonanza Park or Prospector areas. The retail outlets at the base of PCMR generally appeal to day skiers, as opposed to vacationers to Park City, who tend to frequent Main Street for shopping activities.
Treasure Mountain Local Option Tax Receipts by QuarterTOTAL
Park City Retail Market Study Page 64 Design Workshop, Inc. June 27, 2011
Table 35: Lower Park Avenue Local Option Tax Receipts, Breakdown by Type, 2001 - 2009
Source: Park City Municipal Corporation Analysis of Tenant Mix and Economic Performance The Lower Park Avenue district contains fewer commercial establishments compared to Main Street or the Bonanza Park district. Site reconnaissance indicated a total of 34 retail and related businesses in the district, including 18 businesses classified as resort retail and 9 classified as food and beverage outlets. Ski rental outlets at the base of PCMR accounted for 13 of the 18 resort retail establishments.
Treasure Mountain - Local Option Tax Receipts Breakdown by Type
Park City Retail Market Study Page 65 Design Workshop, Inc. June 27, 2011
Table 36: Existing Tenant Mix, Lower Park Avenue District
Source: Design Workshop Pizza parlors and bar and grill restaurants account for most of the food and beverage establishments at the base of PCMR. The PCMR area does not include any higher end food and beverage offerings and instead caters to day skiers and destination visitors to Park City who simply may eat a casual lunch at the base of PCMR. A few real estate offices and a couple day spas account for the Services businesses within the district. A large number of ski rental outlets, some of which sell ski related clothing and apparel as well, dominate the retail scene at the base of PCMR. While sales tax data for particular types of businesses is less complete than for the Main Street district, the food and beverage outlets at PCMR appear to perform fairly well relative to similar ski areas, with sales in excess of $300 per square foot. However, on average sales per square foot for similar eating establishment at the base of PCMR appears to trail similar metrics in the Main Street district. Sales per square foot for Resort Retail appear to vary widely, from a few hundred to several hundred dollars per square foot. Detailed information concerning the economic performance of Service uses at the base of PCMR and elsewhere within the Lower Park Avenue district is largely unavailable.
Park City Retail Market Study Page 66 Design Workshop, Inc. June 27, 2011
Takeaways for Lower Park Avenue District: The analysis of existing retail space in the Lower Park Avenue district reveals several key points.
While few vacancies exist within the Lower Park Avenue district, sales per square foot generally lag those reported in the Main Street district and other districts within Park City.
The site evaluation revealed that ski rental and ski apparel shops dominate the retail program at
the base of PCMR. While these establishments logically cater to the skier and snowboarder market at PCMR, there is an opportunity to create a more diverse retail program when the base of PCMR redevelops. The next section, addressing future retail demand for Lower Park Avenue, will further explore the retail potential of the PCMR area and the overall district.
Design Workshop’s site evaluation revealed that most of the food and beverage outlets at the
base of PCMR offer fairly similar fare, primarily oriented around casual “bar food” and snack bar-like offerings, such as pizza and burgers. The addition of new types of restaurants with a diversified range of menus would likely strengthen the overall marketability and retail position of the PCMR area and the larger Lower Park Avenue district.
Future Retail Demand Analysis
This section of the report outlines the type and amount of retail development supportable in the Lower Park Avenue district in the future. This analysis utilizes the same methodology used for the Main Street district. Please consult Table 30 for a summary of the Total Personal Income calculation used for each of the five districts. The following table outlines the capture rates utilized in the analysis of retail demand for the Lower Park Avenue district.
Park City Retail Market Study Page 67 Design Workshop, Inc. June 27, 2011
Table 37: Retail Capture Rates, Lower Park Avenue District
Source: Design Workshop
The analysis drew from the history of retail sales and sales tax receipts for the Lower Park Avenue district in determining the appropriate capture rate for the various categories of spending. For the Convenience Goods and Shoppers Goods categories the analysis utilized capture rates of 8 percent. This capture rate ties with Treasure Mountain’s 8 percent share of Park City’s overall retail sales during fiscal year 2009. As noted, the Treasure Mountain area as outlined by the City’s budget department essentially mirrors the boundaries of the Lower Park Avenue district. The analysis used a 5 percent capture rate for eating and drinking establishments, tied to the Treasure Mountain area’s 5 percent share of restaurant and bar sales in Park City in fiscal year 2009. To be conservative, the analysis assumed that the Main Street district only garnered a capture rate of 4 percent for Convenience Goods and Shoppers Goods for sales earned from Summit County residents living outside of the borders of Park City (or, roughly half the capture rate for the other sources of revenue including Park City residents,
CAPTURE RATES - LOWER PARK AVENUE DISTRICT
Park City Permanent Residents
Park City Seasonal Residents
Visitors to Park City
Summit County Residents (Located outside PC)
Convenience GoodsSupermarket 0% 0% 0% 0.0%Convenience 8% 8% 8% 4.0%Beverage Stores (Coffee / Liquor) 8% 8% 8% 4.0%Health and Personal Care 8% 8% 8% 4.0%
Shoppers GoodsGeneral Merchandise (Dept Stores, Other) 0% 0% 0% 0.0%Clothing and Accessories 8% 8% 8% 4.0%Furniture and Furnishings 0% 0% 0% 0.0%Electronics and Appliance 8% 8% 8% 4.0%Office Supplies and Stationery 0% 0% 0% 0.0%Pet and Pet Supplies 8% 8% 8% 4.0%Miscellaneous Retail (gifts, flowers, etc.) 8% 8% 8% 4.0%
Building Materials and GardenHome Centers 0% 0% 0% 0.0%Paint and Wallpaper 0% 0% 0% 0.0%Hardware 0% 0% 0% 0.0%Lawn and Garden Equipment 0% 0% 0% 0.0%Other 0% 0% 0% 0.0%
Auto RelatedAutomobile Dealers 0% 0% 0% 0%Other Motor Vehicles (recreational) 0% 0% 0% 0%Automotive Parts, Accessories and Tires 0% 0% 0% 0%
Park City Retail Market Study Page 68 Design Workshop, Inc. June 27, 2011
seasonal residents, and visitors to Park City from outside the county). The analysis assumed that given the orientation of the Lower Park Avenue area, the district would not capture any sales associated with auto-related retail (including sales of auto parts and accessories), Building Materials and Garden goods, supermarkets, or large format department stores. The following table outlines the projected supportable square footage for retail in the major categories of spending, for the Lower Park Avenue district, for 2010, 2015, and 2020. Table 38: Projected Retail Demand, Lower Park Avenue District, 2010 - 2020
Source: Design Workshop, ESRI The analysis shows that, based upon growth in incomes and population for residents and visitors alike, the theoretical supportable retail space in the Lower Park Avenue district should increase from just under 100,000 square feet in 2010 to just under 125,000 square feet by 2020. The analysis increased the assumption for sales per square foot over the next ten years to account for inflation (using a 2.5 annual inflation rate). Alternative Retail Demand Method – Lower Park Avenue Design Workshop also examined the potential retail demand for the Lower Park Avenue district using a second methodology that considered the potential demand from local residents for retail in the Lower Park Avenue area based upon one, all-encompassing trade area that includes both Park City and the Snyderville basin, rather than calculating the retail demand based upon two separate trade areas. As illustrated in the following table, the forecasted retail demand for the Lower Park Avenue area for 2010, 2015, and 2020 changed relatively little by using this alternate trade area for the purposes of analysis. The forecasted demand numbers are fairly similar in using either a smaller trade area (including mainly Park City) versus a larger trade area including Kimball Junction because the capture rates used to calculate forecasted demand change accordingly as the trade areas change. For example, using a trade area including only Park City, Lower Park Avenue may capture a higher rate of the spending in this trade area for clothes, but would capture a smaller share of the spending on clothing in a larger trade area including Kimball Junction. The alternate analysis reduces the predicted retail demand (in terms of square footage) by around 10,000 for both 2010 and the predictions for 2015 and 2020.
Total ---> 97,347 Total ---> 112,816 Total ---> 123,658
Park City Retail Market Study Page 69 Design Workshop, Inc. June 27, 2011
Table 39: Projected Retail Demand, Lower Park Avenue District, 2010 – 2020 (Using Alternate Trade Area in ESRI)
Source: Design Workshop Takeaways for Lower Park Avenue:
The analysis does support the idea of adding additional retail in the Lower Park Avenue district over the next 10 years. The conclusions generally support the idea of adding additional retail in the areas surrounding the base of PCMR, including in the parking lots for the ski area.
Square Footage and Tenant Mix Recommendations
The analyses of this study suggest an opportunity for the Lower Park Avenue district to add more resort oriented retail around the base of PCMR, as well as additional restaurants and entertainment options. While the area around PCMR has appealed mainly to day skiers in the past, property owners in the district have the opportunity to add businesses that would attract a wider audience, including some resort-oriented retail. Developers should carefully consider tenanting strategies going forward, to avoid competing directly with the retail program in the Main Street district. Given the availability of additional space for development in the Lower Park Avenue area versus Main Street, property owners in the district may have the opportunity to provide resort-serving retail that requires larger footprints than would be possible in the Main Street district. In addition, new retail in the Lower Park Avenue area may in particular be able to absorb retail demand from the neighborhoods in this part of Park City. The district could include coffee shops, bookstores, and related neighborhood-serving retail in order to complement the tourism market.
Total ---> 88,771 Total ---> 102,519 Total ---> 111,913
Park City Retail Market Study Page 70 Design Workshop, Inc. June 27, 2011
Prospector Retail
Analysis of Current Conditions / Performance
Physical Attributes Prospector is a suburban, automobile-oriented retail environment that in large part does not rely upon pedestrian access. Wide streets and limited or narrow sidewalks along the streets discourage pedestrian mobility and reinforce the primacy of the automobile. Many of the businesses in the district cater to the needs of motorists (such as car washes, for example). A significant portion of the business base in Prospector includes lodging properties such as the Marriott and nearby restaurants. The Prospector district does not feature either the tourism-oriented businesses of Main Street and Lower Park Avenue or the local serving and larger scale retail of the Bonanza Park district. Instead, Prospector includes smaller format retail, a variety of restaurants, and lodging options serving the larger Park City market. Scale and Views The scale of buildings in the Prospector district is generally suburban in nature, including primarily single story structures for commercial businesses. Some of the hotels in the district include multi-story structures as well. The Prospector district generally does not have distant views. The main views from Prospector are of the ridge to the south, with some views to the west of Park City mountain and the Canyons area in the distance. Architectural Style The architectural style of buildings in the Prospector district influences the identity and character of the area. Most of the buildings in the district reflect architecture from the 1960s through the 1980s. The district lacks the historical identity of the Main Street district and instead somewhat resembles aged suburban districts from elsewhere in the United States, albeit at somewhat higher densities. Visual Access Generally, retail uses in the Prospector district have good visual access from streets and for pedestrians and drivers. Signage in the district is relatively clear and visible from the primary commercial streets including Sidewinder and Route 248. Physical Access to the District The Prospector district has relatively good physical access. Kearns Boulevard (State Highway 248) provides direct access from an interchange with U.S. 40 to the east, and Prospector represents the first business district one encounters upon entering Park City from the east. Highway 224 provides access from Interstate 80 to the north at Kimball Junction. Bonanza Drive and Deer Creek Drive provide access to Prospector from Main Street and the historic core of the Park City community, to the south.
Park City Retail Market Study Page 71 Design Workshop, Inc. June 27, 2011
Public Space The Prospector district does not feature any central gathering places or focal points. Economic Attributes While total local option tax receipts generated from the Prospector district regularly peak during the third quarter of each fiscal year, reflecting the influence of ski season traffic in the overall Park City community, the Prospector area tends to have business from locals as well as tourists and, therefore, reports less variable economic activity during different times of the year. The third quarter accounts for 30 to 40 of annual sales, and the first and second quarters account for 20 to 25 percent each. As is the case in all areas of Park City, the fourth quarter is the slowest time of year in the Prospect area, with sales accounting for 15 to 20 percent of annual totals. Table 40: Prospector District, Local Option Tax Receipts, 2001 - 2009
Source: Park City Municipal Corporation As outlined in Table 41, retail sales have generally accounted for the largest share of local option tax receipts from the Prospector district over the last decade, but restaurant / bar and services businesses have begun to account for a larger share over the last several years. Services have increased from 14 percent of total local option tax receipts in FY 2002 to 26 percent in 2008 and 23 percent in 2009. Retail sales accounted for 45 to 50 percent of all tax receipts during the 2001 to 2005 period but declined to 33 percent in FY 2008 and 29 percent in FY 2009. The presence of several hotel and motel properties, including the Park City Marriott, results in considerable local option tax receipts generated by lodging. Overall, of the retail sub-districts in Park City profiled in this report, Prospector has the most diversified range of types of businesses.
Prospector Local Option Tax Receipts by QuarterTOTAL
Park City Retail Market Study Page 72 Design Workshop, Inc. June 27, 2011
Table 41: Prospector District, Local Option Tax Receipts, Breakdown by Type, 2001 - 2009
Source: Park City Municipal Corporation Analysis of Tenant Mix and Economic Performance Prospector is a much smaller business district compared to Bonanza Park, Lower Park Avenue, and Main Street, but includes a varied mix of tenants. Restaurants and drinking establishments accounted for six of the eleven businesses classified during a site reconnaissance visit to Park City. The roster of restaurants in Prospector includes a few Mexican and pizza outlets, an Italian restaurant, and a few fast food-oriented eateries. Small hardware stores and auto parts stores account for three of the four general merchandise stores noted in Table 42.
Prospector Local Option Tax Receipts Breakdown by Type
Park City Retail Market Study Page 73 Design Workshop, Inc. June 27, 2011
Table 42: Existing Tenant Mix, Prospector District
Source: Design Workshop Detailed breakdowns of sales activity for different types of businesses within the district are unavailable, but it appears that restaurants in Prospector tend to report sales per square foot in the $200 to $300 range, well below levels reported by a number of eateries in the Main Street district. The emphasis of restaurants in Prospector on affordable family-oriented fare logically produces lower levels of sales on average compared to a number of higher end establishments along Main Street. Sales metrics for general merchandise businesses in Prospector are limited as well but tend to reflect sales per square foot of less than $300. As discussed in other segments of the report, the Bonanza Park district accounts for the vast majority retail located outside of Main Street, PCMR, and Deer Valley, and dominates the smaller Prospector district. Bonanza Park, given its size, tends to reflect a more diversified tenant mix than Prospector. Currently, the Prospector district appears to include a good mix of restaurants and drinking establishments and other retail outlets but could further diversify the mix of businesses to include more convenience goods stores.
Future Retail Demand Analysis
This section of the report outlines the type and amount of retail development supportable in the Prospector district in the future. This analysis utilizes the same methodology used for the other retail districts analyzed in this study. Please consult Table 30 for a summary of the Total Personal Income calculation used for each of the five districts.
Breakdown of Prospector District Retail Properties
Approx. Square
Feet% of
Total SF# of
Stores
Convenience Goods 2,400 9% 1Health and Personal Care 0 0% 0Apparel and General Merchandise 9,047 33% 4Specialty Retail 0 0% 0Sporting Goods 0 0% 0Eating and Drinking 16,043 58% 6
TOTAL SF ---> 27,490
Park City Retail Market Study Page 74 Design Workshop, Inc. June 27, 2011
The following table outlines the capture rates utilized in the analysis of retail demand for the Lower Park Avenue district. Table 43: Retail Capture Rates, Prospector District
Source: Design Workshop
The analysis drew from the history of retail sales and sales tax receipts for the Prospector district in determining the appropriate capture rate for the various categories of spending. Given its relatively small size, the Prospector district currently accounts for around 6 percent of all retail sales in the City (according to data for fiscal year 2009). The analysis therefore applied a capture rate of 6 percent to the Convenience Goods, Shoppers Goods, Eating and Drinking, and Building Materials and Garden categories for retail sales derived from Park City residents, visitors to Park City, and second homeowners. Following the convention for the analysis of other districts, the analysis applies a capture
CAPTURE RATES - PROSPECTOR DISTRICT
Park City Permanent Residents
Park City Seasonal Residents
Visitors to Park City
Summit County Residents (Located outside PC)
Convenience GoodsSupermarket 0% 0% 0% 0.0%Convenience 6% 6% 6% 3.0%Beverage Stores (Coffee / Liquor) 6% 6% 6% 3.0%Health and Personal Care 6% 6% 6% 3.0%
Shoppers GoodsGeneral Merchandise (Dept Stores, Other) 6% 6% 6% 3.0%Clothing and Accessories 6% 6% 6% 3.0%Furniture and Furnishings 6% 6% 6% 3.0%Electronics and Appliance 6% 6% 6% 3.0%Office Supplies and Stationery 6% 6% 6% 3.0%Pet and Pet Supplies 6% 6% 6% 3.0%Miscellaneous Retail (gifts, flowers, etc.) 6% 6% 6% 3.0%
Building Materials and GardenHome Centers 6% 6% 6% 3.0%Paint and Wallpaper 6% 6% 6% 3.0%Hardware 6% 6% 6% 3.0%Lawn and Garden Equipment 6% 6% 6% 3.0%Other 6% 6% 6% 3.0%
Auto RelatedAutomobile Dealers 0% 0% 0% 0%Other Motor Vehicles (recreational) 0% 0% 0% 0%Automotive Parts, Accessories and Tires 0% 0% 0% 0%
Park City Retail Market Study Page 75 Design Workshop, Inc. June 27, 2011
rate half that used for the other categories in determining the potential retail sales garnered from Summit County residents living outside of the boundaries of Park City. Given the clustering of auto-related retailers closer to the interstate and US 40, the analysis assumed a zero percent capture rate for auto-related goods for the Prospector district. In addition, given the limited size of the Prospector district and the retail dominance of the adjacent Bonanza Park district, the analysis assumed a zero capture rate for larger format retailers including supermarkets. The following table outlines the projected supportable square footage for retail in the major categories of spending, for the Prospector district, for 2010, 2015, and 2020. Table 44: Projected Retail Demand, Prospector District, 2010 - 2020
Source: Design Workshop, ESRI The analysis shows that, based upon growth in incomes and population for residents and visitors alike, the theoretical supportable retail space in the Prospector district should increase from around 140,000 square feet in 2010 to around 164,000 square feet by 2020. The analysis increased the assumption for sales per square foot over the next ten years to account for inflation (using a 2.5 annual inflation rate). Alternative Retail Demand Method – Prospector District Design Workshop also examined the potential retail demand for the Prospector district using a second methodology that considered the potential demand from local residents for retail in the Prospector area based upon one, all-encompassing trade area that includes both Park City and the Snyderville basin, rather than calculating the retail demand based upon two separate trade areas. As illustrated in the following table, the forecasted retail demand for the Prospector area for 2010, 2015, and 2020 changed relatively little by using this alternate trade area for the purposes of analysis. The forecasted demand numbers are fairly similar in using either a smaller trade area (including mainly Park City) versus a larger trade area including Kimball Junction because the capture rates used to calculate forecasted demand change accordingly as the trade areas change. For example, using a trade area including only Park City, the Prospector district may capture a higher rate of the spending in this trade area for clothes, but would capture a smaller share of the spending on clothing in a larger trade area including Kimball Junction. The alternate analysis reduces the predicted retail demand (in terms of square footage) by around 10,000 for 2010 and the predictions for 2015 and 2020.
Total ---> 139,939 Total ---> 150,523 Total ---> 164,412
Park City Retail Market Study Page 76 Design Workshop, Inc. June 27, 2011
Table 45: Projected Retail Demand, Prospector District, 2010 – 2020 (Using Alternate Trade Area in ESRI)
Source: Design Workshop, ESRI Takeaways for Prospector District:
The analysis does support the idea of adding a limited amount of additional retail in the Prospector district over the next ten years, assuming that incomes grow as projected over the next decade.
Square Footage and Tenant Mix Recommendations
Given its relatively small size and orientation toward retailers and restaurants serving both locals and visitors, the overall approach to retail in the Prospector district will likely not change in the next few decades. The Main Street district, coupled with the Lower Park Avenue district to a certain extent, will attract the lion’s share of resort oriented retail going forward. The Bonanza Park district appears primed to maintain its position as the home of larger format retailers such as groceries and pharmacy outlets. Given this competitive orientation, the study suggests that property owners, business owners, and civic leaders simply work to improve the quality of tenants and the appearance of the district over the next few decades in order to maintain and strengthen its retail viability in the local market. Overall, the analysis found that the Prospector district lacked identity compared to the other districts in Park City. The district lacks organization and a central theme. This analysis recommends that the city work with property owners to develop a more tangible and marketable theme for the Prospector area in order to drive increased activity. It may be possible, for example, to brand the district as Park City’s primary office-serving retail, by providing goods and services geared to the employment center to the west, in the Bonanza Park district (including various offices and businesses).
Total ---> 133,176 Total ---> 142,205 Total ---> 155,273
Park City Retail Market Study Page 77 Design Workshop, Inc. June 27, 2011
Bonanza Park Retail
Analysis of Current Conditions / Performance
Physical Attributes The Bonanza Park district primarily includes lower density suburban-oriented land uses, including a significant grocery store, fast food outlets, a pharmacy, and a variety of office and business park uses. Although the major streets within the district feature sidewalks, vehicular traffic dominates the physical setting in the Bonanza Park area. The City recently completed a pedestrian and bicycle tunnel under Bonanza Drive, providing enhanced access for individuals crossing the street to use the rail trail in the area. The Bonanza Park district in large part resembles typical suburban retail and business areas common throughout the country. Scale and Views The scale of buildings in the Bonanza Park district is generally suburban in nature. Larger grocery stores and commercial tenants occupy larger format, single story “boxes” closer to the intersection of Kearns Boulevard and Park Avenue. Smaller single story pad sites tend to line Park Avenue and Kearns Boulevard in front of the anchor tenants. A few buildings near the Park Avenue / Kearns Boulevard junction feature primarily retail uses on the ground floor, with offices uses on a second floor. The Bonanza Park district includes several blocks of single or double story business park or flex space uses to the south and east, toward Bonanza Drive and Deer Valley Drive. Given the size of parking lots in the area, shoppers have relatively unobstructed views of Park City mountain to the west and the Deer Valley area to the south. Architectural Style The architectural style of buildings in the Bonanza Park district influences the identity and character of the area. Many of the buildings in the district reflect typical suburban architectural patterns common to the West from the 1960s through the 1980s. However, a few newer developments such as the Freshmarkets complex to the north of Kearns Boulevard feature architectural styles and treatments from the last 10 years. In general, the Bonanza Park district resembles traditional suburban construction at somewhat higher densities. Visual Access Generally, retail and office uses in the Bonanza Park district have good visual access from streets and for pedestrians and drivers. Signage in the district is relatively clear and visible from the primary commercial streets including Park Avenue and Route 248.
Park City Retail Market Study Page 78 Design Workshop, Inc. June 27, 2011
Physical Access to the District The Bonanza Park district enjoys centralized access from Park City and from the larger Summit County area. Park Avenue, Deer Valley Drive, Bonanza Drive, and Kearns Blvd converge in the same area within the Bonanza Park district. Given the layout of the local street network and the physical constraints of the surrounding ridges and mountain ranges, a visitor or resident simply must pass through the Bonanza Park district to access various locations within the community. Because it contains several “spokes on the wheel” serving various neighborhoods in the Park City area, the Bonanza Park district represents the primary node of transportation in the city. Public Space The Bonanza Park district does not feature any central gathering places or focal points at this time. Economic Attributes The Bonanza Park district has traditionally included retailers and tenants geared to general merchandise, serving local residents in Park City as well as visitors, and therefore has displayed less seasonality in terms of business activity than the Lower Park Avenue or Main Street districts. The patterns of seasonality have remained fairly consistent over the last decade, with the third quarter of each fiscal year accounting for slightly greater than one-third of the annual total, the first and second quarters accounting for 20 to 25 percent, and the slow season during the fourth quarter accounting for 15 to 20 percent of the annual local option tax receipts produced by the Bonanza Park district. Table 46: Bonanza Park District, Local Option Tax Receipts, 2001 - 2009
Source: Park City Municipal Corporation General retail including grocery stores, pharmacies, and related day to day retail establishments have traditionally accounted for greater than three quarters of tax receipts generated in the Bonanza Park area, as illustrated in Table 47. Service businesses have traditionally generated 10 to 20 percent of annual tax
Entryway Local Option Tax Receipts by QuarterTOTAL
Park City Retail Market Study Page 79 Design Workshop, Inc. June 27, 2011
receipts in the Bonanza Park area, and restaurants have accounted for less than 10 percent of annual tax totals. Table 47: Bonanza Park District, Local Option Tax Receipts, Breakdown by Type, 2001 - 2009
Source: Park City Municipal Corporation Analysis of Tenant Mix and Economic Performance The Bonanza Park district clearly caters to general residents as well as visitors to Park City, who may frequent the area to purchase groceries or complete more day to day business. Therefore, for purposes of discussion the tenant analysis chart presented in Table 48 uses classifications of retail traditionally used for suburban or non-resort retail districts and communities. While restaurants and drinking establishments account for a relatively small share of total tax receipts in the Bonanza Park district, as illustrated in Table 48 they accounted for a sizable portion of the total number of businesses in the area, as documented during a site reconnaissance visit. Service oriented businesses (including dental offices, nail and hair salons, banks, and insurance and real estate agencies) accounted for nearly half of the businesses in Bonanza Park, but produced a much smaller share of total tax receipts (as discussed previously). A small number of larger format retailers including Freshmarkets, Rite Aid, and Sports Authority, produce very large portions of the total sales in the Bonanza Park district. In general, besides the significant number of service businesses and individual eateries / drinking establishments, the Bonanza Park district exhibits a diversified roster of businesses, including groceries, pharmacies, liquor stores, and a range of support, in-line retail at two or three main shopping plazas located in the vicinity of Park Avenue and Kearns Boulevard.
Entryway Local Option Tax Receipts Breakdown by Type
Park City Retail Market Study Page 80 Design Workshop, Inc. June 27, 2011
Table 48: Existing Tenant Mix, Bonanza Park District
Source: Design Workshop In general, retail outlets selling food (in stores, as opposed to restaurants) exhibit the greatest strength in Bonanza Park, reporting sales per square foot on average in excess of $400. Restaurants and drinking establishments report sales averaging around $200 per square foot, and service businesses report sales per square foot approaching $400. Apparel stores report less than $200 per square foot on average.
Future Retail Demand Analysis
This section of the report outlines the type and amount of retail development supportable in the Bonanza Park district in the future. This analysis utilizes the same methodology used for the other retail districts analyzed in this study. Please consult Table 30 for a summary of the Total Personal Income calculation used for each of the five districts. The following table outlines the capture rates utilized in the analysis of retail demand for the Lower Park Avenue district.
Breakdown of Bonanza District Retail Properties
# of Stores
Convenience Goods 2Health and Personal Care 1Apparel and General Merchandise 3Specialty Retail 5Sporting Goods 1Retail - Food 3Eating and Drinking 17Entertainment 1Services 35
TOTAL ---> 68
Park City Retail Market Study Page 81 Design Workshop, Inc. June 27, 2011
Table 49: Retail Capture Rates, Bonanza Park District
Source: Design Workshop
The analysis drew from the history of retail sales and sales tax receipts for the Bonanza Park district in determining the appropriate capture rate for the various categories of spending. For the Convenience Goods category the analysis utilized capture rates of 25 percent for Park City residents, Park City second homeowners, and visitors to Park City, and 15 percent for Summit County residents living outside of the boundaries of Park City. The analysis generally utilized lower capture rates of 5 to 10 percent for the Shoppers Goods, Eating and Drinking, and Building Materials and Garden categories. Given the
CAPTURE RATES - BONANZA DISTRICT
Park City Permanent Residents
Park City Seasonal Residents
Visitors to Park City
Summit County Residents (Located outside PC)
Convenience GoodsSupermarket 75% 50% 25% 15.0%Convenience 25% 25% 25% 15.0%Beverage Stores (Coffee / Liquor) 25% 25% 25% 15.0%Health and Personal Care 25% 25% 25% 15.0%
Shoppers GoodsGeneral Merchandise (Dept Stores, Other) 0% 0% 0% 0.0%Clothing and Accessories 10% 10% 10% 5.0%Furniture and Furnishings 10% 10% 10% 5.0%Electronics and Appliance 0% 0% 0% 0.0%Office Supplies and Stationery 20% 20% 20% 10.0%Pet and Pet Supplies 10% 10% 10% 5.0%Miscellaneous Retail (gifts, flowers, etc.) 10% 10% 10% 5.0%
Building Materials and GardenHome Centers 5% 5% 5% 5.0%Paint and Wallpaper 5% 5% 5% 5.0%Hardware 5% 5% 5% 5.0%Lawn and Garden Equipment 5% 5% 5% 5.0%Other 5% 5% 5% 5.0%
Auto RelatedAutomobile Dealers 0% 0% 0% 0%Other Motor Vehicles (recreational) 0% 0% 0% 0%Automotive Parts, Accessories and Tires 0% 0% 0% 0%
Park City Retail Market Study Page 82 Design Workshop, Inc. June 27, 2011
clustering of auto-related retailers closer to the interstate and U.S. 40, the analysis assumed a zero percent capture rate for auto-related goods for the Bonanza Park district. The following table outlines the projected supportable square footage for retail in the major categories of spending, for the Bonanza Park district, for 2010, 2015, and 2020. Table 50: Projected Retail Demand, Bonanza Park District, 2010 - 2020
Source: Design Workshop, ESRI The analysis shows that, based upon growth in incomes and population for residents and visitors alike, the theoretical supportable retail space in the Bonanza Park district should increase from around 562,000 square feet in 2010 to just under 675,000 square feet by 2020. The analysis uses an assumption of an annual inflation rate of 2.5 percent for the average sales per square foot over the next 10 years. Alternative Retail Demand Method – Bonanza Park District Design Workshop also examined the potential retail demand for the Bonanza Park district using a second methodology that considered the potential demand from local residents for retail in the Bonanza Park area based upon one, all-encompassing trade area that includes both Park City and the Snyderville basin, rather than calculating the retail demand based upon two separate trade areas. As illustrated in the following table, the forecasted retail demand for the Bonanza Park area for 2010, 2015, and 2020 went down somewhat by using this alternate trade area for the purposes of analysis. The forecasted demand numbers are fairly similar in using either a smaller trade area (including mainly Park City) versus a larger trade area including Kimball Junction because the capture rates used to calculate forecasted demand change accordingly as the trade areas change. For example, using a trade area including only Park City, Bonanza Park may capture a higher rate of the spending in this trade area for clothes, but would capture a smaller share of the spending on clothing in a larger trade area including Kimball Junction. The alternate analysis reduces the predicted retail demand (in terms of square footage) by around 10,000 for 2010 and the predictions for 2015 and 2020.
Total ---> 561,991 Total ---> 585,600 Total ---> 672,753
Park City Retail Market Study Page 83 Design Workshop, Inc. June 27, 2011
Table 51: Projected Retail Demand, Bonanza Park District, 2010 – 2020 (Using Alternate Trade Area in ESRI)
Source: Design Workshop, ESRI Takeaways for Bonanza Park District:
The analysis does support the idea of adding additional retail in the Bonanza Park district over the next ten years. The Bonanza Park district represents the largest retail concentration within Park City, and given anticipated growth in incomes and in the population size of Park City residents, second homeowners, visitors to Park City, and county residents living outside of the Park City boundaries, the district should continue to grow over the next 10 years.
Square Footage and Tenant Mix Recommendations
Although the retail demand analysis above indicates the potential for significant additional retail space within the Bonanza Park district over the next 10 years, the general orientation of the district supports more of a mixed-use orientation. While the various businesses located in business park or flex space in the eastern portion of the district, toward Bonanza Drive, do not in many cases provide sales tax revenue to the City, experience in other resort communities supports maintaining the Bonanza area (or a similar area within the community) as a base for businesses needed for the town to function. The Aspen Airport Business Center (ABC) on the outskirts of Aspen, Colorado, provides an instructive example. The ABC is located about three miles from the heart of Aspen on Highway 82, the main route connecting the resort to Glenwood Springs and Interstate 70 in western Colorado. It supports basic businesses which do not require or justify being in a downtown Aspen location, as well as companies that use the ABC as a base for supporting their in-town location (which generally costs as much as three times as the ABC on a square foot basis). The ABC includes about 300 businesses and the same number of residential units. It features office, storage, light industrial and retail businesses with relatively easy and free parking. Several restaurants are open at the ABC, including a French bakery. It also includes several health clubs and yoga studios, a gas station, and convenience stores. In many ways, the Bonanza Park district has the potential to emulate the ABC in the Park City market. Bonanza Park could provide a well-designed and executed mix of retailers and services geared to
Total ---> 520,671 Total ---> 559,848 Total ---> 615,347
Park City Retail Market Study Page 84 Design Workshop, Inc. June 27, 2011
everyday needs, including supermarkets and pharmacies, as well as flex or business park space for companies that simply require a presence in Park City. The presence of a mixed-use center similar to the ABC would help ensure that Park City has companies present within its borders to service residents and day to day business. Examples of companies that would likely remain in this type of district over time include shipping companies (FedEx), grocery stores, and restaurants or larger companies operating in downtown Park City that require a nearby “back office” space. Given its orientation in the larger Park City market and the presence of significant regional retail at Kimball Junction and elsewhere in Summit County, this study recommends that the Bonanza Park district concentrate on maximizing the opportunity to provide space for essential businesses in Park City, coupled with space for day to day retailers such as grocery outlets and pharmacies.
Park City Retail Market Study Page 85 Design Workshop, Inc. June 27, 2011
Deer Valley Retail
Analysis of Current Conditions / Performance
Physical Attributes The retail program at Deer Valley includes a limited area of shops, services, and restaurant space at the base of the mountain (known as the Snow Park area, around the parking lot), the Silver Lake Lodge at mid-mountain (which includes restaurant space as well as retail), and the Empire Lodge restaurant toward the top of the ski area, adjacent to the Montage. A large parking lot dominates the physical setting at the base of the mountain, but this parking lot property may develop into retail or other uses in the future. Scale and Views Deer Valley enjoys some of the most favorable views in Summit County, with good views from parts of the mountain out across the valley and the other ski resorts and Park City. Most of the retail and restaurant space at Deer Valley is organized in two story structures. Architectural Style The architecture at Deer Valley is typical of the contemporary ski resort architecture found at many resorts around the west, featuring wooden beams, high ceilings, and an open floor plan. Visual Access The retail at Deer Valley has limited visual access from Deer Valley Drive and the rest of the community. From the parking lot specific retail outlets and restaurants are not visible, but instead are enclosed in large resort buildings that contain locker rooms, lounges, and a variety of other amenities. A visitor must consult a directory or ask a guide in order to learn the exact name and location of different restaurants and shops. Physical Access to the District By design, Deer Valley does not have simple physical access to the rest of Park City. Visitors must travel on Deer Valley Drive behind city hall in order to reach the resort, and then walk or take gondolas or lifts to reach the retail and restaurants either at the base, at mid-mountain, or at the top of the mountain near the Montage. Public Space Deer Valley features a public gathering space at the base of the resort for visitors and guests, but the space primarily includes a large concrete area with signage and monumentation in place and does not serve as a grand “meeting place” for the community. The plaza at the base area merely features concrete pavement and benches and does not appear to invite shoppers to linger in these spaces.
Park City Retail Market Study Page 86 Design Workshop, Inc. June 27, 2011
Economic Attributes Because the retail at Deer Valley resort essentially comprises all of the retail in the Deer Valley district, this part of Park City exhibits significant seasonality in terms of producing tax revenue for the city. Since Deer Valley follows the cycles of the ski resort business, sales peak during the third quarter of each fiscal year. Local option tax receipt data from Park City Municipal from the last several years (illustrated in) indicates that the pattern of seasonality has remained fairly constant over from 2001 to 2009, with the third quarter generally accounting for between 50 and 65 percent of sales on an annual basis. The second quarter has consistently accounted for 20 to around 30 percent of sales each year. As is the case on a city-wide basis, sales bottom out during the fourth quarter of each fiscal year. Overall, the Deer Valley district’s sales trends over the last nine years have mirrored the city-wide patterns, with a peak of business in fiscal years 2007 and 2008, followed by a decline during FY 2009 as the economic downturn nationally affected business. Table 52: Deer Valley Local Option Tax Receipts, 2001 - 2009
Source: Park City Municipal Corporation Over the last 10 years, retail sales have accounted for a slightly larger share of district-wide sales in the Deer Valley area, increasing from 23 percent of total sales in 2001 to around one-third of total sales in 2005 through 2009. During the same time, services have declined as a share of total sales in the district, from 66 percent in 2001 to between 55 and 59 percent for every year over the 2005 to 2009 period. Restaurant and bar establishments in the district account for only five to seven percent of all sales on a consistent basis, and lodging and “other” have consistently represented only a few percent of district-wide sales. The significant base of sales from Services reflects sales of lift tickets and related services at Deer Valley (including ski school and other training programs). The increase of retail sales relative to the total for the district over the last several years may reflect increased strength in the retail at the base of Deer Valley relative to other offerings in the community.
Deer Valley Local Option Tax Receipts by QuarterTOTAL
Park City Retail Market Study Page 87 Design Workshop, Inc. June 27, 2011
Table 53: Deer Valley Local Option Tax Receipts, Breakdown by Type, 2001 - 2009
Source: Park City Municipal Corporation Analysis of Tenant Mix and Economic Performance The master planned development permit for Deer Valley outlines the allowed square footage for various locations within Deer Valley, as outlined in Table 54. Table 54: Square Footage by Use, Deer Valley Resort
Information gathered during the project indicates that the Deer Valley resort includes primarily businesses located on-mountain that serve the interests of visitors to the resort. In addition to equipment and rental shops not listed in the table, the tenant list for Deer Valley indicates that restaurants dominate the retail at the resort, with a series of restaurants and small snack shops present throughout the resort.
Entryway Local Option Tax Receipts Breakdown by Type
Snow Park Lodge Base of Deer Valley 13,807 26,958 0 85,578 126,343 126,343 0Snow Park Ticket Sales Building Base of Deer Valley 0 0 0 5,112 5,112 5,112 0Snow Park Plaza Building Base of Deer Valley 3,100 0 16,000 4,180 23,280 23,280 0General Snow Park Commercial Base of Deer Valley 21,890 0 0 0 21,890 0 21,890Silver Lake Lodge Mid-Mountain 1,200 29,160 0 15,790 46,150 46,150 0Empire Lodge Adjacent to Montage 0 22,456 0 12,544 35,000 30,453 4,547Silver Lake Community Mid-Mountain 27,962 0 4,265 12,938 45,165 30,906 14,259North Silver Lake community Mid-Mountain 8,000 0 0 6,525 14,525 0 14,525Maintenance, Warehouse, Shops 0 0 0 31,724 31,724 31,724 0
Park City Retail Market Study Page 88 Design Workshop, Inc. June 27, 2011
Table 55: Existing Tenant List, Deer Valley
Source: Design Workshop The Deer Valley resort includes only limited higher end dining options and instead focuses on the needs of skiers visiting the resort. Takeaways for Deer Valley District: The analysis of existing retail space in the Deer Valley district reveals several key points.
Eating and drinking places dominate the retail program at the base of Deer Valley. While these establishments logically cater to the skier market at Deer Valley, there is an opportunity to create a more diverse retail program as the base of Deer Valley develops. The next section, addressing future retail demand for Deer Valley, will further explore the retail potential of the overall district.
As Deer Valley redevelops the parking lot area, it does have an opportunity to create more of a
destination for the Park City market, in an area located relatively close to the Main Street district. While Deer Valley may choose to not integrate a host of entertainment options in the site plan, it could offer a wider range of retail and additional activities at the base area to attract a somewhat larger base of visitors to the Deer Valley area and thereby result in increased sales and sales tax revenue.
Future Retail Demand Analysis
This section of the report outlines the type and amount of retail development supportable in the Deer Valley district in the future. This analysis utilizes the same methodology used for the Main Street district. Please consult Table 30 for a summary of the Total Personal Income calculation used for each of the five districts. The following table outlines the capture rates utilized in the analysis of retail demand for the Deer Valley district.
Tenant Type
Deer Valley Signature Store Apparel & gift itemsDeer Valley Grocery & Café Restaurant / groceriesRoyal Street Café RestaurantSnow Park Restaurant RestaurantEBS Lounge Restaurant / bar & grillSilver Lake Restaurant RestaurantBald Mountain Pizza RestaurantSnow Park Bakery Snack barSnowshoe Tommy's Snack barCushing's Cabin Snack bar
Park City Retail Market Study Page 89 Design Workshop, Inc. June 27, 2011
Table 56: Retail Capture Rates, Deer Valley District
Source: Design Workshop
The analysis drew from the history of retail sales and sales tax receipts for the Deer Valley district in determining the appropriate capture rate for the various categories of spending. For example, the Eating and Drinking categories the analysis utilized a capture rate of 15 percent on average. This ties with Deer Valley’s overall 13 percent share of restaurant and bar sales during fiscal year 2009.The analysis assumed that given the orientation of the Deer Valley area, the district would not capture any sales associated with auto-related retail (including sales of auto parts and accessories), Building Materials and Garden goods, supermarkets, or large format department stores. The following table outlines the projected supportable square footage for retail in the major categories of spending, for the Deer Valley district, for 2010, 2015, and 2020.
CAPTURE RATES - DEER VALLEY DISTRICT
Park City Permanent Residents
Park City Seasonal Residents
Visitors to Park City
Summit County Residents (Located outside PC)
Convenience GoodsSupermarket 0% 0% 0% 0.0%Convenience 10% 10% 10% 5.0%Beverage Stores (Coffee / Liquor) 5% 5% 5% 2.5%Health and Personal Care 5% 5% 5% 5.0%
Shoppers GoodsGeneral Merchandise (Dept Stores, Other) 0% 0% 0% 0.0%Clothing and Accessories 10% 10% 10% 5.0%Furniture and Furnishings 0% 0% 0% 0.0%Electronics and Appliance 0% 0% 0% 0.0%Office Supplies and Stationery 0% 0% 0% 0.0%Pet and Pet Supplies 0% 0% 0% 0.0%Miscellaneous Retail (gifts, flowers, etc.) 10% 10% 10% 5.0%
Source: Design Workshop, ESRI The analysis shows that, based upon growth in incomes and population for residents and visitors alike, the theoretical supportable retail space in the Deer Valley district should increase from just over 110,000 square feet in 2010 to just over 130,000 square feet by 2020. The analysis increased the assumption for sales per square foot over the next ten years to account for inflation (using a 2.5 annual inflation rate). The overall role of Deer Valley retail is to provide convenience and resort retail for overnight visitors, skiers, second home owners and residents of Deer Valley. Overnight visitors and second home owners may dine and shop occasionally at Deer Valley, they are still primarily traveling to Main Street for dinner and shopping. Alternative Retail Demand Method – Deer Valley District Design Workshop also examined the potential retail demand for the Deer Valley district using a second methodology that considered the potential demand from local residents for retail in the Deer Valley area based upon one, all-encompassing trade area that includes both Park City and the Snyderville basin, rather than calculating the retail demand based upon two separate trade areas. As illustrated in the following table, the forecasted retail demand for the Deer Valley area for 2010, 2015, and 2020 went down somewhat by using this alternate trade area for the purposes of analysis. The forecasted demand numbers are fairly similar in using either a smaller trade area (including mainly Park City) versus a larger trade area including Kimball Junction because the capture rates used to calculate forecasted demand change accordingly as the trade areas change. For example, using a trade area including only Park City, Deer Valley may capture a higher rate of the spending in this trade area for clothes, but would capture a smaller share of the spending on clothing in a larger trade area including Kimball Junction. The alternate analysis reduces the predicted retail demand (in terms of square footage) by a few thousand square feet for 2010 and the predictions for 2015 and 2020.
Total ---> 113,787 Total ---> 116,532 Total ---> 132,133
Park City Retail Market Study Page 91 Design Workshop, Inc. June 27, 2011
Table 58: Projected Retail Demand, Deer Valley District, 2010 – 2020 (Using Alternate Trade Area in ESRI)
Source: Design Workshop, ESRI Takeaways for Deer Valley:
The analysis does support the idea of adding additional retail in the Deer Valley district over the next 10 years. The conclusions generally support the idea of adding additional retail in the areas surrounding the base of Deer Valley, including in the parking lots for the ski area.
Square Footage and Tenant Mix Recommendations
The analyses of this study suggest an opportunity for Deer Valley to add more resort-oriented retail around the base of the resort, including additional restaurants and entertainment options. Developers should carefully consider tenanting strategies going forward, to avoid competing directly with the retail program in the Main Street district. Given the availability of additional space for development in the Deer Valley area versus Main Street, property owners in the district may have the opportunity to provide resort-serving retail that requires larger footprints than would be possible in the Main Street district.
Total ---> 112,116 Total ---> 117,044 Total ---> 127,833
Park City Retail Market Study Page 92 Design Workshop, Inc. June 27, 2011
Overall Conclusions and Recommended Action Items This section provides a summary concerning each of the districts analyzed as part of this engagement and should help city leaders and policymakers in guiding development and planning in Park City in the near term and the long term. Main Street District Overall, the Main Street district remains relatively healthy given the national economic condition. The district reports fairly healthy and sustainable levels of vacancy and has fared better than many of its peers around the country, overall. The mix of tenants is fairly good, in that it appeals to a wide range of potential customers, from young people visiting Sundance to vacationing retirees. The district seems to have a disproportionate number of galleries and studios, tenants that typically do not provide much ground level vibrancy. However, Main Street could improve its overall health and regain its position as a district enjoyed by Park City and Summit County residents by doing a better job in appealing to locals. The high season during the third quarter is very important, but the district must carefully serve locals during the winter months as well, so that locals will feel compelled to come back and visit during the non-winter months. Successful resort retail districts simply appreciate the locals year-round. Main Street should work carefully to cultivate local business and build a loyal base of local customers from not only Park City itself, but also from the broader Summit County market and the Salt Lake metro area. In terms of action items, the stakeholders on Main Street and in the community should focus on the following strategies to improve the district.
The City should work with the merchants association and civic leaders to recruit the most appropriate mix of tenants for the district.
The City and merchants association should explore streetscape improvements to enhance the overall look and feel of the district and ensure that it remains updated and attractive to visitors. Streetscape strategies should address lighting, seating and overall walkability.
The City should continue working with property owners and potential developers to integrate design standards with site plans and renovations in the district, in order to ensure that the district retains a consistent, high quality theme.
The City should work with stakeholders in the Main Street area to identify potential locations and strategies to create additional central gathering places in the district. An opportunity exists to create or define the “heart” of Main Street and to make it a signature location in the district.
In order to promote the concept of “retail as entertainment”, the city should work with merchants and stakeholders to introduce elements of entertainment through the design of the physical space as well as the inclusion of specific entertainment-oriented tenants.
The district should sponsor events and activities specially geared to build loyalty among locals in order to provide for more of a four-season retail district.
Park City Retail Market Study Page 93 Design Workshop, Inc. June 27, 2011
Lower Park Avenue This district, including the areas around PCMR, has a tremendous opportunity to redevelop and shape its identity in the Park City marketplace over the next several years. The various property owners should look for opportunities to support both the day skier and destination visitor markets in this part of Park City and should work with PCMR to define development concepts that serve its day skier market while creating a destination district that includes a range of places to eat, shop and have fun that appeal to locals and the greatest variety of tourists possible. At the same time, Lower Park Avenue should look for opportunities to define a distinct identity that does not cannibalize Main Street. One option may involve positioning Lower Park Avenue to specifically target a younger demographic group visiting or living in Park City. The district could feature more tenants and options for entertainment that appeal to younger markets and potentially at lower price points than Main Street. In terms of specific action items, the various property owners and stakeholders should do the following:
Pursue completion of specific projects identified for Lower Park Avenue as part of the city’s visioning processes and extension of the RDA. These projects could tie to transportation improvements, park improvements, streetscape improvements, affordable housing and other city initiatives.
Work with the private sector to confirm site plans for the key gathering places or the main retail “spine” that may develop in the PCMR area.
The City should work with property owners in the area to help identify tenants would help to develop the identity of the district or would result in the greatest levels of business for the district.
Convene meetings regularly as redevelopment progresses to ensure that the district remains united and in order to help create ideas for the identity of the district.
Bonanza Park Bonanza Park represents a very vital area of real estate in the community that has and will continue to serve the needs of the local population in Park City. This district should continue to host the businesses and functions that are vital in continuing to operate a full service community with a full-time population. As mentioned earlier, Bonanza Park should have tenants such as the postal service or FedEx that are essential for local businesses. The district should also continue to serve as the home for the main grocery stores, pharmacies, and other everyday uses. The real estate community and the City should continue working to formulate ideas for projects that improve the value proposition and appearance of Bonanza Park, with a focus on local needs. For example, a mixed-use redevelopment in Bonanza Park could include affordable housing units above retail, office or warehouse spaces, and as a result would produce significant benefits to the City in terms of reducing commute times and reducing pollution. The City and stakeholders in the area should work together to develop Bonanza Park as a true neighborhood or district that serves the needs of locals, rather than as a disparate collection of various small shopping plazas and office parks. As part of this effort, the City should work to integrate all of the community features and amenities it would include in any other neighborhood – such as trails, parks and gathering places.
Park City Retail Market Study Page 94 Design Workshop, Inc. June 27, 2011
In terms of specific action items, the City should:
Explore precedent projects or neighborhoods in resort communities that have developed as mixed-use areas that provide housing for residents and also fulfill many of their daily needs. The Aspen Airport Business Center provides a good example that Park City leaders should understand in order to gain insight as they consider options and development projects.
Develop an action list of community improvements (such as streetscape improvements, parks, trails, etc.) the community would desire to integrate with potential redevelopment of portions of Bonanza Park.
The City should work with local property owners and developers to devise strategies to attract a greater diversity of tenants and businesses in the Bonanza Park neighborhood, in order to enhance the overall marketability of the district.
Prospector The Prospector district is relatively small compared to neighboring Bonanza Park and appears to function fairly well as the home to smaller restaurants and other businesses that serve visitors from throughout Park City, and in particular those staying at hotels in the Prospector area. The Prospector district also functions fairly well as an office district, as it contains a number of smaller offices for businesses based in Park City. As each of the other retail districts in Park City work to clarify their identity and their role in the local economy, the Prospector district should also work to retain its distinct identity. The district should leverage the adjacency of the area to the rail trail and amenities in the north and east portions of Park City and its adjacency to the larger Bonanza Park area. The City should work with stakeholders to identify improvements that would help improve the viability of the businesses in Prospector as well. Specific recommended action items include:
The City should work with businesses along Sidewinder and other streets within Prospector to solve access or ingress /egress issues that currently face the retailers or office property owners in the district, through traffic management strategies or planned public improvements.
The City should work with the property owners to identify and complete any necessary streetscape improvements, or any open space or trail improvements near the district that would enhance its marketability.
The merchants and business owners should work to increase the name recognition of the Prospector district in Park City and beyond. Enhancing name recognition would help to promote repeat business and higher levels of business.
Deer Valley The Deer Valley district includes the retail offerings at the base of the Deer Valley resort as well as shops and restaurants located on the mountain, adjacent to ski runs, and within the resort’s hotels. The resort has the parking area around the base entitled for additional real estate development. The Deer Valley district is relatively small and is relatively isolated from the rest of Park City and Summit County, located behind the Main Street district to the south and east. The retail offerings at Deer Valley appear to have fared fairly well during the economic downturn of the last few years. The priority of Deer Valley in managing this area of retail is how to expand the retail and development program at the
Park City Retail Market Study Page 95 Design Workshop, Inc. June 27, 2011
appropriate pace to take advantage of an economic upturn, while holding off on speculative development. Recommended action items include:
The City should continue working with Deer Valley to ensure that transportation systems in Park City effectively serve the resort from the downtown area. Deer Valley is essentially located in a cul-de-sac location relative to the rest of the community, with only one major route leading out of the resort, and thus must ensure that its transportation connections to Deer Valley Drive and the main part of the community remain functional.
Deer Valley should work to provide the best possible restaurant offerings for guests at the ski resort, as competitor resorts are constantly updating their food service programs and introducing new products to visitors.
Deer Valley should work with City leaders to craft development plans for the parking lot area that satisfy the vision of the community for this part of Park City and also meet market realities.