80
❖ ❖ ❖ ❖ ❖ ❖ ❖ Retail Out-of-Stocks: A Worldwide Examination of Extent, Causes and Consumer Responses ❖

❖❖❖❖
❖❖❖
Retail Out-of-Stocks: A Worldwide Examination of Extent, Causes and Consumer Responses
❖


Retail Out-of-Stocks: A Worldwide Examination of Extent, Causes and
Consumer Responses
A research study conducted at Emory University, Goizueta Business School, Atlanta, GA U.S.; University of St. Gallen, Institute of Technology Management, Switzerland;
and College of Business and Administration, University of Colorado at Colorado Springs, U.S.
Principal Authors:Thomas W. Gruen, Ph.D.
University of Colorado, Colorado Springs, U.S.Daniel S. Corsten, Dr.
Institute of Technology Management, University of St. Gallen, SwitzerlandSundar Bharadwaj, Ph.D.
Goizueta Business School, Emory University, U.S.
This study was funded by a grant from the Procter & Gamble Company
For the Grocery Manufacturers of America, The Food Marketing Institute and CIES – The Food Business Forum

@ 2002 by the Grocery Manufacturers of America. All rights reserved. This publication maynot be reproduced, stored in any informational retrieval system or transmitted in whole orpart in any means – electronic, mechanical, photocopy, recording or otherwise – without theexpress written permission of GMA. Contact the Industry Affairs Group, (202) 337-9400 or1010 Wisconsin Avenue, NW #900, Washington, DC 20007, U.S., or email [email protected] for permission to reprint material from this report.
$40 GMA/FMI Member Price$80 Non-member Price

Table of Contents
Executive Summary . . . . . . . . . . . . . . . . . . . . . . . . . . . . . . . . . . . . . . . . . . . . . . . . . . . . . . . . .vChapter 1: Introduction and Overview of Study . . . . . . . . . . . . . . . . . . . . . . . . . . . . . . . . . .1
Study Background and Objectives . . . . . . . . . . . . . . . . . . . . . . . . . . . . . . . . . . . . . . . . . . . . . .2Methodology and Description of Studies . . . . . . . . . . . . . . . . . . . . . . . . . . . . . . . . . . . . . . . . .5
Chapter 2: Overall Findings . . . . . . . . . . . . . . . . . . . . . . . . . . . . . . . . . . . . . . . . . . . . . . . . . .9A. Extent of OOS . . . . . . . . . . . . . . . . . . . . . . . . . . . . . . . . . . . . . . . . . . . . . . . . . . . . . . . . .10
1. What is an Out-of-Stock? . . . . . . . . . . . . . . . . . . . . . . . . . . . . . . . . . . . . . . . . . . . . . . . .102. Overall Extent of OOS Worldwide and by Region . . . . . . . . . . . . . . . . . . . . . . . . . . . . . .113. OOS Extent by Category . . . . . . . . . . . . . . . . . . . . . . . . . . . . . . . . . . . . . . . . . . . . . . . . .124. Variation Rates by Time of Day and Day of Week . . . . . . . . . . . . . . . . . . . . . . . . . . . . . .145. Variation in OOS Rates by Promotion, Movement, and Duration of OOS . . . . . . . . . . . . .156. Conclusions from Analysis of the Extent of OOS . . . . . . . . . . . . . . . . . . . . . . . . . . . . . . .17
B. Consumer Response to OOS Situations . . . . . . . . . . . . . . . . . . . . . . . . . . . . . . . . . . . . . . .181. Consumer Response Types and Impact on Retailers and Manufacturers . . . . . . . . . . . . .182. U.S. Consumer Study Summary Findings . . . . . . . . . . . . . . . . . . . . . . . . . . . . . . . . . . . .193. Consumer Responses Vary Across Categories . . . . . . . . . . . . . . . . . . . . . . . . . . . . . . . . .204. Consumer Responses Vary by Region Country . . . . . . . . . . . . . . . . . . . . . . . . . . . . . . . .215. Worldwide Responses by Category . . . . . . . . . . . . . . . . . . . . . . . . . . . . . . . . . . . . . . . . .236. Drawing Comparisons Across Countries . . . . . . . . . . . . . . . . . . . . . . . . . . . . . . . . . . . . .247. Implications of the Worldwide Analysis . . . . . . . . . . . . . . . . . . . . . . . . . . . . . . . . . . . . .258. Measuring Consumer Reactions with Item Velocity Monitoring . . . . . . . . . . . . . . . . . . . .269. Comparison of Consumer Responses with Previous OOS Studies . . . . . . . . . . . . . . . . . . .2710 Final Questions Regarding Consumer Responses to OOS Situations . . . . . . . . . . . . . . . .28
C. Causes of OOS . . . . . . . . . . . . . . . . . . . . . . . . . . . . . . . . . . . . . . . . . . . . . . . . . . . . . . . . .311. OOS Causes by Region . . . . . . . . . . . . . . . . . . . . . . . . . . . . . . . . . . . . . . . . . . . . . . . . .322. Examination of Primary Root Causes by Process . . . . . . . . . . . . . . . . . . . . . . . . . . . . . .353. Other Explanations and Attributions of OOS . . . . . . . . . . . . . . . . . . . . . . . . . . . . . . . . . .374. Determining Root Causes of Retail Chain Characteristics . . . . . . . . . . . . . . . . . . . . . . . . .38
D. The Financial and Managerial Implications of OOS . . . . . . . . . . . . . . . . . . . . . . . . . . . . . .401. Defining the Implications of OOS . . . . . . . . . . . . . . . . . . . . . . . . . . . . . . . . . . . . . . . . . .402. Quantifying the Losses due to OOS . . . . . . . . . . . . . . . . . . . . . . . . . . . . . . . . . . . . . . . . .413. Reported Costs of OOS . . . . . . . . . . . . . . . . . . . . . . . . . . . . . . . . . . . . . . . . . . . . . . . . .444. OOS Fixes and Implications . . . . . . . . . . . . . . . . . . . . . . . . . . . . . . . . . . . . . . . . . . . . . .465. Examples of New, Best of Breed Scenarios . . . . . . . . . . . . . . . . . . . . . . . . . . . . . . . . . . .496. Conclusion . . . . . . . . . . . . . . . . . . . . . . . . . . . . . . . . . . . . . . . . . . . . . . . . . . . . . . . . . .50
Appendices . . . . . . . . . . . . . . . . . . . . . . . . . . . . . . . . . . . . . . . . . . . . . . . . . . . . . . . . . . . . . . .53A. 1. Listing of Studies Examined . . . . . . . . . . . . . . . . . . . . . . . . . . . . . . . . . . . . . . . . . . . . .54
2. Bibliography . . . . . . . . . . . . . . . . . . . . . . . . . . . . . . . . . . . . . . . . . . . . . . . . . . . . . . . .55B. Consumer Reaction . . . . . . . . . . . . . . . . . . . . . . . . . . . . . . . . . . . . . . . . . . . . . . . . . . . . .56C. 1. Charts of Consumer Responses by Country . . . . . . . . . . . . . . . . . . . . . . . . . . . . . . . . . .57
2. General Observations of Consumer Responses in Various Countries . . . . . . . . . . . . . . . .62D. 1. Listing of Root Cause Studies Examined . . . . . . . . . . . . . . . . . . . . . . . . . . . . . . . . . . . .63
2. Root Cause Analysis Flowchart . . . . . . . . . . . . . . . . . . . . . . . . . . . . . . . . . . . . . . . . . . .64E. Probability of Complete Satisfaction . . . . . . . . . . . . . . . . . . . . . . . . . . . . . . . . . . . . . . . . .65F. Authors’ Vitae . . . . . . . . . . . . . . . . . . . . . . . . . . . . . . . . . . . . . . . . . . . . . . . . . . . . .66

Acknowledgments
The Association co-sponsors would like to thank the authors and their universities – Thomas W.Gruen, Ph.D., University of Colorado, Colorado Springs; Daniel S. Corsten, Dr., Institute of TechnologyManagement, University of St. Gallen, Switzerland; and Sundar Bharadwaj, Ph.D., Goizueta BusinessSchool, Emory University.
We would especially acknowledge the research assistance of Gunther Kucza of the University of StGallen in Switzerland and Ravi Nayak of Emory University in Atlanta, Georgia.
A very special thanks also goes to The Procter & Gamble Company which provided the grant for theresearch for this report.
iv

Executive Summary
Overview and ObjectivesKey Findings
v
Retail Out-of-Stocks:A Worldwide Examination of Extent, Causes and Consumer Responses

Overview and ObjectivesThis report presents the largest and most current single compilation of findings onthe extent, causes, and consumer responses to retail out-of-stock (OOS) situationsin the fast-moving consumer goods industry. It is also perhaps the first study thatenumerates OOS on a worldwide basis.
The inputs for this report come from 52 studies that examine out-of-stocks, includ-ing the previously published results of 16 industry and academic studies as wellas the results from an additional 36 studies proprietary to this report. To provide asense of the extensiveness of the studies that were used to develop this report,consider the following:
✓ Number of retail outlets examined: 661✓ Number of consumer goods categories included: 32 ✓ Number of consumers surveyed worldwide: 71,000✓ Number of countries represented: 29✓ Studies addressing extent of OOS: 40 (of 52 total studies)✓ Studies addressing the root causes of OOS: 20 (of 52 total studies) ✓ Studies addressing the consumer responses to OOS: 15 (of 52 total studies)
The objective of the study has been three-fold: ✓ To present an updated and accurate map of facts surrounding retail out-of-
stocks in the consumer goods industry.✓ To examine out-of-stocks worldwide, analyzing rationale for similarities
and differences.✓ To examine differences in findings based on different methodologies of
measuring out-of-stocks.
Key FindingsTHE EXTENT HAS NOT DECREASED FROM EARLIER STUDIES. Out-of-stocks remains a large problem for retailers, distributors and manufactur-ers in the worldwide consumer goods industry. The advances in supply chainmanagement, the initiatives of Efficient Consumer Response (ECR) and categorymanagement, and the investments in inventory-tracking technology have not –by and large – reduced the overall level of out-of-stocks on store shelves fromwhat was reported in previous studies. Out-of-stock rates vary wildly amongretailers and their outlets depending on a variety of factors, but the majoritytends to fall in the range of 5-10 percent.
More importantly, in studies that examine faster selling and/or promoted prod-ucts, the OOS rate regularly exceeds 10 percent. The overall average OOS rateworldwide is estimated at 8.3 percent and is illustrated on Exhibit 1.
vi Retail Out-of-Stocks: A Worldwide Examination of Extent, Causes and Consumer Responses
ExecutiveSummary
FIRST

MOST OF THE DIRECT OOS CAUSES OCCUR AT — AND MUST BE REMEDIED AT —THE RETAIL STORE. The analysis shows that 70-75 percent of out-of-stocks are a direct result of retail storepractices (either underestimating demand or having ordering processes/cycles that aretoo lengthy) and shelf-restocking practices (product is at the store but not on the shelf).Exhibit I-2 divides the responsibility for OOS into its major components, and interest-ingly, the responsibility breaks out into the following approximate general groupings:
✓ Retail store ordering and forecasting causes (about one-half of OOS).✓ Retail store shelving and replenishment practices in which the product is
at the store but not on the shelf (about one-fourth of OOS).✓ Combined upstream causes (about one-fourth of OOS).
The report provides extensive detail behind these general summary numbers in thesection on Causes of OOS. (See Chapter 2, Section C for detailed information.)
viiExecutive Summary
SECOND
Ex
hib
it 1
Worldwide 8.3
USA 7.9
Europe 8.6
Other Regions 8.2
0.0 2.0 4.0 6.0 8.0 10.0
Overall OOS Extent (Averages)
Ex
hib
it 2OOS Causes: Worldwide Averages
Percentage OOS
Total Upstream Causes 28%
Store Ordering and Forecasting 47%
In the Store, Not on the Shelf 25%

NEW EVIDENCE IS PRESENTED THAT CHANGES PREVIOUS UNDERSTANDING OF THE
WAYS CONSUMERS RESPOND TO OUT-OF-STOCKS. Our consumer data of more than 71,000 consumers surveyed show an increasingwillingness of consumers — when confronted with an out-of-stock situation — toseek those items at an alternative outlet. These consumer studies show —depending on the product category — that when confronted with an out-of-stocksituation, 21 to 43 percent of consumers will make that purchase at another store,while another 7 to 25 percent will not buy the item at all.
The consumer studies show that retailers are likely to lose almost one-half of theintended purchases when a consumer confronts an out-of-stock. This loss doesnot include the impact of substituting, which generally tends toward a cheapersubstitute.
The worldwide averages across eight major categories are shown in Exhibit 3. Thereport provides extensive detail behind these general summary numbers in thesection on consumer response to OOS (Chapter 2 B).
THE IMPLICATION OF THE ABOVE FINDING SUGGESTS THAT THE COST OF OUT-OF-STOCKS TO RETAILERS IS GREATER THAN PREVIOUSLY REPORTED. Our findings show that a typical retailer loses about 4 percent of sales dueto having items out-of-stock. A loss of sales of 4 percent translates into aearnings per share loss of about $0.012 (1.2 cents) for the average firm inthe grocery retailing sector, where the average earnings per share, alreadyis about $0.25 (25 cents) per year. (For more details behind these generalsummary numbers, see the section on implications of retail OOS inChapter 2 D.)
viii Retail Out-of-Stocks: A Worldwide Examination of Extent, Causes and Consumer Responses
THIRD
FOURTH
Ex
hib
it 3
Worldwide Consumer Responses to OOS(Average across eight categories)
Do not Purchase Item 9%
Substitute — Same Brand 19%
Delay Purchase 15%
Substitute — Different Brand 26%
Buy Item at Another Store 31%

THIS EXAMINATION OF OUT-OF-STOCKS SHOWS SOME STRIKING SIMILARITIES
WORLDWIDE AS WELL AS CLEAR DIFFERENCES BY REGION. The aggregate root cause attributed to retail stores for OOS situations varies littleacross regions. However, while the causes attributed to the retail store are consis-tent in the aggregate, clear differences among the regions can be seen when itcomes to the amount of store ordering vs. forecasting vs. replenishment.
When examining consumer reactions to OOS, consumer brand substitution variesgreatly across regions. Differences in the variance of the extent of OOS can befound in developing countries (greater variance). This study sheds considerablelight on both the worldwide differences and the worldwide similarities in terms ofextent, causes and consumer responses to OOS.
THIS STUDY INTRODUCES OOS COMPARISON MEASUREMENTS USING A NEW METHOD.This study examined several measurements of out-of-stocks by a new method thatuses scanner data and product movement to predict and identify out-of-stock situ-ations. Most OOS studies (including many of the ones examined for this report)have relied on physical store audits that provide measures of out-of stocks at spe-cific periods of time. However, identifying an out-of-stock through a physicalaudit does not necessarily identify the true effect of that out-of-stock, nor does itprovide a precise measure of the duration of the out-of-stock. The latter consider-ation, the duration, is managerially relevant, since the length an item is out-of-stock indicates the true damage to the store’s sales. The findings using the newmethod of measurement were reasonably consistent with the store audits, and thissuggests that the new method provides reliable measures.
ixExecutive Summary
SIXTH
FIFTH


1Chapter 1: Introduction and Overview of Study
Chapter 1: Introduction and Overview of Study
Study Background and ObjectivesMethodology and Description of Studies
Retail Out-of-Stocks:A Worldwide Examination of Extent, Causes and Consumer Responses

2 Retail Out-of-Stocks: A Worldwide Examination of Extent, Causes and Consumer Responses
Introduction and Overview of StudyIn the past few years, three key forces have converged to add pressure andurgency to OOS issues. For the following three reasons, as never previously in his-tory, the issue of out-of-stocks is of greater importance to retailers and their supplychain partners.
✓ First, to provide motivation to address the issue is the fact that consumersare becoming less tolerant of OOS situations. With more information attheir fingertips and more available outlets and channels for purchasing,consumers are being trained to be less accepting of OOS situations. Withworldwide consistency, consumers will increasingly shop at an alternateoutlet to find the item they need. To NOT address the OOS issue is clearlybecoming more hazardous.
✓ Second, the opportunity for direct impact when addressing the problemhas increased. As retailing continues its consolidation and becomes glob-al, retailers find solutions are becoming increasingly valuable, as they canprovide solutions for these issues on a worldwide basis.
✓ Third, technology provides new ways to address OOS. This is providingretailers a new-found ability to address OOS, rather than the traditionallyrecommended solutions that carry the heavy ongoing costs of increasedlabor or greater inventory safety stocks.
Throughout this report, extensive background information and current data areprovided relating to these primary findings of our 18-month worldwide study. Asthe Executive Summary highlights, OOS continues to be a problem for retailersand their supply chain partners. Previous published studies have examined theissue regionally, but this report shows that OOS can and must be addressed byretailers worldwide.
OUT-OF-STOCKS AND THE RETAILER
Retailing demands extraordinary commitment to detail from its managers.Retailing also presents its managers with multiple challenges that simultaneouslybeg for attention. One of those challenges has long been keeping products thatcustomers want and need in stock and available.
If retailing were not extremely competitive, the implications of out-of-stock prod-ucts would not command the attention of retail managers. In metropolitan areasworldwide, however, retail competition is keen and continues to intensify. Giventhis situation, having products in stock is becoming more and more a requirementto play in the game.
At the same time, products continue to proliferate. According to the FMI Website, the number of SKUs in 2001 in an average grocery store was nearly 25,000.This makes the task of keeping products in stock and available all that more diffi-
ChapterOne
A. STUDY BACKGROUND
AND OBJECTIVES

3Chapter 1: Introduction and Overview of Study
cult. The retailer’s problem with out-of-stock items validates the adage that “retailis detail.”
INTERNATIONAL ECR AND RECENT OUT-OF-STOCK RESEARCH PROJECTS
Keeping items in stock is not the sole problem of the retailer, but rather is sharedby the entire supply chain. The Efficient Consumer Response (ECR) initiative thatwas started in 1993 in the United States by grocery retailers, distributors and man-ufacturers of fast-moving consumer goods, sought to reduce many of the ineffi-ciencies throughout the supply chain. One of its key strategies – category man-agement – provided a means for determining what products were most importantto the consumer and to ensure availability of these products. Through categorymanagement, all ECR supply chain players developed practices to guide the rightmix of products more efficiently through the supply chain to the ultimate con-sumer.
As the ECR movement spread worldwide in the late 1990s, it provided a forum forcommon industry issues to be heard. One message that arose from all parts of theworld was concern about out-of-stock items. Since all players in the supply chainshare in the problem — and the solution — of out-of-stock items, ECR in Europe,Asia and Latin America plus joint industry initiatives in the United States providevenues to address and solve the problem. Despite recent efforts to stem the OOStrends, however, the level of out-of-stock continues to haunt retailers and theirsupply chain partners alike. It is clear that additional study of the extent, rootcauses and consumer reactions to out-of-stock items is necessary to clarify theproblem for the industry. It is also necessary to provide insights and justificationfor the level of resources that can and/or should be committed to addressing out-of-stock issues.
Currently, OOS is one of the top agenda items for non-U.S. ECR. As the ECRorganizations mature in Asia, Europe, Latin America and elsewhere, they havebegun to shift their attention from the processes and components that lead toindustry efficiency to more specific outcome objectives, such as reductions in out-of-stocks. For example, the 2001 ECR Asia conference theme was “50/50: 50Percent Reduction in Inventory and 50 Percent Reduction in Out-of-Stocks.” ECREurope is currently conducting a large pan-European OOS study that is slated tobe one of the major future discussion topics. ECR organizations that have recent-ly conducted studies and released their findings include ECR Australia, ECRFrance, ECR China, and ECR Thailand. More have been proposed or are under-way in other countries. (Additional information on ECR organizations and relatedlinks can be found on the Internet at www.globalscorecard.net, www.ecr-academ-ics.org, and www.ecr-journal.org.)
EXISTING RESEARCH ON OUT-OF-STOCKS
While there is a flurry of recent activity in OOS research, the applied and academicstudies over the past several years that have examined the out-of-stock issue have shed

4 Retail Out-of-Stocks: A Worldwide Examination of Extent, Causes and Consumer Responses
light on the issue from specific perspectives. A study was conducted by AndersenConsulting and the Coca-Cola Retailing Research Council in 1996. This study exam-ined 11 categories of consumer goods in 10 stores across the United States for amonth and found that on average 8.2 percent of the items in the categories examinedwere out-of-stock on a typical afternoon. Additionally this study reported that 46 per-cent of consumer purchases were at risk of purchase at another store, purchase delay,or substituting a lower-value product when an out-of-stock situation occurred.
While the focus of the Coca-Cola study was on the grocery retailing, similar studieswere conducted in the late 1990s by industry associations representing chain drugstores and convenience stores. In 2002, the Grocery Manufacturers of America(GMA) published a study that focuses on the top 25 grocery categories across, withan in-depth look at seven direct store delivery (DSD) categories. The study was themost comprehensive in years, tracking 1,600 items in 20 stores in four major U.S.retailers for 14 consecutive days. Additionally, one thoU.S.nd shoppers were inter-viewed. Additional data was provided on the top 25 grocery categories from 500stores across five regions of the United States, resulting in more than 92 millionindividual store/item/day observations. The study found that shoppers can not findthe item they want to buy 7.4 percent of the time. Some 40 percent of these shop-pers – when confronted with an out-of-stock situation – either postpone their pur-chase or buy elsewhere, placing $6 billion in annual sales at risk in those top 25categories. The study found that stock-outs can jump to as high as 17.1 percent dur-ing store promotions and that when a product is unavailable on the shelf, a retailercan potentially lose $75,000 annually per store.
The GMA study, the Coca-Cola/Andersen study and others have been conductedin the United States Additionally, a smattering of proprietary studies has beenreported in business publications. Finally, in addition to the published studiesdone for industry, academic research has made important contributions to theunderstanding of out-of-stocks. A complete listing of all of the studies that wereused as background for this current study can be found in Appendix A.
DIFFICULTIES IN MEASURING EXTENT, CAUSES AND CONSUMER REACTION
The major limitation in studying out-of-stocks rest in the large number of factorsthat affect the outcomes of any particular study. Some of the primary factors thatcause the extent of reported out-of-stocks to vary include:
✓ Definition of out-of-stock item. (For example, the product may be in multi-ple places in the store, but out-of-stock at one location but not another.)
✓ Methodology used in counting out-of-stocks (Includes frequency and tim-ing of measures e.g. time of day, day of week and other seasonal factors.)
✓ The velocity or speed of turnover of items examined (When only thefastest moving items are examined, rates are higher than when all SKUsare examined.)
✓ The way new and discontinued SKUs are considered.✓ Promotions and promotional coordination among channel members.

5Chapter 1: Introduction and Overview of Study
Similarly, a wide variety of factors also affect the causes of out-of-stocks such as:✓ Shifts in consumer demand.✓ Promotional planning periods.✓ Sophistication of the supply chain and channel practices.✓ Standard channel problems, such as demand amplification (“bullwhip
effect”).✓ Allocation of shelving to SKUs based on case size, as opposed to product
movement (which constrains and affects ordering practices).
Finally, while there are only a small number of primary actions that consumerscan take when confronted by an out-of-stock situation, several factors affect thelikelihood of action that will be taken in any given situation, such as:
✓ Category of products examined, due to varying willingness and ability tosubstitute, e.g., product loyalty.
✓ Geographic proximity of competitors.✓ Overall extent of out-of-stocks (A decision to substitute or not is depend-
ent on the total number of substitutions that a consumer will need to makein a particular shopping trip.)
STUDY OBJECTIVES
Because there are so many variables, existing studies have had difficulty makingpredictions beyond the specific categories, outlets, situations or regions studied.While several existing published studies have been made available, there hasnever been a synthesis of this material.
Based on the issues discussed above, this study has three central objectives.Triangulate from a variety of studies to develop an overall range of the extent, rootcauses and consumer responses to out-of-stocks.Examine the out-of-stock issue from a global perspective analyzing differencesand similarities across national boundaries.Present and examine the differences in measurement of out-of-stocks when usingthe traditional audit method vs. estimates out-of-stocks from store scanner data.
The basic process used for the study followed five general steps. 1. Collect and review published and unpublished OOS studies worldwide.2. Collect and review related research on OOS from academic and applied
sources.3. Delineate findings from research.4. Isolate limiting factors.5. Synthesize findings and determine areas of consensus, trends, key findings.
More specifically, to develop this report, information was collected and synthe-sized from the following general sources:
B. METHODOLOGY AND
DESCRIPTION OF STUDIES
USED IN THIS STUDY

6 Retail Out-of-Stocks: A Worldwide Examination of Extent, Causes and Consumer Responses
✓ Previously published industry reports and studies of out-of-stocks. ✓ New data provided from two large-scale consumer studies conducted in
1999-2000 (one in U.S. and a second identical study conducted in 19countries outside of North America).
✓ New data provided from studies of three retailers’ scanner and inventorydata conducted in 1999-2001.
✓ New data provided from a series of traditional store audit studies conduct-ed in 1998-2000. (See Appendix A, Part 1.)
✓ Various academic articles published from 1962-2001 on out-of-stock stud-ies. (See Appendix A, Part 2.)
✓ Industry press and articles that addressed and/or reported on other out-of-stock studies. (See Appendix A, Part 1.)
The academic and industry studies provided background and theory regarding theway out-of-stocks has been measured, the likely consumer responses to out-of-stocks, and the value of addressing the issue at the retail level. The majority of theacademic studies focused on consumer responses and provided important theoret-ical and categorical approaches to examining consumer response data. The indus-try studies were examined to provide baselines for evaluating the information wewould then examine from the new studies. The review of the industry studies ledus to systematically arrange the information contained in all studies into the fol-lowing categories:
✓ Methodology.✓ Categories examined.✓ Extent of out-of-stocks found.✓ Consumer responses.✓ Root causes identified and assigned.✓ Efforts examined / suggested to address out-of-stocks, the costs and
returns.
The logic of the arrangement is straightforward. First the methodology wasreviewed to determine any likely limitations or concerns faced when examiningthe data from the study. This methodology also provided a way to categorize thestudies. Second, the categories examined were listed in order to make compar-isons among the studies that examined the same or similar categories. Consumerresponses to OOS situations tended to vary widely among categories, thus catego-ry identification is a key variable.
Following general categorization, examination of the extent of out-of-stocks in thereport was the logical place to begin, since it answers the question: “Is there aproblem?” After identifying the extent, the logical next question is: “Does theOOS matter?” This is answered by examining the consumers’ responses to OOSsituations. The search for the cause to the problem leads to the next question:

7Chapter 1: Introduction and Overview of Study
“Who is responsible for causing the problem?” This leads to the final questions:“Can and should it be fixed? If so, how?”
The above paragraph explains the general format for the presentation of the detailof the findings. Next came the examination by region in the world (four regions),by category and by methodology. Chapter 2 presents the findings from the studiesexamined for this report.


9Chapter 2: Overall Findings
Chapter 2: Overall Findings
Retail Out-of-Stocks:A Worldwide Examination of Extent, Causes and Consumer Responses
A. Extent of OOS1. What is an Out-of-Stock?2. Overall Extent of OOS Worldwide and by Region3. OOS Extent by Category4. Variation Rates by Time of Day and Day of Week5. Variation in OOS Rates by Promotion, Movement, and Duration of OOS6. Conclusions from Analysis of the Extent of OOS
B. Consumer Response to OOS Situations1. Consumer Response Types and Impact on Retailers and Manufacturers2. U.S. Consumer Study Summary Findings3. Consumer Responses Vary Across Categories4. Consumer Responses Vary by Region Country5. Worldwide Responses by Category6. Drawing Comparisons Across Countries7. Implications of the Worldwide Analysis8. Measuring Consumer Reactions with Item Velocity Monitoring9. Comparison of Consumer Responses with Previous OOS Studies10 Final Questions Regarding Consumer Responses to OOS Situations
C. Causes of OOS1. OOS Causes by Region2. Examination of Primary Root Causes by Process3. Other Explanations and Attributions of OOS4. Determining Root Causes of Retail Chain Characteristics
D. The Financial and Managerial Implications of OOS1. Defining the Implications of OOS2. Quantifying the Losses due to OOS3. Reported Costs of OOS4. OOS Fixes and Implications5. Examples of New, Best of Breed Scenarios6. Conclusion

10 Retail Out-of-Stocks: A Worldwide Examination of Extent, Causes and Consumer Responses
Overall Findings
A. WHAT IS THE EXTENT OF OOS?After examining 40 studies analysts found that the average OOS rate worldwide is8.3 percent. While this is the average, the extent reported in each study variednot only by differing management practices, but also by what is measured. Thus,this section presents an examination of the extent or scope of out-of-stocks basedon several sub-analyses. These include:
✔ What is the definition of an out-of-stock, and how is it measured and cal-culated?
✔ What is the overall extent of OOS?✔ How does this vary by
• Region• Category• Time of day / day of week • Promotion • Product movement• Brand• Duration?
✔ What is an acceptable level of OOS?
The definition of what makes an OOS affects the extent that gets reported in stud-ies. While many variations exist, recent studies tend to settle on a consumer-baseddefinition. Even with agreement to use a consumer perspective, two general alter-native definitions emerge based on the method of measurement.
As the first and most accepted approach, the OOS rate is measured as a percent-age of SKUs that are out-of-stock on the retail store shelf at a particular momentin time (i.e., the consumer expects to find the item but it is not available). In gen-eral, studies using this approach begin with the selection of one or more cate-gories to examine. Next, a sample of stores from a single retail chain is selected,and a series of physical audits is conducted at the retailer at specific times duringthe day over a specified period of time. For each category, the OOS rate is calcu-lated as the average percentage of the SKUs not in stock at the time of the audits.
Normally, the OOS rate is reported for each category individually and then thecategories are averaged (normally unweighted average) to create and report anoverall rate for the study. Due to the number of studies that have used thisapproach, a major advantage of using this method is the availability of excellentbaselines. The limitations to this type of measurement include the:
✔ Arbitrary nature of selection of the categories.✔ Frequency and timing of the audits.✔ Duration of the study.✔ Human error that can and does enter from many sources.
ChapterTwo
1. WHAT IS AN OUT-OF-STOCK

11Chapter 2: Overall Findings
A second and alternative consumer-based definition of an OOS is the number oftimes a consumer looks for the SKU and does not find it. The percentage rate is cal-culated as the number of times the consumer does not find the SKU divided into thesum of the times the consumer does find the SKU plus the number of times the con-sumer does not find it. Instead of relying on physical audits, the second approach ismeasured through the use of models that determine OOS rates from store scannerand inventory data. This view provides the advantage of determining the extent ofout of stocks that actually matter to the retailer and the upstream supply chain mem-bers. The major limitation of this method is that the OOS rates are estimates basedon historical sales patterns, and thus can only be calculated for SKUs that sell with aminimum frequency (thus cannot detect OOS for very slow moving products). Fewstudies have used this method, and therefore baselines do not readily exist. In thisreport, the data from three studies that used this method are provided.
Exhibit 4 below presents the worldwide averages. 2. OVERALL EXTENT OF
OOS WORLDWIDE AND
BY REGION
Ex
hib
it 4
World Average40 Studies
8.3Average
4.9 Low12.3
USA11 Studies
7.9
5.611.5
NW Europe13 Studies
7.2
4.211.5
SE Europe9 Studies
10.8
7.016.3
Other Regions7 Studies
8.2
3.39.8
High
0.0 3.0 6.0 9.0 12.0 15.0 18.0
Worldwide OOS Extent
Percent
12 Retail Out-of-Stocks: A Worldwide Examination of Extent, Causes and Consumer Responses
The average OOS rate for all 40 studies that reliably reported OOS extent was 8.3percent. The average of the reported highs in the studies was 12.3 percent, and theaverage of the lows was 4.9 percent. This is similar to, though slightly higher than,the primary U.S. benchmark developed in the 1996 Coca-Cola Research Councilsponsored study that was 8.2 percent, which was calculated as the simple averagerate of eight categories that ranged from 3.9 percent to 11.1 percent. The 2002GMA study reported an average OOS rate of 7.4 percent with DSD categories rang-ing from 3.2 percent (milk) to 11.2 percent (prepackaged bread).
Keep in mind that the 40 studies examined here used slightly different measurementmethods and different people, measured different categories, and examined differ-ent durations and different daily and weekly factors. All of these can affect themeasurement. However, when all of the various factors are considered together, theaverages regress to an uncanny similarity, and this provides a sense that the findingsare reliable in the aggregate, and the differences can easily be explained by vari-ances in categories, methods and regions.
For this study, Europe was split into its northern and western region (Norway, Denmark,Sweden, France, Belgium, Netherlands, Germany, Switzerland, Austria) and into itssouthern and eastern region (Portugal, Spain, Greece, Poland, Hungary, CzechRepublic, Slovakia). Countries within each of these two areas showed similarities inOOS rates, and differences between the two regions were substantial. NorthwestEurope showed the lowest OOS rates, while Southeast Europe showed the highest. The Northwest examination was limited due to a lack of detailed studies from the UK,and Finland. Summary extent numbers were reviewed from four additional studiesfrom the UK and the extents fell in line with those reported elsewhere in the region.Unfortunately, study analysts were unable to review the studies in detail and thus didnot include them in the calculations in this request.
OOS rates in other regions (South America and Asia) were lower in average,although the extents varied as much or more than other regions, and the small num-ber of studies does not provide a complete representation of these regions.
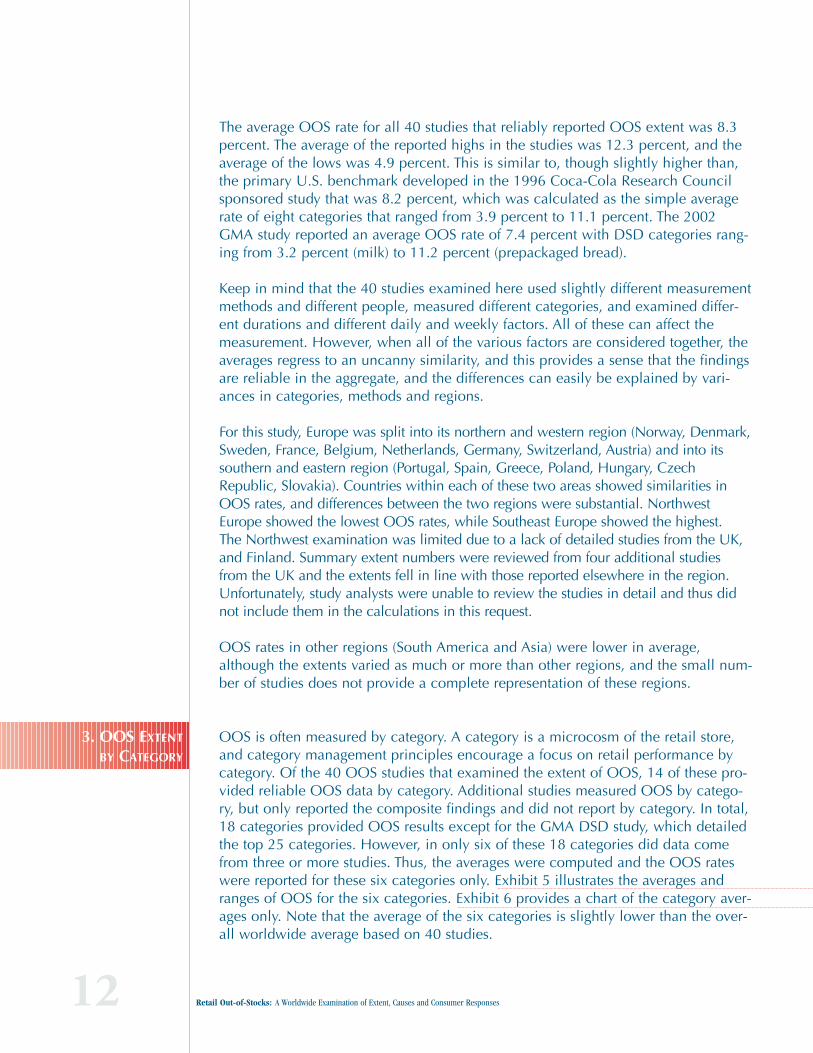
OOS is often measured by category. A category is a microcosm of the retail store,and category management principles encourage a focus on retail performance bycategory. Of the 40 OOS studies that examined the extent of OOS, 14 of these pro-vided reliable OOS data by category. Additional studies measured OOS by catego-ry, but only reported the composite findings and did not report by category. In total,18 categories provided OOS results except for the GMA DSD study, which detailedthe top 25 categories. However, in only six of these 18 categories did data comefrom three or more studies. Thus, the averages were computed and the OOS rateswere reported for these six categories only. Exhibit 5 illustrates the averages andranges of OOS for the six categories. Exhibit 6 provides a chart of the category aver-ages only. Note that the average of the six categories is slightly lower than the over-all worldwide average based on 40 studies.
3. OOS EXTENT
BY CATEGORY

13Chapter 2: Overall Findings
Ex
hib
it 5
Toilet Tissue3 Studies
6.6Average
6.1 Low7.1
Diapers6 Studies
7.0
1.912.0
Hair Care6 Studies
9.8
7.016.0
Laundry9 Studies
7.7
2.115.6
Salty Snacks5 Studies
5.3
1.48.0
Fem Hygiene4 Studies
6.8
1.910.2
World Average40 Studies
18 Categories
8.3
4.912.3
High
0.0 3.0 6.0 9.0 12.0 15.0 18.0
Out-of-Stock Extent by Category
Percent
Overall OOS Extent (Averages)
Ex
hib
it 6
Worldwide Avg18 Categories
8.3
Fem Hygiene 6.8
Salty Snacks 5.3
0.0 2.0 4.0 6.0 8.0 12.010.0
OOS Averages by Category
Percent
Toilet Tissue 6.6
Hair Care 9.8
Laundry 7.7
Diapers 7.0

14 Retail Out-of-Stocks: A Worldwide Examination of Extent, Causes and Consumer Responses
Thirteen studies measured and reported variations in OOS rates by time of dayand/or day of the week. In general, there are two clear conclusions. First, consis-tent across all studies are patterns that showed increases in OOS rates in the earlyevening hours as opposed to morning or early afternoon. The highest OOSoccurred in the evenings (after 8:00 p.m.), while the lowest were during the earlyafternoon. Morning rates were lower due to overnight restocking practices, slight-ly higher than those after noon, and lower than in the evenings. The conclusionfrom these findings is that ordering decisions and replenishment patterns as deter-mined by store management have an effect on OOS rates.
Second, consistent across all studies are weekly patterns where OOS rates roseand fell on different days of the week. The 2002 GMA DSD study, which meas-ured time-of-day and day-of-week stock-outs, also showed that same pattern,whether or not the retailer is directly responsible for keeping the shelves stocked.Exhibit 7 shows how the OOS rates vary during days of the week.
All of the studies that reported daily OOS rates showed the same general patternof decreasing rates throughout the week, but a large rate on Sunday (and theresulting carry-over to Monday). This pattern reflects both retail strategy and eco-nomic realities. Assuming the weekend to be the heaviest shopping days, re-order-ing and deliveries occur on Monday and Tuesday. Another reason that Mondayhas a high average is that in some countries stores are closed on Sunday andrestocking does not begin until Monday.
4. VARIATION IN OOSVARY BY TIME OF DAY
AND WEEK
Overall OOS Extent (Averages)E
xh
ibit 7
0.0 2.0 4.0 6.0 10.08.0 12.0
OOS by Day of Week
Percent
Sunday 10.9
Saturday 7.3
Friday 8.7
Thursday 9.1
Wednesday 9.8
Tuesday 10.0
Monday 10.9
(Average of 13 Studies)

15Chapter 2: Overall Findings
Throughout the week, restocking and preparations for the Saturday and Sundaypromotions lead to lower OOS rates. Saturday, despite being the heaviest shop-ping day, has the lowest OOS as retailers employ extra labor and can fill-in usingsafety stocks for promoted items. In countries where stores are open on Sundays,labor is normally at a lower level, and safety stocks for high demand items beginto be depleted. Thus, any incorrect demand estimation becomes manifested inOOS increases.
Promotional Effects.In general, the studies that reported OOS rates on promoted and non-promoteditems consistently showed OOS rates to be higher on the promoted items. Insome cases the differences were minor while in others the differences were sub-stantial. Although the promoted items should be receiving attention from theretail store management, all studies that report promotional effects find substan-tially greater OOS on promoted items than everyday items.
While the differences vary among studies, in general a 2:1 ratio of promoted vs.non-promoted OOS rates was found. Examples of this in publicly reported stud-ies include the ECR France study (where promoted items have a 75 percentgreater OOS rates the 1996 Coca Cola U.S. study (where OOS levels of promoteditems were approximately double of non-promoted items), and the 2002 GMADSD study (where OOS levels of promoted items were approximately double ofnon-promoted items). Several of the proprietary studies examined for this reportfound similar results.
One study found that the increase in the amount of discount offered by a promo-tion corresponded with the OOS rate. Another study highlighted a related prob-lem where promotional decisions (and the resulting last-minute advertisingchanges) based on responses to competitors led to increased OOS when the tim-ing of the changes were too late to be included in the normal order cycle.
Velocity of Product Movement.Somewhat overlapping with promoted items, studies that exclusively examinedfast-moving items found higher OOS rates (13 percent-15 percent) than those thatexamined entire categories that include both fast-moving and slow-moving items(8.3 percent average). This translates to a 50-80 percent higher OOS rate for fastmoving vs. all products. The GMA DSD study found that, on average, the top 10percent of the fastest moving items accounted for 45 percent of the out-of-stocks.The studies that examine the fast moving items used a different methodology(scanner data analysis vs. visual audits), and thus some of the difference could bedue to variances in measurement. However, it is clear that the faster-movingitems — promoted or not — have higher OOS rates than slower-moving items.
5. VARIATION BY
PROMOTION, MOVEMENT
AND DURATION OF OOS

16 Retail Out-of-Stocks: A Worldwide Examination of Extent, Causes and Consumer Responses
Product and Brand Effects on OOS Rates.The sparse brand-level data available for this analysis was not adequate to makesolid conclusions about specific brands within categories. However, it was clearthat the faster-moving items also had more incidences of OOS, although the dura-tion was not necessarily longer. Thus, in any category, the faster-moving SKUs aregoing to incur more frequent OOS, regardless of the brand. The implication ofthis – and the value of addressing the faster moving SKUs – is that the fastermovers suffer disproportionately more due to OOS than do slower-movers.
Duration of OOS. Data on duration of OOS, while sparse, is very interesting. Based on a study of13 stores in the U.S. by Data Ventures, a U.S. software service provider, the fol-lowing results were found. When products become OOS, only about 20 percentare replenished in less than eight hours while a similar percentage remain OOSfor more than three days. Duration is a critical though under-used measure for theextent of OOS. The traditional measure of OOS (the percentage of SKUs not onthe shelf at a particular point in time) does not provide the measure that is mostmeaningful from the perspective of the consumer. When the duration of the OOSitem is considered along with the extent, then a better picture for managerialaction emerges.
All of the above issues (promotion effects, velocity and duration) indicate that bothretail store management systems and practices contribute to OOS extents. Whilethis will be discussed in more detail with the other implications, it is important tonote that there are two ways to address the higher OOS rates on faster-moving prod-ucts. First, retailers can pay more attention to high velocity products to ensure thatthey get reordered and restocked more frequently. Second, following category man-agement principles, retailers can examine a category and eliminate some slower-movers and allocate more shelf space to faster-movers. According to Broniarczyk etal.’s category management research (1998, Journal of Marketing Research, Vol. 35,pp. 166-176) sales and customer satisfaction for the category increases following areduction in SKUs from a category review. E
xh
ibit 8
Duration of OOS
3 Days or More 19%
1 Day to <3 Days 36%
8 Hours or Less 20%
8 Hours to <1 Day 25%

17Chapter 2: Overall Findings
Why Does 8 Percent Keep Coming Up as the Extent of OOS? Is This the“Natural” OOS Level?Given that so many variables can affect the measurement of OOS, in a study like thisthat averages the results across 40 studies, finding a number that is somewhat “typical”provides evidence that the number is reliable. Given the confidence we can havewith this number, a reasonable hypothesis is that the 8 percent OOS rate may simplybe the “natural” average for retailers engaged in the sales of fast moving packagedconsumer goods given current methods and technologies in industry retailing.
What is clear from this study is that some retailers have found ways to consistentlybeat this benchmark, while others struggle with rates that are consistently higher.Thus, even if 8 percent is a typical rate, it is not necessarily an acceptable rate.The determination of an “acceptable rate” depends on the extent of the impact of alower rate on retailer profitability.
On the expense side, obtaining a lower rate may require additional investments ininventory systems, labor training and management processes. Logically, one wouldexpect a lower rate to translate into greater sales and customer loyalty. From the per-spective offered by this study, it is apparent that enhancements to the supply chainthrough ECR and other industry initiatives have created an environment in whichretailers and their supply chain partners can begin to address OOS rates. Full atten-tion specifically to OOS management has only become a focal issue for global ECRorganizations and for industry leaders and associations in the United States in the lasttwo or three years. Industry thought leaders contend that retailers that do not addressOOS levels will find themselves at a competitive disadvantage to those retailers thatdo. Further they believe that, due to the introductions of new technologies andmethods, that OOS levels will decrease over the next three years and that follow-upstudies will show average rates in the vicinity of 5-6 percent. If and when this newlevel becomes the expectation for consumers, this will create huge implications forbuying behavior and store loyalty.
Do Higher Inventory Levels / Safety Stocks Correspond with Lower OOS Rates?Despite the intuitive appeal that higher inventory levels should correspond withlower OOS rates, this study did not find this to be the case. The term safety stocksdescribes the level of goods kept on hand to prevent OOS. However, in the fewstudies examined for this analysis that provided data of both inventory levels andOOS rates, store inventory levels (not on the shelf) positively correlated with OOSrates. Excessive backroom inventory seemed to impede the ability of retailers torestock shelves quickly. Thus, safety stocks may indicate the presence of less effec-tive in-store inventory management and ordering systems.
Increased safety stocks within the store can reduce the need for ordering frequencyand accuracy. In this case, retailers rely on their own systems that — inside the back-room of the store — are relatively unsophisticated when compared with distributioncenter inventory management systems and practices. While there may need to besome backroom stock for very fast moving and promoted items, this analysis leads one
6. CONCLUSIONS FROM
THE ANALYSIS OF THE
EXTENT OF OUT-OF-STOCKS

18 Retail Out-of-Stocks: A Worldwide Examination of Extent, Causes and Consumer Responses
to conclude that reliable store processes, improved ordering systems and a responsivesupply chain — rather than higher safety stocks — correspond with lower OOS rates.
B. CONSUMER RESPONSE TO OOS SITUATIONS
Although academic research has identified and categorized up to 15 possible con-sumer responses to an OOS, typically, managerial researchers measure five pri-mary responses that consumers will make when they encounter an out-of-stock foran SKU that they had intended to purchase. These are:
1. Buy item at another store (store switch).2. Delay purchase (buy later at the same store).3. Substitute – same brand (for a different size or type).4. Substitute – different brand (brand switch).5. Do not purchase the item (lost sale).
All five of the responses include negative consequences and result in direct and/orindirect losses to both retailers and manufacturers. However, some actions placegreater direct losses on either the retailer or the manufacturer.
Direct LossesFirst, the retailer faces a direct loss of the potential sale when a consumer faces anout-of-stock because the shopper purchases the item at another store or does notpurchase it at all. Similarly, the manufacturer faces a direct loss of the potential salewhen a consumer faces an out-of-stock because the shopper substitutes anotherbrand or does not purchase the item at all. Additionally, when a substitution ismade, the retailer also loses an additional portion of the potential sale because theshopper tends to switch to smaller and/or cheaper substitutes.
Data examined from the studies conducted by Data Ventures shows that con-sumers are risk averse when making substitutions and, therefore, more commonlysubstitute a smaller and/or cheaper item. The following table (Exhibit 9) demon-strates the losses to the manufacturer and to the retailer for each consumer action.
Ex
hib
it 9Who Bears the Direct Loss For Consumer Reactions to an OOS
Consumer Response ManufacturerRetailer
1. Buy Item at Another Store
2. Delay Purchase
3. Substitute – Same Brand
4. Substitute – Different Brand
5. Do not Purchase the Item
No
No (But negatively affectscash flow and exaggeratesdemand fluctuation.)No (But there is partial losswhen consumer substitutionis smaller or cheaper.)Yes (Most problematic of allfive options to the manufac-turer.)Yes
Yes (Most problematic of allfive options to the retailer.)No (But negatively affectscash flow and inventoryturns.)No (But there is partial losswhen consumer substitutionis smaller or cheaper.)No (But there is partial losswhen consumer substitutionis smaller or cheaper.)Yes.
1. CONSUMER RESPONSE
TYPES AND IMPACT ON
RETAILERS AND
MANUFACTURERS

19Chapter 2: Overall Findings
Indirect LossesIn addition to the direct losses, both the retailer and the manufacturer incur addi-tional indirect losses due to decreased customer satisfaction that results in lessoverall reliance on the particular retailers and brands. When an OOS leads to pur-chase at another store, this provides the consumer an opportunity to try a differentstore. Consumer behavior theory argues that trial precedes adoption, and, thus,an OOS sets the stage for possible permanent store switching. (This topic is treat-ed in more detail later in this section.) When an OOS leads to purchase of acompeting brand, the consumer trial can lead to possible permanent brandswitching as well.
A second key source of indirect losses comes in the form of supply chain ineffi-ciencies. Consumer switching of brands, sizes and stores as well as delays of pur-chases provides an inaccurate picture to managers, who seek to have the supplychain deliver accurate levels and mixes of products to retail shelves. Systemsdynamics research has shown that inaccurate signals from the retailer becomeamplified up the supply chain. Indirect losses are demonstrated in Exhibit 10.
Finally, it is important to consider that the overall willingness of a consumer topurchase from another store as opposed to switching an item or brand at the storeis related to the overall number of out-of-stocks that the shopper encounters dur-ing the shopping trip. When consumers only find one item out-of-stock, they willbe more likely to delay or substitute. If, however, there are multiple items that theshopper cannot obtain, the odds of going to another store increases. Similarly, theoverall willingness of a consumer to entirely switch stores is dependent upon thecumulative number of times the consumer encounters an out-of-stock at the samestore. (This is addressed at the end of this section.)
As mentioned in the methodology section, this report presents the results fromtwo major consumer studies – one in the U.S. and the other conducted in 16countries outside the U.S. This section reviews the summary findings from the
Exhi
bit
10Indirect Loss Due to OOS
When Consumers• Switch Stores• Delay Purchases • Substitute Sizes• Substitute Brands• Don’t Purchase Intended Items
Inaccurate Picture to the Supply Chain of • Product Mix• Product Levels• Product Flow
This Sends
2. U.S. CONSUMER STUDY
SUMMARY FINDINGS

20 Retail Out-of-Stocks: A Worldwide Examination of Extent, Causes and Consumer Responses
U.S. study, and a section that examines the U.S. findings by category will follow.Using this as a benchmark, the findings from the study outside the U.S. are dis-cussed and compared.
Using the five general responses above, in the U.S. consumer study, 11 consumerpackaged goods were examined. The results reported in the chart below (Exhibit 11)represent the average responses across the 11 categories. The survey consisted ofinterviews with a minimum of 360 primary grocery shoppers in each of the 64 IRImarkets that together comprise the continental U.S.. Thus, the total sample is inexcess of 23,000 consumers.
First, based on the above chart, the retailer faces an average direct loss of 4 3per-cent of the potential sale when a consumer faces an out-of-stock because theshopper purchases the item at another store (32 percent) or does not purchase it atall (11 percent). Similarly, the manufacturer faces a direct loss of 31 percent of thepotential sales when a consumer faces an out-of-stock because the shopper substi-tutes another brand (20 percent) or does not purchase the item at all (11 percent).However, when a substitution is made, the retailer also loses an additional portionof the potential sales because the shopper tends to switch to smaller and/orcheaper substitutes. Previous research has demonstrated that consumers are risk-averse when making substitutions and, therefore, more commonly substitute asmaller and/or cheaper item.
While overall consumer responses are important as a benchmark, consumerresponses vary significantly by category. The following bar chart shows how con-sumer responses differ across 11 product categories (U.S. study only). Analysis ofthe mix reveals three general groups or clusters among eight of the categories:
Exhib
it 11
Consumer Response: Average Percentage Across11 Categories (U.S. Only)
Substitute — Different Brand 20%
Do Not Purchase Item 11%
Buy Item at Another Store 32%
Substitute — Same Brand 20%
Delay Purchase 17%
3. CONSUMER RESPONSES
VARY ACROSS CATEGORIES

21Chapter 2: Overall Findings
Toilet tissue and paper towels show high levels of substitution (Fifty percent ofconsumers will substitute within or between brands in the category.) and a corre-sponding low willingness to purchase the product at another store. Feminine hygiene and diapers show very high levels of store-switching and low-levels of delay in purchase.Four categories (toothpaste, pet food, laundry and shampoo/hair care) all havesimilar response patterns that reflect the overall averages.
For the remaining three categories no clear pattern emerges. Both cosmetics andcoffee show low levels of substitution and a correspondingly higher willingness todelay the purchase or to not purchase the product at all. The salted snacks catego-ry has the highest level of consumers not buying the item at all, resulting in low-ered consumption.
Exhibit 12
Similar to the U.S. consumer study, a worldwide study of more than 48,000 con-sumers was conducted in a series of 28 studies across 19 countries. The methodand questions were as similar as possible to those used in the U.S. study. A varietyof categories was examined in each of the countries.
For eight of the 11 categories examined in the U.S. study, data were also obtainedon the same categories from four or more other countries. This allowed for com-posite comparisons for these eight categories (all of the categories illustrated in
Ex
hib
it 1
20% 20% 40% 60% 80% 100%
Consumer Responses Across 11 Categories
Cosmetics 43
Salted Snacks 21Paper Towels 21Toilet Tissue 24
Coffee 29Laundry 32
Shampoo 32Toothpaste 35
Pet Food 35
Fem Hygiene 38Diapers 41
22
91719
2119
211721
1111
12
2018
2513
201922
20
2620
8
2532
2420
20181716
1921
15
25128
179
1098
67
Do not Purchase Item
Buy Item at Another Store
Delay Purchase
Substitute — Same Brand
Substitute — Different Brand
(U.S. Study)
4. CONSUMER RESPONSES
VARY BY REGION
AND COUNTRY

22 Retail Out-of-Stocks: A Worldwide Examination of Extent, Causes and Consumer Responses
Exhibit 12 excluding cosmetics, toothpaste, and coffee). The results of this analysisare presented in the comparative bar chart and table below (Exhibits 13 and 14).
In the aggregate, delay of purchase and not purchasing at all are reasonably simi-lar worldwide. The major overall difference between U.S. and European con-sumers is the lower willingness of U.S. consumers to switch brands. European
Ex
hib
it 13
0% 20% 40% 60% 80% 100%
Average Consumer Responses by Region
U.S. 31
World Average 31
Other Regions 34Europe 27
16
15
1317
21
19
2016
22
26
2532
11
9
89
Comparisons Across Eight Common Categories
Ex
hib
it 14
Table of Average Consumer Responses by Region
WorldAverage U.S. Europe
OtherRegions
DifferenceU.S. vs.Europe
DifferenceU.S. vs.Other
Regions
DifferenceEurope vs.
OtherRegions
Bought at Another StoreDelay PurchaseSubstitute
– Same BrandSubstitute
– Different BrandDo Not Purchase Item
Comparisons Across Eight Common Categories
31 31 27 34 +4 -3 -715 15 17 13 -2 +2 +4
19 21 16 20 +5 +1 -4
26 22 32 25 -10 -3 79 11 9 8 +2 +3 +1
Do not Purchase Item
Buy Item at Another Store
Delay Purchase
Substitute — Same Brand
Substitute — Different Brand

23Chapter 2: Overall Findings
consumers are almost 50 percent more likely to switch to a competing brandwhen faced with an OOS on the desired item.
Alternatively, U.S. consumers are more likely to substitute a different package sizeor variation within their preferred brand. Thus, in the aggregate, U.S. consumersact in a more brand-loyal manner than do consumers outside the U.S.. U.S. con-sumers may be influenced by having more availability of same-brand SKUs. Storeswitching is greatest outside the U.S. and Europe. Europeans are the least likelyto switch stores due to OOS.
Just as the U.S. study showed that broad differences exist among consumer respons-es by categories, similar differences occur worldwide. The next question is whetherthere tend to be greater differences among countries or among categories.
Exhibit 15 presents the data by category, showing the worldwide average for eachof the categories examined in the study. This provides a benchmark for compar-ing the individual country responses.
Eight additional graphs are presented in Appendix C. These show how consumerresponses vary among countries for each category.
To a large degree, the aggregate responses by category have similarities acrosscountries, suggesting some universal consumer responses based on the category.For example, despite the variance among countries, notice the overall large will-
Ex
hib
it 1
50% 20% 40% 60% 80% 100%
Average Worldwide Consumer Responses by Category
Feminine Hygiene 40
Paper Towels 13Salted Snacks 15
Toilet Tissue 18Laundry 26
Shampoo/Hair Care 32
Toothpaste 37Diapers 39
13
1910
1920
16
1617
17
1921
241615
1614
25
3738283130
2420
5
12161177
710
5. WORLDWIDE RESPONSES
BY CATEGORY
Do not Purchase Item
Buy Item at Another Store
Delay Purchase
Substitute — Same Brand
Substitute — Different Brand

24 Retail Out-of-Stocks: A Worldwide Examination of Extent, Causes and Consumer Responses
ingness to switch stores for feminine hygiene and diaper categories and the corre-spondingly low willingness for salted snacks and paper towel categories.
Aggregate Comparisons Using Equivalent Categories.In order to compare aggregate consumer responses to OOS by country, equivalentcategories must be used. While the eight charts in Appendix C show the resultsfrom each national study for eight categories, data for four categories(shampoo/hair care, feminine hygiene, laundry, and salted snacks) are providedfor six countries. This comparison is shown below in Exhibit 16.
The results of the analysis show that behavior varies substantially among the sixcountries. Overall switching behavior is greatest in Mexico and Greece, andBelgium has the highest overall substitution of other brands. Obtaining the desireditem at another store is lowest in Belgium and Mexico. Overall, both Belgium andMexico show lower levels of brand loyalty with corresponding higher levels ofstore loyalty. Canada has the highest level of obtaining the item at an alternativeoutlet.
For detailed information on consumer responses for each country for these fourcategories, as well as for four additional categories, see Appendix C.
Ex
hib
it 16
0% 20% 40% 60% 80% 100%
Average Consumer Responses Across Four Categories
Canada 35
MexicoBelgium 24
24
UK 29
U.S. 31Greece 32
18
1221
17
1511
12
221315
2123
22
263326
2128
13
169
13
126
6. DRAWING
COMPARISONS ACROSS
COUNTRIES
Do not Purchase Item
Buy Item at Another Store
Delay Purchase
Substitute — Same Brand
Substitute — Different Brand

25Chapter 2: Overall Findings
An additional analysis using the worldwide consumer response data by categorydata provides perspective on which party — the retailer or the manufacturer — isat the most risk for a particular category.
For this analysis, the immediate direct store loss (consumers that switched storesplus consumers that did not purchase) is compared with the direct brand or manu-facturer loss (consumers that substituted brands plus consumers that did not pur-chase). Thus, if consumers either delayed their purchase or substituted for the samebrand, we assume that neither the retailer nor the manufacturer sustained a loss.
Exhibit 17 shows that the categories of greatest loss to the retailers (e.g., diapers,feminine hygiene, and toothpaste) have the least effect on the manufacturer, whilecategories of greater loss to the manufacturer (toilet tissue and paper towels) havethe least impact on the retailer.
This situation poses a conflict when manufacturer and retailer trading partners toaddress out-of-stock issues. Based on this analysis, addressing the shampoo/haircare category would have the most mutual interest. It is important to note that the
Ex
hib
it 1
7Diapers 30
Manufacturer Loss49
Fem Hygiene 3045
Toothpaste 3144
Shampoo/Hair Care 3739
Laundry 3833
Salted Snacks 5431
Toilet Tissue 3929
Paper Towels 4925
Retailer Loss
0% 20% 40% 60% 80% 100%
Retailer vs. Manufacturer Loss by Category
7. IMPLICATIONS OF THE
WORLDWIDE ANALYSIS
26 Retail Out-of-Stocks: A Worldwide Examination of Extent, Causes and Consumer Responses
above analysis shows differing “loyalty connections” to categories. Thus, for theretailer, it is critical to address categories where the brand loyalty is strong becausethat is where the greatest immediate loss (in terms of lost sales) and long-term loss(in terms of lost customers who find the brand they want at another store) rest.
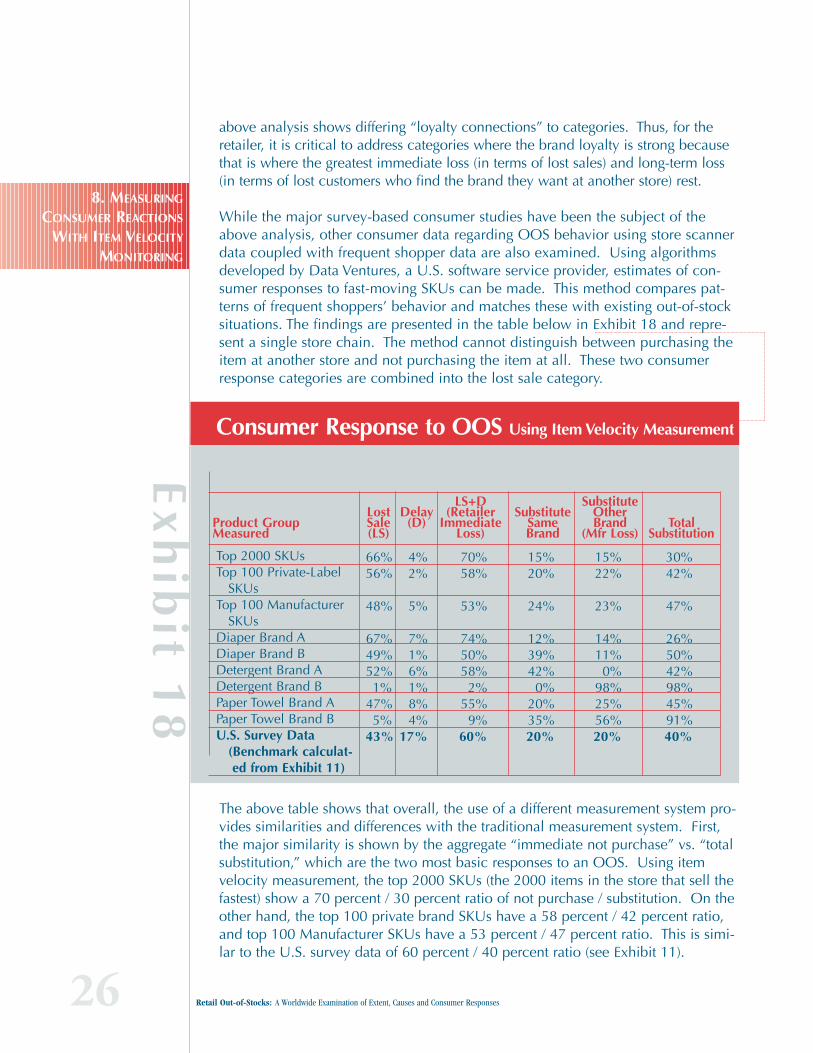
While the major survey-based consumer studies have been the subject of theabove analysis, other consumer data regarding OOS behavior using store scannerdata coupled with frequent shopper data are also examined. Using algorithmsdeveloped by Data Ventures, a U.S. software service provider, estimates of con-sumer responses to fast-moving SKUs can be made. This method compares pat-terns of frequent shoppers’ behavior and matches these with existing out-of-stocksituations. The findings are presented in the table below in Exhibit 18 and repre-sent a single store chain. The method cannot distinguish between purchasing theitem at another store and not purchasing the item at all. These two consumerresponse categories are combined into the lost sale category.
The above table shows that overall, the use of a different measurement system pro-vides similarities and differences with the traditional measurement system. First,the major similarity is shown by the aggregate “immediate not purchase” vs. “totalsubstitution,” which are the two most basic responses to an OOS. Using itemvelocity measurement, the top 2000 SKUs (the 2000 items in the store that sell thefastest) show a 70 percent / 30 percent ratio of not purchase / substitution. On theother hand, the top 100 private brand SKUs have a 58 percent / 42 percent ratio,and top 100 Manufacturer SKUs have a 53 percent / 47 percent ratio. This is simi-lar to the U.S. survey data of 60 percent / 40 percent ratio (see Exhibit 11).
Ex
hib
it 18
Consumer Response to OOS Using Item Velocity Measurement
LostSale(LS)
Product GroupMeasured
Delay(D)
LS+D(Retailer
ImmediateLoss)
SubstituteSameBrand
SubstituteOtherBrand
(Mfr Loss)Total
Substitution
Top 2000 SKUsTop 100 Private-Label
SKUsTop 100 Manufacturer
SKUsDiaper Brand ADiaper Brand BDetergent Brand ADetergent Brand BPaper Towel Brand APaper Towel Brand BU.S. Survey Data
(Benchmark calculat-ed from Exhibit 11)
66% 4% 70% 15% 15% 30%56% 2% 58% 20% 22% 42%
48% 5% 53% 24% 23% 47%
67% 7% 74% 12% 14% 26%49% 1% 50% 39% 11% 50%52% 6% 58% 42% 0% 42%1% 1% 2% 0% 98% 98%
47% 8% 55% 20% 25% 45%5% 4% 9% 35% 56% 91%
43% 17% 60% 20% 20% 40%
8. MEASURING
CONSUMER REACTIONS
WITH ITEM VELOCITY
MONITORING

27Chapter 2: Overall Findings
Second, the above table shows large differences among categories, although only indi-vidual brands within categories are provided here. What it also shows — what theother surveys studied for this report do not reveal — was the extreme differences amongitems within a category. Some brands show considerably more loyalty than others.
It is also worthwhile to note the large number of lost sales for the top 100 privatelabel SKUs. This may be due to the economic ability of the consumer of private labelproducts. Since substitution from a private label would generally require a higher-priced branded product, these consumers may be unable to substitute effectively dueto economic constraints. This also adds to the urgency for retailers to address OOS,since private-label products often carry larger retail margins than branded products.
The differences between the Data Ventures measurement system and traditionalsurvey methods provide both advantages and disadvantages. A disadvantage sincethe Data Ventures method can only measure items that sell regularly, it is mainlyeffective at measuring OOS of the fast-moving products in a category. However,these are the items of most interest to managers when addressing OOS situations.As a key advantage, this method can provide more precise data on consumer sub-stitution. It can show whether the substituted item is larger or smaller, more or lessexpensive, and the same or a competing brand.
Several previous studies have examined consumer responses of OOS situations. Interms of total sample size, the survey presented here represents the largest numberof consumers ever examined and provides key insights as to how consumer behav-ior varies both across countries and across categories.
As a summary comparison, Exhibit 19 shows how the findings from this study com-pare with data previously presented in other studies. Since not all studies reportedthe same five categories of consumer responses, data are combined into the twooverall categories, following the two highlighted categories in Exhibit 18, “RetailerImmediate Loss” and “Total Substitution.”E
xh
ibit
19
Comparison of Overall Consumer Responses WithPrevious Studies
Study:Retailer
ImmediateLoss
TotalSubstitution
U.S. Data, 11 categories (from Exhibit 11) 60 40Worldwide Data, 8 categories (from Exhibit 12) 55 45
Schary and Christopher, 1979, UK 78 22Data Ventures top 2000 SKUs, 1999, U.S. 70 30Campo, et al., 2000, Belgium (Two categories) 45 55A.C. Nielsen, 1962, U.S. 42 58Coca-Cola Retailing Research Council, 1996, U.S. 40 60GMA DSD, 2002, U.S. 40 60National Association of Convenience Stores, 1998, U.S. 29 71
9. COMPARISON OF
CONSUMER RESPONSES
WITH PREVIOUS
OOS STUDIES

28 Retail Out-of-Stocks: A Worldwide Examination of Extent, Causes and Consumer Responses
Much of the differences among studies can be attributed to the methods used tocollect the data and the categories examined. However, all studies show that bothmanufacturers and retailers incur losses when consumers face OOS situations.
This study did not directly address several key questions concerning consumerresponses to OOS situations. However, through the data obtained for this studyalong with the insight provided by previous studies we examined, we are able tooffer some insight to these questions.
Why Consumers Take One Action Over Another when Encountering an OOS? Several factors affect the consumer response to OOS items. Traditionally thesehave been categorized based on the nature of the category, type of product, typeof consumer, the immediacy of need, and the general brand loyalty. However, allof these factors interact, making it difficult to develop a generalized scheme todetermine the likelihood of a consumer’s reaction.
To present a generalized approach, similarities in multiple academic consumerresearch studies that have examined this issue were found. All suggest that threeprimary drivers interact and cause the consumer to take one action over another.Using economic theory, Campo, Gijsbrechts and Nisol (2000) present the opportu-nity cost of not being able to consume the product immediately, the substitutioncost of decreased use of a less-preferred alternative, and the transactions cost of thetime and effort required to obtain the preferred item. Using the Campo, et al. termi-nology, Exhibit 20 was constructed to show how the levels of each of the three costcomponents interact to explain a consumer’s likely response to an OOS situation.
When the opportunity cost of not being able to immediately consume the productis high (for example, when one runs out of diapers), the consumer will either sub-stitute or find the item at another store. Alternatively, a low opportunity cost willlead to either purchase delay or cancellation. When the substitution cost of usinga less-preferred brand is high (for example, in the case of feminine hygiene andlaundry), the consumer will take any action except to substitute another brand.
Exhibit 20Consumer Cost Components and OOS Behavior
When theOpportunity Cost Is . . .
And theSubstitution Cost Is . . .
And the TransactionCost Is . . .
Then the Consumer Will . . .
High High Low Buy Item at Another StoreLow High Low Delay PurchaseHigh High High Substitute – Same BrandHigh Low High Substitute – Another BrandLow High High Not Purchase Item
10. FINAL QUESTIONS
REGARDING CONSUMER
RESPONSES TO
OOS SITUATIONS
29Chapter 2: Overall Findings
When the transactions cost is high (the time and effort to purchase later or else-where), the consumer will either substitute or cancel purchase outright.
Each individual cost component is limited in its ability to explain the consumerresponse. However, Exhibit 20 shows how the different reactions can be explainedby the interaction of the three components. This perspective demonstrates whensome categories are more difficult to switch than others. For example, we foundthat feminine hygiene showed low substitution rates. Since these are very personalproducts, there is a high substitution cost. However, when the brand is less personal(e.g., paper towels), more substitution between brands may occur.
When and How Generic Demand/Consumption is Affected by OOS? The way to view the effect of OOS on aggregate consumer demand is to examinethe consumers’ willingness to cancel purchases. Thus, the salted snack categoryexperiences lowered demand in an OOS situation, while categories like femininehygiene, diapers, toilet tissue, etc., are influenced mainly by primary consumerneed. Most of the categories we examined in this study had very low scores for“did not buy item.” In each of these cases, consumers have little choice in theamount they consume, and an OOS may affect the timing of their purchases, butit will not affect the use of the product.
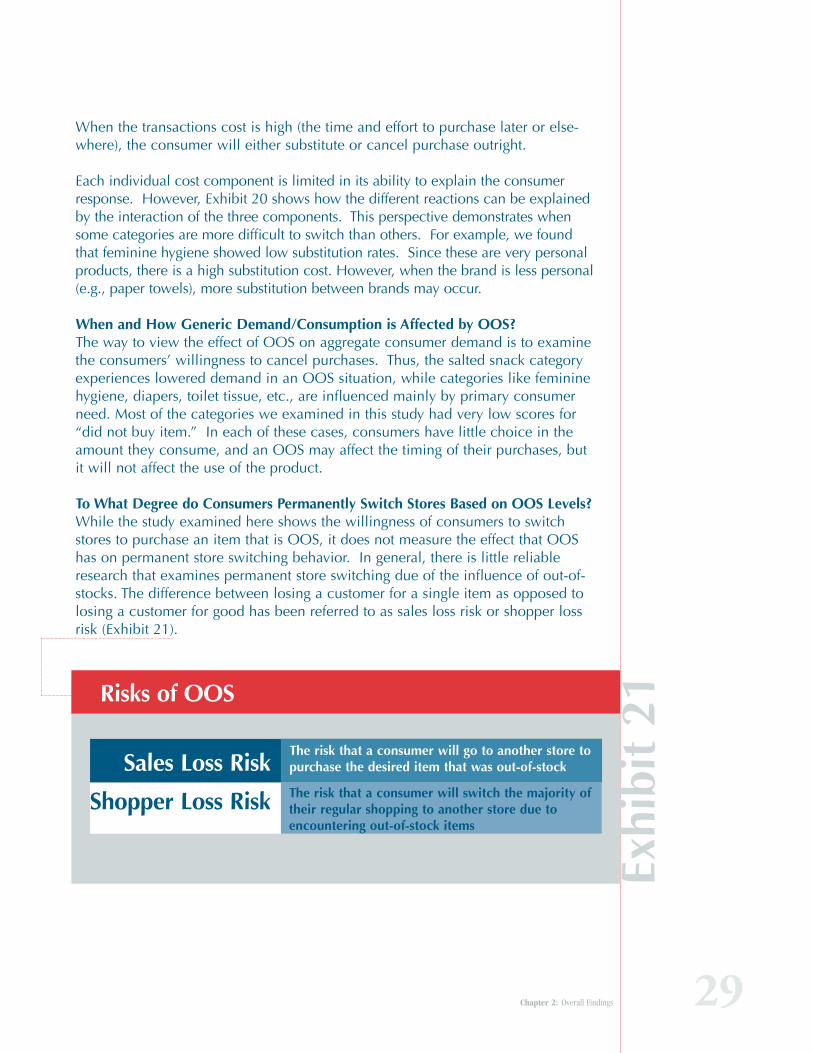
To What Degree do Consumers Permanently Switch Stores Based on OOS Levels?While the study examined here shows the willingness of consumers to switchstores to purchase an item that is OOS, it does not measure the effect that OOShas on permanent store switching behavior. In general, there is little reliableresearch that examines permanent store switching due of the influence of out-of-stocks. The difference between losing a customer for a single item as opposed tolosing a customer for good has been referred to as sales loss risk or shopper lossrisk (Exhibit 21).
Exhi
bit
21
Sales Loss Risk
Shopper Loss Risk
The risk that a consumer will go to another store topurchase the desired item that was out-of-stock
The risk that a consumer will switch the majority oftheir regular shopping to another store due toencountering out-of-stock items
Risks of OOS

30 Retail Out-of-Stocks: A Worldwide Examination of Extent, Causes and Consumer Responses
One study that did directly examine this issue is the National Association ofConvenience Stores study (1999, U.S.). This study found that categories with high-er planned purchases face higher shopper loss risk due to OOS, while those withlower planned purchases face only sales loss risk. The study reported that when aconsumer faces an OOS in a planned purchase category, the shopper will perma-nently switch stores after an average 2.4 such experiences. Because the retailersmeasured for the study were convenience stores (and an OOS in a planned pur-chase is the opposite of convenience), we would expect permanent store switch-ing is expected to be higher for this channel than for other retail channels (e.g.,mass, drug, grocery).
One of the proprietary studies that was examined for this report tracked customerbehavior for repetitive OOS. Findings in this study say that consumers wouldreduce their substitution as they encountered repetitive OOS situations (as illus-trated in Exhibit 22). While this does not directly measure permanent store switch-ing, it does indicate that consumers will increasingly fill their needs at other storeswhen presented with consistent OOS situations.
Thus, permanent store switching is a function of three interrelated factors: ✓ The total number of planned purchase items that are OOS during a single
store visit. ✓ The frequency with which the consumer experiences OOS (percentage of
visits that the consumer is disappointed).✓ The importance of the product to the consumer.
Overall, consumers will — all other factors being equal — go to the store thathas fewer out-of-stocks of their desired products. A store that continually disap-points its customers will lose those customers to stores that provide more satis-fying experiences.
Exhibit 22
80%
Response to Repetitive Out-of-Stocks
1st Time70%30%
3rd Time30%70%
SubstituteNot buy
2nd Time50%50%
70%
60%
50%
40%
30%
20%

31Chapter 2: Overall Findings
In OOS Situations Where the Consumer Substitutes, is the Tendency to “Buy-Down” in Terms of Price and/or Size as Opposed to “Buying Up”?Previous OOS studies note that when confronted with an OOS on the desiredbrand, if both a larger and a smaller size of the same brand are available, the ten-dency is to select the smaller size.
When another brand is substituted, the tendency is to select a cheaper substitute.The analysis by Data Ventures examined for this study confirms this notion. Thisgeneral tendency is consistent with a general risk-averse tendency of the con-sumer. Smaller and/or cheaper lowers the economic and total usage risk of anunknown substitute.
C. CAUSES OF OOSFrom the many studies we examined, we found that both the range of causes aswell as the appropriation of causes varies significantly. This makes finding a reliableconsensus somewhat challenging. However, several commonalties emerged whichallowed us to draw several conclusions as well as make additional observations.
Previous studies have placed most of the responsibility for OOS on retailer storeordering and forecasting practices. Retailer store managers must simultaneouslymanage thoU.S.nds of SKUs and work with hundreds (often thoU.S.nds) of simul-taneously promoted items (which cause demand to fluctuate), while keeping per-sonnel costs in reason. Furthermore, retailers face complementary issues such asshrinkage that becomes more difficult to control as inventories increase. Thus it isnot surprising to see a strong linkage of OOS with store ordering practices.However, the story is more complex.
As shown in Exhibit 23, between two-thirds and three-fourths of OOS are causedin the store, while one-fourth to one-third are due to upstream causes at the distri-
Exh
ibit
23Summary of Findings of OOS Causes
Store Ordering 34%
Store Forecasting 13%
Store Shelving 25%
Retail HQ or Manufacturer 14%
Distribution Center 10%
Other Cause 4%
Worldwide Average

32 Retail Out-of-Stocks: A Worldwide Examination of Extent, Causes and Consumer Responses
bution center or headquarter level. If the causes are sliced by retail processes,almost half of the assigned OOS cause is related to ordering problems (i.e., retail-ers ordering too late or in insufficient quantities) often because they have inaccu-rate or unreliable forecasts. This is particularly the situation in the U.S.
To the surprise of some study analysts, about a third of the causes can be attrib-uted to replenishment problems, predominantly having the product in-store butnot getting it onto the shelves. Additional replenishment problems concern thematerial flow from warehouse to the store. Finally, one-fifth of the causes are dueto planning decisions and management problems, which include inadequateshelf-space allocation, low planogram compliance and lack of communicationbetween the retailer warehouse and headquarters. Thus, while the retailer isdirectly linked to the OOS (for example, through insufficient ordering), much ofthe responsibility rests further up the retail organization or in the supply chain.
The remainder of this section examines the common processes categories whereroot causes and the responsibility for OOS are typically assigned. Next, a sum-mary of the root causes as reported from several studies examined for this reportis presented. A summary of the findings as well as a discussion of examining rootcauses by using different methods of measurement concludes the section.
The examination of 18 studies worldwide provided the following general rangesand tendencies of OOS causes. These are summarized in Exhibit 24. The studiesthat provided the most reliable measures were segmented into three regions: U.S.(6 studies), Europe (10 studies), and Asia (2 studies). This enabled the compar-isons to be made by region that are reported here.
Typically, causes of OOS tend to be assigned to one of the following three generalprocesses: ordering, replenishing and planning.
✓ Ordering Practices. This covers two general categories. First, the retail storemay have ordered too little or too late so that the warehouse could notdeliver before the retailer ran out of the item. Second, the retailer forecastmay have misjudged demand for an item and ordered an insufficient supply.Often when an item is promoted, inadequate supply is ordered to meetdemand. Other ordering practices affect these categories also, includinginsufficient ordering by the warehouse, when a major promotion by thechain may have caused demand to exceed supply.
✓ Replenishment Practices. In this case the product is in the store (often inthe backroom, but also sometimes in another area of the store), but it isnot on the shelf when the consumer comes to buy the product. This canbe caused by inadequate shelf space allocated to the item so that it runsout before regular restocking occurs, lack of an adequate signal to retailmanagement that the product is not on the shelf, or poor back-roominventory handling procedures that impede the ability of store personnelto get product from the back-room inventory onto the shelf.
1. OOS CAUSES
BY REGION

33Chapter 2: Overall Findings
Replenishment issues also occur upstream from the retail store. On thewarehouse level the warehouse may have insufficient inventory to meetdemand and “scratches” the retailer’s order.
✓ Planning Practices. This category covers several possible causes. The itemmay have been discontinued but that information may not have been com-municated to the retailer. The manufacturer may not have shipped ade-quate inventory, or there may be a product “drought” where the manufac-turer is unable to produce enough to meet demand.
It is important to note that in these studies, the root causes are estimated or calcu-lated rather than directly measured. For example, if an item is out-of-stock andwas ordered at the most recent opportunity, the assumption is that the retailerordered too little to meet demand, and, thus, the cause would be assigned toretailer forecasting. Alternatively, if the item was not ordered at the most recentopportunity, then the assumption is that the store ordered an insufficient quantity.This is why the assigned causes may not be true “root causes” but simply the mostplausible place to assign responsibility. In some cases, this may reflect the symp-tom rather than the cause.
Given the differences in methods and reporting of root causes across the studies,it is difficult to present averages confidently. However, several insights can bemade from examination of the data presented here. Exhibit 24 presents a simpleaverage of all of the 18 studies. A detailed listing of the studies examined and thereported causes for each is presented in Appendix D. It is important to use theseaverages as benchmarks, because they may not necessarily represent true world-wide averages. However, given the relative consistencies across the various stud-ies, many observations can be made. The first three causes are the direct responsi-bility of the store, while the last three causes are upstream responsibility.
Ex
hib
it 2
4
0% 20% 40% 60% 80% 100%
OOS Causes by Region
World Average 13
U.S. 18
Europe 11Asia 9
34
33
2149
25
22
3815
10
11
911
14 4
13
1115
3
101
Store Shelving and Merchandising
Other Causes
Store Forecasting
Distribution Center
Store Ordering
Retail HQ or Manufacturer Cause

34 Retail Out-of-Stocks: A Worldwide Examination of Extent, Causes and Consumer Responses
Worldwide, the two greatest causes are inaccurate forecasting (34 percent), anindicator of increasing demand volatility, and shelf-replenishment (25 percent).The latter is particularly surprising when compared with the much-cited 1996Coca Cola Research Council study. While this study attributed a higher percentageto ordering (19 percent) and forecasting (54 percent) it traced an average of only 8percent of the OOS situation to product being available in the back-room but noton the shelf. Similarly, the 2002 GMA study on DSD categories showed only anaverage of about 4 percent OOS where product was available in the back roombut not on the shelf. However, in nearly 25 percent of OOS, product could befound in a secondary location in the store. This may be characteristic of DSD cat-egories. In the proprietary studies we examined, where it was specifically meas-ured, study analysts found much greater responsibility attributed to having prod-ucts in the store but not on the shelf.
Although (or because) most manufacturer efforts that address OOS are directed tothe warehouse, this represents only 10 percent of the root cause. Clearly, if man-ufacturers and others want to see reductions in OOS levels, they need to addressthe more prominent issues of store ordering, forecasting and replenishment.
Study analysts were surprised to find that in the United States, significantly morecauses of OOS are attributed to ordering practices (51 percent) than in Europe (32percent). On the other hand, in Europe there seem to be more problems withreplenishment (47 percent) than in the U.S. (32 percent), particularly shelf replen-ishment especially when the product is already in the store. This is counterintu-itive, as one would have guessed that smaller back rooms and efficient transportnetworks in Europe would alleviate this cause. Asia seems to be slightly worse inthe area of ordering; however, the Asian sample is very limited.
Somewhat striking, 72 percent of all OOS across the world are caused in the storeby bad store practices, by late and insufficient ordering, wrong forecasts, or shelfrestocking problems. Interestingly, as demonstrated in Exhibit 25, the aggregatenumber is almost the same in the United States, Europe and Asia.Exh
ibit 2
5 0% 20% 40% 60% 80% 100%
Aggregate Store OOS Responsibility Is Similar Worldwide
World Average 72
U.S. 73
Europe 70
Asia 7328
27
30
27
Total Supply Chain
Total Store

35Chapter 2: Overall Findings
Another way to examine OOS causes is to slice them by management process,whether they can be attributed to ordering, replenishing or planning. (See tablebelow.) Each can then be examined by the responsibility level (whether theyoccurred in the store, at the RDC/distributor or at the retailer or supplier head-quarters).
Overall, we find that almost half (47 percent) of the causes are attributed toordering practices, more than a third (35 percent) to replenishment practicesand almost a fifth (18 percent) to management decisions and other problems.Exhibits 26 and 27 illustrate the allocation of the OOS to specific processes aswell as showing where the responsibility rests.
Ordering Problems (47 percent)Ordering problems are caused predominantly by inaccurate inventory, bookkeep-ing or forecasts that lead to late orders or no orders at all. Study analysts were sur-prised to find that in Asia and in the U.S., significantly more causes of OOS areattributed to ordering practices (58 percent and 51 percent) than in Europe (32percent).
Exhi
bit
26OOS Causes by Process and Responsible Entity
Ordering Replenishment Planning Total
In-Store 47% 25% —— 72%Supply Chain —— 10% 18% 28%Total 47% 35% 18% 100%
Worldwide Average
Exhi
bit
27Detailed OOS Causes by Process
Store
Ord
ering
Store
Fore
casti
ng
ORDERIN
G
Store
Stoc
king
War
ehou
sing
REPLE
NISHM
ENT
Man
agem
ent
Other
s
PLANNIN
G
U.S. 18% 33% 51% 22% 11% 32% 13% 4% 17%Europe 11% 22% 32% 38% 9% 47% 11% 10% 21%Asia 9% 49% 58% 15% 10% 25% 16% 0% 16%World 13% 35% 47% 25% 10% 35% 14% 4% 18%
Worldwide Average
2. EXAMINATION OF
PRIMARY ROOT CAUSES
BY PROCESS

36 Retail Out-of-Stocks: A Worldwide Examination of Extent, Causes and Consumer Responses
If late ordering is an indication of a process problem (e.g., inadequate attention toreorder necessities), then wrong forecasting may be a sign of volatile demand(e.g., influenced by promotions). In this sense, in the U.S. there may be too littlefocus on reorder patterns whereas in Europe demand may be more volatile lead-ing to inaccurate forecasts. Forecasting also seems to be the major problem isAsia. However, some of the studies did not make a clear division between order-ing and forecasting, so conclusions must be drawn with care.
Replenishing Problems (35 percent)Typical replenishing problems stem from store practices of infrequent, late or noshelf filling, congested backrooms where stock was not found or damaged, badplanogram execution, insufficient or busy staff, or simply unreliable store process-es. At the distribution-center level, stores can be replenished infrequently, late ornot all. Supply chain causes include long lead times, inaccurate deliveries andproduction or supply problems.
We found that in Europe, more problems with regards to replenishment (47 per-cent) than in the U.S. (32 percent) or in Asia (25 percent). In particular, shelfreplenishment poses huge problems. In Europe more than a third (38 percent) ofthe OOS are caused by products that are in the store but not on the shelf. In theU.S. (22 percent) and Asia (15 percent) these rates are considerably lower. This iscounterintuitive, as study analysts deducted that due to smaller backrooms andefficient transport networks, these causes would be less frequent in Europe.
OOS that are caused by products that are available at the RDC/distributor but donot get shipped to the store seem to be equally distributed through out the world.
Planning and Related Problems (18 percent)These OOS causes consist of a mix of category-planning-related problems, includ-ing assortments, advertising, promotions and standard product planning, plusinadequate shelf space allocation. It also includes data and communication prob-lems, such as incorrect master data when SKUs are newly introduced or discon-tinued. No significant differences were found in planning-related causes through-out the world as the above table shows. However, in Europe 10 percent of thecauses of OOS are attributed to “other causes,” e.g. joint planning problems thatare difficult to specifically attribute to any one party or cause.
Manufacturer Capacity ConstraintsFew studies provided any information regarding the amount of OOS that can beattributed specifically to the supplier being unable to produce enough product tomeet demand. In general, any specific references to this constraint also bundlethis root cause with ones that reflect a lack of communication between the manu-facturer and the retailer, and/or other communication issues (such as discontinueditems that retail stores continue to order). Regardless, based on the little informa-tion in the studies, manufacturer product (i.e., ability to place adequate stock in

37Chapter 2: Overall Findings
the supply chain) supply issues would be 3-4 percent maximum. This would like-ly vary by category, and this variance would depend on raw material supplies,factory capacity and consumer willingness to substitute.
ConclusionIn general, previous studies have shown that retail store practices are responsiblefor 80-90 percent of OOS. In comparison, this study shows an approximate 70-75 percent retail store responsibility. Although these findings are lower, it stillmeans that most of the attention given to resolving OOS issues needs to begin atthe retail store.
Alternatively, one must keep in mind that retail store practices are not independ-ent from supply chain practices, whether these occur at the retail headquarter orat the manufacturer. Even when the upstream channel members may not be thedirect link to the measured OOS on the shelf, they cannot be absolved from anyresponsibility for affecting the OOS problem.
In addition to the root causes examined in this report, some studies attributed out-of-stocks to a variety of causes that are related to but do not exactly match thefive general categories above. These include the following causes.
✓ Inadequate Shelf Capacity: Mentioned twice previously in this report, thisissue needs to be emphasized again. One of the obvious reasons thatsome items are OOS is that adequate shelf space has not been allocatedto the SKU. Some products that are OOS have limited shelf capacity rela-tive to their demand. With shelf space as a scarce commodity in the retailstore, many slow-moving products occupy an inordinate amount of shelfspace compared to their movement. These crowd the space available forfaster-movers. In spite of this obvious cause, none of the studies examinedhave specifically addressed or empirically tested the potential impact ofreallocation of shelf space on OOS levels. One of the constraints in real-location is the common practice of allocating shelf space based on case-pack size. The minimum retail shelf allocation is normally determined bythe size of a case pack (typical minimum space is 1.5 cases). This places aminimum constraint on available shelf space, which limits the remainingshelf space available for faster-moving SKUs.
✓ Inverse Effect of Inventory: Of interest, it was found in this study that theamount attributed to this cause was inversely correlated with the generalinventory carried in the store. That is, the greater the inventory that iswarehoused in the backroom of the store, the greater the portion ofassigned OOS to this cause. While this initially seems counter intuitive,logically it makes sense. Assigning the cause to “in store but not on theshelf” takes away the ability to blame insufficient ordering as an alterna-tive cause. However, it may also be that too much safety stock hides thetrue causes of OOS that wreak havoc once the safety stock wears off. TheECR Australasia report states, “Experience seems to point to inventories
3. OTHER EXPLANATIONS
OR ATTRIBUTIONS OF OOS

38 Retail Out-of-Stocks: A Worldwide Examination of Extent, Causes and Consumer Responses
being the cause rather than the solution to stock-outs. Excess inventoriescause congestion in the supply chain and reduce the degree of synchro-nization between different replenishment processes.”
✓ Ad and Price Changes: One study reported that ad and price changeswere made up to 10 days prior to the release of the ad. Coupled withinadequate communications with warehouse and store logistics and pur-chasing managers, this was reported as a source for nearly one-third ofOOS that occur on advertised items.
✓ New Product Phase In and Out: OOS frequently occur when products arephased in or out of the marketplace. This requires system changes and ahost of communication breakdowns can occur.
✓ Manufacturer Minimum Order Sizes: One upstream issue is that of mini-mum order sizes from the manufacturer or upstream channel members.Minimum order sizes can lead to delaying an order, and this increases therisks of OOS.
One study went so far as to detail 94 possible root causes for OOS. However,for obvious reasons the actual analysis was never completed. Exhibit 28 pro-vides a list of potential causes of OOS collected from the various studies exam-ined in this report.
Root cause analysis is traditionally measured by manual audits. A typical flowchart for the manual audit process is shown in Appendix D, Part 2. An alternativeway to measure root causes is through the methodology employed by DataVentures, a U.S. software and service provider, to estimate OOS based on productvelocity. This method examines store-scanner data for multiple stores (such as anentire chain or a regionalized group of stores).
A key piece of information that his method provides is showing the number ofstores in which an item is simultaneously out-of-stock. Examining simultaneousstock-outs provides insight into the probable cause of the OOS situation.
For example, consider a chain or regional group of 11 stores all served by the samewarehouse. If an item is OOS at one or two stores, the root cause most likely restsat the store level and thus would be attributed to either store ordering or shelfrestocking. This problem would need to be addressed at the store level. However, ifthe item is simultaneously OOS at three to five stores, there is likely a process prob-lem caused by a policy, delivery schedule or promotion. In this case the problemwould need to be addressed at both the retailer and the headquarters level. If theitem is simultaneously OOS at six to 10 stores, then the cause is likely to be higherin the channel, and possibly due to inadequate ordering by headquarters for thewarehouse. Finally, if the item is OOS in all 11 stores, a likely cause is at the man-ufacturer where the item may have been discontinued or otherwise in short supply.
4. DETERMINING ROOT
CAUSES OF RETAIL CHAIN
CHARACTERISTICS

39Chapter 2: Overall Findings
Ex
hi
bi
t
28
Root Causes
D I S T R I B U T I O N C E N T E R
S T O R E
W H O L E S A L E R / R E T A I L E R H E A D Q U A R T E R S
S U P P L I E R
OrderingPlanning Replenishing
• Data (bad POS data, inaccu-rate records).
• Forecasting (inaccurate fore-cast, long cycles).
• Inventory (inaccurate inven-tory or book-stocks).
• Ordering (no order, lateorder, wrong order, backo-rders).
• Incongruence between shelfcapacity and replenishmentfrequency.
• Product purchasing frequen-cies.
• Large number of SKUs inassortment.
• Staffing (insufficient or busystaff).
• Backroom (congested).• Receiving (receiving errors,
inaccurate records).• Shelf replenishment (infre-
quent, late or no shelf fill-ing).
• Planogram (bad executionand compliance).
• Shrinkage (damage, theft).
• Data (bad data, inaccuraterecords).
• Forecasting (inaccurate fore-cast).
• Inventory (inaccurate inven-tory or book-stocks).
• Ordering (no order, lateorder, wrong order, backo-rders).
• Assortment (new or discon-tinued item).
• Data and communication(master data).
• Planogram design and imple-mentation (shelf allocation).
• Promotions and pricing deci-sions.
• Advertising and display plan-ning.
• Store layout and service lev-els.
• Availability (shortage).
• Data (bad data, inaccuraterecords).
• Forecasting (inaccurate fore-cast).
• Inventory (inaccurate inven-tory or book-stocks).
• Ordering (no order, lateorder, wrong order, backo-rders).
• Transportation (shipping,loading).
• Receiving (loading errors,inaccurate records).
• Storage (put away/ breakpack).
• Replenishment (infrequent,late or no store replenish-ment).
• Lead times (long and infre-quent).
• Shrinkage.
• Data (bad data, inaccuraterecords).
• Forecasting (inaccurate fore-cast).
• Inventory (inaccurate inven-tory or book-stocks).
• Ordering (no order, lateorder, wrong order, backo-rders).
• Assortment (new or discon-tinued item).
• Data and communication(master data).
• Promotions and pricing deci-sions.
• Advertising and display plan-ning.
• Availability (packaging, rawmaterials and ingredients).
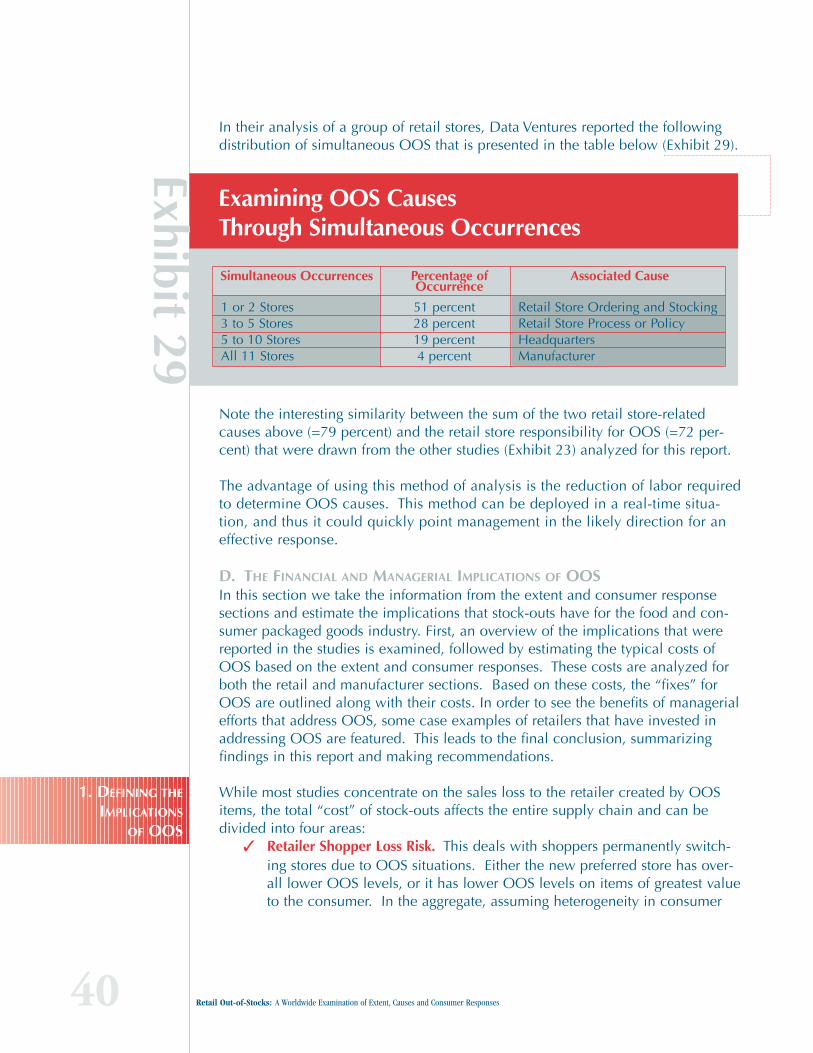
40 Retail Out-of-Stocks: A Worldwide Examination of Extent, Causes and Consumer Responses
In their analysis of a group of retail stores, Data Ventures reported the followingdistribution of simultaneous OOS that is presented in the table below (Exhibit 29).
Note the interesting similarity between the sum of the two retail store-relatedcauses above (=79 percent) and the retail store responsibility for OOS (=72 per-cent) that were drawn from the other studies (Exhibit 23) analyzed for this report.
The advantage of using this method of analysis is the reduction of labor requiredto determine OOS causes. This method can be deployed in a real-time situa-tion, and thus it could quickly point management in the likely direction for aneffective response.
D. THE FINANCIAL AND MANAGERIAL IMPLICATIONS OF OOSIn this section we take the information from the extent and consumer responsesections and estimate the implications that stock-outs have for the food and con-sumer packaged goods industry. First, an overview of the implications that werereported in the studies is examined, followed by estimating the typical costs ofOOS based on the extent and consumer responses. These costs are analyzed forboth the retail and manufacturer sections. Based on these costs, the “fixes” forOOS are outlined along with their costs. In order to see the benefits of managerialefforts that address OOS, some case examples of retailers that have invested inaddressing OOS are featured. This leads to the final conclusion, summarizingfindings in this report and making recommendations.
While most studies concentrate on the sales loss to the retailer created by OOSitems, the total “cost” of stock-outs affects the entire supply chain and can bedivided into four areas:
✓ Retailer Shopper Loss Risk. This deals with shoppers permanently switch-ing stores due to OOS situations. Either the new preferred store has over-all lower OOS levels, or it has lower OOS levels on items of greatest valueto the consumer. In the aggregate, assuming heterogeneity in consumer
Exhibit 29
Examining OOS Causes Through Simultaneous Occurrences
1 or 2 Stores 51 percent Retail Store Ordering and Stocking3 to 5 Stores 28 percent Retail Store Process or Policy5 to 10 Stores 19 percent HeadquartersAll 11 Stores 4 percent Manufacturer
Simultaneous Occurrences Percentage ofOccurrence
Associated Cause
1. DEFINING THE
IMPLICATIONS
OF OOS

41Chapter 2: Overall Findings
value on items, the store with a lower overall OOS level will lose fewer ofits own customers and gain more customers from other stores.
✓ Retailer Sales Loss Risk. This is from three components: consumers buy-ing the OOS item at another store, consumers canceling their purchase ofthe item, and the net difference created when consumers substitute asmaller and/or lower-priced item. This is calculated by combining the esti-mated lost sales percentage from the three components and multiplyingthis by the extent of OOS. The result provides an estimate of the percent-age of the retailer’s total gross sales that are lost due to items being OOS.
✓ Manufacturer Shopper Loss Risk. This area covers consumers switching toa competitor’s brand within a category for not only the immediate but alsoongoing purchases.
✓ Manufacturer Sales Loss Risk. This deals with consumers substituting acompetitor’s item or cancel a purchase.
Other implications of OOS include logistics and information inefficiencies in thesupply chain. Irregular, fill-in and rush orders due to out-of-stock situations causelogistics-fulfillment inefficiencies. These are subject to demand amplification or the“bullwhip effect” where small shifts at the retail level become magnified further upthe supply chain. Information inefficiencies are created when the ordering signalssent up the supply chain reflect a pattern other than true consumer demand.
The key to understanding the implications of OOS (as well as the benefits ofaddressing OOS at the retailer) is that the areas of loss are interdependent. A reduc-tion in the sales loss to the retailer also reduces the resulting shopper loss risk, therisk to the supplier, and the resulting supply-chain inefficiencies. The retailer shop-per and sales loss is addressed in more detail in the sections that follow.
Retailer Shopper Loss Risk. Two of the studies examined for this study surveyed consumers to estimate theamount of retailer shopper loss. It is difficult to generalize on a wide scale, how-ever, because in order to do so, many assumptions need to be made. Theseinclude among others:
✓ The frequency the customer visits the store.✓ The value of the OOS item to the consumer.✓ The number of pre-planned items the consumer wants to purchase.✓ The expected duration of the OOS at the retailer.✓ The availability of a convenient alternative retailer.✓ The OOS level at the alternative retailer.
The critical consideration is the likelihood that a consumer will be satisfied whenvisiting the store. First, the greater the number of preplanned items sought by theshopper on that particular trip, the greater the likelihood that the customer will be
2. QUANTIFIYING THE
LOSSES DUE TO OOS
42 Retail Out-of-Stocks: A Worldwide Examination of Extent, Causes and Consumer Responses
disappointed by an OOS. When the average OOS rate is 8 percent, then the con-sumer is likely to not find at least one of every 12 to 13 items on the shopping list.The odds that any shopper leaving the retailer store completely satisfied (i.e., find-ing every pre-planned item available) are extremely low.
Suppliers and retailers naturally focus on the availability of individual productlines, which can be as high as 99 percent. Customers on the other hand have abasket of goods on their mind and notice when either a product is missing or isnot exactly what they wanted. Using the 99 percent availability as an example, ifa shopper has 40 items on the shopping list with a 99 percent probability of eachbeing available, the chance of getting the complete basket is 66 percent(99x99x99 ….. 40 times). However, when the worldwide OOS average of 92 per-cent availability is used, the chance of the shopper being completely satisfied isless than 5 percent. If acceptable substitutes are included, the rate is somewhathigher, but it is still much lower than most people imagine. Appendix E shows atable demonstrating the probability of completely satisfying a customer based onvarying levels of availability.
Given this somewhat dreary scenario, it does not much matter that almost no reli-able information exists that will provide a reliable estimate of shopper loss. Whatis clear is that a store with a lower OOS rate will net more customers (have fewerof their own customers leave and attract more customers from other stores) than astore with a higher OOS rate. Therefore, not to address OOS levels when com-petitors are addressing the levels places a retailer at a competitive disadvantage.
Retailer Sales Loss Risk. Most of the attention in measurement has been in the area of retailer sales loss.This is typically estimated based on the following formula:
Percentage of Consumer Responses that Negatively Affect the Retailer x OOS Extent.An additional loss due to lower price substitution can also be estimated andincluded in the percentage of consumer responses. Exhibit 30 shows how theretailer sales loss can be calculated based on the formula above. It also illustratesthe results of this study. The data from the first three data columns (the percentagewho buy item at another store, the percentage who do not purchase item and thepercentage of reduced sales) are taken from Exhibits 13 and 15. The percentage ofreduced sales is calculated by taking the sum of substitute – same brand and sub-stitute – different brand, and then multiplying that number by an estimatedamount that consumers will reduce purchases.

43Chapter 2: Overall Findings
Ex
hib
it 3
0
Estimated Retail Sales Losses Due to OOS Items
Buy Itemat AnotherStore (%)
Do NotPurchaseItem (%)
Percentageof
ReducedSales (1)
SUM (1-3):Total LostSales of
OOS Items(%)
OOSExtent (%)
PRODUCT(Columns
4x5)EstimatedSales Loss
(%)
1Column: 2 3 4 5 6
Region (from Exhibit 13)World Average 34 8 7 49 8.3 3.9U.S. 31 11 6 48 7.9 3.8Europe 27 9 7 43 8.6 3.7Other Regions 34 8 7 49 8.2 4.0Category (2) (from Exhibit 15)Toilet Tissue 18 11 8 37 6.6 2.4Hair Care 32 7 7 46 9.8 4.5Laundry 26 7 8 41 7.7 3.2Salted Snacks 15 16 9 40 5.3 2.1Diapers 39 10 5 54 7.0 3.8Fem Hygiene 40 5 6 51 6.8 3.5
(1) Substitution loss is estimated to be 15 percent of the total substitution, based on DataVentures findings.(2) Paper towel category in Exhibit 15 not included here due to lack of data on worldwideextent of OOS for the category.
Based on the studies from Data Ventures that specifically examine the effects ofsubstitution, a conservative estimate this of a 15 percent reduction of the intendedpurchase can be made. These three amounts are then added and presented in thecolumn four: SUM: Total Sales Loss.” The numbers for column five are takendirectly from Exhibits 4 and 6.

44 Retail Out-of-Stocks: A Worldwide Examination of Extent, Causes and Consumer Responses
Exhibit 31 graphically presents the results of the calculations in the above table. Theworldwide benchmark average is 3.9 percent sales loss at retail due to OOS items.The regional averages, as well as worldwide averages by category, are also present-ed. The chart shows that overall sales losses are similar worldwide, with a narrowrange from 3.7 percent to 4.0 percent. However, category sales losses vary dramati-cally from 2.1 percent to 4.5 percent. Regardless of how the data are cut, the impli-cation is still the same: Both the manufacturer and the retailer have created valuefor the consumer, but nearly 4 percent of this effort is wasted because the retailercannot extract the value from the consumer due to OOS items.
Several of the studies that were examined for this report had calculated or other-wise presented the implications for OOS. These are summarized in Exhibit 32.As with previous tables, the name of the store chain associated with the informa-tion is not shown due to the proprietary nature of the data.
The table clearly shows the value to the retailer of addressing out-of-stocks.Determining the size of the sales opportunity for an individual retailer is simply amatter of multiplying the estimated sales loss by the total sales (turnover) for thatretailer. For example, a retailer with $1 billion total sales will lose approximately$39 million due to OOS items (based on the worldwide average estimate of 3.9percent). Using a similar approach, the 2002 GMA DSD study estimated that 2.9percent of sales were at risk due to OOS items.
One of the studies noted below calculates that OOS reductions trim shopping
Ex
hib
it 31
World AverageBy Region
By Category
3.9
Other Regions 4.0U.S. 3.8
Europe 3.7
Salted Snacks 2.1
Fem Hygiene 3.5Laundry 3.2
Toilet Tissue 2.4
Diapers 3.8Hair Care 4.5
0.0 1.0 2.0 3.0 4.0 5.0
Sales Losses Due to OOS
Estimated Percentage Loss
3. REPORTED COSTS
OF OOS

45Chapter 2: Overall Findings
receipts by $1.73 per shopper. Viewed in terms of a 4.0 percent sales loss, thistranslates into the average shopper’s basket being reduced from $43.25 to $41.52.
This shows how OOS impacts sales but does nothing to reduce costs. Thus, theprofit impact of incremental sales gained through fewer OOS is likely to begreater than the overall retailer profit. That is, if a retailer increases sales due toaddressing OOS, the benefit comes through increased sales to shoppers that arealready in the store.
It is important to think of the averages as conservative estimates. One study in theabove table shows that when examining the top-moving items only (instead ofentire categories), sales losses are almost three times greater than the estimatedaverages. This makes intuitive sense because the fast-moving items account for alarger portion of the retailer’s sales than a typical item.
Ex
hi
bi
t
32
Implications Specifically Reported in Studies
Study/Report Implications to Retailer Comment
Spain (1)
Spain (2)
Spain (3)
BelgiumNorway
Greece
U.S. (1)
U.S. (2)
U.S. (3)
U.S. (4)
U.S. (5)
Improved shelf availability will add 1.8-3.2percent sales.
Improved shelf availability would add4percent-5percent incremental sales.
Improved shelf availability would add3.5percent incremental sales.
OOS reduces sales by 2.94 percent.OOS reduces sales avg. of 2.23 percent.
Estimate $35 additional sales for each $1cost to address OOS.Estimate a loss of $1.73 per shopping trip(3.1percent of sales).Estimate of $271,000,000 sales loss in 4departments.
Estimate that a 50 percent reduction ofOOS would result in $33 million in sales,$1.3 million profit.Estimate lost sales of 11 percent on top2000 items.Estimate potential loss of $75,000 annu-ally per store in the top 25 grocery cate-gories.
Estimate based on measures of OOS extentin laundry and shampoo categories andassume 35 percent lost sales of OOS items.Estimate based on measures of OOS extentin household cleaners and shampoo cate-gories.Estimate across 8 categories with avg. OOSextent 8.7 percent and 40 percent retailOOS.Estimate based on a single category.Estimate across 4 categories, range is 0.6 per-cent to 3.8 percent, depending on category.Source of cost estimate not reported.
Based on average 8.2 percent OOS rate.
Estimated from measured losses of $380,000in four departments in three test stores.Percentage of total revenues that the fourdepartments make up is not reported.Total sales opportunity is $66 million; profitmargin is 4 percent.
Demonstrates that prize of addressing topselling items is large.Total sales opportunity for boosting U.S.annual retail sales by 3 percent or $200,000per average supermarket.

46 Retail Out-of-Stocks: A Worldwide Examination of Extent, Causes and Consumer Responses
Several of the studies mentioned in the previous section also reported (along withthe costs and losses of OOS) the value obtained when reducing the level of OOS.This section summarizes the findings from these studies.
To the surprise of study analysts, only a few studies mentioned fixes that wereundertaken to solve the problem of OOS. What at first may seem to be negligenceturns out to be a bigger problem. While it is relatively easy to solve other problems– such as inventory reductions at the regional distribution center – the problem ofOOS is a systemic problem that cannot be solved in a short-term initiative. As amatter of fact, while it seems that many retailers are interested in knowing what theextent of OOS is, few seem interested in understanding the root causes. Evenfewer are willing to attack the problem as it goes right through the heart of theiroperations.
Reducing OOS requires changing processes in the stores, the supply chain and atthe suppliers. It also requires the latest data and information technology, plus apassion for excellence and execution. Most of all, however, it requires manage-ment priority that is usually scarce, and, despite the adage that “retail is detail,”often the love of details is missing in many organizations. Furthermore, the respon-sibility cannot be limited to the supply chain only. While execution is a problem,some of the root causes found in this study are in the marketing department andinclude ineffective category management, poor promotion and advertising plan-ning, and simply not understanding the mechanics of price-quantity relationshipsthat manifest as inaccurate forecasts.
The next section outlines several approaches recommended to address OOS.
Reliance on Safety StocksLogic would suggest that the level of OOS will be inverse to the level of safetystock at the store. However, that is not what this study found. Two studies exam-ined for this report clearly showed that higher safety stocks correlated with higherOOS levels. Moreover, at a grand scale, the U.S. typically has higher inventoriesthan European retailers, and, therefore, one would expect OOS rates to be lower inthe U.S.. However, that is not the case.
OOS rates of North and Western European countries are slightly lower than the U.S.rate. Moreover, increasing inventory levels carry additional costs of financing, manag-ing and shrinkage that reduce the benefits gained through lower OOS levels. Therefore,from the perspective of this study, the increase of safety stocks does not necessarily leadto a reduction in OOS, and the corresponding benefits are still elusive.
Reliance on ManpowerThe NACDS study reports that solving OOS is one of the top four issues that retailmanagers address when working on the store floor. Therefore, management isalready committing expensive managerial resources that address the OOS problem
4. OOS FIXES AND
IMPLICATIONS

47Chapter 2: Overall Findings
but do not focus on solving any of the root causes. One option – such as thatused by some retailers – is to commit a person to physically “walking the aisles”and looking for OOS items. Sainsbury (UK) terms this method, “PAM,” which isthe acronym for Physical Availability Monitoring. Even though Sainsbury targets500 key SKUs with this process, the method only provides a “snapshot” of avail-ability at a single point in time.
Over the short run, this may be a good option for retailers in that it will revealmany of the realities of the OOS situation, and it may also lead to enhancedprocesses for addressing out-of-stock issues. However, over the long run, the fullcost of training and other labor costs may become prohibitive, especially whenexamined at the aggregate corporate level. Additionally, such action does notaddress the timing of OOS that occur throughout the day and not just at the timewhen a physical check is made.
Personnel and TurnoverOne would expect that higher employee turnover to correlate with higher OOSlevels. Thus, it is not simply the number of people required to address the prob-lem, but also the experience of the personnel that will affect OOS levels. Whileevidence in this study is anecdotal, study analysts found that retail stores withlonger tenured employees had lower OOS levels.
CPFRCollaborative Planning, Forecasting and Replenishment (CPFR) promotes the useof common tools and processes to improve supply chain planning through accu-rate and timely information flow. This process requires timeline management, datastandards and specific accountabilities to be used by all appropriate trading part-ners. It also requires that the basic planning data be identical for all trading part-ners, ideally based on point-of-sales scanning data.
The CPFR methodology was developed in the United States and became an initia-tive under the U.S. ECR before ECR was ended in the United States. CPFR hasbeen adopted by VICS (Voluntary Interindustry Commerce Standards,www.vics.org), a U.S. organization and by ECR Europe (www.ecrnet.org). CPFRconsists of a nine-step process that proceeds in the three building blocks (plan-ning, forecasting and replenishment) and enhances coordination of all trading par-ties in a supply chain. It centers on the sharing of the following data: businessplans, promotion plans, new product plans, inventory data, POS data, productionand capacity plans, and lead-time information. Collaboration and alignment arethe keys to success. CPFR has only been recently adopted, and the verdict is stillout. However, case studies in the U.S. support the value proposition of CPFR.Kimberly Clark and KMart, Nabisco and Wegman’s, and Procter & Gamble withTarget, Kroger and Wal-Mart, and others report benefits such as reduced out-of-stocks, higher order-fill, improved forecast accuracy, higher inventory turns andhigher category turnover.

48 Retail Out-of-Stocks: A Worldwide Examination of Extent, Causes and Consumer Responses
In Europe 19 trials are under way, among others with Sainsbury’s, Tesco, Metro,Procter & Gamble, Kraft, Unilever and Kimberly Clark. Initial findings suggest thatforecast accuracy, fill-rate and in-store and on-shelf availability can be significant-ly increased and supply chain stock decreased.
Efficient Replenishment (Vendor-Managed Inventory, Cross Docking)Efficient replenishment is one of the four basic tenets of ECR and describes a setof collaborative practices to replenish stock in all stages in the supply chain driv-en by true consumer demand and measured at the point-of-sale. The most widelyused techniques, Continuous replenishment or vendor-managed inventory, repre-sent new protocols for controlling the flow of information and product between asupplier and retailer. Retailers report daily to their suppliers their recent demandand current inventory position, and the supplier uses this information to deter-mine the replenishment quantity and timing that optimizes supplier supply man-agement without compromising the retailer’s service level. While these systemshave been successful in reducing supply chain inventory – or at least pushing itupstream – efficient replenishment is only indirectly effective in reducing OOS.
Category Planning and Shelf-Space AllocationIssues on assortment (such as the total number of SKUs) and shelf-space allocationcan affect OOS. Category reviews typically reduce the assortment of a category by10 to 15 percent of the SKUs. This not only means that there are fewer SKUs tomanage (fewer potential OOS), but it also frees up valuable shelf space occupied byvery slow moving or redundant items. Thus, more freedom is provided for shelfspace to be matched with demand. Category planning also includes enhancementof promotions where any changes in promotions, that are within four weeks canlead to the supply chain being unable to adequately match demand.
Technology and Better SignalingTechnology appears to provide promising solutions for addressing OOS issues.The key for technology is to be able to as quickly as possible, provide a signal tothe retail manager that an OOS exists or may soon exist. This then makes otherefforts to solving OOS issues more productive. For example, safety stocks can bepinpointed to support the items that are likely to be OOS on the shelf. Thus, safe-ty stocks become part of the supply chain flow rather than inventory that is beingheld by the retailer. Second, manpower can be directed efficiently to filling inknown or likely OOS, rather than be directed in a hit-or-miss approach across thethoU.S.nds of SKUs carried at the retailer.
Study analysts are aware of three models that have been publicly reported thataddress out-of-stocks. The first is a system built by and proprietary to Sainsbury’s(UK) titled Shelf Availability Monitor (SAM). A published Sainsbury’s report statesthat SAM tracks the transaction data for the store’s top 2,000 products and can beused to flag items that may be out-of-stock. The second model is a solution callede-replenishment that was developed jointly by IBM and IMI, a supply chain man-

49Chapter 2: Overall Findings
agement vendor, and was unveiled at the National Retail Federation’s annual con-vention in 2000. The system uses real-time point-of-sale consumer sales data todrive overnight replenishment through the supply chain. This system depends oninventory record accuracy, which may not always necessarily be complete. Thethird model is the solution discussed earlier in this report that was developed byData Ventures and The Procter & Gamble Company. The Item Velocity Monitorpredicts with 90 percent accuracy the OOS status for items that move four ormore times per day. This can provide a real-time signal to store managers anddoes not depend on store inventory records.
These new solutions all share the ability to harness technology – as opposed toinventory or manpower – to address OOS items in a rapid basis. This provides thepotential benefits of reduced OOS levels without committing high cost labor toaddress the problem. Furthermore, these provide the ability of linking the shelfOOS information to supply chain partners. While none of these reported solutionshave provided cost information (to purchase and implement), the following casescenarios in the next section provide compelling reasons for industry companiesto address OOS levels.
Examples are beginning to be reported in which retailers that address OOS findimpressive results from their efforts and investments. The following cases aredrawn from the published studies reviewed as background for this report. What isinteresting about these results is that they demonstrate relatively large payoffswhen reduction in out-of-stocks is addressed. Moreover, these reports only coverimmediate sales gains and do not take into account other benefits garneredthrough reduced OOS, such as increased customer satisfaction and greater supplychain efficiencies.
✓ The National Association of Chain Drug Stores (U.S. 2000) conducted anexperiment in which average in-stock levels were increased in test storesfrom 91.6 percent to 93.9 percent (a 2.3 percent increase in availability)on promoted items. The sales increase was 26 percent higher than that ofthe non-test stores.
✓ In another experiment, NACDS examined three laundry SKUs. Over afour-week period, a 14 percent increase in the number of days in-stock forthese SKUs resulted in a 34 percent increase in sales.
✓ In an experiment at a French grocery retailer (franchisee of Carrefour), theIMI-IBM e-replenishment product was reported (Stores, 2000) to haveincreased the shelf availability level from 88 percent to 98 percent whilereducing inventory 21 percent and substantially reducing the number ofpeople involved in ordering. Sales increases were reported to be as highas 30 percent depending on the category.
✓ In Franklins Supermarket (Australia), a 2001 ECR study reports that reduc-tions of OOS levels on 130 targeted products led to an increase of 5 per-cent of the sales of those items in a 20 week period. Coca-Cola andProcter & Gamble found higher results for their products, with 33 percent
5. EXAMPLES OF NEW,BEST OF BREED
SCENARIOS

50 Retail Out-of-Stocks: A Worldwide Examination of Extent, Causes and Consumer Responses
and 14 percent increases in sales growth respectively.✓ A report from China at the 2001 Asia ECR Conference boasted OOS
reduction efforts (from 21 percent to 6 percent) produced a sales increaseof 40 percent while reducing operating capital 33 percent.
✓ A report from the Europe at the 2002 ECR Europe Conference identifiedseven levers to improve OOS, namely measurement, management atten-tion, replenishment and ordering systems, merchandising and promotionmanagement as well as inventory accuracy. Initial findings from pilot trialswith ten retailers – including Safeway (UK), A. Heijn (Netherlands), Spar(Austria), Del’Haize (Belgium), Auchan (France), dm (Germany) and PingoDoce (Portugal) – are promising but need follow-up.
There are many lessons contained in the preceding pages, but what conclusionscan be drawn?
✓ First, all of the studies examined for this report point to a common con-cern: OOS has been, is and will continue to be a problem. The aggregateextent we found of 8.3 percent (and the similar results found through otherindustry studies) continue to – and should – raise alarms throughout theindustry.
✓ Second, OOS is costly. While the total costs to the supply chain have notbeen investigated, this study, along with others, have assessed the likelysales losses to the average retail store. We found that the worldwide aver-age sales loss due to OOS is 3.9 percent.
✓ Third, not all OOS are the same. A slow-moving item that is OOS will beless costly to the store than a fast-moving item. Similarly, consumer sub-stitution varies extensively among categories, affecting the retailer andmanufacturer to different degrees.
✓ Fourth, duration of OOS is important. While techniques for measuring theduration of OOS are fairly new, the impact of long-term OOS problemsaffects not only the sales of the item but also the likely potential of a con-sumer to switch stores.
✓ Fifth, most of the responsibility for lowering OOS rests in the retail store.Unfortunately, manufacturers have placed their resources toward loweringOOS on solving supply chain problems. This focus will need to shift if theproblem of OOS is to be addressed effectively.
✓ Sixth, it is important to understand the limits of projecting based on thefindings of this report. The data were not collected in such a way thatmacroeconomic projections of the total cost to the industry can be confi-dently projected from these findings. However, any retailer can use thefindings here as a benchmark when addressing OOS items. For example,if the retailer estimates sales losses as greater than our estimated averageof 3.9 percent due to OOS items, the retailer will likely have a large pay-off from addressing the issues. Alternatively, if the retailer estimates sales
6. CONCLUSIONS

51Chapter 2: Overall Findings
losses as much less than 3.9 percent (for example if the losses are about2.1 percent), then the payoff may be much lower.
✓ Seventh, examining consumers across the world, we found that shoppersare indeed localized in their choices. However, when their choice istaken away through a item being OOS, consumers behave in a similarmanner globally. In the end, the retailers (and their supply chains) thatsatisfy customers will be those more likely to succeed.
Any way you look at it, the OOS problem remains a major issue for not only theretailers but also for all parties in the food and consumer packaged goods supplychain. As many retailers are beginning to address out-of-stocks with the newertechnologically sophisticated solutions, they are setting a new standard in OOSlevels that consumers will expect as the level required to earn their business.

53Appendices
Appendices
Retail Out-of-Stocks:A Worldwide Examination of Extent, Causes and Consumer Responses
Appendix AListing of Studies Examined Bibliography
Appendix BConsumer Reaction
Appendix CCharts of Consumer Responses by CountryGeneral Observations of Consumer OOS Responses in Various Countries
Appendix DDetailed Listing of Studies ExaminedRoot Cause Analysis Flowchart
Appendix EProbability of Complete Satisfaction
Appendix FAuthors’ Vitae

54 Retail Out-of-Stocks: A Worldwide Examination of Extent, Causes and Consumer Responses
Listing of Studies Examined (52 Total Studies)
PUBLISHED / PUBLICLY AVAILABLE STUDIES (16 EXISTING STUDIES REVIEWED)✓ Industry (Seven studies)
• ECR Australasia (2001)• ECR France (2001)• ECR Asia /Thailand (2001)• Coca-Cola / Arthur Anderson (1996)• National Association of Convenience Stores (1998)• National Association of Chain Drug Stores (2000)• Grocery Manufacturers of America study of DSD categories (2002)
✓ Academic and Business Publications (Nine studies, bibliography follows)
NEW STUDIES USED IN THIS REPORT (36 NEW STUDIES)✓ Consumer Studies:
• Consumer Studies (2), North America, Outside of North America ✓ Retail Studies Conducted by Data Ventures
• Retailer A: Conducted 1999 • Retailer B: Conducted 2000• Retailer C: Conducted 2001
✓ Traditional Retail Audit Studies• U.S. (Five Different Retailers)• Europe (21 Total Studies)
- Netherlands (3)- Norway- Denmark- Belgium- France- Germany- Switzerland- Spain (3)- Sweden- Greece- Turkey (2)- Czech Republic (2)- Poland (2)- Hungary- E. Europe (Four countries Composite)
• Other geographic areas (Five Total Studies)- Taiwan- China- Philippines - Argentina (2)
AppendixA

55Appendices
Bibliography
Campo, Katia, Els Gijsbrechts and Patricia Nisol (2000), “Toward UnderstandingConsumer Response to Stock-Outs,” Journal of Retailing, 76 (2), 219-242.
Corstjens, Judith and Marcel Corstjens (1995). Store Wars: The Battle forMindspace and Shelfspace. West Sussex, England: John Wiley and Sons.Reference especially Chapter 9, pp. 196-218.
Emmelhainz, Margaret, James Stock and Larry Emmelhainz (1991), “ConsumerResponses to Retail Stock-Outs,” Journal of Retailing, 67 (2), 138-147.
Fisher, Marshall L., Anath Raman and Anna Sheen McClelland (2000), “Are YouReady for Rocket Science Retailing?, Harvard Business Review, July-August,115-124.
Fitzsimons, Gavin (2000), “Consumer Response to Stock-outs,” Journal of ConsumerResearch, 27 (September), 249-266.
Peckman, James O. (1963), “The Consumer Speaks,” Journal of Marketing, October,21-26.
Raman, Ananth, Nicole DeHoratius and Zeynep Ton (2001), “Execution: TheMissing Link in Retail Operations,” California Management Review, 43 (3,Spring), 136-152.
Schary, Philip B. and Martin Christopher (1979), “The Anatomy of a Stock-out,”Journal of Retailing, 55(2), 59-70.
Walter, C.K. and John R. Grabner (1975), “Stockout Cost Models: Empirical Tests ina Simulation,” Journal of Marketing, 39 (July), 56-68.
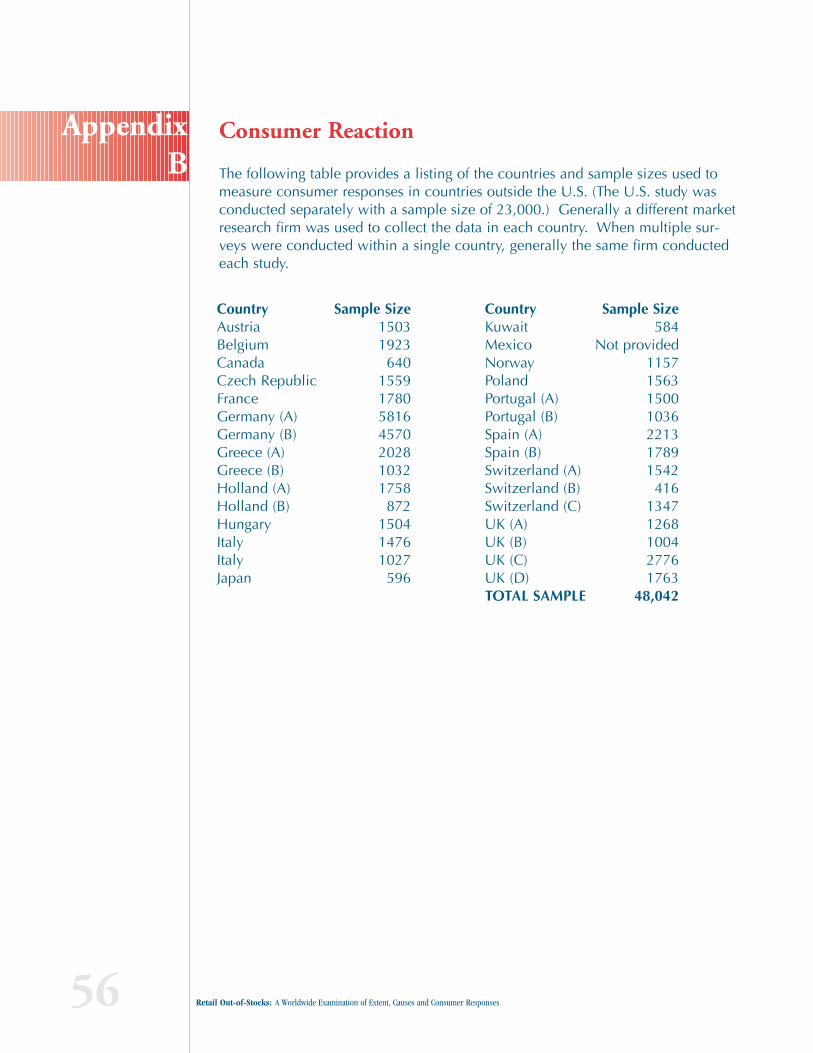
56 Retail Out-of-Stocks: A Worldwide Examination of Extent, Causes and Consumer Responses
Consumer Reaction
The following table provides a listing of the countries and sample sizes used tomeasure consumer responses in countries outside the U.S. (The U.S. study wasconducted separately with a sample size of 23,000.) Generally a different marketresearch firm was used to collect the data in each country. When multiple sur-veys were conducted within a single country, generally the same firm conductedeach study.
AppendixB
Country Sample SizeAustria 1503Belgium 1923Canada 640Czech Republic 1559France 1780Germany (A) 5816Germany (B) 4570Greece (A) 2028Greece (B) 1032Holland (A) 1758Holland (B) 872Hungary 1504Italy 1476Italy 1027Japan 596
Country Sample SizeKuwait 584Mexico Not providedNorway 1157Poland 1563Portugal (A) 1500Portugal (B) 1036Spain (A) 2213Spain (B) 1789Switzerland (A) 1542Switzerland (B) 416Switzerland (C) 1347UK (A) 1268UK (B) 1004UK (C) 2776UK (D) 1763TOTAL SAMPLE 48,042

57Appendices
Charts of Consumer Responses by Country AppendixC
0% 20% 40% 60% 80% 100%
Shampoo/Hair Care (% Response)
USA 32
Spain 31Portugal 25Norway 33
Italy 25Germany 31
France 21Belgium 26Austria 9Mexico 27Canada 39
21
2015
1314
2215
2018
1419
19
916
1114
815
1128
189
18
31404039284234342422
10
9
Hungary 51 14 12 19 4Greece 32 12 22 29 5
Kuwait 34 6 28 27 4Japan 52 3 18 27
Czech Republic 34 9 13 38 6UK 34 18 10 30 8
Switzerland 30 28 10 25 7
438
117
10111611
Not Purchase
Other Store
Delay Same Store
Substitute — Same Brand
Substitute — Other Brand

58 Retail Out-of-Stocks: A Worldwide Examination of Extent, Causes and Consumer Responses
0% 20% 40% 60% 80% 100%
Laundry (% Response)
USA 32
Switzerland 15Spain 19
Portugal 26Italy 19
Germany 22France 17
Belgium 24Austria 22Mexico 21Canada 32
19
4024
1517
2720
3026
1325
20
81018
148
1511
921
1020
26423942284229313219
9
11
Poland 34 21 5 38 2Hungary 43 13 19 23 2
Kuwait 32 6 28 32 3Japan 31 26 18 26
Greece 28 16 24 27 5Czech Republic 28 10 17 38 7
UK 24 26 15 26 9
528
1566
111213
Not Purchase
Other Store
Delay Same Store
Substitute — Same Brand
Substitute — Other Brand

59
Chapter 2: Overall Findings
0% 20% 40% 60% 80% 100%
Feminine Hygiene (% Response)
USA 38
Hungary 54Greece 45
Czech Republic 39UK 40
Switzerland 26Norway 42
Germany 39Belgium 36Mexico 30Canada 42
11
1011
61040
422
2314
1526
1322
1522
1221
1211
2115
19
20193727153121252118
6
3
Kuwait 43 4 19 31 3Japan 34 3 20 43
Poland 49 7 14 27 3
3317165
139
0% 20% 40% 60% 80% 100%
Salted Snacks (% Response)
USA 21
UK 16Spain 17
Portugal 7Norway 17
Italy 7France 9
Belgium 10Austria 14Mexico 17Canada 24
9
1211
66
56
11178
1220
1818
2826
192618
1628
1425
22435147545244312527
25
32Greece 24 6 25 37 8
1184
157
17232222
Not Purchase
Other Store
Delay Same Store
Substitute — Same Brand
Substitute — Other Brand

60 Retail Out-of-Stocks: A Worldwide Examination of Extent, Causes and Consumer Responses
0% 20% 40% 60% 80% 100%
Diapers (% Response)
USA 41
Japan 40Greece 51
UK 39Switzerland 29
Norway 43Germany 28
Mexico 29Canada 55
11
3615
1428
728
71120
915
189
99
181721
1614
2415381330
117
55
202
22166
0% 20% 40% 60% 80% 100%
Paper Towels (% Response)
USA 21
UK 9Switzerland 8
Italy 5Mexico 13Canada 20
17
1331
920
2218
1621
172916
32
4033652431
12
2184
1412
Not Purchase
Other Store
Delay Same Store
Substitute — Same Brand
Substitute — Other Brand

61Appendices
0% 20% 40% 60% 80% 100%
Toothpaste (% Response)
USA 35
Poland 39Germany 36
Canada 3917
72219
22
14719
17
372714
9
279
0% 20% 40% 60% 80% 100%
Toilet Tissue (% Response)
USA 24
UK 11Mexico 16Canada 22
19
1516
2425
2329
1824
353024
8
159
13
Not Purchase
Other Store
Delay Same Store
Substitute — Same Brand
Substitute — Other Brand

62 Retail Out-of-Stocks: A Worldwide Examination of Extent, Causes and Consumer Responses
General Observations of Consumer OOS Responses inVarious Countries
While there are not adequate categories to make composite comparisons for thecountries not shown in Exhibit 16, the eight charts in Appendix C that showresponses by country for each category, illustrate some consistencies and character-istics within countries. These findings are listed below:
✓ Austria: Somewhat lower store-switching accompanied with higher substitu-tion of the same brand.
✓ France: Among the highest in substituting other brands (42-52 percent).✓ Germany: Somewhat higher in purchase delay, otherwise generally reflects
worldwide averages. ✓ Italy: Across all four categories examined, much lower than average store-
switching accompanied with among the highest substitution of otherbrands.
✓ Norway: Low levels of delay and no purchase with correspondingly higherproduct substitution.
✓ Portugal: Except for salted snacks (where substitution is high), tend to reflectworldwide levels.
✓ Spain: Lower same brand substitution and higher other-brand substitution.✓ Switzerland: Overall has a very high level of purchase delay. This could be
due to either large home safety stocks, few choices of retail outlets, or fre-quent shopping trips.
✓ Czech Republic: Exhibit somewhat higher other-brand substitution andlower delay, but otherwise tends to reflect worldwide averages.
✓ Hungary: Very high store-switching.✓ Japan: Behavior varies greatly by category. Diapers and laundry show a
very high willingness to delay. Shampoo shows low level of delay accom-panied by high store-switch, while feminine hygiene shows low level ofdelay accompanied by high other-brand switch.
✓ Kuwait: Tends to reflect worldwide averages.
AppendixC

63Appendices
Detailed Listing of Root Cause Studies Examined AppendixD
Aggregate Root Causes to Six Major Cause Categories
StoreForecasting
Study1 StoreOrdering
StoreShelving
DistributionCenter
Retail HGor Mfr.
OtherCauses
U.S. 1 34 36 nm2 5 293 0U.S. 2 16 23 34 15 12 0U.S. 3 nm4 50 nm 27 23 0U.S. 4 24 50 nm 9 11 6U.S. 5 nm4 66 nm 11 nm 236
U.S. 6 nm4 52 26 22 nm 0Netherlands 1 17 nm4 58 2 nm 23Netherlands 2 nm4 15 26 19 18 22Netherlands 3 9 7 55 13 nm 166
Sweden 48 12 13 5 nm 16Switzerland nm 20 35 nm 15 306
France (ECR) 18 30 32 15 5 0Spain nm4 27 51 nm 23 0Greece 7 64 25 3 1 0Poland nm4 13 71 nm 16 0E. Europe nm 40 50 nm nm 10Taiwan 10 50 15 15 20 0Australia (ECR) nm4 58 18 8 16 0Other Studies with Data but Not Used in Calculations for this Study:Coca Cola Research Council 1996 U.S. 19 54 8 3 nm 16Argentina 18 32 30 nm nm 20
Notes:1Unless study is publicly available, studies are listed by country only.2“nm” refers to “not mentioned.”3Linked to advertising planning changes, thus assigned to retail HQ as a process/policy cause.
Total > 100percent due to overlap of HQ policy and retailer ordering. 4Cannot separate ordering from retailer forecasting; thus, they are combined. Overall, they refer
to overall store ordering practices.5Included in “ordering,” specific information not reported.6Assigned to total 100percent. Specific attribution not mentioned.
(Percent)

64 Retail Out-of-Stocks: A Worldwide Examination of Extent, Causes and Consumer Responses
Root Cause Analysis Flowchart.AppendixD
Basic Root Cause Analysis Flowchart
Physical Stock
Available at
OrderGenerated for
this SKU
Due DatePassed
SystemInventory = 0
Root Cause IIIDC Replenishment
Root Cause IShelf Replenishment
Root Cause IIStore Ordering
Root Cause VDC/Manufacturer
Supply Chain
Root Cause IVStore Forecasting
Shelf OOS Detectedby Auditor
NO NO
NO
NO
YESYES YES
YES

65Appendices
Probability of Complete Satisfaction
PROBABILITY OF SHOPPER BEING 100% SATISFIED
# Items to Purchase
Percentage Availability 10 20 30 40 5099% 90% 82% 74% 67% 61%98% 82% 67% 55% 45% 36%97% 74% 54% 40% 30% 22%96% 66% 44% 29% 20% 13%95% 60% 36% 21% 13% 8%94% 54% 29% 16% 8% 5%93% 48% 23% 11% 5% 3%92% 43% 19% 8% 4% 2%91% 39% 15% 6% 2% 1%90% 35% 12% 4% 1% 1%89% 31% 10% 3% 1% 0%88% 28% 8% 2% 1% 0%87% 25% 6% 2% 0% 0%86% 22% 5% 1% 0% 0%85% 20% 4% 1% 0% 0%
AppendixE

66 Retail Out-of-Stocks: A Worldwide Examination of Extent, Causes and Consumer Responses
Authors’ Vitae
Thomas W. Gruen, Ph.D. University of Colorado, Colorado Springs, U.S.Since 2001, Tom Gruen has served as assistant professor of marketing at the Universityof Colorado at Colorado Springs. Prior to 2001, he was assistant professor at EmoryUniversity’s Goizueta Business School. He is also visiting professor of marketing atESCP in Paris, France. He received his Ph.D. from Indiana University in 1997.
Dr. Gruen’s research interests focus on the demand side of ECR and he has publishedon the topic of category management in the Journal of Retailing, ECR Journal and theFinancial Times Mastering Marketing series. He also serves on the ECR GlobalScorecard committee. Gruen has also published extensively and won several awardsfor his research in the area of relationship marketing/customer relationship manage-ment. This research has appeared in the Journal of Marketing, Journal of BusinessResearch, International Journal of Research in Marketing and Business Horizons. Heteaches marketing strategy, CRM, e-commerce and marketing research.
Dr. Daniel CorstenITEM, University of St. Gallen, SwitzerlandProfessor Daniel Corsten is assistant professor of technology management at theUniversity of St. Gallen, Switzerland. He is vice-director at the University’s Institutefor Technology Management (www.item.unsig.ch). He holds a Doctorate from theUniversity of St. Gallen and a MS (Business Diploma) from the University ofCologne, Germany. Currently, he is visiting professor at INSEAD, Fontainebleau.Prior assignments include a visiting professorship at Bocconi University, Milano.
Daniel Corsten is co-editor of the ECR Journal - International Commerce Reviewand a member of the ECR Europe Academic Advisory Panel. His researchinterests include supply chain management, efficient consumer response and net-worked organizations. He has worked extensively with marketing and logistics ofconsumer goods and industrial goods companies and can be reached [email protected].
Sundar Bharadwaj, Ph.D.Goizueta Business School, Emory University, U.S.Sundar G. Bharadwaj is an associate professor of marketing at the Goizueta BusinessSchool. He received his Ph.D. in Marketing from Texas A&M University. He serves asthe marketing area’s doctoral program coordinator.
At Goizueta, Dr. Bharadwaj teaches marketing management and business-to-businessmarketing in the MBA and Executive MBA programs. He also teaches in non-degreeexecutive programs including strategic customer management, strategic pricing ande-marketing programs. He has published in the Journal of Marketing, ManagementScience, Journal of Academy of Marketing Science, the Journal of Business Research,the Journal of Product Innovation Management, the Journal of Services Marketing, theJournal of International Consumer Marketing, the Marketing Education Review, andVikalpa. His journal publications have received numerous awards, including the pres-tigious MSI/PAUL ROOT AWARD for best paper published in the Journal ofMarketing having an impact on managerial practice in 1999.
AppendixF


1010 Wisconsin Avenue, NWWashington, DC 20007202-337-9400


