24
Retail sector Tax rate benchmarking January 2016
Retail sectorTax rate benchmarking
January 2016
In this study, we report on the findings from our analysis of key tax ratios of 49 large companies in the retail sector. The analysis provides insight into the effective tax rate (“ETR”) and cash tax rate reported by these companies, the trend over the last three years and drivers of the ETR. The study uses publicly available data for the three years up to March 2015, sourced from data providers and individual company accounts. By using publicly available information, we can include any listed company, which gives us good coverage of the sector from which to identify trends.
The companies in the study are spread across a number of subsectors: food retail and wholesale (11 companies), apparel retailers (10), broadline retailers (11), specialty retailers (6), drug retailers (4), specialty consumer service (3), home improvement retailers (3), and diverse industrial (1). Geographically, the companies span the globe with a bias towards US headquarters (27 companies), but also including three from Japan, two companies each from Australia, Canada, China, UK, France, and one company each from Belgium, Chile, Hong Kong, Mexico, Sweden, Spain, Russian Federation, Philippines and The Netherlands.
About the study
2 | Retail sector: Tax rate benchmarking

PwC | 3
Contents
Introduction ............................................................................................ 5
1: Tax rate benchmarking in the retail sector .................................. 81.1: ETRs in the retail sector ................................................................................. 9
1.2: ETRs of the retail sector compared to other sectors ........................................ 10
1.3: ETR comparison for “domestic” vs. “multinational” companies ..................... 11
1.4: ETR by subsector ......................................................................................... 12
1.5: ETR drivers ................................................................................................ 13
1.6: Cash tax rate (CTR) in the retail sector......................................................... 16
2: US-headquartered retail companies ............................................ 172.1: ETR for US-based companies compared to non-US-based companies .............. 17
2.2: ETR drivers for US-based companies ............................................................ 18
2.3: Unrecognized tax benefits ............................................................................ 19
2.4: Unrepatriated foreign earnings ................................................................... 20
Appendices1: List of companies ........................................................................................ 22
2: Source of information and analysis ............................................................. 23
Contacts .......................................................................................................24
4 | Retail sector: Tax rate benchmarkings4 | Retail sector: Tax rate benchmarkings
“Multinational companies can expect more scrutiny when filing their corporate income tax returns.”
Harry Doornbosch Global Retail and Consumer Tax Leader
PwC | 5PwC | 5
Another development is the rebirth of the Common Consolidated Corporate Tax Base (CCCTB), which is an initiative to harmonize the corporate tax base.
Last but not least, in 2014 the EU started formal investigations to determine whether some multinational companies received illegal state aid from members states where they obtained a tax ruling. It is expected that final decisions on this will be published soon.
Introduction
From tax simplification to the ethics of tax avoidance, the subject of tax has never received more public interest than it does today. When we published our last tax rate benchmarking report in 2014 we wrote “The global tax system has been the subject of much debate in recent years and never more so than in 2013.” Since then, the debate has only increased.
Global developments
The Organization for Economic Cooperation and Development (OECD) and the G20 decided in 2013 to act upon a growing political and public debate about—at least perceived—income-shifting behavior of multinational corporations. Their initiative, called the base erosion and profit shifting initiative, (BEPS) caught traction very quickly and within two years 15 detailed, action-orientated plans were agreed upon and subsequently published in final form in 2015. The reports contain many actionable legal changes to be implemented by the OECD member states, as well as the many non-OECD states supporting the initiative.
The BEPS package will have an enormous impact on the behavior and actions of multinational companies, as well as on the behavior and actions of
governments and tax administrations around the world. A number of countries have already anticipated this and have implemented or are in the process of implementing tougher legislation—for example, anti-hybrid rules in Spain, transparency rules in Australia, anti-abuse rules in Canada and country-by-country reporting obligations in Ireland and the Netherlands. It can be expected, as a result of BEPS, that tax rates will increase, and a company’s tax strategy, tax structure and tax profile will become more visible to the taxing authorities in which it operates.
EU developments
In the EU a number of new initiatives have been implemented, designed to tackle what is perceived as tax evasion, avoidance, and unfair competition. One particular measure is a binding anti-abuse rule to be included in the EU Parent-Subsidiary Directive. In addition, the EU has adopted a tax transparency package—ensuring that information about all tax rulings within the EU will need to be reported and exchanged between the EU member states beginning January 1, 2017.
6 | Retail sector: Tax rate benchmarkings
In the spotlight
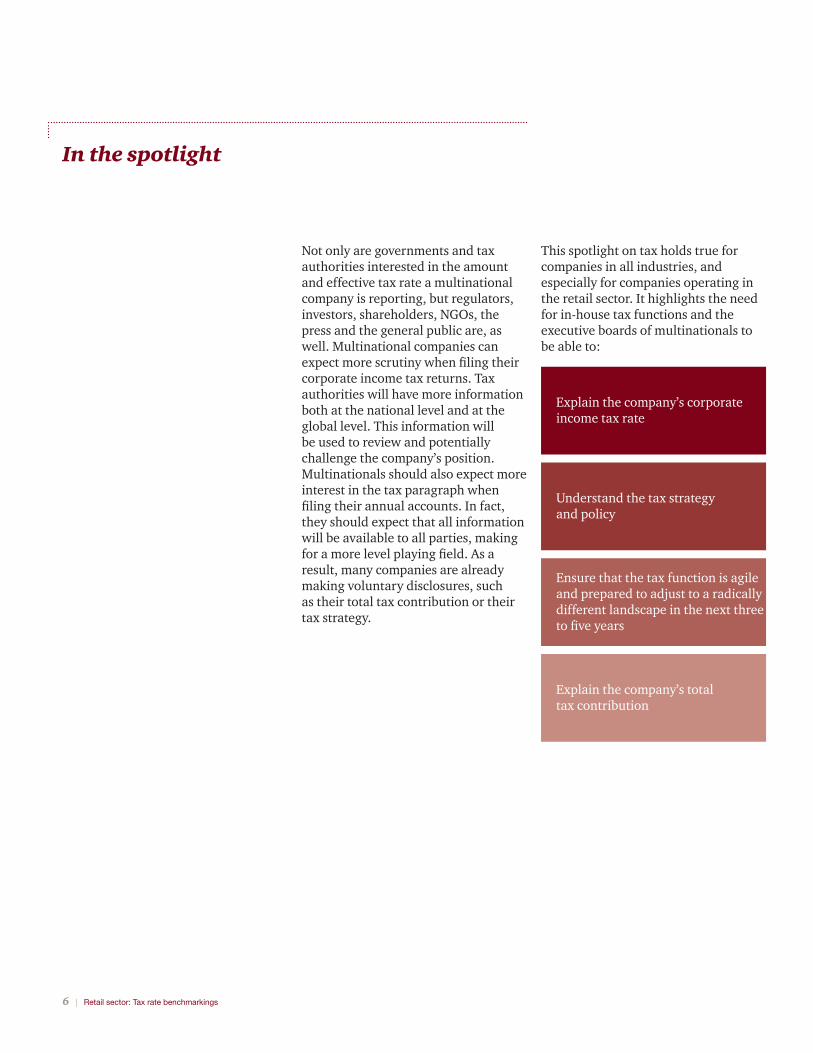
Not only are governments and tax authorities interested in the amount and effective tax rate a multinational company is reporting, but regulators, investors, shareholders, NGOs, the press and the general public are, as well. Multinational companies can expect more scrutiny when filing their corporate income tax returns. Tax authorities will have more information both at the national level and at the global level. This information will be used to review and potentially challenge the company’s position. Multinationals should also expect more interest in the tax paragraph when filing their annual accounts. In fact, they should expect that all information will be available to all parties, making for a more level playing field. As a result, many companies are already making voluntary disclosures, such as their total tax contribution or their tax strategy.
This spotlight on tax holds true for companies in all industries, and especially for companies operating in the retail sector. It highlights the need for in-house tax functions and the executive boards of multinationals to be able to:
Ensure that the tax function is agile and prepared to adjust to a radically different landscape in the next three to five years
Understand the tax strategy and policy
Explain the company’s corporate income tax rate
Explain the company’s total tax contribution

PwC | 7
So, what impact has this changing landscape had on the retail sector? Retailers frequently operate mainly in domestic markets, and this has a significant impact on the average ETR. Our study shows an average three-year ETR of 32.4%—the highest of a number of industry sectors studied (see figure 2). Unfavorable drivers affecting that rate include the impact of US state taxes and non-deductible expenses, while favorable drivers include tax incentives and use of losses.
For the retailers in the study operating largely in domestic markets (mostly US-based), the rate is higher (34.9%) compared to retailers with a more international footprint (26.1%). For US retailers, the rate is higher still (36.7%) compared to non-US companies (24.4%).
Impact on the retail sector
32.4% average three year ETR

8 | Retail sector: Tax rate benchmarkings
1: Tax rate benchmarking for the retail sector
Companies in the retail industry were operating in a challenging environment over the last year, with high inventory levels and currency fluctuations putting pressure on growth and increased demand for discounts from the consumer. According to the PwC 18th Annual Global CEO Survey1, 74% of retail CEOs are concerned about the change in consumer behavior and the factors that influence spending, such as higher taxes, unemployment and government debt.
Another significant challenge faced by the retail sector has been the change in the buying habits of consumers, as the trend towards browsing and buying online rather than making in-store purchases increases. Companies that have embraced the change and invested in new technologies such as mobile apps have excelled, whereas those late to adapt have cited poor performance as a result.
However, the shift in economic power to emerging markets has created opportunity for businesses to exploit a huge new consumer market and, despite the challenges faced in the year, the PwC survey found that 84% of CEOs are confident about revenue growth prospects over the next 12 months2.
84% of CEOs are confident about revenue growth
1 PwC 18th Annual Global CEO Survey: http://www.pwc.com/gx/en/ceo-survey/2015/industry/assets/ceo-survey-2015-industry-snapshot-retail.pdf 2 PwC 18th Annual Global CEO Survey “Explore the Data” tool: http://www.pwc.com/gx/en/ceo-agenda/ceo-survey/explore-the-data.html
Tax is a cost to business and, for retailers, with typically low profit margins, this can be a significant cost. Tax rate benchmarking provides insight for tax teams into how their ETR compares to their peer group and how it has changed over time.
PwC | 9
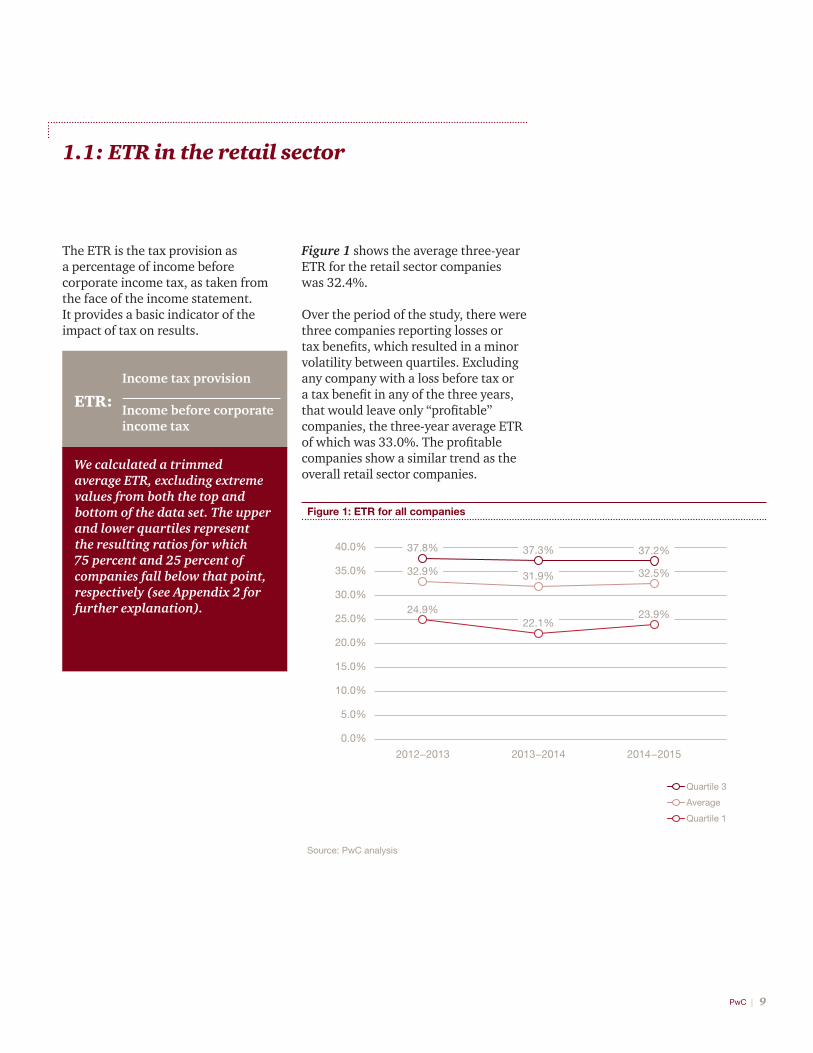
The ETR is the tax provision as a percentage of income before corporate income tax, as taken from the face of the income statement. It provides a basic indicator of the impact of tax on results.
1.1: ETR in the retail sector
Figure 1 shows the average three-year ETR for the retail sector companies was 32.4%.
Over the period of the study, there were three companies reporting losses or tax benefits, which resulted in a minor volatility between quartiles. Excluding any company with a loss before tax or a tax benefit in any of the three years, that would leave only “profitable” companies, the three-year average ETR of which was 33.0%. The profitable companies show a similar trend as the overall retail sector companies.
35.0%
25.0%
Source: PwC analysis
Figure 1: ETR for all companies
40.0%
2012−2013
30.0%
20.0%
15.0%
10.0%
5.0%
0.0%
2013−2014 2014 −2015
37.8%
32.9%
37.3%
31.9%
37.2%
32.5%
24.9%22.1%
23.9%
Quartile 3
Average
Quartile 1
We calculated a trimmed average ETR, excluding extreme values from both the top and bottom of the data set. The upper and lower quartiles represent the resulting ratios for which 75 percent and 25 percent of companies fall below that point, respectively (see Appendix 2 for further explanation).
ETR:
Income tax provision
Income before corporate income tax
10 | Retail sector: Tax rate benchmarkings
28.0%
32.0%
34.0%
30.0%
26.0%
24.0%
22.0%
20.0%
Source: PwC analysis
Figure 2: ETR for retail compared to six other sectors
2012 2013 2014
Retail
Transportation and logistics
Industrial manufacturing and metals
Chemicals
Aerospace and defence
Automotive
Engineering and construction
1.2: ETRs of the retail sector compared to other sectors
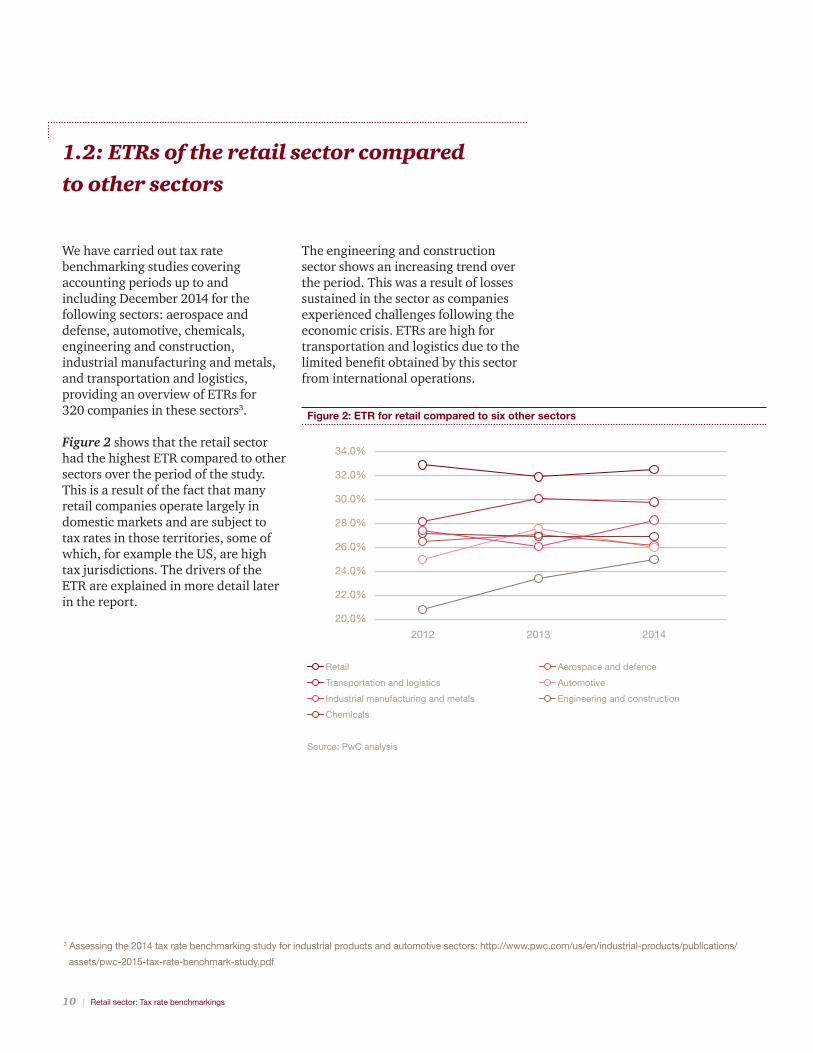
We have carried out tax rate benchmarking studies covering accounting periods up to and including December 2014 for the following sectors: aerospace and defense, automotive, chemicals, engineering and construction, industrial manufacturing and metals, and transportation and logistics, providing an overview of ETRs for 320 companies in these sectors3.
Figure 2 shows that the retail sector had the highest ETR compared to other sectors over the period of the study. This is a result of the fact that many retail companies operate largely in domestic markets and are subject to tax rates in those territories, some of which, for example the US, are high tax jurisdictions. The drivers of the ETR are explained in more detail later in the report.
The engineering and construction sector shows an increasing trend over the period. This was a result of losses sustained in the sector as companies experienced challenges following the economic crisis. ETRs are high for transportation and logistics due to the limited benefit obtained by this sector from international operations.
3 Assessing the 2014 tax rate benchmarking study for industrial products and automotive sectors: http://www.pwc.com/us/en/industrial-products/publications/
assets/pwc-2015-tax-rate-benchmark-study.pdf

PwC | 11
35.0%
Source: PwC analysis
Figure 3: ETR for domestic and multinational companies
25.0%
40.0%
2012−2013
30.0%
20.0%
15.0%
10.0%
5.0%
0.0%
2013−2014 2014 −2015
34.8%
28.6%
35.0%
24.2%
34.9%
25.6%
Domestic retail companies
International retail companies
1.3: ETR comparison for “domestic” vs. “multinational” companies
In order to identify a company as either domestic or multinational, we used the criteria that if revenue outside the home territory constitutes more than 25% of total revenue, these companies are treated as multinational companies, and if home territory revenue constitutes 75% or more of total revenue, these companies are deemed to be domestic. In the study, there were 15 multinational and 34 domestic companies.
Figure 3 shows the three-year average ETR for domestic companies—mostly US-based—(34.9%) was 8.8 percentage points higher than the three-year average ETR for multinational companies (26.1%). The majority of the domestic companies (23 out of 34) are based in high tax jurisdictions such as the US and this, together with the limited benefit from cross-border operations, drives the differential between domestic and multinational companies.
There is no one reason for the decrease in ETR from 2012/13 to 2013/14 for the multinational companies; however, on an individual company basis, the factors included non-recurring transactions such as acquisitions and settlements of tax disputes, a reorganisation resulting in revenue to lower-tax jurisdictions and re-measurement of deferred taxes due to statutory tax rate decreases.
12 | Retail sector: Tax rate benchmarkings
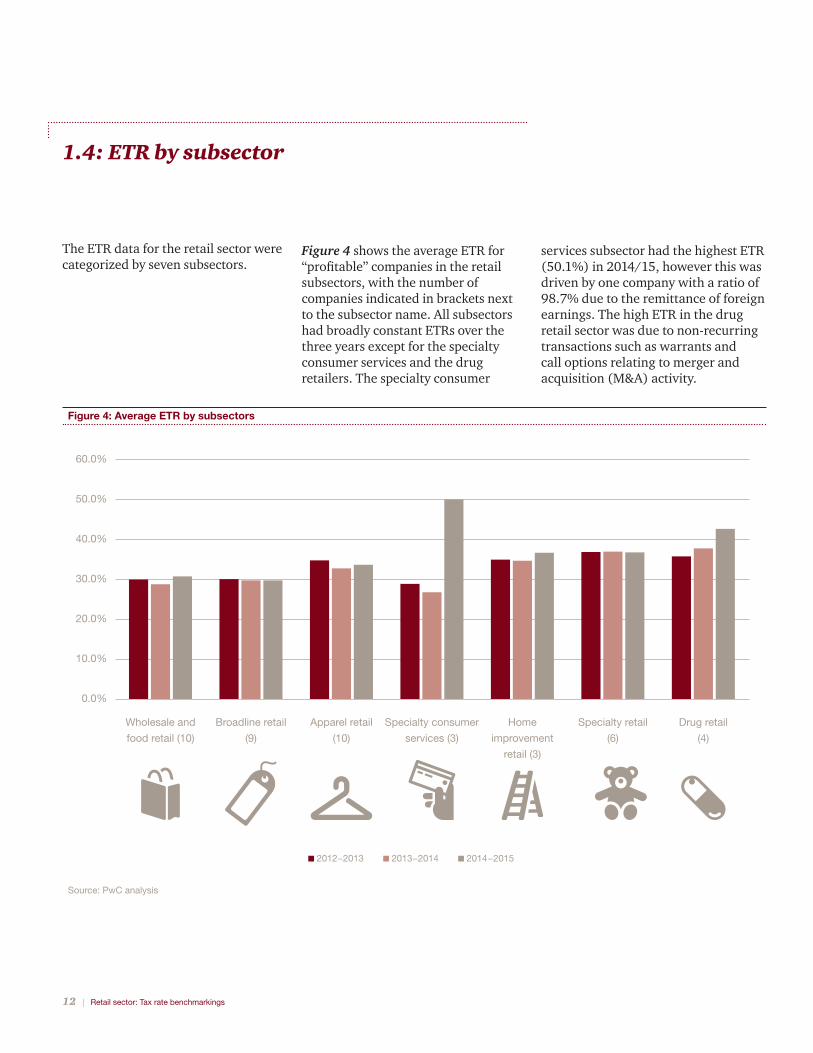
1.4: ETR by subsector
Figure 4 shows the average ETR for “profitable” companies in the retail subsectors, with the number of companies indicated in brackets next to the subsector name. All subsectors had broadly constant ETRs over the three years except for the specialty consumer services and the drug retailers. The specialty consumer
services subsector had the highest ETR (50.1%) in 2014/15, however this was driven by one company with a ratio of 98.7% due to the remittance of foreign earnings. The high ETR in the drug retail sector was due to non-recurring transactions such as warrants and call options relating to merger and acquisition (M&A) activity.
The ETR data for the retail sector were categorized by seven subsectors.
Source: PwC analysis
Figure 4: Average ETR by subsectors
60.0%
50.0%
40.0%
30.0%
20.0%
10.0%
Wholesale and
food retail (10)
Broadline retail
(9)
Apparel retail
(10)
Specialty consumer
services (3)
Home
improvement
retail (3)
Specialty retail
(6)
Drug retail
(4)
2012−2013 2013−2014 2014 −2015
0.0%

PwC | 13
1.5: ETR drivers
Source: PwC analysis
Figure 5: Drivers of the ETR in 2014 –15
Driver
5
34
0.0%13
10
16
44
24
14
Tax incentive
Tax losses and change in the valuation allowance
Change in tax rate
Other—company description
Tax reserve adjustments
Impact of foreign operations and local taxes
Non-taxable income and non-deductible expenses
Various other adjustments
-1% 0% 1% 2% 3%-3% -2%
-0.9%
-0.6%
-0.2%
-0.1%
0.5%
0.7%
0.8%
Average impact of drivers Number of companies
The difference between ETR and statutory rate in the headquarters country can be understood by analyzing the statutory/effective rate reconciliation notes disclosed in each company’s annual report. We categorized differences into either favorable or unfavorable items. A favorable driver brings the tax provision and ETR down lower than the statutory rate: such drivers might include tax incentives or non-taxable income. An unfavorable driver, such as non-deductible expenses, raises the tax provisions and ETR higher than the statutory rate. Drivers can be both structural and recurring, such as lower tax rates resulting from overseas operations or tax incentives, or a result of items such as losses which may not necessarily recur.
We have analyzed and summarized common drivers and their impact on the ETR. The reconciling items, as disclosed in the statutory/effective rate reconciliation, were analyzed, collated, and averaged under eight drivers. All of the 49 companies in the study disclosed reconciliation between their statutory and effective rates in their company accounts, and it was possible to gain some insight into the drivers of the effective rate in the retail sector by reviewing this analysis. Single outlying ratios have been excluded.
Figure 5 illustrates the drivers of ETR and shows how frequently they appear in companies’ statutory reconciliations for 2014/2015. The most commonly reported driver was impact of foreign operations and local taxes, which increased ETR by 0.5%. Although this might seem somewhat strange, given the domestic nature of the industry, we categorized the US domestic state taxes under “Impact of foreign operations and local taxes”, and these were unfavorable for many US retailers. As a result, while the impact of foreign operations decreased the ETR for multinational companies, in contrast it increased the ETR for domestic companies.
The largest favorable driver was tax incentives, which reduced the ETR by 0.9%, although this item was reported by only 10 companies. One of the tax incentives claimed by the US companies was “domestic manufacturing deduction”, which is currently underutilized in the retail sector.
14 | Retail sector: Tax rate benchmarkings
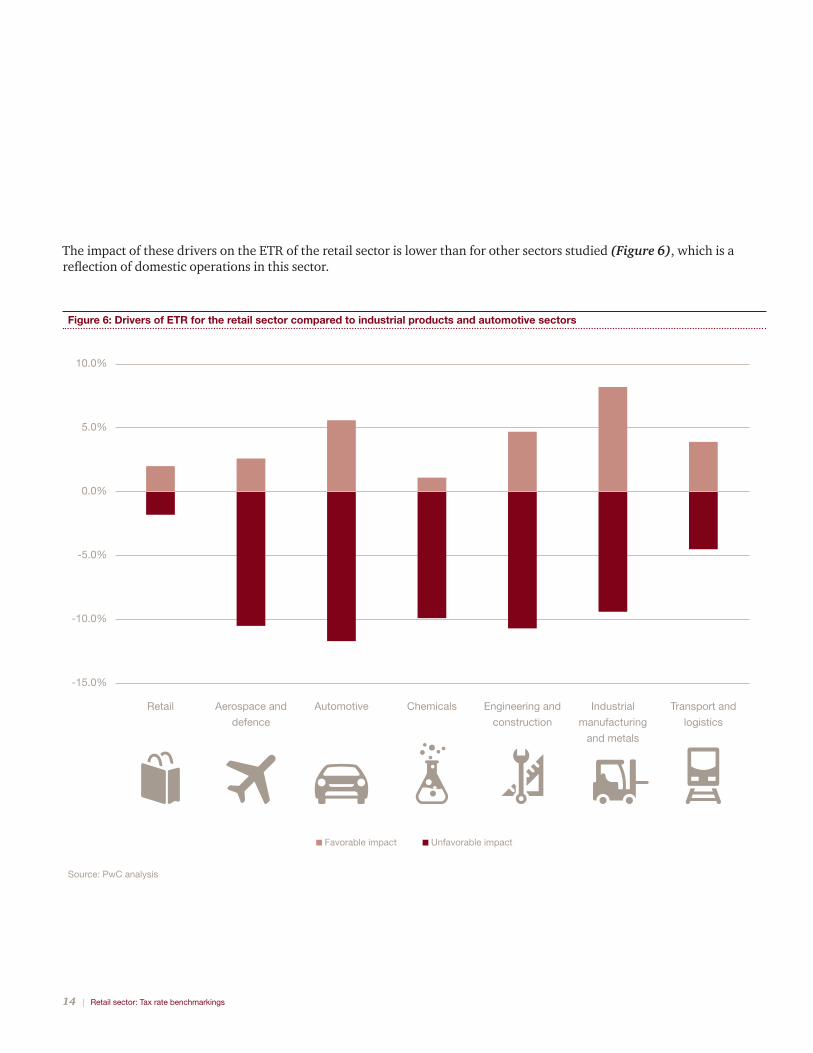
The impact of these drivers on the ETR of the retail sector is lower than for other sectors studied (Figure 6), which is a reflection of domestic operations in this sector.
Source: PwC analysis
Figure 6: Drivers of ETR for the retail sector compared to industrial products and automotive sectors
10.0%
5.0%
-5.0%
-15.0%
-10.0%
Retail Aerospace and
defence
Automotive Chemicals Engineering and
construction
Industrial
manufacturing
and metals
Transport and
logistics
Favorable impact Unfavorable impact
0.0%

PwC | 15
Narrative for drivers of ETR
The reconciling items were categorized into eight broad headings as shown below. The average impact on the ETR was based on the companies’ disclosure in their annual reports. Some items (such as tax losses and change in the valuation allowance and non-taxable income/non-deductible expenses) include both positive and negative impacts.
Change in tax rate
A reduction in the statutory rate of corporate income tax requires a revaluation of a company‘s deferred taxes. This was the least commonly reported driver, with three out of the five companies reporting a reduction in their ETR as a result, with the remaining two companies experiencing an increase in ETR.
-0.2%Tax losses and change in the valuation allowance
Descriptions included losses not available to carry forward, effect of non-recognition of deferred tax assets, change in valuation allowance, recognition of previously unrecognised deferred tax assets and utilization of tax losses. The average impact of this driver was a reduction in ETR of 0.6 percentage points.
-0.6%
Impact of foreign operations and local taxes
This item is unfavorable mainly due to the impact of domestic state taxes for US companies. Excluding this impact, there would be a reduction in average ETR of 1.8 percentage points. Overall, this driver increased average ETR by 0.5 percentage points.
0.5%Non-taxable income and non-deductible expenses
These items had descriptions such as non-taxable income, non-deductible expenses, goodwill impairment loss and effect of other permanent differences. Although this driver can be both favorable and unfavorable on an individual basis, the net impact was unfavorable, with an increase in average ETR of 0.7 percentage points.
0.7%Various other adjustments
Under this category are mostly non-recurring items, collected under one heading to avoid excessive detail. Items included the effect of equity earnings, joint venture results, warrants and call options. The overall impact was an increase in average ETR by 0.8 percentage points.
0.8%
Tax incentives
This was the most favourable driver, however was only reported by 10 companies. Items for this driver were broad with most stated as general tax or business benefits, with some companies mentioning R&D credits and domestic manufacturing deductions. This driver reduced average ETR by 0.9 percentage points.
-0.9%Other—company description
This category is for the line described as “other” in company reconciliation. No further detail was available.
-0.1%
Tax reserve adjustments
Under this category are items such as net adjustments for prior year tax accruals, audit settlements and changes in prior year estimates. Although this item increased ETR for seven companies, and decreased ETR for the remaining six companies, the net impact was no change on average ETR.
0.0%
16 | Retail sector: Tax rate benchmarkings
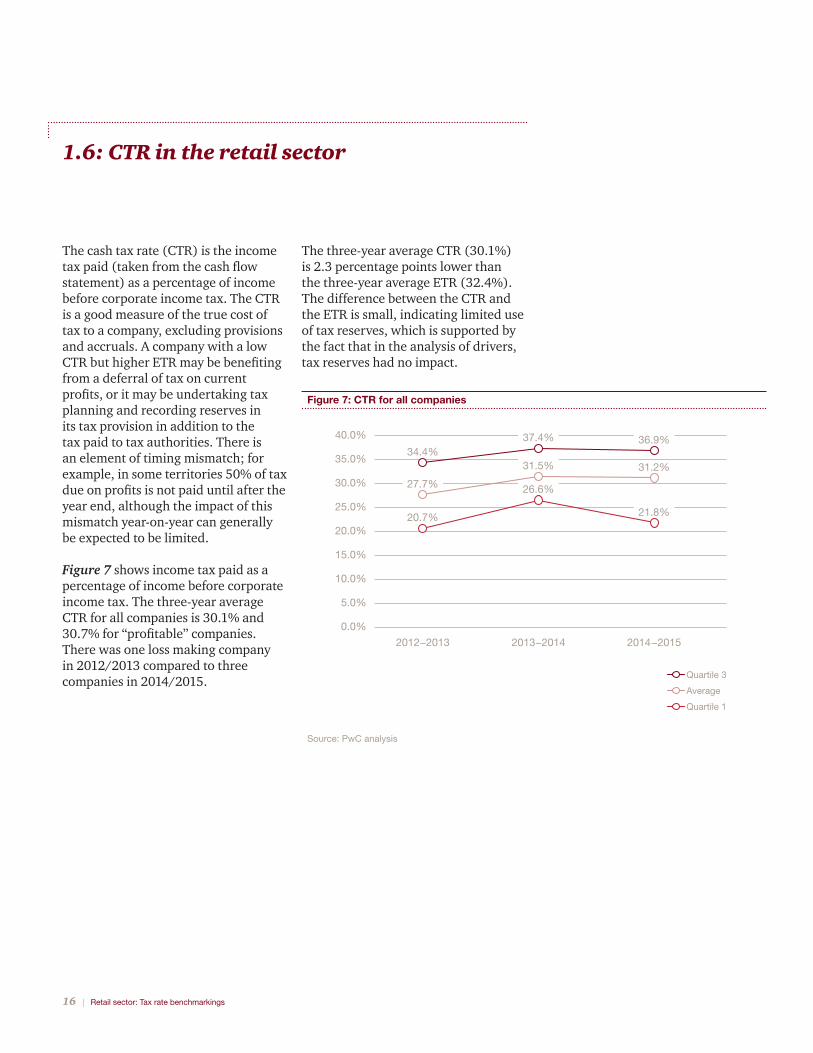
1.6: CTR in the retail sector
The three-year average CTR (30.1%) is 2.3 percentage points lower than the three-year average ETR (32.4%). The difference between the CTR and the ETR is small, indicating limited use of tax reserves, which is supported by the fact that in the analysis of drivers, tax reserves had no impact.
The cash tax rate (CTR) is the income tax paid (taken from the cash flow statement) as a percentage of income before corporate income tax. The CTR is a good measure of the true cost of tax to a company, excluding provisions and accruals. A company with a low CTR but higher ETR may be benefiting from a deferral of tax on current profits, or it may be undertaking tax planning and recording reserves in its tax provision in addition to the tax paid to tax authorities. There is an element of timing mismatch; for example, in some territories 50% of tax due on profits is not paid until after the year end, although the impact of this mismatch year-on-year can generally be expected to be limited.
Figure 7 shows income tax paid as a percentage of income before corporate income tax. The three-year average CTR for all companies is 30.1% and 30.7% for “profitable” companies. There was one loss making company in 2012/2013 compared to three companies in 2014/2015.
25.0%
35.0%
Figure 7: CTR for all companies
40.0%
2012−2013
30.0%
20.0%
15.0%
10.0%
5.0%
0.0%
2013−2014 2014 −2015
34.4%
27.7%
37.4%
31.5%
36.9%
31.2%
20.7%
26.6%
21.8%
Source: PwC analysis
Quartile 3
Average
Quartile 1
PwC | 17
2: US-headquartered retail companies
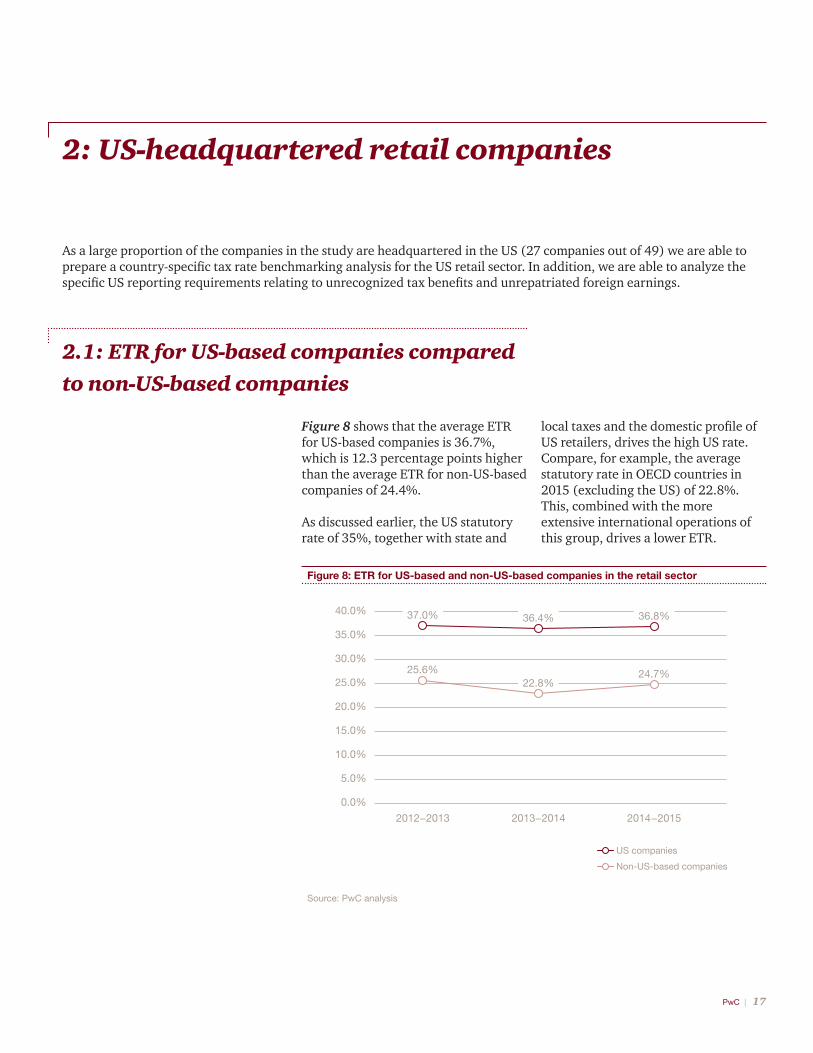
As a large proportion of the companies in the study are headquartered in the US (27 companies out of 49) we are able to prepare a country-specific tax rate benchmarking analysis for the US retail sector. In addition, we are able to analyze the specific US reporting requirements relating to unrecognized tax benefits and unrepatriated foreign earnings.
2.1: ETR for US-based companies compared to non-US-based companies
Figure 8 shows that the average ETR for US-based companies is 36.7%, which is 12.3 percentage points higher than the average ETR for non-US-based companies of 24.4%.
As discussed earlier, the US statutory rate of 35%, together with state and
local taxes and the domestic profile of US retailers, drives the high US rate. Compare, for example, the average statutory rate in OECD countries in 2015 (excluding the US) of 22.8%. This, combined with the more extensive international operations of this group, drives a lower ETR.
Source: PwC analysis
Figure 8: ETR for US-based and non-US-based companies in the retail sector
25.0%
40.0%
2012−2013
35.0%
30.0%
20.0%
15.0%
10.0%
5.0%
0.0%
2013−2014 2014 −2015
37.0%
25.6%
36.4%
22.8%
36.8%
24.7%
US companies
Non-US-based companies
18 | Retail sector: Tax rate benchmarkings
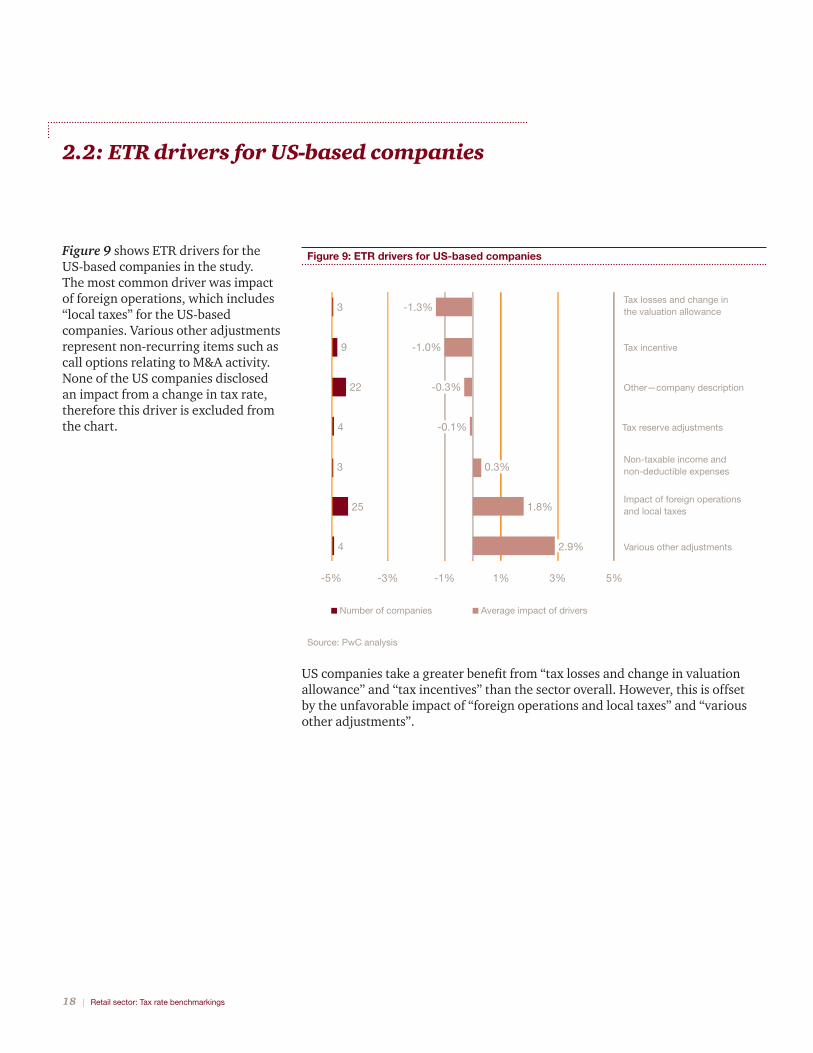
2.2: ETR drivers for US-based companies
Source: PwC analysis
Figure 9: ETR drivers for US-based companies
22
4
0.3%3
3
9
25
4
Tax losses and change in the valuation allowance
Tax incentive
Other—company description
Tax reserve adjustments
Non-taxable income and non-deductible expenses
Impact of foreign operations and local taxes
Various other adjustments
-1% 1% 3% 5%-5% -3%
-1.3%
-1.0%
-0.3%
-0.1%
1.8%
2.9%
Number of companies Average impact of drivers
Figure 9 shows ETR drivers for the US-based companies in the study. The most common driver was impact of foreign operations, which includes “local taxes” for the US-based companies. Various other adjustments represent non-recurring items such as call options relating to M&A activity. None of the US companies disclosed an impact from a change in tax rate, therefore this driver is excluded from the chart.
US companies take a greater benefit from “tax losses and change in valuation allowance” and “tax incentives” than the sector overall. However, this is offset by the unfavorable impact of “foreign operations and local taxes” and “various other adjustments”.

PwC | 19
2.3: Unrecognized tax benefits
Figure 10: Opening and closing UTBs
3,500
4,500
4,000
3,000
2,500
2,000
1,500
1,000
2012−2013
500
5,000
0
2013−2014 2014 −2015
Source: PwC analysis
TrendClosing balances
100.0% 102.2% 100.1%
Mill
ion
US
$
Accounting for uncertainty in income taxes can be complex, but there are criteria established in the US for recognizing and measuring unrecognized tax benefits (UTBs).
Figure 10 shows that total UTB balances in 25 US-based companies were stable between 2012/13 and 2014/15, using 2012/13 UTB balances as a base line. The total UTB balance for all companies in 2014/15 was $4.5 billion. On an individual company basis, the average UTB was $180 million.
We reviewed the frequency of the named drivers of UTBs that were disclosed by the companies. The small change in UTB balances compared to last year can be attributed to “additions for tax positions related to current year and prior” being offset by “reduction for tax position prior year and settlements” (Figure 11).
Figure 11: Disclosure of the drivers for UTBs
200
800
Additionsfor tax
positions of prior year
600
400
0
-200
-400
-600
-800
Additions based on tax
positions related to
current year
Reductions due to lapse of applicable
statute of limitations
Mill
ion
US
$
Reductionsfor tax
positions of prior year
Settlements Foreign currency
translation
25 24 125 25 25
Movement Companies
Source: PwC analysis

20 | Retail sector: Tax rate benchmarkings
2.4: Unrepatriated foreign earnings
US-based multinationals doing business outside the US are required to account for the tax effects (deferred tax liability) associated with remitting such earnings to the US, unless those unremitted earnings are permanently reinvested outside the US. The amount of undistributed non-US earnings has grown in recent years. We analyzed the level of unrepatriated earnings reported by the US study companies and the movement compared with last year.
Figure 12 shows the 13 companies that disclosed accumulated unrepatriated foreign earnings. The chart shows the average increase in unrepatriated earnings between 2013/14 and 2014/15 as a percentage of foreign income before tax in 2014/15. The average level of unremitted earnings in 2014/15 was $3.8 billion, however the range per company was wide, from $112 million to $23.3 billion.
Figure 12: The average increase in unrepatriated earnings between 2013 −2014 and 2014 −2015 as a percentage of foreign
income before tax
-200.0%
150.0%
100.0%
50.0%
-50.0%
-100.0%
-150.0%
0.0%
Source: PwC analysis
Each bar represents a company
-595.9%
133 4 5 6 7 8 9 10 11 121 2

PwC | 21
3: Conclusion
Public interest in how much tax is paid by large companies (and whether this is the “right” amount of tax) is growing as the need to repair public finances around the world intensifies. In the current environment, where for some companies tax is becoming a reputational issue, it is more important than ever to know the ETR of your peer group, and to assess whether your ETR is higher or lower than that group. Further, it is important to be able to explain your ETR to various stakeholders, including the general public. Transparency, not only a result of the electronic world we live in but also a result of well-orchestrated initiatives by OECD, EU and other supra-national organizations, will impact companies’ behavior.
It is possible to prepare a tailored, individual study for any company on request, comparing the key tax ratios examined in this study with those of the company. This can help management understand the company’s tax affairs in the context of relevant peers and would be useful in informing tax strategy.
22 | Retail sector: Tax rate benchmarkings
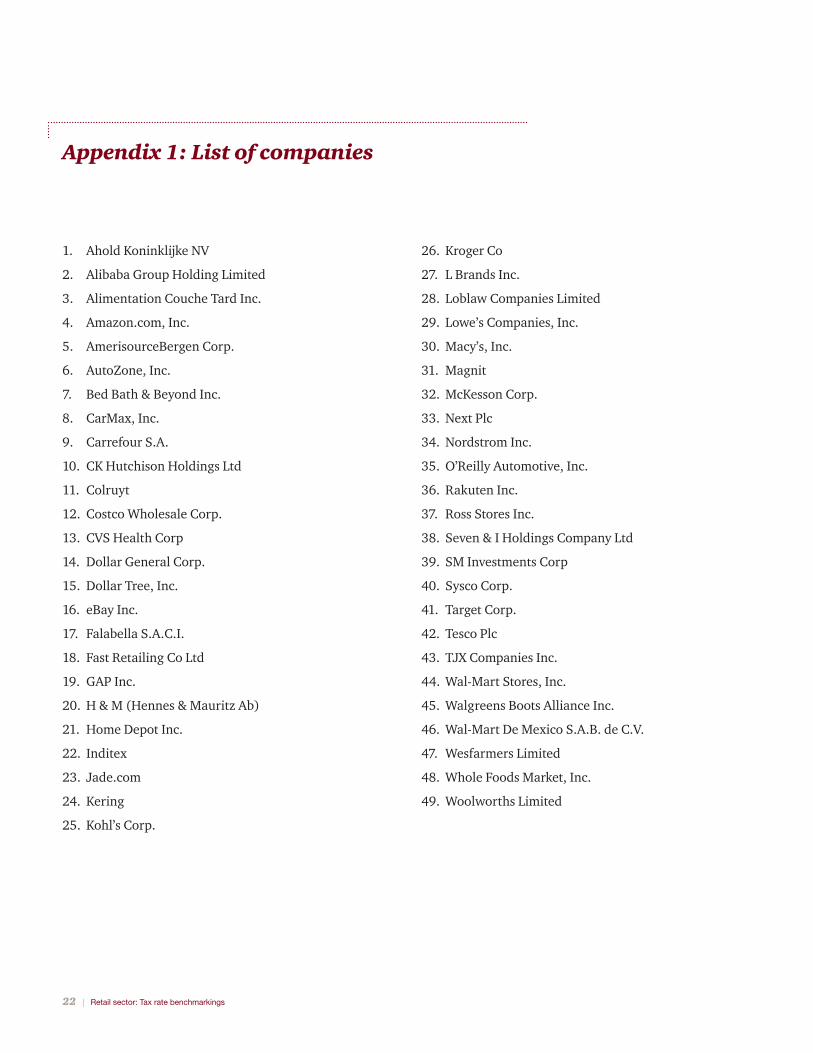
Appendix 1: List of companies
1. Ahold Koninklijke NV
2. Alibaba Group Holding Limited
3. Alimentation Couche Tard Inc.
4. Amazon.com, Inc.
5. AmerisourceBergen Corp.
6. AutoZone, Inc.
7. Bed Bath & Beyond Inc.
8. CarMax, Inc.
9. Carrefour S.A.
10. CK Hutchison Holdings Ltd
11. Colruyt
12. Costco Wholesale Corp.
13. CVS Health Corp
14. Dollar General Corp.
15. Dollar Tree, Inc.
16. eBay Inc.
17. Falabella S.A.C.I.
18. Fast Retailing Co Ltd
19. GAP Inc.
20. H & M (Hennes & Mauritz Ab)
21. Home Depot Inc.
22. Inditex
23. Jade.com
24. Kering
25. Kohl’s Corp.
26. Kroger Co
27. L Brands Inc.
28. Loblaw Companies Limited
29. Lowe’s Companies, Inc.
30. Macy’s, Inc.
31. Magnit
32. McKesson Corp.
33. Next Plc
34. Nordstrom Inc.
35. O’Reilly Automotive, Inc.
36. Rakuten Inc.
37. Ross Stores Inc.
38. Seven & I Holdings Company Ltd
39. SM Investments Corp
40. Sysco Corp.
41. Target Corp.
42. Tesco Plc
43. TJX Companies Inc.
44. Wal-Mart Stores, Inc.
45. Walgreens Boots Alliance Inc.
46. Wal-Mart De Mexico S.A.B. de C.V.
47. Wesfarmers Limited
48. Whole Foods Market, Inc.
49. Woolworths Limited
PwC | 23
Appendix 2: Source of information and analysis
Source of information
Our financial analysis was based on a number of ratios derived from publicly available information. This allowed for a sample size of 49 companies without the need to contact each company, giving us a dependable overview from which to draw our conclusions.
Companies in loss or tax benefit positions often have distorted ETRs. In a large data set, we trim the ratios as described below. In a small data set, such as the country analysis, we calculate ETRs for “profitable” companies, defined as companies that have been profitable and paid tax in each of the last three years.
Statistical analysis
Trimmed average
Our conclusions are based on a statistical analysis of the ratios. In a tax benchmarking exercise of this nature, particular ratios may be distorted because of one-off, non-recurring items. Exceptional items, for example, often attract associated tax at rates far from the statutory rate.
It was necessary to exclude these extreme values, and this was done consistently by taking a trimmed average of a particular sample. The trimmed average is the average result of the data, derived by excluding 15 percent of the data points from both the top and bottom of the data set. It is a robust estimate of the location of a sample, excluding outlying data points.
Quartiles
These record the ratio where 75 percent (upper quartile) and 25 percent (lower quartile) of the sample companies lie below these points. By displaying results in this manner, it is possible to identify the range in which the results of the majority of companies fall.
PwC | 23
www.pwc.com
This publication has been prepared for general guidance on matters of interest only, and does not constitute professional advice. You should not act upon the information contained in this publication without obtaining specific professional advice. No representation or warranty (express or implied) is given as to the accuracy or completeness of the information contained in this publication, and, to the extent permitted by law, PricewaterhouseCoopers LLP, its members, employees and agents do not accept or assume any liability, responsibility or duty of care for any consequences of you or anyone else acting, or refraining to act, in reliance on the information contained in this publication or for any decision based on it.
© 2015 PwC. All rights reserved. “PwC” and “PwC US” refer to PricewaterhouseCoopers LLP, a Delaware limited liability partnership which is a member firm of PricewaterhouseCoopers International Limited, each member firm of which is a separate legal entity. This document is for general information purposes only, and should not be used as a substitute for consultation with professional advisors. 105688-2016 br
To have a deeper conversation about this subject, please contact:
John MaxwellGlobal Retail and Consumer [email protected]
Harry DoornboschGlobal Retail and Consumer Tax [email protected]
Barbra BukovacUS Retail and Consumer Tax [email protected]
Alessandro CaridiItaly Retail and Consumer Tax [email protected]
Pascal BuehlerSwitzerland Retail and Consumer Tax [email protected]
Goldie DhamaIndia Retail and Consumer Tax [email protected]
Jenny TsaoHong Kong Retail and Consumer Tax [email protected]
Nathalie de Vernejoul France Retail and Consumer Tax Leader [email protected]
Jane WangChina Retail and Consumer Tax [email protected]
Jim WilkinsonUK Retail and Consumer Tax [email protected]
Editorial board
Mike BrewsterGlobal Retail and Consumer [email protected]
Susan EggletonGlobal Retail and Consumer [email protected]
Janet KerrTax Rate [email protected]
Lauren SparksTax Rate Benchmarking [email protected]
Duygu TurkogluTax Rate Benchmarking [email protected]


