Retailing in China (September 2004) 1. INTRODUCTION AND DEFINITIONS 1.1 Scope of the Report Retailing IMIS is Euromonitor's in-depth review and analysis of retail trade across the world. The country reports set out to summarise the key trends and developments within each of the major economies and other countries around the world, and to review the key facts and figures in the changing retail environments within each country. The retail sector varies considerably in terms of maturity, structure and patterns of distribution from country to country and continent to continent. The primary objective of this report has been to collect the relevant statistical data for each country. Changing consumer requirements and demands, shifting competitive environments, financial restructuring and the emergence of new markets within the context of socioeconomic and political change all have a significant impact upon the evolution of retail distribution. 1.2 Report Aims and Structure The retail environment is dynamic and constantly evolving. Trends observed within a country in one decade may re-emerge, either within that country some years later as the format or product life cycle turns fully, or elsewhere in the world as that trend develops. The aim of this report is to present a comprehensive survey of retail trends and developments within the country and to provide not only the statistical data showing these trends but also analysis and evaluation of those data at national level. Within all the countries of the world, there are a significant number of socioeconomic, demographic and political influences which affect not only the structure of the retail industry and performance of retailers, but also the consumer. Variations in economic and industrial maturity by country and, perhaps more importantly, by region, coupled with the changing economic fortunes of national economies and populations, combine to present a diverse picture of opportunity, change and evolution. The overall economic and business climate of a country provides the framework for any
Transcript
Retailing in China (September 2004)
1. INTRODUCTION AND DEFINITIONS1.1 Scope of the Report
Retailing IMIS is Euromonitor's in-depth review and analysis of retail trade across the world. The country reports set out to summarise the key trends and developments within each of the major economies and other countries around the world, and to review the key facts and figures in the changing retail environments within each country.
The retail sector varies considerably in terms of maturity, structure and patterns of distribution from country to country and continent to continent. The primary objective of this report has been to collect the relevant statistical data for each country. Changing consumer requirements and demands, shifting competitive environments, financial restructuring and the emergence of new markets within the context of socioeconomic and political change all have a significant impact upon the evolution of retail distribution.
1.2 Report Aims and Structure
The retail environment is dynamic and constantly evolving. Trends observed within a country in one decade may re-emerge, either within that country some years later as the format or product life cycle turns fully, or elsewhere in the world as that trend develops. The aim of this report is to present a comprehensive survey of retail trends and developments within the country and to provide not only the statistical data showing these trends but also analysis and evaluation of those data at national level.
Within all the countries of the world, there are a significant number of socioeconomic, demographic and political influences which affect not only the structure of the retail industry and performance of retailers, but also the consumer. Variations in economic and industrial maturity by country and, perhaps more importantly, by region, coupled with the changing economic fortunes of national economies and populations, combine to present a diverse picture of opportunity, change and evolution.
The overall economic and business climate of a country provides the framework for any business sector prospects; however, the retail sector is also subject to the nuances of consumer choice, net disposable incomes and discretionary spending.
Quality and availability of data varies considerably country by country, but where possible Euromonitor
has sought to overcome any shortfalls by providing estimates based upon knowledge of the market and the retail sector as well as upon government statistics and the trade press.
The contents and coverage of the country analysis is as follows:
Snapshot of Retailing
Market Background
The Retail Industry
Trends in Retail Sales
Aspects of Retailing
Retailing in the Corporate Environment
China's Leading Retailers
Retail Trade by Form of Organisation
Mixed Retailing
Retail Sectors
Alternative Selling Channels
Forecasts
Appendix 1: A-Z of Retail Distribution by Type of Outlet and Product
The timescale for historical trends is 1999-2003, while forecast trends are projected to 2008.
1.3 Glossary of Terms
In this report, Euromonitor has sought to standardise the terms applied to different retail formats and outlets, in order to facilitate cross-country comparisons. Some of the terminology used in national government statistics is vague and imprecise, which may lead to some confusion in the comparison of national variations; care should therefore be taken in applying them.
For the purposes of this report, Euromonitor has, wherever possible, excluded sales of motor cars and fuel from its definition of retail sales and excludes sales made through hotels, restaurants and foodservice outlets. Retail sales within each country are clearly defined as separate from wholesaling, except where wholesalers may be selling directly to the public, and therefore retail sales do include
direct sales and street trade unless otherwise specified.
In some countries the distinctions between retailing, wholesaling and foodservice are not always clear. Every effort has been made to separate all the different sectors and apply clear definitions within each country sector.
Summary 1 Introduction and Definitions
Affiliated retailer See "Integrated retailer"
Bazaar Vague term which may be applied to variety stores or markets
Buying group Joint purchasing organisation comprising a number of independent retail establishments. It provides the benefits of centralised buying for its associates and members. Services may include product testing, buying negotiations and organisational services
Cash-and-carry Wholesale outlets, generally selling to smaller traders
Catalogue showroom Retail outlet where goods are ordered via catalogues in the showroom
Category killer Term referring to specialist superstore outlets larger than those in the existing sector which offer a greater competitive advantage in the depth of product offer and pricing. Price advantage is generally based on economies of scale, buying power and a rigorous attention to costs
Chain store Broad term referring to shops under the same fascia, usually owned by multiples
Chemist Outlet selling OTC and prescription-only medicines, in addition to parapharmacy goods, cosmetics and toiletries and some household products
Concession Arrangement by which a retailer places a selling unit within a larger store, eg a department store
Convenience store Shop selling a wide range of goods with extended opening hours. Usually abbreviated to c-store
Co-operative Co-operatives are societies affiliated to the worldwide federation of co-operatives, founded in 1895 to promote fair trading. In each country where co-operatives function there are a number of societies controlling a series of retail outlets
C-store See "Convenience store"
CTN Confectioner, tobacconist and newsagent
Department store A store with a sales area of at least 2,500 sq m, selling mainly non-food merchandise and at least five lines in different departments. They are usually arranged over several floors
Direct response Purchase of goods as a result of an advertisement or postal leaflet
Direct selling The process whereby independent business people, or distributors, market and sell products directly to the consumer without having to make significant investments in the infrastructure normally associated with the establishment of traditional - bricks-and-mortar retail outlets. Multi-level direct selling companies do not own retail outlets, nor do their distributors, and do not generally advertise or promote their products in the traditional retail environment. There are three main modes of direct selling: 1) Person-to-person: involves face-to-face sales by a company representative who sells directly to the consumer. Includes door-to-door selling and telesales. 2) Party-plan: involves one-to-many sales by a company representative who arranges sales "parties". 3) Multi-level (also known as "multi-level marketing", "network marketing"): is a system of selling in which agents employ other agents and they in turn employ agents, and so on. Other related terms for such schemes include "pyramid selling".
Discount store See "Dollar retailer"
Discount superstore Large retail unit (up to 9,000 sq m) offering goods direct from the manufacturer at heavily discounted prices. Such outlets typically carry between 5,000 and 10,000 product lines
Dollar retailer Traditionally, dollar retailers started out as general merchandise stores that retailed its products under one dollar or a similar price point in the local currency. Dollar retailers as a concept have developed more recently into the broader group of value retailers (See "Value retailer")
Drugstore Non-dispensing outlet mainly selling toiletries, parapharmacy and OTC healthcare products. Drugstores in Spain (droguerías) also sell household cleaning agents, paint, DIY products and sometimes pet products and services such as photo processing
Duty-free Sale of goods (typically drinks, tobacco, cosmetics and luxury goods) in duty-free areas (often at airports or on
board ships), net of purchase taxes levied in a particular country
EFTPoS Electronic funds transfer at point of sale
EPoS Electronic point of sale systems
Franchise Retail outlet affiliated to a central retail company. The shops use the logo of the retailer in return for a fee or profit share. Common in high growth markets and as a method of market entry
Garden centre Out-of-town outlet selling garden products, plants and equipment
Gas station See "Service station"
General store Term generally used for small, rural shops
Grocer Food business specialising in packaged groceries, where food accounts for at least 50% of total retail sales
G-store Forecourt retailer
Hard discounter First introduced by Aldi in Germany, and also known as limited-line discounters. Stores are typically 300-900 sq m and stock less than 1,000 product lines, largely in packaged groceries. Goods are mainly private label or budget brands
Homeshopping Mail order, television shopping and other direct mail activities. The purchase of goods in direct response to an advertisement or promotion through a mail item, printed catalogue, TV shopping programme, or Internet catalogue whereby the order is placed and payment is made by phone, by post or through other media, such as digital TV
Hypermarket Store with a sales area of over 2,500 sq m, with at least 35% of selling space devoted to non-food. Frequently on out-of-town sites or as the anchor store in a shopping centre
Independent A retailer owning and operating one or more (but fewer than 10) retail outlets, but not affiliated to any other business; mainly family business or partnership
Integrated retailer An independent retail establishment linked to a central buying organisation. Includes voluntary chains, buying groups and franchised outlets. Also called affiliated retailers
Internet retailing The purchase of goods advertised, promoted or offered for purchase through a web medium whereby payment is made online. This includes orders placed through the web for which payment is then made through a store
card or an online credit account subsequent to delivery. Any mode of payment may be used, including postal cheque, direct debit, standing order and other banking tools
Kiosk External selling point located in streets or parks. They mainly sell confectionery, newspapers and tobacco. Not to be confused with Mobile
Large mixed retailer Mainly refers to department and variety store operators
Mail order Purchase of goods through the postal system, either in direct response to an advertisement or mail item, or via a catalogue
Mass Merchandising Department Store/Discount Department Store
Type of department store that usually: (1) conveys the image of a high-volume, fast-turnover outlet selling a variety of merchandise for less than conventional prices; (2) provide centralised checkout service; and (3) provide minimal customer assistance within each department.
Market Temporary sales point usually located in street areas
Multiple Private retail company operating a number of branches, usually with a degree of specialisation in a particular commodity range. The number of branches required to be termed a multiple varies from country to country but is usually 10 or more. If a major multinational multiple is operating in the country, this should be treated as a multiple, even if there are very few outlets. Multiples usually trade with the same fascia.
Parapharmacy Healthcare products sold alongside OTC and prescription medicines and which are complementary. In some countries refers to non-dispensing pharmacy
Party plan Method of distribution by which goods are sold and demonstrated at a hosted party. See "Direct selling"
Perfumery Outlet specialising in premium cosmetic and toiletry lines
Pharmacy Specialist outlet retailing largely OTC and prescription-only medicines, as well as a small selection of parapharmacy goods
Private label Goods produced directly for the retailer and marketed with varying levels of retailer brand identity
Self-service store Covers any type of store selling by self-selection. Usually equipped with cash registers at checkouts
Service station Roadside establishment selling fuel and car aftermarket
products to the motorist, and, increasingly, with a convenience store attached
Shopping centre Purpose-built, usually indoor and multi-levelled shopping precinct with car park and a range of large stores and specialist shops. Called shopping malls in the US
Single-line retailer Retailer who specialises in a particular range of commodities
Soft discounter Slightly larger than hard discounters, and also known as extended-range discounters. Stores typically stock 1,500-4,000 product lines. As well as private label and budget brands, stores commonly carry leading brands at discounted prices
Specialist/speciality Chain of stores trading under the same fascia and specialising in a particular type of merchandise or single product which may be food or non-food. Also known as niche retailers
Superette Self-service food outlet with a selling area of up to 400 sq m
Supermarket The most widely used definition is that of a store with a selling area of 400-2,500 sq m, selling at least 70% foodstuffs and everyday commodities
Superstore Store with a sales area of at least 2,500 sq m, generally devoted to non-food, eg DIY
Teleshopping Sales direct to the consumer via TV broadcasting, by-passing conventional retail outlets and using telephone or fax ordering and electronic funds transfer
Value retailer Value retailers offering low prices, often at eye-catching price points (such as US$1.99) catering mainly to low-income consumers and speciality, niche or smaller packaging sizes. Value retailers are the fastest growing category within the larger discount stores outlet type
Variety store Usually located on one floor and offering a limited assortment of fast-moving goods on a self-service basis. Normally at least 1,500 sq m, and giving priority to textile goods
Vending Automatic retailing. The sale of products and services at an unattended point of sale through a machine operated by introducing coins, bank notes, payment cards, tokens or other means of cashless payment
Vending machine Automatic machine in a public place selling a limited range of low-price goods eg confectionery, tobacco
commodities - especially food - to smaller retail outlets. Affiliation to such a group (also known as a "symbol") permits the small trader such as the local grocery shop to buy at better prices, and benefit from a corporate image and joint advertising
Source: Euromonitor
1.4 Research Programme
Main components
Retailing IMIS has been compiled following an extensive research programme completed during 2003/2004, comprising two main components:
A detailed quantitative and qualitative programme of research.
Report analysis and compilation.
Sources and methodology
The retail distribution industry is well documented in government statistics, by trade associations and numerous other organisations involved in research, development and regulation in the retail distributive trades. Extensive use has been made of these sources in compiling the data for this report with the emphasis on using national sources only. These include:
National statistical offices.
Trade associations concerned with the retail trade.
Banks and government departments publishing national economic data and information on trends and developments.
Leading retail organisations for financial data and information on sector specific trends and developments.
Major retailers for company specific financial performance data.
Retail trade journals, newspapers and other trade sources.
In addition to collecting this data, Euromonitor has made use of its own extensive retail and market information database as well as a wide range of its own reports published in recent years. Each country section has been written by an analyst with specific retail and/or country expertise, often
based in the country or region itself.
The depth and extent of each country section is dependent on a number of factors. Broadly speaking, countries with a highly developed and mature retail industry and economy will be surveyed in most detail within this report. These include countries such as the US, France and Japan. Countries with smaller and less developed economies therefore are analysed at a lower level of detail, which also reflects the availability of reliable statistics. These include countries such as Switzerland and New Zealand, as well as the emerging markets of Asia, Latin America and Eastern Europe.
In preparing the analysis and data for each country chapter, Euromonitor has made every attempt to use standard terms as defined in the glossary above. Care should be taken when applying these terms, however, as some definitions may vary from one country to another.
All tables included within this report are sourced as appropriate. In instances where figures have been calculated or estimated by Euromonitor, the source is accredited as such.
Disclaimer
The compilation of a country report of this type involves extracting complex statistical data from numerous sources in different languages. The editors have made every attempt to ensure accuracy and reliability but Euromonitor cannot be held responsible for omissions or errors.
The forecasts given are estimates based on the most reliable information available during 2003 and do not take into account the effects of subsequent events. They cannot be guaranteed as accurate predictions of the future.
1.1 Scope of the Report
Retailing IMIS is Euromonitor's in-depth review and analysis of retail trade across the world. The country reports set out to summarise the key trends and developments within each of the major economies and other countries around the world, and to review the key facts and figures in the changing retail environments within each country.
The retail sector varies considerably in terms of maturity, structure and patterns of distribution from country to country and continent to continent. The primary objective of this report has been to collect the relevant statistical data for each country. Changing consumer requirements and demands, shifting competitive environments, financial restructuring and the emergence of new markets within the context of socioeconomic and political change all have a significant impact upon the evolution of retail distribution.
1.2 Report Aims and Structure
The retail environment is dynamic and constantly evolving. Trends observed within a country in one decade may re-emerge, either within that country some years later as the format or product life cycle turns fully, or elsewhere in the world as that trend develops. The aim of this report is to present a comprehensive survey of retail trends and developments within the country and to provide not only the statistical data showing these trends but also analysis and evaluation of those data at national level.
Within all the countries of the world, there are a significant number of socioeconomic, demographic and political influences which affect not only the structure of the retail industry and performance of retailers, but also the consumer. Variations in economic and industrial maturity by country and, perhaps more importantly, by region, coupled with the changing economic fortunes of national economies and populations, combine to present a diverse picture of opportunity, change and evolution.
The overall economic and business climate of a country provides the framework for any business sector prospects; however, the retail sector is also subject to the nuances of consumer choice, net disposable incomes and discretionary spending.
Quality and availability of data varies considerably country by country, but where possible Euromonitor has sought to overcome any shortfalls by providing estimates based upon knowledge of the market and the retail sector as well as upon government statistics and the trade press.
The contents and coverage of the country analysis is as follows:
Snapshot of Retailing
Market Background
The Retail Industry
Trends in Retail Sales
Aspects of Retailing
Retailing in the Corporate Environment
China's Leading Retailers
Retail Trade by Form of Organisation
Mixed Retailing
Retail Sectors
Alternative Selling Channels
Forecasts
Appendix 1: A-Z of Retail Distribution by Type of Outlet and Product
The timescale for historical trends is 1999-2003, while forecast trends are projected to 2008.
1.3 Glossary of Terms
In this report, Euromonitor has sought to standardise the terms applied to different retail formats and outlets, in order to facilitate cross-country comparisons. Some of the terminology used in national government statistics is vague and imprecise, which may lead to some confusion in the comparison of national variations; care should therefore be taken in applying them.
For the purposes of this report, Euromonitor has, wherever possible, excluded sales of motor cars and fuel from its definition of retail sales and excludes sales made through hotels, restaurants and foodservice outlets. Retail sales within each country are clearly defined as separate from wholesaling, except where wholesalers may be selling directly to the public, and therefore retail sales do include direct sales and street trade unless otherwise specified.
In some countries the distinctions between retailing, wholesaling and foodservice are not always clear. Every effort has been made to separate all the different sectors and apply clear definitions within each country sector.
Summary 1 Introduction and Definitions
Affiliated retailer See "Integrated retailer"
Bazaar Vague term which may be applied to variety stores or markets
Buying group Joint purchasing organisation comprising a number of independent retail establishments. It provides the benefits of centralised buying for its associates and members. Services may include product testing, buying negotiations and organisational services
Cash-and-carry Wholesale outlets, generally selling to smaller traders
Catalogue showroom Retail outlet where goods are ordered via catalogues in the showroom
Category killer Term referring to specialist superstore outlets larger than those in the existing sector which offer a greater competitive advantage in the depth of product offer and
pricing. Price advantage is generally based on economies of scale, buying power and a rigorous attention to costs
Chain store Broad term referring to shops under the same fascia, usually owned by multiples
Chemist Outlet selling OTC and prescription-only medicines, in addition to parapharmacy goods, cosmetics and toiletries and some household products
Concession Arrangement by which a retailer places a selling unit within a larger store, eg a department store
Convenience store Shop selling a wide range of goods with extended opening hours. Usually abbreviated to c-store
Co-operative Co-operatives are societies affiliated to the worldwide federation of co-operatives, founded in 1895 to promote fair trading. In each country where co-operatives function there are a number of societies controlling a series of retail outlets
C-store See "Convenience store"
CTN Confectioner, tobacconist and newsagent
Department store A store with a sales area of at least 2,500 sq m, selling mainly non-food merchandise and at least five lines in different departments. They are usually arranged over several floors
Direct response Purchase of goods as a result of an advertisement or postal leaflet
Direct selling The process whereby independent business people, or distributors, market and sell products directly to the consumer without having to make significant investments in the infrastructure normally associated with the establishment of traditional - bricks-and-mortar retail outlets. Multi-level direct selling companies do not own retail outlets, nor do their distributors, and do not generally advertise or promote their products in the traditional retail environment. There are three main modes of direct selling: 1) Person-to-person: involves face-to-face sales by a company representative who sells directly to the consumer. Includes door-to-door selling and telesales. 2) Party-plan: involves one-to-many sales by a company representative who arranges sales "parties". 3) Multi-level (also known as "multi-level marketing", "network marketing"): is a system of selling in which agents employ other agents and they in turn employ agents, and so on. Other related terms for such
schemes include "pyramid selling".
Discount store See "Dollar retailer"
Discount superstore Large retail unit (up to 9,000 sq m) offering goods direct from the manufacturer at heavily discounted prices. Such outlets typically carry between 5,000 and 10,000 product lines
Dollar retailer Traditionally, dollar retailers started out as general merchandise stores that retailed its products under one dollar or a similar price point in the local currency. Dollar retailers as a concept have developed more recently into the broader group of value retailers (See "Value retailer")
Drugstore Non-dispensing outlet mainly selling toiletries, parapharmacy and OTC healthcare products. Drugstores in Spain (droguerías) also sell household cleaning agents, paint, DIY products and sometimes pet products and services such as photo processing
Duty-free Sale of goods (typically drinks, tobacco, cosmetics and luxury goods) in duty-free areas (often at airports or on board ships), net of purchase taxes levied in a particular country
EFTPoS Electronic funds transfer at point of sale
EPoS Electronic point of sale systems
Franchise Retail outlet affiliated to a central retail company. The shops use the logo of the retailer in return for a fee or profit share. Common in high growth markets and as a method of market entry
Garden centre Out-of-town outlet selling garden products, plants and equipment
Gas station See "Service station"
General store Term generally used for small, rural shops
Grocer Food business specialising in packaged groceries, where food accounts for at least 50% of total retail sales
G-store Forecourt retailer
Hard discounter First introduced by Aldi in Germany, and also known as limited-line discounters. Stores are typically 300-900 sq m and stock less than 1,000 product lines, largely in packaged groceries. Goods are mainly private label or budget brands
Homeshopping Mail order, television shopping and other direct mail activities. The purchase of goods in direct response to an advertisement or promotion through a mail item, printed catalogue, TV shopping programme, or Internet
catalogue whereby the order is placed and payment is made by phone, by post or through other media, such as digital TV
Hypermarket Store with a sales area of over 2,500 sq m, with at least 35% of selling space devoted to non-food. Frequently on out-of-town sites or as the anchor store in a shopping centre
Independent A retailer owning and operating one or more (but fewer than 10) retail outlets, but not affiliated to any other business; mainly family business or partnership
Integrated retailer An independent retail establishment linked to a central buying organisation. Includes voluntary chains, buying groups and franchised outlets. Also called affiliated retailers
Internet retailing The purchase of goods advertised, promoted or offered for purchase through a web medium whereby payment is made online. This includes orders placed through the web for which payment is then made through a store card or an online credit account subsequent to delivery. Any mode of payment may be used, including postal cheque, direct debit, standing order and other banking tools
Kiosk External selling point located in streets or parks. They mainly sell confectionery, newspapers and tobacco. Not to be confused with Mobile
Large mixed retailer Mainly refers to department and variety store operators
Mail order Purchase of goods through the postal system, either in direct response to an advertisement or mail item, or via a catalogue
Mass Merchandising Department Store/Discount Department Store
Type of department store that usually: (1) conveys the image of a high-volume, fast-turnover outlet selling a variety of merchandise for less than conventional prices; (2) provide centralised checkout service; and (3) provide minimal customer assistance within each department.
Market Temporary sales point usually located in street areas
Multiple Private retail company operating a number of branches, usually with a degree of specialisation in a particular commodity range. The number of branches required to be termed a multiple varies from country to country but is usually 10 or more. If a major multinational multiple is operating in the country, this should be treated as a multiple, even if there are very few outlets. Multiples usually trade with the same fascia.
Parapharmacy Healthcare products sold alongside OTC and prescription medicines and which are complementary. In some countries refers to non-dispensing pharmacy
Party plan Method of distribution by which goods are sold and demonstrated at a hosted party. See "Direct selling"
Perfumery Outlet specialising in premium cosmetic and toiletry lines
Pharmacy Specialist outlet retailing largely OTC and prescription-only medicines, as well as a small selection of parapharmacy goods
Private label Goods produced directly for the retailer and marketed with varying levels of retailer brand identity
Self-service store Covers any type of store selling by self-selection. Usually equipped with cash registers at checkouts
Service station Roadside establishment selling fuel and car aftermarket products to the motorist, and, increasingly, with a convenience store attached
Shopping centre Purpose-built, usually indoor and multi-levelled shopping precinct with car park and a range of large stores and specialist shops. Called shopping malls in the US
Single-line retailer Retailer who specialises in a particular range of commodities
Soft discounter Slightly larger than hard discounters, and also known as extended-range discounters. Stores typically stock 1,500-4,000 product lines. As well as private label and budget brands, stores commonly carry leading brands at discounted prices
Specialist/speciality Chain of stores trading under the same fascia and specialising in a particular type of merchandise or single product which may be food or non-food. Also known as niche retailers
Superette Self-service food outlet with a selling area of up to 400 sq m
Supermarket The most widely used definition is that of a store with a selling area of 400-2,500 sq m, selling at least 70% foodstuffs and everyday commodities
Superstore Store with a sales area of at least 2,500 sq m, generally devoted to non-food, eg DIY
Teleshopping Sales direct to the consumer via TV broadcasting, by-passing conventional retail outlets and using telephone
or fax ordering and electronic funds transfer
Value retailer Value retailers offering low prices, often at eye-catching price points (such as US$1.99) catering mainly to low-income consumers and speciality, niche or smaller packaging sizes. Value retailers are the fastest growing category within the larger discount stores outlet type
Variety store Usually located on one floor and offering a limited assortment of fast-moving goods on a self-service basis. Normally at least 1,500 sq m, and giving priority to textile goods
Vending Automatic retailing. The sale of products and services at an unattended point of sale through a machine operated by introducing coins, bank notes, payment cards, tokens or other means of cashless payment
Vending machine Automatic machine in a public place selling a limited range of low-price goods eg confectionery, tobacco
Voluntary chain Wholesaler-owned buying organisation distributing basic commodities - especially food - to smaller retail outlets. Affiliation to such a group (also known as a "symbol") permits the small trader such as the local grocery shop to buy at better prices, and benefit from a corporate image and joint advertising
1.4 Research Programme
Main components
Retailing IMIS has been compiled following an extensive research programme completed during 2003/2004, comprising two main components:
A detailed quantitative and qualitative programme of research.
Report analysis and compilation.
Sources and methodology
The retail distribution industry is well documented in government statistics, by trade associations and numerous other organisations involved in research, development and regulation in the retail distributive trades. Extensive use has been made of these sources in compiling the data for this report with the emphasis on using national sources only. These include:
National statistical offices.
Trade associations concerned with the retail trade.
Banks and government departments publishing national economic data and information on trends and developments.
Leading retail organisations for financial data and information on sector specific trends and developments.
Major retailers for company specific financial performance data.
Retail trade journals, newspapers and other trade sources.
In addition to collecting this data, Euromonitor has made use of its own extensive retail and market information database as well as a wide range of its own reports published in recent years. Each country section has been written by an analyst with specific retail and/or country expertise, often based in the country or region itself.
The depth and extent of each country section is dependent on a number of factors. Broadly speaking, countries with a highly developed and mature retail industry and economy will be surveyed in most detail within this report. These include countries such as the US, France and Japan. Countries with smaller and less developed economies therefore are analysed at a lower level of detail, which also reflects the availability of reliable statistics. These include countries such as Switzerland and New Zealand, as well as the emerging markets of Asia, Latin America and Eastern Europe.
In preparing the analysis and data for each country chapter, Euromonitor has made every attempt to use standard terms as defined in the glossary above. Care should be taken when applying these terms, however, as some definitions may vary from one country to another.
All tables included within this report are sourced as appropriate. In instances where figures have been calculated or estimated by Euromonitor, the source is accredited as such.
Disclaimer
The compilation of a country report of this type involves extracting complex statistical data from numerous sources in different languages. The editors have made every attempt to ensure accuracy and reliability but Euromonitor cannot be held responsible for omissions or errors.
The forecasts given are estimates based on the most reliable information available during 2003 and do not take into account the effects of subsequent events. They cannot be guaranteed as accurate predictions of the future.
2. SNAPSHOT OF RETAILING
Fragmented industry and low "Return On Equity" (ROE)
According to official sources, China's top 100 retailers account for just about 8% of the market in the year ended 2002 and has not fared much better in 2003. Their average ROE has fallen to 2% at current prices in 2003 and these retailers are now under pressure to expand into chain stores and discount stores.
Over 300 foreign retailers are in China already, and they are set to expand with China's deregulation of the sector. Local and foreign entrants are thought likely to exacerbate the overcapacity situation. There are major hurdles to the consolidation of domestic retailers. Increasingly, acquirers are having to pay cash, rather than equity to convince their targets to accept such takeover offers.
Suppliers better off at retailers' expense
Sources indicate that in China's retailing industry, the balance of power is in favour of wholesalers. This is partly because the retail industry is fragmented and increasingly, savvy suppliers are carrying out their own direct distribution to consumers.
The birth of the middle class in China
The emergence of the middle class in China is a much discussed topic among retail operators, particularly foreigners. Based on a local market survey, the middle class are those with an annual income of between RMB25,000 to 30,000. However currently in China, most people still fall within the lower end of this segment.
China – not a single market due to regional differences
There are no truly "national" brands in China, as provincial/city governments want to protect their local businesses. Also, double-taxation is another key barrier to retailers expanding across provinces and cities. However, the national government is likely to amend tax regulations in the medium term to allow businesses to expand into other regions within China.
Urbanisation continues to drive retail sales growth in 2003
Increasing the pace of urbanisation is one of the government's policies in maintaining the growth in consumption. To support this process, the State Economic Trade Committee (SETC) states the government will increase the salaries of low to middle-income earners in urban areas to further encourage spending.
China's retailing industry growth tops in Asia in 2003
According to the Asia retail industry Index Research Report from Mastercard International, in the second half of 2003, the Asia retail market has presented an aggressive development situation, with China's annual growth ranked first among 12 major countries in Asia. It has to be understood,
however, that China too suffered arguably the most from the outbreak of SARS, and so was growing from a lower base than its neighbours. Its rebound though confirmed to observers that China's economic engines are forging ahead unabated.
Outlook for 2004 and beyond
Most significantly, retailers will tend to realise that with continued growth comes increasing strength in its dealings with suppliers and manufacturers. In China, more and more retailers are increasingly finding that an over-supply of goods and services is occurring, at least for the domestic market. Bargaining power for local retailers will likely increase over time especially as they get bigger, vis à vis their local suppliers, which when managed sensibly can possibly lead to increased margins for retailers and/or lower retail prices for consumers.
Staying ahead will become more tricky
In the retailing industry of other economies, mergers and acquisitions (M&A) continue to be the exception rather than the norm. This is not true for China, where the sheer size of the market and the existing high level of fragmentation render most industries, not least the retailing industry to be a hotbed for such M&A activity. It is likely that the competitive landscape for retailers will be highly unpredictable as continued M&A activity will likely cause great fluctuations in a retailer's relative standing to its direct competitors.
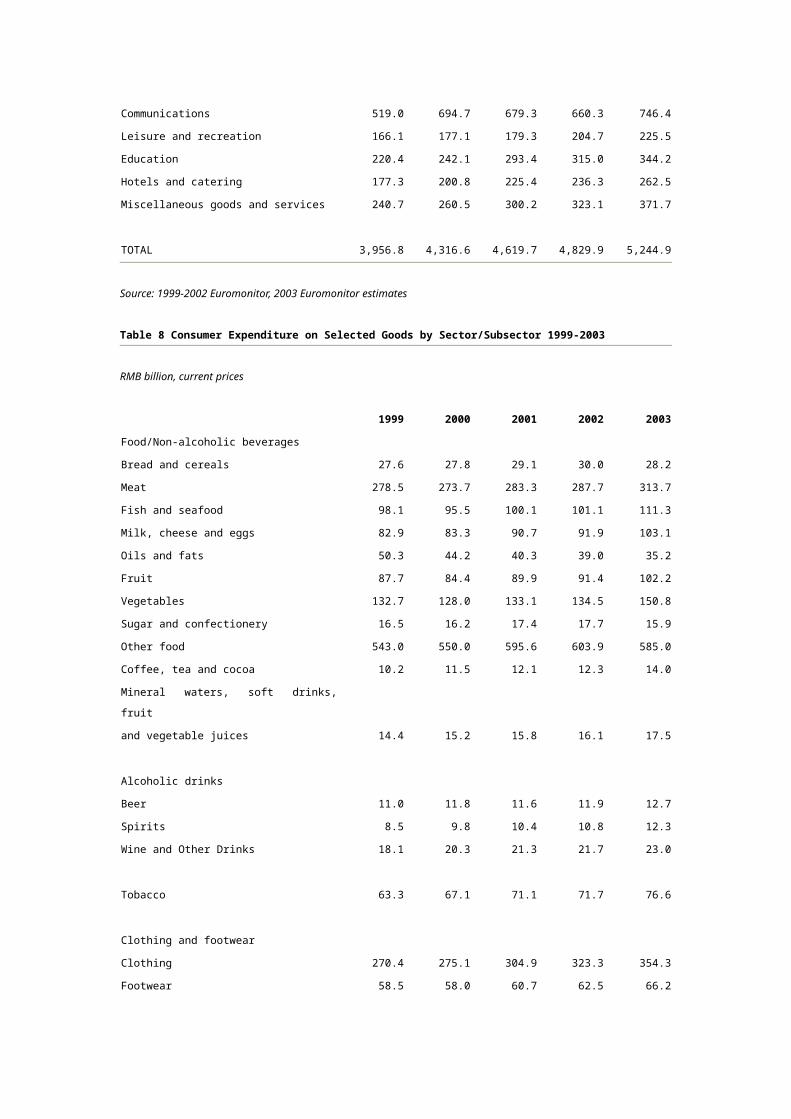
Specialist multiples in durable goods and health and beauty products especially are expected to grow most dynamically either at the expense of smaller independents, or through significant M&A activity. In the more developed cities of China, convenience stores appear to be best positioned for dynamic growth, tempering the expected growth of large-scale retail formats such as hypermarkets.
Foreign retailers arriving from (almost) all continents
With the entry to WTO by China, the speed of foreign-owned retailers' entry into China will be further accelerated in the short term especially. Many foreign-owned firms are making almost panicky entries into China, in the fear of being left behind. This stampede has resulted in foreign-owned firms from not only developed countries in Europe and North America, but also neighbouring Asian economies such as Hong Kong, Singapore and Malaysia.
Helping local retailers become more competitive
Competition between retailers is expected to take on a slightly different dimension in the forecast period. Specialist supply chain technologies, customer relationship management (CRM) software and best practices from global logistics companies, among others are likely to be embraced by an increasing number of retailers. To stimulate local players' interest in such technology and knowledge, the State Department of China has even decided to use public debt capital to fund fledgling projects for interested local players.
3. MARKET BACKGROUND
3.1 Macroeconomic Performance – Indicators
In 2003, although under the threat of SARS, China GDP's growth remained high at 13.3%, with total GDP reaching RMB11,888 billion. The population of China was 1.3 billion in 2003, which means GDP per capita of RMB9,100 (US$1,100).
According to industry sources, every retail model has some requirement in terms of GDP. The requirement of supermarkets is a personal GDP of US$800 and convenience stores at US$3,000. From the total national GDP level, it would appear that China entered the supermarket development period in 2001.
The unbalanced development of China's economy needs to be considered. Convenience stores start to appear in cities once GDP per capita reaches US$3,000. In the East and central cities, personal GDP has met the requirements for convenience stores, and such stores have been established. In Shanghai city centre, hypermarkets have entered a relatively saturation period, while convenience stores began to appear in 2001. The current focus of competition is among hypermarkets; the next will be among convenience stores and speciality stores.
China recorded a good economic performance in 2003. Consumer expenditure increased 8.6% compared to 2002, with average consumer expenditure per capita reaching RMB4,409 in 2003.
Note: Population figures are estimates at 1 January
3.2 Macroeconomic Performance – Price Inflation
The Chinese economy improved year to year from 1999 to 2003. While interest rates were kept at record low levels by the central bank, China's consumer price index registered an increase by 3.4 percentage point in 2003 compared to 1999. The impact of inflation on retail sales over the review period was limited as consumption was encouraged by the healthy growth of GDP and the improvement in standards of living in general.
As the biggest sector amongst all consumer goods, the price inflation of food can further impact on the price inflation of other goods. From 1999 to 2003, the price of food increased annually with year-on-year growth ranging from 0.7% to 2.3%. According to the Chinese State Government latest policy formulation, price inflation of food is geared towards an even higher growth around 5-7% in 2004. The objective behind this new policy is to increase the nation's farmers' income. This increase from the agricultural sector is expected to create a ripple effect throughout the rest of the food sector.
Housing saw the largest climb in price inflation of 23% from 1999 to 2003. In some big cities like Shanghai, Beijing, Shenzhen, the price inflation of housing surpassed the national average to hit 50%. The main reason behind this dramatic price inflation is due to the rapid economy development in China. With more and more foreign investment entering the China market, China has registered an influx of foreign employees who choose to settle in China, with most of them acquiring houses of their own. For example, in Shanghai, the average house price was 75% higher than the house price in 1999. 45% of the house buyers in Shanghai were foreigners, mostly from Hong Kong and Taiwan who reckoned Shanghai to have similar standard of living and lifestyle with their own countries, at lower living costs.
In contrast, household goods and services witnessed a decline in inflation of 4.2% from 1999 to 2003 due to fiery competition within this sector.
The price of communications recorded no changes for 3 years (1999-2001), until fierce competition between communication operators took place from 2002 to 2003. This aggressive scramble for the largest possible share of the market came about with China opening its communication market after its entry into WTO. The communications operators, especially mobile phone operators employed many kinds of promotion to absorb loyal consumer with multiple-years contract. Communication operators had since then reduced their price as part of their strategy to gain a foothold in the market.
The price of clothing and footwear dropped in 2000 due to the overproduction of clothing and footwear; production levels fell and better reflected demand from 2001 to 2003.
In transport sector, prices fell about 4% from 1999 to 2003, especially in flight transport sector. The price of taxi, city bus and train are almost fixed by the government. But with the current price inflation of fuel during the review period, the price of airfares is expected to increase with a high percentage in 2004.
Table 2 Consumer Price Indices by Classification Group 1999-2003
1999 = 100.0
1999 2000 2001 2002 2003
ALL PRICES 100.0 101.5 102.7 101.9 103.4
Food 100.0 102.3 103.6 104.3 105.9
Alcoholic drinks 100.0 103.5 106.8 109.0 110.5
Tobacco 100.0 100.8 103.0 104.0 106.0
Clothing and footwear 100.0 98.0 99.0 100.2 101.5
Housing 100.0 103.0 110.8 118.9 123.0
Household fuels 100.0 100.6 102.0 103.0 99.0
Household goods and services 100.0 99.0 98.0 96.4 95.8
Health goods and medical services 100.0 102.0 103.5 105.0 106.5
Transport 100.0 98.0 97.0 96.0 96.0
Communications 100.0 100.0 100.0 96.5 90.0
Leisure and education 100.0 101.0 101.5 103.7 104.8
3.3 Macroeconomic Performance – Retail Sales as a %
of GDP and Consumer Expenditure
The retail industry is an important component driving China's GDP. In China, retail sales alone made up more than 37% of GDP every year from 1999 to 2003. On an anecdotal perspective, as the growth of retail sales proxies consistently in regards to GDP growth over the last 5 years, a certain level of consistency may be extrapolated into the near future.
Retail sales' percentage of consumer expenditure over the review period hovered between 79% to 85% of GDP. However, it is noteworthy that the disparate consumption patterns of consumers from
different areas in China varies across product sectors.
In China, most of the local consumers come from the low income band. To them, the most important thing is food and commodity and consumption of these goods will make up more than 90% of their total consumer expenditure. In big cities like Shanghai, Beijing and Shenzhen however, the consumption of food and commodity is around 35% of consumer expenditure. Others transaction hot spots are house and car or entertainment.
Table 3 Retail Sales as a % of GDP and Consumer Expenditure 1999-2003
%
1999 2000 2001 2002 2003
Retail sales as % of GDP 37.9 38.2 38.1 39.0 37.7
Retail sales as % of
consumer expenditure 79.1 79.1 81.4 84.7 85.5
Source: 1999-2003 Euromonitor
3.4 Consumer Expenditure
Consumer expenditure, measured in current terms, increased 32.6% over the review period. In 2003, the growth of consumer expenditure increased 8.6%. This was fuelled by government's policy to encourage consumption. One important policy change was the adjustment of the national holidays. Currently, there are three blocks of long national holidays stretching for seven days each annually. This had positively encouraged consumers to travel. Consequently, growth in the travel industry driven by both domestic and foreign tourists also benefited other industries including retailing of food and clothing, hotel, transport.
With the rapid development of the economy, household expenditure and per capita consumer expenditure sustained a robust growth from 1999 through to 2003. Expenditure (per household) grew 24.5% over the 5-year period, reaching 14,425 RMB by the end of 2003. Similarly, per capita expenditure assumed a growth of 28.1% over the same time frame.
With further economic sanctions vis-à-vis China's entry into the WTO, the economy is expected to sustain a high growth rate in the following 5 years to 2008. Consumer expenditure will increase as well but in a different context as the current infrastructure of the retailing industry is expected to be altered by many big foreign retailers. On a clandestine note, 2004 is the last year for domestic retailers to bask under the government's protection due to the WTO agreement.
Table 4 Total Consumer Expenditure 1999-2003
RMB billion
1999 2000 2001 2002 2003
Current prices 3,956.8 4,316.6 4,619.7 4,829.9 5,244.9
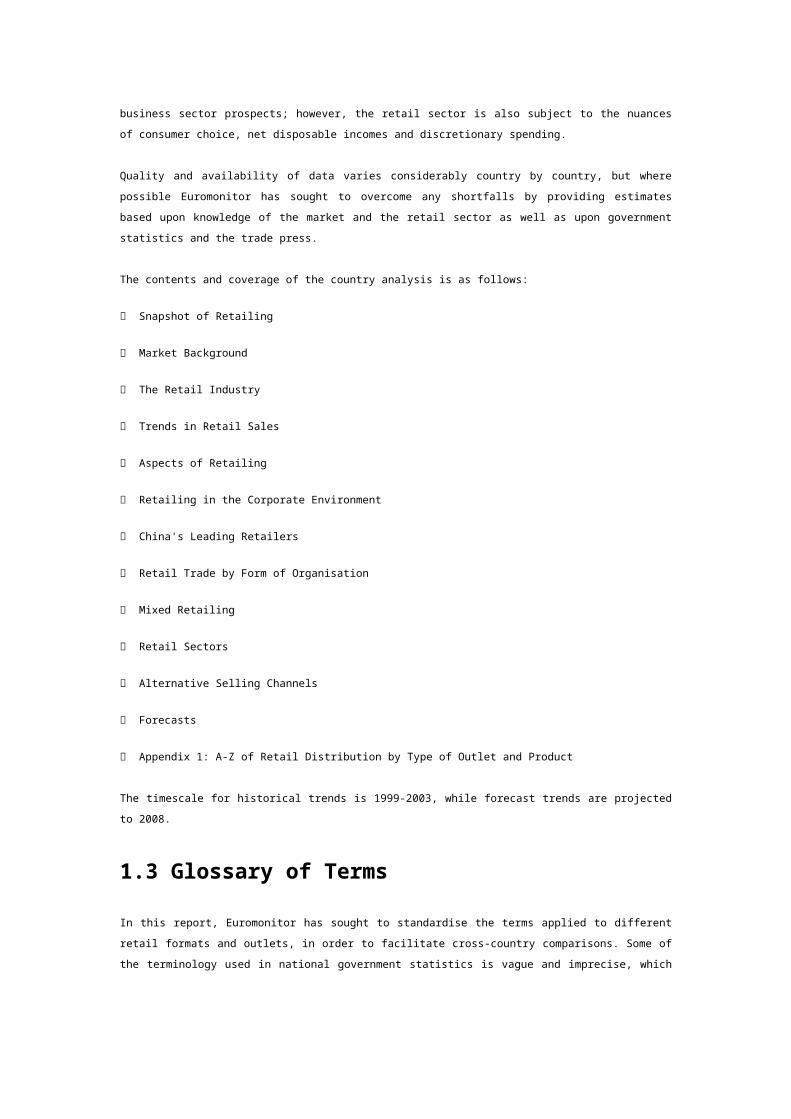
SARS in 2003 did little to dampen China's overall consumer expenditure that grew by nearly 9% to RMB5,245 billion. Strong economic conditions coupled with retailers' aggressive promotions through discounts and gifts encouraged consumer spending in various sectors to rebound back.
Inflated housing prices had also deferred consumer spending on buying homes and instead spend their income on other items such as communications, leisure and recreation – two sectors that demonstrated prominent growth.
The Chinese are traditionally known for their love for food and their expenditure on the food sector assumed 28.4% of total consumer expenditure in 2003. Among which, food categories such as milk, cheese & eggs, fish, vegetables, fruit and non-alcoholic beverages grew strongly in the range of 10.1% to 12.2% from 2002 to 2003.
The advent of technology in the agricultural sector in developing green house, as well as the increase in imported fruits meant that the consumers could enjoy all kinds of fruits in every season. This flow of availability encouraged consumption to increase by 11.8% in 2003.
It is noteworthy to mention the resilience of the catering sector which rebounded quickly despite being one of the sectors that bored the brunt of SARS impact
Table 7 Consumer Expenditure by Sector 1999-2003
RMB billion, current prices
1999 2000 2001 2002 2003
Food and non-alcoholic beverages 1,341.8 1,329.8 1,407.5 1,425.6 1,488.4
Alcoholic beverages and tobacco 101.0 109.0 114.4 116.0 124.6
Clothing and footwear 328.8 333.1 365.6 385.8 420.5
Housing 331.2 355.3 398.7 459.4 504.2
Household goods and services 269.6 292.3 300.6 313.6 335.4
Health goods and medical services 167.4 211.7 235.2 254.9 273.9
Transport 93.3 110.3 120.2 135.1 147.7
Communications 519.0 694.7 679.3 660.3 746.4
Leisure and recreation 166.1 177.1 179.3 204.7 225.5
Education 220.4 242.1 293.4 315.0 344.2
Hotels and catering 177.3 200.8 225.4 236.3 262.5
Miscellaneous goods and services 240.7 260.5 300.2 323.1 371.7
Saving extolled as a virtue curbs spending on credit
China's national savings rate is about 40%, making it one of the highest of any country in the world. According to the People's Bank of China (PBC), the country's central bank, household savings climbed 19.8% year-on-year to RMB9.6 trillion as at May 2003. Industry sources, however, acknowledged that the surge in savings in the first half of 2003 is due to increased prudence on the part of consumers in reaction to the outbreak of SARS. Further reports from the PBC highlighted the propensity of Chinese consumers to save – for rainy days and for retirement – especially during times of uncertainty, meant that it has been difficult to persuade consumers to spend on credit. Besides, the ability to save has been extolled as a virtue in Chinese society and this continues to affect consumers' spending habits,
particularly those belonging to the older generations.
Rising education and urbanization levels lead to changing attitudes
However, attitudes are changing with the emergence of a new generation of self-assured consumers with less reason to fear the economic and political upheavals which affected their parents' lives. These consumers are better educated, more urbanized and are typically considered to form the middle-class segment. It is this group of middle-class consumers who have contributed to rising consumerism and relatedly, rising consumer credit. In 2002, the amount outstanding on credit cards exceeded RMB23 billion, representing an increase of 28% over 2001.
Practical barriers to be overcome before consumer credit can grow further
Sources within the financial cards industry concede that while these changes are encouraging, there remains much potential for consumer credit to be developed in China. Aside from cultural barriers, practical obstacles remain. China continues to lack a nationwide credit card verification or electronic payment network. While the government has made efforts to build a nationwide network through the Golden Card (Jin Ka) scheme established in 1993, these efforts have been sporadic at best. Given the slow progress of the Golden Card scheme, cities and municipalities have developed their own credit system instead. For example, Shanghai has a Consumer Credit Database System (CCDS) which was set up in 2000 to provide a credit rating system for domestic commercial banks. The CCDS basically allows these banks to reduce risks and control costs when approving personal loans.
Table 9 Consumer Credit 1998-2002
RMB million, current
Outstanding on credit cards
Other TOTAL
1998 9,090.0 25,997.0 35,087.0
1999 10,908.0 33,814.0 44,722.0
2000 16,362.0 45,813.0 62,175.0
2001 18,232.0 51,239.0 69,471.0
2002 23,419.0 62,340.0 85,759.0
Source: Official sources (People's Bank of China), Trade interviews, Euromonitor estimates
Note: Other comprises insurance premiums, among others
Robust performance of fledgling financial cards industry in China
The financial cards industry can be considered to be a fairly new one in the Asia Pacific region, with one of the first financial cards being issued by the Bank of China in 1985. Riding on the back of China's
economic development, financial cards have also grown tremendously over the years. In 2003, the number of cards in circulation is expected to total more than 642 million, representing an increase of 34% over the previous year. The value of transactions increased by 13% over 2002 to reach close to RMB8 trillion at the end of 2003. Volume transactions, on the other hand, rose by 9% over 2002.
Well-established debit cards most dominant
In 2003, debit cards remained the most dominant financial cards, with the total number of cards in circulation nearing 618 million. This represented growth of 35% over the previous year. Debit cards' growth can be attributed to its linkage to the opening of a bank account. That is, in China, instead of ATM cards – which have the cash withdrawal function – being issued in conjunction with a bank account, debit cards are issued instead. These debit cards can be used for cash deposit and withdrawal purposes as well as for payment at retail outlets. The existence of these debit cards thus meant that there were no ATM cards in China's financial cards industry.
As China becomes increasingly urbanized, growth of debit cards has remained strong over the review period. Transaction value grew by 13% over 2002 to reach more than RMB7 trillion in 2003, while transaction volume increased by 7% to total over 21 billion during the same year.
Credit cards most dynamic given novel status
Despite debit cards being the dominant financial cards in terms of the number cards in circulation, credit cards were the most dynamic throughout the review period. In 2003, the number of credit cards in circulation posted a tremendous growth rate of 70%, such that the number of cards inched closer to the three million mark. Credit cards, however, remained the smallest sector within financial cards in 2003.
It should be noted that included under credit cards for Euromonitor's research on financial cards in China are cards that have a revolving credit line. In China, cards that were first issued typically were debit cards or bankcards that functioned in a similar manner to charge cards. For the purpose of this report, the latter type of cards has been classified under charge cards. It is widely perceived within the industry that these charge cards were issued to enable the evolution of financial cards in China to fully-fledged credit cards. Previously, the majority of Chinese consumers were not able to qualify for credit cards due to the minimum income criterion. This is anticipated to change as disposable income levels continue to rise in China.
China's first credit card – the Great Wall card – was launched in 1985 by the Bank of China. In 1987, the Great Wall card became a member of Visa. Up until then, financial cards in China could only be used domestically, and for a large part, these cards were largely quasi-credit cards (i.e. charge cards). It was only in 1988 that the first international credit cards were issued in China. Despite this, credit cards failed to take off in a big way in China. Sources speculated that this was largely due to the fact that merchant acceptance remained low as electronic funds transfer networks were only effectively in
place in 1995. Even then, Chinese consumers continued to show a preference for cash.
It was only between 1998 and 2003 that financial cards, particularly credit cards, started to fully develop. Credit cards grew on all fronts i.e. number of cards in circulation, transaction value and volume. What is noteworthy is that in the early part of the review period, credit cards' spend per card was higher than in 2003. This was due to two reasons. First, those who could qualify for credit cards were typically the rich, whose expenses tend to be high. Secondly, Chinese credit cardholders had the propensity to use their cards primarily for high value transactions.
Towards the end of the review period, spend per card dropped significantly. This was because more of the middle-class consumers could qualify for credit cards. Additionally, as consumers became more accustomed to using cards for payments, they have increasingly started using their cards to pay for lower-value transactions. In fact, some sources were of the view that in 2003 during the outbreak of the severe acute respiratory syndrome (SARS), more Chinese were using their financial cards to pay for everyday transactions and goods. This was because of the perception that cash was highly unhygienic as it could have passed through many hands.
Sluggish growth for charge cards due to switch to credit cards
In 2003, the number of charge cards in circulation reached almost 22 million, posting a growth of a mere 6% over the previous year. Such growth is sluggish relative to the other types of financial cards. Sources in the industry attribute this low growth to players' increasing attention to debit and credit cards in particular, of which the latter is slated to replace charge cards in China in the future. Although the growth in the number of charge cards is not as high as that for debit and credit cards, in transaction value and volume terms, charge cards continued to post robust growth of 14% and 100% respectively. Trade sources attribute this growth to rising consumer sophistication which has resulted in the higher usage of charge cards.
E-purse cards and store cards continued to have a negligible presence in China's financial cards industry. Both these card types remained novelties in the underdeveloped Chinese financial cards industry in 2003.
SARS outbreak reportedly aiding in spurring card usage
According to some sources, the outbreak of the severe acute respiratory syndrome (SARS) in early 2003 in China further bolstered Chinese' acceptance of paying by card. Cash generally is regarded as highly unhygienic. This is because there is no way of telling how many hands the currency one receives has passed through. With SARS being a virus that is believed to be spread through person-to-person contact, some sources reported that a segment of Chinese consumers apparently started using their financial cards more often as a mode of payment. This was because of the perception that there is at least some form of control over who has physically handled the card. As a result, transaction volume reportedly went up drastically over the March to May period in 2003 when the SARS outbreak
was at its worst. Transaction value did not increase at a similar pace as using the cards more frequently meant that Chinese cardholders were also becoming more accustomed to using their cards to pay for lower-value transactions.
Smart cards to be on the forefront
Similar to the situation in other countries worldwide, China has announced that all its financial cards will be switched from magnetic strip cards to those incorporating a smart chip within. They key impetus behind such a move is to curb card fraud. Card fraud is reportedly rampant in China and difficulties are naturally accentuated in such a large country. The implementation of this ruling which is slated to be completed by 2005 will greatly reduce card fraud.
Personal cards and debit cards most often used for lifestyle and everyday expenses
Personal charge and credit cards as well as debit cards are most often used for lifestyle and everyday expenses. For instance, expenses incurred on personal and debit cards for grocery, clothing and footwear, electrical goods and household ranked among the highest in 2003.
Travel, entertainment and motoring tend to feature more strongly as expenses incurred on corporate cards. This is because businesses tend to engage in these activities more often. For instance, expenses incurred during business trips tend to be charged to corporate cards.
Interestingly, grocery emerged as the dominant consumer spending sector for corporate credit cards in 2003. According to trade sources, this is because corporate cardholders use their cards for purchasing grocery items for personal use. This is then paid back to the company. It could be that it is much easier for businesses to apply for corporate credit cards for their employees who can then pay back the necessary amounts. Some individuals may not be able to meet some of the qualifying criteria imposed by card companies for personal cards.
Others expenditure typically incurred on financial cards in China include cosmetics, insurance and so on.
Other 20,561.3 1,779.1 62,623.0 22,792.5 106,816.8
TOTAL 126,092.2 35,264.4 490,050.4 227,924.8 1,052,251.7
Source: Trade interviews, Euromonitor estimates
3.7 Shopping Habits and Consumer Lifestyles
Consumers' shopping habits and lifestyles had evolved along with China retail industry's fast paced development. More and more, retailers are starting to pay attention in their understanding of consumers' shopping trends and mentality, in order to align their services to consumers and consequently secure a stronger position in the retailing industry.
The safety of food has become the most important element
The retail industry had made good progress over the past 10 years to build a positive image in
consumers' minds. In medium and larger cities, consumers had adopted well to having supermarkets as their main shopping destination for daily commodities.
Next to the increasing affluence of society in general, the SARS epidemic had also raised consumers' expectations in the quality of their food purchase. Among which, food safety, food products with endorsements, abundance in variety had become important decision making criteria for shoppers.
Both quality and price are important
In recent years, the retailing industry had mainly engaged in price competition. This had eventuated into negligence of product quality by some retailers in search of lowering their costs. The situation had worsened to a stage where even established retailers were caught offering fake goods.
Although many retailers had been trying to position themselves as low price goods suppliers, consumers are still unable to associate particular retailers with a low-price connotation. Based on industry sources, the majority of consumers form their opinions of retailers based on price comparison across different retailer outlets. Price is, however, not the only deciding factor. Over-emphasis on price-cutting may not only become a futile attempt at building of a low- price image and instead erode the profit margin.
Convenience is another important element which will affect consumer's choice
Convenience has become an important choice criteria for shoppers. In China, this translates to the additional services or service quality customers can get beyond product offerings within a store.
For example, studies had suggested that majority of consumers are keen to seek help from the retail staff in the following situation – when consumer cannot find the merchandise they want; when consumers are looking to purchase merchandise they are unfamiliar with or products with new functions; when consumers cannot find price label or come across merchandise that is technologically advance.
Currently, industry sources suggest a service gap between what consumers would like to receive and the actual services retailers offer.
This does not necessarily mean that more staff (whether they are employees of the retailer or of the suppliers) should be on the shop floor. An optimal number of staffing is important to offer additional services yet also not clutter the shop space and irate customers.
Further, consumers tend to place more emphasis on additional packing services offered and attribute this service to their overall shopping satisfaction.
The distribution of merchandise and cashier need to be developed
Convenient shopping also includes the speed at which consumers go through the motion of doing their shopping and making their purchase. Merchandise needs to be quickly accessible or located. This necessarily demands a reasonably structured display of products.
A seamless flow of purchase procedures at the stores' check out points is currently lacking in retail stores. Studies suggested that long period of waiting time at the check out lines, bad service attitude from the cashier, failure of scanner equipment are main elements that contribute to consumer dissatisfaction.
3.1 Macroeconomic Performance – Indicators
In 2003, although under the threat of SARS, China GDP's growth remained high at 13.3%, with total GDP reaching RMB11,888 billion. The population of China was 1.3 billion in 2003, which means GDP per capita of RMB9,100 (US$1,100).
According to industry sources, every retail model has some requirement in terms of GDP. The requirement of supermarkets is a personal GDP of US$800 and convenience stores at US$3,000. From the total national GDP level, it would appear that China entered the supermarket development period in 2001.
The unbalanced development of China's economy needs to be considered. Convenience stores start to appear in cities once GDP per capita reaches US$3,000. In the East and central cities, personal GDP has met the requirements for convenience stores, and such stores have been established. In Shanghai city centre, hypermarkets have entered a relatively saturation period, while convenience stores began to appear in 2001. The current focus of competition is among hypermarkets; the next will be among convenience stores and speciality stores.
China recorded a good economic performance in 2003. Consumer expenditure increased 8.6% compared to 2002, with average consumer expenditure per capita reaching RMB4,409 in 2003.
Note: Population figures are estimates at 1 January
3.2 Macroeconomic Performance – Price Inflation
The Chinese economy improved year to year from 1999 to 2003. While interest rates were kept at record low levels by the central bank, China's consumer price index registered an increase by 3.4 percentage point in 2003 compared to 1999. The impact of inflation on retail sales over the review period was limited as consumption was encouraged by the healthy growth of GDP and the improvement in standards of living in general.
As the biggest sector amongst all consumer goods, the price inflation of food can further impact on the price inflation of other goods. From 1999 to 2003, the price of food increased annually with year-on-year growth ranging from 0.7% to 2.3%. According to the Chinese State Government latest policy formulation, price inflation of food is geared towards an even higher growth around 5-7% in 2004. The objective behind this new policy is to increase the nation's farmers' income. This increase from the agricultural sector is expected to create a ripple effect throughout the rest of the food sector.
Housing saw the largest climb in price inflation of 23% from 1999 to 2003. In some big cities like Shanghai, Beijing, Shenzhen, the price inflation of housing surpassed the national average to hit 50%. The main reason behind this dramatic price inflation is due to the rapid economy development in China. With more and more foreign investment entering the China market, China has registered an influx of foreign employees who choose to settle in China, with most of them acquiring houses of their own. For example, in Shanghai, the average house price was 75% higher than the house price in 1999. 45% of the house buyers in Shanghai were foreigners, mostly from Hong Kong and Taiwan who reckoned Shanghai to have similar standard of living and lifestyle with their own countries, at lower living costs.
In contrast, household goods and services witnessed a decline in inflation of 4.2% from 1999 to 2003 due to fiery competition within this sector.
The price of communications recorded no changes for 3 years (1999-2001), until fierce competition between communication operators took place from 2002 to 2003. This aggressive scramble for the largest possible share of the market came about with China opening its communication market after its entry into WTO. The communications operators, especially mobile phone operators employed many kinds of promotion to absorb loyal consumer with multiple-years contract. Communication operators had since then reduced their price as part of their strategy to gain a foothold in the market.
The price of clothing and footwear dropped in 2000 due to the overproduction of clothing and footwear; production levels fell and better reflected demand from 2001 to 2003.
In transport sector, prices fell about 4% from 1999 to 2003, especially in flight transport sector. The price of taxi, city bus and train are almost fixed by the government. But with the current price inflation of fuel during the review period, the price of airfares is expected to increase with a high percentage in 2004.
Table 2 Consumer Price Indices by Classification Group 1999-2003
1999 = 100.0
1999 2000 2001 2002 2003
ALL PRICES 100.0 101.5 102.7 101.9 103.4
Food 100.0 102.3 103.6 104.3 105.9
Alcoholic drinks 100.0 103.5 106.8 109.0 110.5
Tobacco 100.0 100.8 103.0 104.0 106.0
Clothing and footwear 100.0 98.0 99.0 100.2 101.5
Housing 100.0 103.0 110.8 118.9 123.0
Household fuels 100.0 100.6 102.0 103.0 99.0
Household goods and services 100.0 99.0 98.0 96.4 95.8
Health goods and medical services 100.0 102.0 103.5 105.0 106.5
Transport 100.0 98.0 97.0 96.0 96.0
Communications 100.0 100.0 100.0 96.5 90.0
Leisure and education 100.0 101.0 101.5 103.7 104.8
3.3 Macroeconomic Performance – Retail Sales as a %
of GDP and Consumer Expenditure
The retail industry is an important component driving China's GDP. In China, retail sales alone made up more than 37% of GDP every year from 1999 to 2003. On an anecdotal perspective, as the growth of retail sales proxies consistently in regards to GDP growth over the last 5 years, a certain level of consistency may be extrapolated into the near future.
Retail sales' percentage of consumer expenditure over the review period hovered between 79% to 85% of GDP. However, it is noteworthy that the disparate consumption patterns of consumers from different areas in China varies across product sectors.
In China, most of the local consumers come from the low income band. To them, the most important thing is food and commodity and consumption of these goods will make up more than 90% of their total consumer expenditure. In big cities like Shanghai, Beijing and Shenzhen however, the consumption of food and commodity is around 35% of consumer expenditure. Others transaction hot spots are house and car or entertainment.
Table 3 Retail Sales as a % of GDP and Consumer Expenditure 1999-2003
%
1999 2000 2001 2002 2003
Retail sales as % of GDP 37.9 38.2 38.1 39.0 37.7
Retail sales as % of
consumer expenditure 79.1 79.1 81.4 84.7 85.5
Source: 1999-2003 Euromonitor
3.4 Consumer Expenditure
Consumer expenditure, measured in current terms, increased 32.6% over the review period. In 2003, the growth of consumer expenditure increased 8.6%. This was fuelled by government's policy to encourage consumption. One important policy change was the adjustment of the national holidays. Currently, there are three blocks of long national holidays stretching for seven days each annually. This had positively encouraged consumers to travel. Consequently, growth in the travel industry driven by both domestic and foreign tourists also benefited other industries including retailing of food and clothing, hotel, transport.
With the rapid development of the economy, household expenditure and per capita consumer expenditure sustained a robust growth from 1999 through to 2003. Expenditure (per household) grew 24.5% over the 5-year period, reaching 14,425 RMB by the end of 2003. Similarly, per capita expenditure assumed a growth of 28.1% over the same time frame.
With further economic sanctions vis-à-vis China's entry into the WTO, the economy is expected to sustain a high growth rate in the following 5 years to 2008. Consumer expenditure will increase as well but in a different context as the current infrastructure of the retailing industry is expected to be altered by many big foreign retailers. On a clandestine note, 2004 is the last year for domestic retailers to bask under the government's protection due to the WTO agreement.
Table 4 Total Consumer Expenditure 1999-2003
RMB billion
1999 2000 2001 2002 2003
Current prices 3,956.8 4,316.6 4,619.7 4,829.9 5,244.9
Table 6 Household and Per Capita Consumer Expenditure1999-2003
RMB, current prices
Per household Per capita
1999 11,585.6 3,133.6
2000 12,283.3 3,383.7
2001 13,076.4 3,604.1
2002 13,475.2 3,732.8
2003 14,424.7 4,015.6
Source: 1999-2002 Euromonitor3.5 Consumer Expenditure by Sector
SARS in 2003 did little to dampen China's overall consumer expenditure that grew by nearly 9% to RMB5,245 billion. Strong economic conditions coupled with retailers' aggressive promotions through discounts and gifts encouraged consumer spending in various sectors to rebound back.
Inflated housing prices had also deferred consumer spending on buying homes and instead spend their income on other items such as communications, leisure and recreation – two sectors that demonstrated prominent growth.
The Chinese are traditionally known for their love for food and their expenditure on the food sector assumed 28.4% of total consumer expenditure in 2003. Among which, food categories such as milk, cheese & eggs, fish, vegetables, fruit and non-alcoholic beverages grew strongly in the range of 10.1% to 12.2% from 2002 to 2003.
The advent of technology in the agricultural sector in developing green house, as well as the increase in imported fruits meant that the consumers could enjoy all kinds of fruits in every season. This flow of availability encouraged consumption to increase by 11.8% in 2003.
It is noteworthy to mention the resilience of the catering sector which rebounded quickly despite being one of the sectors that bored the brunt of SARS impact
Table 7 Consumer Expenditure by Sector 1999-2003
RMB billion, current prices
1999 2000 2001 2002 2003
Food and non-alcoholic beverages 1,341.8 1,329.8 1,407.5 1,425.6 1,488.4
Alcoholic beverages and tobacco 101.0 109.0 114.4 116.0 124.6
Clothing and footwear 328.8 333.1 365.6 385.8 420.5
Housing 331.2 355.3 398.7 459.4 504.2
Household goods and services 269.6 292.3 300.6 313.6 335.4
Health goods and medical services 167.4 211.7 235.2 254.9 273.9
Transport 93.3 110.3 120.2 135.1 147.7
Communications 519.0 694.7 679.3 660.3 746.4
Leisure and recreation 166.1 177.1 179.3 204.7 225.5
Education 220.4 242.1 293.4 315.0 344.2
Hotels and catering 177.3 200.8 225.4 236.3 262.5
Miscellaneous goods and services 240.7 260.5 300.2 323.1 371.7
Saving extolled as a virtue curbs spending on credit
China's national savings rate is about 40%, making it one of the highest of any country in the world. According to the People's Bank of China (PBC), the country's central bank, household savings climbed 19.8% year-on-year to RMB9.6 trillion as at May 2003. Industry sources, however, acknowledged that the surge in savings in the first half of 2003 is due to increased prudence on the part of consumers in reaction to the outbreak of SARS. Further reports from the PBC highlighted the propensity of Chinese consumers to save – for rainy days and for retirement – especially during times of uncertainty, meant that it has been difficult to persuade consumers to spend on credit. Besides, the ability to save has been extolled as a virtue in Chinese society and this continues to affect consumers' spending habits, particularly those belonging to the older generations.
Rising education and urbanization levels lead to changing attitudes
However, attitudes are changing with the emergence of a new generation of self-assured consumers with less reason to fear the economic and political upheavals which affected their parents' lives. These consumers are better educated, more urbanized and are typically considered to form the middle-class segment. It is this group of middle-class consumers who have contributed to rising consumerism and relatedly, rising consumer credit. In 2002, the amount outstanding on credit cards exceeded RMB23 billion, representing an increase of 28% over 2001.
Practical barriers to be overcome before consumer credit can grow further
Sources within the financial cards industry concede that while these changes are encouraging, there remains much potential for consumer credit to be developed in China. Aside from cultural barriers, practical obstacles remain. China continues to lack a nationwide credit card verification or electronic payment network. While the government has made efforts to build a nationwide network through the Golden Card (Jin Ka) scheme established in 1993, these efforts have been sporadic at best. Given the slow progress of the Golden Card scheme, cities and municipalities have developed their own credit system instead. For example, Shanghai has a Consumer Credit Database System (CCDS) which was set up in 2000 to provide a credit rating system for domestic commercial banks. The CCDS basically allows these banks to reduce risks and control costs when approving personal loans.
Table 9 Consumer Credit 1998-2002
RMB million, current
Outstanding on credit cards
Other TOTAL
1998 9,090.0 25,997.0 35,087.0
1999 10,908.0 33,814.0 44,722.0
2000 16,362.0 45,813.0 62,175.0
2001 18,232.0 51,239.0 69,471.0
2002 23,419.0 62,340.0 85,759.0
Source: Official sources (People's Bank of China), Trade interviews, Euromonitor estimates
Note: Other comprises insurance premiums, among others
Robust performance of fledgling financial cards industry in China
The financial cards industry can be considered to be a fairly new one in the Asia Pacific region, with one of the first financial cards being issued by the Bank of China in 1985. Riding on the back of China's economic development, financial cards have also grown tremendously over the years. In 2003, the
number of cards in circulation is expected to total more than 642 million, representing an increase of 34% over the previous year. The value of transactions increased by 13% over 2002 to reach close to RMB8 trillion at the end of 2003. Volume transactions, on the other hand, rose by 9% over 2002.
Well-established debit cards most dominant
In 2003, debit cards remained the most dominant financial cards, with the total number of cards in circulation nearing 618 million. This represented growth of 35% over the previous year. Debit cards' growth can be attributed to its linkage to the opening of a bank account. That is, in China, instead of ATM cards – which have the cash withdrawal function – being issued in conjunction with a bank account, debit cards are issued instead. These debit cards can be used for cash deposit and withdrawal purposes as well as for payment at retail outlets. The existence of these debit cards thus meant that there were no ATM cards in China's financial cards industry.
As China becomes increasingly urbanized, growth of debit cards has remained strong over the review period. Transaction value grew by 13% over 2002 to reach more than RMB7 trillion in 2003, while transaction volume increased by 7% to total over 21 billion during the same year.
Credit cards most dynamic given novel status
Despite debit cards being the dominant financial cards in terms of the number cards in circulation, credit cards were the most dynamic throughout the review period. In 2003, the number of credit cards in circulation posted a tremendous growth rate of 70%, such that the number of cards inched closer to the three million mark. Credit cards, however, remained the smallest sector within financial cards in 2003.
It should be noted that included under credit cards for Euromonitor's research on financial cards in China are cards that have a revolving credit line. In China, cards that were first issued typically were debit cards or bankcards that functioned in a similar manner to charge cards. For the purpose of this report, the latter type of cards has been classified under charge cards. It is widely perceived within the industry that these charge cards were issued to enable the evolution of financial cards in China to fully-fledged credit cards. Previously, the majority of Chinese consumers were not able to qualify for credit cards due to the minimum income criterion. This is anticipated to change as disposable income levels continue to rise in China.
China's first credit card – the Great Wall card – was launched in 1985 by the Bank of China. In 1987, the Great Wall card became a member of Visa. Up until then, financial cards in China could only be used domestically, and for a large part, these cards were largely quasi-credit cards (i.e. charge cards). It was only in 1988 that the first international credit cards were issued in China. Despite this, credit cards failed to take off in a big way in China. Sources speculated that this was largely due to the fact that merchant acceptance remained low as electronic funds transfer networks were only effectively in place in 1995. Even then, Chinese consumers continued to show a preference for cash.
It was only between 1998 and 2003 that financial cards, particularly credit cards, started to fully develop. Credit cards grew on all fronts i.e. number of cards in circulation, transaction value and volume. What is noteworthy is that in the early part of the review period, credit cards' spend per card was higher than in 2003. This was due to two reasons. First, those who could qualify for credit cards were typically the rich, whose expenses tend to be high. Secondly, Chinese credit cardholders had the propensity to use their cards primarily for high value transactions.
Towards the end of the review period, spend per card dropped significantly. This was because more of the middle-class consumers could qualify for credit cards. Additionally, as consumers became more accustomed to using cards for payments, they have increasingly started using their cards to pay for lower-value transactions. In fact, some sources were of the view that in 2003 during the outbreak of the severe acute respiratory syndrome (SARS), more Chinese were using their financial cards to pay for everyday transactions and goods. This was because of the perception that cash was highly unhygienic as it could have passed through many hands.
Sluggish growth for charge cards due to switch to credit cards
In 2003, the number of charge cards in circulation reached almost 22 million, posting a growth of a mere 6% over the previous year. Such growth is sluggish relative to the other types of financial cards. Sources in the industry attribute this low growth to players' increasing attention to debit and credit cards in particular, of which the latter is slated to replace charge cards in China in the future. Although the growth in the number of charge cards is not as high as that for debit and credit cards, in transaction value and volume terms, charge cards continued to post robust growth of 14% and 100% respectively. Trade sources attribute this growth to rising consumer sophistication which has resulted in the higher usage of charge cards.
E-purse cards and store cards continued to have a negligible presence in China's financial cards industry. Both these card types remained novelties in the underdeveloped Chinese financial cards industry in 2003.
SARS outbreak reportedly aiding in spurring card usage
According to some sources, the outbreak of the severe acute respiratory syndrome (SARS) in early 2003 in China further bolstered Chinese' acceptance of paying by card. Cash generally is regarded as highly unhygienic. This is because there is no way of telling how many hands the currency one receives has passed through. With SARS being a virus that is believed to be spread through person-to-person contact, some sources reported that a segment of Chinese consumers apparently started using their financial cards more often as a mode of payment. This was because of the perception that there is at least some form of control over who has physically handled the card. As a result, transaction volume reportedly went up drastically over the March to May period in 2003 when the SARS outbreak was at its worst. Transaction value did not increase at a similar pace as using the cards more
frequently meant that Chinese cardholders were also becoming more accustomed to using their cards to pay for lower-value transactions.
Smart cards to be on the forefront
Similar to the situation in other countries worldwide, China has announced that all its financial cards will be switched from magnetic strip cards to those incorporating a smart chip within. They key impetus behind such a move is to curb card fraud. Card fraud is reportedly rampant in China and difficulties are naturally accentuated in such a large country. The implementation of this ruling which is slated to be completed by 2005 will greatly reduce card fraud.
Personal cards and debit cards most often used for lifestyle and everyday expenses
Personal charge and credit cards as well as debit cards are most often used for lifestyle and everyday expenses. For instance, expenses incurred on personal and debit cards for grocery, clothing and footwear, electrical goods and household ranked among the highest in 2003.
Travel, entertainment and motoring tend to feature more strongly as expenses incurred on corporate cards. This is because businesses tend to engage in these activities more often. For instance, expenses incurred during business trips tend to be charged to corporate cards.
Interestingly, grocery emerged as the dominant consumer spending sector for corporate credit cards in
2003. According to trade sources, this is because corporate cardholders use their cards for purchasing grocery items for personal use. This is then paid back to the company. It could be that it is much easier for businesses to apply for corporate credit cards for their employees who can then pay back the necessary amounts. Some individuals may not be able to meet some of the qualifying criteria imposed by card companies for personal cards.
Others expenditure typically incurred on financial cards in China include cosmetics, insurance and so on.
Other 20,561.3 1,779.1 62,623.0 22,792.5 106,816.8
TOTAL 126,092.2 35,264.4 490,050.4 227,924.8 1,052,251.7
Source: Trade interviews, Euromonitor estimates
3.7 Shopping Habits and Consumer Lifestyles
Consumers' shopping habits and lifestyles had evolved along with China retail industry's fast paced development. More and more, retailers are starting to pay attention in their understanding of consumers' shopping trends and mentality, in order to align their services to consumers and consequently secure a stronger position in the retailing industry.
The safety of food has become the most important element
The retail industry had made good progress over the past 10 years to build a positive image in consumers' minds. In medium and larger cities, consumers had adopted well to having supermarkets as their main shopping destination for daily commodities.
Next to the increasing affluence of society in general, the SARS epidemic had also raised consumers' expectations in the quality of their food purchase. Among which, food safety, food products with endorsements, abundance in variety had become important decision making criteria for shoppers.
Both quality and price are important
In recent years, the retailing industry had mainly engaged in price competition. This had eventuated into negligence of product quality by some retailers in search of lowering their costs. The situation had worsened to a stage where even established retailers were caught offering fake goods.
Although many retailers had been trying to position themselves as low price goods suppliers, consumers are still unable to associate particular retailers with a low-price connotation. Based on industry sources, the majority of consumers form their opinions of retailers based on price comparison across different retailer outlets. Price is, however, not the only deciding factor. Over-emphasis on price-cutting may not only become a futile attempt at building of a low- price image and instead erode the profit margin.
Convenience is another important element which will affect consumer's choice
Convenience has become an important choice criteria for shoppers. In China, this translates to the additional services or service quality customers can get beyond product offerings within a store.
For example, studies had suggested that majority of consumers are keen to seek help from the retail staff in the following situation – when consumer cannot find the merchandise they want; when consumers are looking to purchase merchandise they are unfamiliar with or products with new functions; when consumers cannot find price label or come across merchandise that is technologically advance.
Currently, industry sources suggest a service gap between what consumers would like to receive and the actual services retailers offer.
This does not necessarily mean that more staff (whether they are employees of the retailer or of the suppliers) should be on the shop floor. An optimal number of staffing is important to offer additional services yet also not clutter the shop space and irate customers.
Further, consumers tend to place more emphasis on additional packing services offered and attribute this service to their overall shopping satisfaction.
The distribution of merchandise and cashier need to be developed
Convenient shopping also includes the speed at which consumers go through the motion of doing their
shopping and making their purchase. Merchandise needs to be quickly accessible or located. This necessarily demands a reasonably structured display of products.
A seamless flow of purchase procedures at the stores' check out points is currently lacking in retail stores. Studies suggested that long period of waiting time at the check out lines, bad service attitude from the cashier, failure of scanner equipment are main elements that contribute to consumer dissatisfaction.
4. THE RETAIL INDUSTRY
4.1 Number of Retail Businesses
At the end of 2003, there were 19 million registered businesses and more than 23 million outlets in China which translated to an average of 1.2 outlets per business. Most of the businesses are small scaled with a small capital outlay. Retail businesses with annual sales of more than RMB 5 Million and with at least 60 employees number approximately 80,000 to 90,000.
Grocery businesses constitute the largest sector. However most of the grocery retailers operate only one small outlet with 10-30 sq m sales area and are run by 1 to 2 people. Grocery retailers with annual sales of more than 2 million RMB with at least 40 employees amount to 20,000 businesses.
The number of new retail business registrations has been increasing rapidly since 2001. Prior to that, growth in new retail business registrations was very small mainly due to the Asian financial crisis. In 2002 and 2003, the China government adjusted policy to support mergers & acquisitions between domestic retailers and the policy played a role in encouraging the proliferation of new business registrations.
In 2002, the number of closures increased by 19.6%. The main reason for this growth is the adjustment on taxation rates from the China centre government, which adjusted taxation rates from 15% to 33%. Many small and middle scale retailers as a result closed their business under such a high taxation amongst fiery competition.
2003 however saw a decline in closures as the initial impact of the raised taxation rates settled down. Together with better government policies and stronger economic growth, it became more attractive for more businesses to continue in their operations.
Table 15 Number of Retail Businesses and Outlets 1999-2003
Source: 1999-2002 Euromonitor from official sources (Ministry of Statistics), trade press, 2003
Euromonitor estimates
Table 16 Number of New Retail Business Registrations and Closures 1999-2003
'000 units
1999 2000 2001 2002 2003
Registrations 951.0 983.5 954.6 1,095 1,356.5
% growth - 3.4 -2.9 14.7 23.9
Closures 478.0 415.3 485 580 450
% growth - -13.1 16.8 19.6 -22.4
Source: 1999-2002 Euromonitor from official sources (Ministry of Statistics), trade press, 2003
Euromonitor estimates
4.2 Number of Retail Businesses by Type
At the end of 2003, the total number of retailing businesses stood at 19 million with the growth of 7.1% over 2002. The largest sector, grocery retail businesses reached 9.8 million in 2003. The characteristic of grocery retail is low running capital costs and few employees. This explains why the number for new registrations and closures are very high for grocery retail businesses.
The number of hypermarkets on the other hand is small due to the high running costs alongside the high requirement of expertise needed to ensure the stores are successfully managed. In 1999, the number of hypermarket businesses was less than 100. Many domestic hypermarket retailers closed their businesses shortly after commencement due to the lack of management expertise which caused them to lose competitive advantage against the big foreign retailers like Wal-Mart and Carrefour. As a
result at the end of 2003, most of the hypermarket businesses in China are run by foreign retailers.
The number of supermarket retail businesses experienced a growth of 94% over the review period. At the end of 2003, the total number of supermarket businesses reached 58,600, an increase of 16.7% compared to 2002. The biggest supermarket retailer in China is Shanghai Lianhua Supermarket Co Ltd which belongs to Shanghai Friendship Co Ltd.
In China, the modern day convenience store has just come into being in recent years, but the speed of development has proved to be rapid. The first batch of convenience stores in China was developed from independent personal stores. Subsequently, supermarket retailers began to develop their own convenience stores. In China, according to the current policy, foreign retailers cannot manage convenience store by themselves, they have to establish the stores through joint ventures with domestic retailers. The first foreign convenience retailer in China was Lawson from Japan. Lawson established a JV with Shanghai Hualian supermarket Co Ltd in 1996. The main outlets opened in Shanghai and in the nearby provinces.
Specialty store is another important retail business type in China. Clothing and footwear, home furnishing/household goods, durable goods and personal and leisure goods account for the bulk of number of businesses within speciality stores. With the increasingly demand in home ownership, the businesses of home furnishing and household goods grew by 46.7% over the review period.
Table 17 Number of Retail Businesses by Type 1999-2003
Number '000
1999 2000 2001 2002 2003
Department stores 15.3 17.6 19.5 21.7 24.2
Hypermarkets 0.1 0.1 0.1 0.2 0.2
Convenience stores 0.5 0.6 0.7 0.8 1.1
Supermarkets 30.2 35.9 42.5 50.2 58.6
Other grocery retailers 8,744.6 8,955.0 9,023.0 9,424.6 9,819.6
Specialty stores
- Health and beauty products 5.5 7.6 9.8 13.5 16.7
- Clothing and footwear 1,717.3 1,799.3 1,845.8 1,901.0 2,006.0
- Home furnishing/Household goods 468.3 521.3 582.0 615.0 687.0
- Durable goods 624.5 645.5 669.8 689.5 721.5
- Personal and leisure goods 2,402.8 2,510.0 2,900.0 3,120.0 3,602.6
Others 1,602.4 1,686.8 1,782.2 1,983.9 2,148.1
TOTAL 15,611.5 16,179.7 16,875.4 17,820.4 19,085.6
Source: 1999-2002 Euromonitor from official sources (Ministry of Statistics), trade press, 2003
Euromonitor estimates
4.3 Number of Retail Outlets by Type
At the end of 2003, the total number of retail outlets reached 23 million in China, with food outlets accounting for 55.7% of all the retail outlets. In 2003, overall growth of food outlets amounted to 6.9%. Although smaller in number, growth of non-food outlet was more dynamic than food outlets at 11%.
Corresponding to the number of businesses, the number of grocery retail outlets also ranked the largest amongst the retail sectors. In grocery retail, the China government does not have very strict policy requirements on foreign grocery retailers.
Convenience stores increased very rapidly in the past five years. Over the review period, the number of convenience store outlets increased by 110%. Although new, convenience stores have rapidly grown in China. For example, Shanghai Nong-gong-shang Supermarket group, one of the larger supermarket chains in China started a convenience store chain Alldays. At the end of 2003, more than 1,000 outlets were opened and as a result, convenience store has become one of its main areas of business.
Department store is another important business format, with the growth in outlets registering 81.5% over the review period. A higher growth was recorded in the beginning of the review period. In the big cities, the domestic department store development has remained stagnant. With little improvements seen in the product offering, environment and service, local department stores are set to face strong competition from foreign players. In China, major foreign department store retailers include Pacific, Parkson and Isetan.
Table 18 Number of Retail Outlets by Food/Non-food Split 1999-2003
'000 outlets
1999 2000 2001 2002 2003
Food 10,568.2 11,326.4 11,676.6 12,371.6 12,843.4
Non-food 7,489.9 7,980.4 8,610.6 9,193.7 10,209.9
TOTAL 18,058.1 19,306.8 20,287.2 21,565.3 23,053.3
Source: 1999-2002 Euromonitor from official sources (Ministry of Statistics), trade press, 2003
Euromonitor estimates
Table 19 Number of Retail Outlets by Type 1999-2003
'000 outlets
1999 2000 2001 2002 2003
Department stores 40.5 50.2 60.4 67.8 73.5
Hypermarkets 0.2 0.2 0.3 0.4 0.5
Convenience stores 15.0 18.0 22.3 26.8 31.5
Supermarkets 150.0 188.0 215.0 250.0 288.0
Other grocery retailers 10,362.5 11,070.0 11,378.6 12,026.6 12,449.9
Specialty stores
- Health and beauty products 17.0 25.0 35.0 45.0 60.0
- Clothing and footwear 1,833.5 1,910.3 2,100.6 2,303.2 2,500.0
- Home furnishing/Household goods 512.4 588.3 645.6 650.4 715.0
- Durable goods 712.5 764.5 821.4 852.5 910.4
- Personal and leisure goods 2,748.0 2,938.0 3,154.5 3,279.3 3,790.5
Others 1,666.5 1,754.3 1,853.5 2,063.3 2,234.0
TOTAL 18,058.1 19,306.8 20,287.2 21,565.3 23,053.3
Source: 1999-2002 Euromonitor from official sources (Ministry of Statistics), trade press, 2003
Euromonitor estimates
4.4 Retail Sales Area
With growth evident in retail businesses and number of outlets, increase in sales area is inevitable. Over the review period, retail sales area grew by 53.5% to reach 2,158.3 million sq m at the end of 2003. Growth in 2003 amounted to 13.2% over 2002.
Between 1999 to 2003, total average area per outlet grew by 20.5%. Unfortunately with rapidly increasing rental rates, the cost burden on retailers is mounting, especially since sales growth has not been comparable in some instances.
The average sales area for supermarkets fell by 8.1% from 1999 to 2003, due to the decline in net margins. This has resulted in retailers trying to be more efficient in a smaller average retail space in an effort to be competitive.
The average sales area of other grocery retailers on the other hand grew by 27% over the review period to reach 55 sq m in 2003. The main reason for the rise was because of the increasing trend of grocery retailers establishing outlets with bigger sales area, with some of the outlets having more than 2,000 sq m.
Hypermarkets clocked the highest average sales area at 15,000 sq m in 2003. Most of the hypermarket outlets are managed by foreign retailers like Wal-Market, Carrefour and these players have strong expertise in operating very large retail spaces. Several big domestic players such as Shanghai Lianhua Century Hypermarket and Beijing Hualian Hypermarket have also opened big hypermarkets with average sales area of between 16,000-16,500 sq m. Another reason for the improvement in average sales area is the closure of many small and middle domestic players due weak performances.
Table 20 Retail Sales Area 1999-2003
Million sq m
1999 2000 2001 2002 2003
Total retail sales area 1,406.5 1,564.9 1,716.1 1,906.6 2,158.3
% growth - 11.3 9.7 11.1 13.2
Average sq m per outlet 77.7 81.1 84.6 88.4 93.6
Source: 1999-2002 Euromonitor from official sources (Ministry of Statistics), trade press, 2003
Euromonitor estimates
Table 21 Retail Sales Area by Outlet Type 1999-2003
Million sq m
1999 2000 2001 2002 2003
Department stores 101.3 125.5 153.4 176.3 189.6
Hypermarkets 2.4 2.6 4.4 6.1 7.5
Convenience stores 3.0 3.8 5.1 6.3 7.2
Supermarkets 187.8 233.1 262.3 300.0 331.2
Other grocery retailers 451.2 506.3 542.8 582.6 688.1
Specialty stores
- Health and beauty products 0.9 1.5 2.5 3.3 4.3
- Clothing and footwear 132.0 149.0 172.2 195.8 225.0
- Health and beauty products 52.9 60.0 71.4 73.3 71.7
- Clothing and footwear 72.0 78.0 82.0 85.0 90.0
- Home furnishing/Household goods 95.0 97.1 100.1 103.0 105.0
- Durable goods 100.1 95.0 90.0 88.0 90.0
- Personal and leisure goods 77.7 75.9 78.5 80.5 81.3
Others 116.7 108.6 101.0 111.6 107.6
AVERAGE 4.3 4.2 4.2 4.1 4.1
Source: 1999-2002 Euromonitor from official sources (Ministry of Statistics), trade press, 2003
Euromonitor estimates
4.5 Employment in Retailing
At the end of 2003, the total employment in China reached 748.5 million people, which increased 1.6% compared to 2002. Employment as a percentage of the total population in China came up to 57.3% in 2003.
Employment in retailing grew steadily by between 2.1% to 2.7% from 2000 to 2003, with growth being highest in 2003 at 2.7%. Employment in retailing amounted to 41.2 million people in 2003 which occupied 5.5% of total employment. As most retailers are small scaled in China, total sales of the top 100 retailers amounted to approximately only 8% of total retail sales, according to official statistics.
Full time employment occupied 76.5% of total retailing employment in China, however growth was very slight at 0.4% in 2003. This is against an overall growth of 2.7% in total employment in retailing.
Albeit a lower percentage share, growth in part-time retail employment was much quicker when compared to its full time counterparts. The employment of part-timers neared 10 million with growth of 11.2% in 2003 compared with 2002, with most of this growth taking place in grocery and food retailing.
To better control labour costs, more retailers especially grocery retailers prefer part-time employees as they translate to lower overheads. The growth of part-time employment is expected to be maintained at just over 10% over the next 3 years (2004-2006).
The employment in grocery retailing is the biggest sector of all the employment in retailing, with a percentage share of 44%. Most of the grocery retailers are small and independent with an average annual sales of 75,000RMB and only one or two persons employed.
Hypermarkets employ the largest number of people on a per outlet basis, which range from 250 to 300. With the foreign retailers' entry, most of the hypermarkets now belong to foreign retailers like Wal-Mart, Carrefour, Metro, Trust-Mart, Lotus and Hymall. The average area of hypermarkets is also the highest amongst all retail formats which partly explains why hypermarkets have the highest level of employment per outlet.
Table 23 Employment in Retailing 1999-2003
Million
1999 2000 2001 2002 2003
Total employment 690.7 711.5 730.3 736.6 748.5
% growth - 3.0 2.6 0.9 1.6
Employment in retailing 37.5 38.4 39.2 40.1 41.2
% growth - 2.4 2.1 2.3 2.7
Employment in retailing as a
% of total employment 5.4 5.4 5.4 5.4 5.5
Source: 1999-2002 Euromonitor from official sources (Ministry of Statistics), trade press, 2003
Euromonitor estimates
Table 24 Employment in Retailing by Full-time/Part-time Split 1999-2003
- Personal and leisure goods 36.9 39.3 42.1 45.6 50.1
Others 13.7 18.6 16.6 15.9 16.2
AVERAGE 83.4 88.9 95.8 102.0 108.8
Source: 1999-2002 Euromonitor from official sources (Ministry of Statistics), trade press, 2003
Euromonitor estimates
4.1 Number of Retail Businesses
At the end of 2003, there were 19 million registered businesses and more than 23 million outlets in China which translated to an average of 1.2 outlets per business. Most of the businesses are small scaled with a small capital outlay. Retail businesses with annual sales of more than RMB 5 Million and with at least 60 employees number approximately 80,000 to 90,000.
Grocery businesses constitute the largest sector. However most of the grocery retailers operate only one small outlet with 10-30 sq m sales area and are run by 1 to 2 people. Grocery retailers with annual sales of more than 2 million RMB with at least 40 employees amount to 20,000 businesses.
The number of new retail business registrations has been increasing rapidly since 2001. Prior to that, growth in new retail business registrations was very small mainly due to the Asian financial crisis. In 2002 and 2003, the China government adjusted policy to support mergers & acquisitions between domestic retailers and the policy played a role in encouraging the proliferation of new business registrations.
In 2002, the number of closures increased by 19.6%. The main reason for this growth is the adjustment on taxation rates from the China centre government, which adjusted taxation rates from 15% to 33%. Many small and middle scale retailers as a result closed their business under such a high taxation amongst fiery competition.
2003 however saw a decline in closures as the initial impact of the raised taxation rates settled down. Together with better government policies and stronger economic growth, it became more attractive for more businesses to continue in their operations.
Table 15 Number of Retail Businesses and Outlets 1999-2003
Source: 1999-2002 Euromonitor from official sources (Ministry of Statistics), trade press, 2003
Euromonitor estimates
Table 16 Number of New Retail Business Registrations and Closures 1999-2003
'000 units
1999 2000 2001 2002 2003
Registrations 951.0 983.5 954.6 1,095 1,356.5
% growth - 3.4 -2.9 14.7 23.9
Closures 478.0 415.3 485 580 450
% growth - -13.1 16.8 19.6 -22.4
Source: 1999-2002 Euromonitor from official sources (Ministry of Statistics), trade press, 2003
Euromonitor estimates
4.2 Number of Retail Businesses by Type
At the end of 2003, the total number of retailing businesses stood at 19 million with the growth of 7.1% over 2002. The largest sector, grocery retail businesses reached 9.8 million in 2003. The characteristic of grocery retail is low running capital costs and few employees. This explains why the number for new registrations and closures are very high for grocery retail businesses.
The number of hypermarkets on the other hand is small due to the high running costs alongside the
high requirement of expertise needed to ensure the stores are successfully managed. In 1999, the number of hypermarket businesses was less than 100. Many domestic hypermarket retailers closed their businesses shortly after commencement due to the lack of management expertise which caused them to lose competitive advantage against the big foreign retailers like Wal-Mart and Carrefour. As a result at the end of 2003, most of the hypermarket businesses in China are run by foreign retailers.
The number of supermarket retail businesses experienced a growth of 94% over the review period. At the end of 2003, the total number of supermarket businesses reached 58,600, an increase of 16.7% compared to 2002. The biggest supermarket retailer in China is Shanghai Lianhua Supermarket Co Ltd which belongs to Shanghai Friendship Co Ltd.
In China, the modern day convenience store has just come into being in recent years, but the speed of development has proved to be rapid. The first batch of convenience stores in China was developed from independent personal stores. Subsequently, supermarket retailers began to develop their own convenience stores. In China, according to the current policy, foreign retailers cannot manage convenience store by themselves, they have to establish the stores through joint ventures with domestic retailers. The first foreign convenience retailer in China was Lawson from Japan. Lawson established a JV with Shanghai Hualian supermarket Co Ltd in 1996. The main outlets opened in Shanghai and in the nearby provinces.
Specialty store is another important retail business type in China. Clothing and footwear, home furnishing/household goods, durable goods and personal and leisure goods account for the bulk of number of businesses within speciality stores. With the increasingly demand in home ownership, the businesses of home furnishing and household goods grew by 46.7% over the review period.
Table 17 Number of Retail Businesses by Type 1999-2003
Number '000
1999 2000 2001 2002 2003
Department stores 15.3 17.6 19.5 21.7 24.2
Hypermarkets 0.1 0.1 0.1 0.2 0.2
Convenience stores 0.5 0.6 0.7 0.8 1.1
Supermarkets 30.2 35.9 42.5 50.2 58.6
Other grocery retailers 8,744.6 8,955.0 9,023.0 9,424.6 9,819.6
Specialty stores
- Health and beauty products 5.5 7.6 9.8 13.5 16.7
- Clothing and footwear 1,717.3 1,799.3 1,845.8 1,901.0 2,006.0
- Home furnishing/Household goods 468.3 521.3 582.0 615.0 687.0
- Durable goods 624.5 645.5 669.8 689.5 721.5
- Personal and leisure goods 2,402.8 2,510.0 2,900.0 3,120.0 3,602.6
Others 1,602.4 1,686.8 1,782.2 1,983.9 2,148.1
TOTAL 15,611.5 16,179.7 16,875.4 17,820.4 19,085.6
Source: 1999-2002 Euromonitor from official sources (Ministry of Statistics), trade press, 2003
Euromonitor estimates
4.3 Number of Retail Outlets by Type
At the end of 2003, the total number of retail outlets reached 23 million in China, with food outlets accounting for 55.7% of all the retail outlets. In 2003, overall growth of food outlets amounted to 6.9%. Although smaller in number, growth of non-food outlet was more dynamic than food outlets at 11%.
Corresponding to the number of businesses, the number of grocery retail outlets also ranked the largest amongst the retail sectors. In grocery retail, the China government does not have very strict policy requirements on foreign grocery retailers.
Convenience stores increased very rapidly in the past five years. Over the review period, the number of convenience store outlets increased by 110%. Although new, convenience stores have rapidly grown in China. For example, Shanghai Nong-gong-shang Supermarket group, one of the larger supermarket chains in China started a convenience store chain Alldays. At the end of 2003, more than 1,000 outlets were opened and as a result, convenience store has become one of its main areas of business.
Department store is another important business format, with the growth in outlets registering 81.5% over the review period. A higher growth was recorded in the beginning of the review period. In the big cities, the domestic department store development has remained stagnant. With little improvements seen in the product offering, environment and service, local department stores are set to face strong competition from foreign players. In China, major foreign department store retailers include Pacific, Parkson and Isetan.
Table 18 Number of Retail Outlets by Food/Non-food Split 1999-2003
'000 outlets
1999 2000 2001 2002 2003
Food 10,568.2 11,326.4 11,676.6 12,371.6 12,843.4
Non-food 7,489.9 7,980.4 8,610.6 9,193.7 10,209.9
TOTAL 18,058.1 19,306.8 20,287.2 21,565.3 23,053.3
Source: 1999-2002 Euromonitor from official sources (Ministry of Statistics), trade press, 2003
Euromonitor estimates
Table 19 Number of Retail Outlets by Type 1999-2003
'000 outlets
1999 2000 2001 2002 2003
Department stores 40.5 50.2 60.4 67.8 73.5
Hypermarkets 0.2 0.2 0.3 0.4 0.5
Convenience stores 15.0 18.0 22.3 26.8 31.5
Supermarkets 150.0 188.0 215.0 250.0 288.0
Other grocery retailers 10,362.5 11,070.0 11,378.6 12,026.6 12,449.9
Specialty stores
- Health and beauty products 17.0 25.0 35.0 45.0 60.0
- Clothing and footwear 1,833.5 1,910.3 2,100.6 2,303.2 2,500.0
- Home furnishing/Household goods 512.4 588.3 645.6 650.4 715.0
- Durable goods 712.5 764.5 821.4 852.5 910.4
- Personal and leisure goods 2,748.0 2,938.0 3,154.5 3,279.3 3,790.5
Others 1,666.5 1,754.3 1,853.5 2,063.3 2,234.0
TOTAL 18,058.1 19,306.8 20,287.2 21,565.3 23,053.3
Source: 1999-2002 Euromonitor from official sources (Ministry of Statistics), trade press, 2003
Euromonitor estimates
4.4 Retail Sales Area
With growth evident in retail businesses and number of outlets, increase in sales area is inevitable. Over the review period, retail sales area grew by 53.5% to reach 2,158.3 million sq m at the end of 2003. Growth in 2003 amounted to 13.2% over 2002.
Between 1999 to 2003, total average area per outlet grew by 20.5%. Unfortunately with rapidly increasing rental rates, the cost burden on retailers is mounting, especially since sales growth has not been comparable in some instances.
The average sales area for supermarkets fell by 8.1% from 1999 to 2003, due to the decline in net margins. This has resulted in retailers trying to be more efficient in a smaller average retail space in an effort to be competitive.
The average sales area of other grocery retailers on the other hand grew by 27% over the review period to reach 55 sq m in 2003. The main reason for the rise was because of the increasing trend of
grocery retailers establishing outlets with bigger sales area, with some of the outlets having more than 2,000 sq m.
Hypermarkets clocked the highest average sales area at 15,000 sq m in 2003. Most of the hypermarket outlets are managed by foreign retailers like Wal-Market, Carrefour and these players have strong expertise in operating very large retail spaces. Several big domestic players such as Shanghai Lianhua Century Hypermarket and Beijing Hualian Hypermarket have also opened big hypermarkets with average sales area of between 16,000-16,500 sq m. Another reason for the improvement in average sales area is the closure of many small and middle domestic players due weak performances.
Table 20 Retail Sales Area 1999-2003
Million sq m
1999 2000 2001 2002 2003
Total retail sales area 1,406.5 1,564.9 1,716.1 1,906.6 2,158.3
% growth - 11.3 9.7 11.1 13.2
Average sq m per outlet 77.7 81.1 84.6 88.4 93.6
Source: 1999-2002 Euromonitor from official sources (Ministry of Statistics), trade press, 2003
Euromonitor estimates
Table 21 Retail Sales Area by Outlet Type 1999-2003
Million sq m
1999 2000 2001 2002 2003
Department stores 101.3 125.5 153.4 176.3 189.6
Hypermarkets 2.4 2.6 4.4 6.1 7.5
Convenience stores 3.0 3.8 5.1 6.3 7.2
Supermarkets 187.8 233.1 262.3 300.0 331.2
Other grocery retailers 451.2 506.3 542.8 582.6 688.1
Specialty stores
- Health and beauty products 0.9 1.5 2.5 3.3 4.3
- Clothing and footwear 132.0 149.0 172.2 195.8 225.0
- Health and beauty products 52.9 60.0 71.4 73.3 71.7
- Clothing and footwear 72.0 78.0 82.0 85.0 90.0
- Home furnishing/Household goods 95.0 97.1 100.1 103.0 105.0
- Durable goods 100.1 95.0 90.0 88.0 90.0
- Personal and leisure goods 77.7 75.9 78.5 80.5 81.3
Others 116.7 108.6 101.0 111.6 107.6
AVERAGE 4.3 4.2 4.2 4.1 4.1
Source: 1999-2002 Euromonitor from official sources (Ministry of Statistics), trade press, 2003
Euromonitor estimates
4.5 Employment in Retailing
At the end of 2003, the total employment in China reached 748.5 million people, which increased 1.6% compared to 2002. Employment as a percentage of the total population in China came up to 57.3% in 2003.
Employment in retailing grew steadily by between 2.1% to 2.7% from 2000 to 2003, with growth being highest in 2003 at 2.7%. Employment in retailing amounted to 41.2 million people in 2003 which occupied 5.5% of total employment. As most retailers are small scaled in China, total sales of the top 100 retailers amounted to approximately only 8% of total retail sales, according to official statistics.
Full time employment occupied 76.5% of total retailing employment in China, however growth was
very slight at 0.4% in 2003. This is against an overall growth of 2.7% in total employment in retailing.
Albeit a lower percentage share, growth in part-time retail employment was much quicker when compared to its full time counterparts. The employment of part-timers neared 10 million with growth of 11.2% in 2003 compared with 2002, with most of this growth taking place in grocery and food retailing.
To better control labour costs, more retailers especially grocery retailers prefer part-time employees as they translate to lower overheads. The growth of part-time employment is expected to be maintained at just over 10% over the next 3 years (2004-2006).
The employment in grocery retailing is the biggest sector of all the employment in retailing, with a percentage share of 44%. Most of the grocery retailers are small and independent with an average annual sales of 75,000RMB and only one or two persons employed.
Hypermarkets employ the largest number of people on a per outlet basis, which range from 250 to 300. With the foreign retailers' entry, most of the hypermarkets now belong to foreign retailers like Wal-Mart, Carrefour, Metro, Trust-Mart, Lotus and Hymall. The average area of hypermarkets is also the highest amongst all retail formats which partly explains why hypermarkets have the highest level of employment per outlet.
Table 23 Employment in Retailing 1999-2003
Million
1999 2000 2001 2002 2003
Total employment 690.7 711.5 730.3 736.6 748.5
% growth - 3.0 2.6 0.9 1.6
Employment in retailing 37.5 38.4 39.2 40.1 41.2
% growth - 2.4 2.1 2.3 2.7
Employment in retailing as a
% of total employment 5.4 5.4 5.4 5.4 5.5
Source: 1999-2002 Euromonitor from official sources (Ministry of Statistics), trade press, 2003
Euromonitor estimates
Table 24 Employment in Retailing by Full-time/Part-time Split 1999-2003
- Personal and leisure goods 36.9 39.3 42.1 45.6 50.1
Others 13.7 18.6 16.6 15.9 16.2
AVERAGE 83.4 88.9 95.8 102.0 108.8
Source: 1999-2002 Euromonitor from official sources (Ministry of Statistics), trade press, 2003
Euromonitor estimates
5. TRENDS IN RETAIL SALES
5.1 Total Retail Sales
Total retail sales reached RMB4.48 trillion in 2003 in China. Although the Chinese retail industry was greatly impacted by SARS in the first half of 2003, total retail sales still maintained a high growth of 9.6%, marking a stronger performance over growth in 2002.
During the SARS infected period, sales impact on grocery retail was the heaviest. The China government issued some emergency policies though to support the retail industry such as the elimination or reduction of taxation. In the second half of 2003 after SARS was put under control, all sectors within the retail industry strong showed signs of a rebound.
2004 will be the last protected year before all entry barriers into China are brought down after the country's ascension into the WTO. In light of this development, total retail sales is expected to rake in strong growths into the forecast period. From 2005 onwards, all foreign retailers will be allowed to open their businesses with 100% foreign currency capital. The fastest and easiest way for foreign retailers to expand their business is to merge with domestic retailers. From 2005, there will be an influx of M&A activities between domestic and foreign retailers. Domestic retailers have been well aware of this potential threat and hence, many M&A activities are taking place between domestic retailers in preparation for 2005.
Table 27 Total Retail Sales 1999-2003
RMB billion
1999 2000 2001 2002 2003
Current prices 3,131.4 3,415.3 3,759.5 4,091.1 4,484.3
Source: 1999-2002 Euromonitor from official sources (Ministry of Statistics), trade press, 2003
Euromonitor estimates
5.2 Retail Sales by Food/Non-food Split
Food retail sales account for a larger proportion of total retail sales In China. In 2003, the sales share on food was at 58.4% where absolute sales reached 2,618.3 billion RMB. Despite the larger share, growth slowed down slightly in 2003 as compared to 2002 due to the impact of SARs.
Non-food sector on the other hand clocked in stronger growth in 2003. Growth for the whole review period can be tied in with the development of the China economy which resulted in local consumer seeking a better lifestyle. This entailed increased purchases in clothing and footwear, household goods, leisure items, etc. The increasing disposable income is the main factor pushing the growth in retail sales.
Table 28 Retail Sales by Food/Non-food Split 1999-2003
RMB billion
1999 2000 2001 2002 2003
Food 1,810.0 1,970.2 2,199.8 2,411.0 2,618.3
% growth - 8.9 11.7 9.6 8.6
Index 1999 = 100 100 108.9 121.5 133.2 144.7
Non-food 1,321.4 1,445.1 1,559.7 1,680.1 1,866.0
% growth - 9.4 7.9 7.7 11.1
Index 1999 = 100 100 109.4 118 127.1 141.2
TOTAL 3,131.4 3,415.3 3,759.5 4,091.1 4,484.3
Source: 1999-2002 Euromonitor from official sources (Ministry of Statistics), trade press, 2003
Euromonitor estimates
Note: Food sales indicated here include sales of non-food groceries
5.3 Retail Sales by Region
China is a big country with a huge territory of 9.6 million sq km, there are 36 provinces and 655 cities in China. The China territory has been segmented into 6 geographical regions.
Retail sales in east China occupied one third of the total retail sales in 2003. Shanghai is the biggest city in China, its economy also ranked first in China. Among all the provinces in China, retail sales of Shanghai city is much higher than many provinces. The growth of Shanghai retail sales in 2003 was 13.3%, higher than the average growth in East China.
Beijing is the second largest city in China; its retail sales grew by 52.4% from 1999 to 2003. Beijing is the capital city of China, located in the north. In 2003, retail sales grew by 12.2%.
South China's retail sales account for 28.1% of total retail sales in China. The main reason for the South's big share is because of its proximity to Hong Kong and Taiwan. Specifically, Guangdong province is next to Hong Kong, and very near Taiwan. Guangdong province's retail sales comprise the largest province in South China. The language of Guangdong province is the same as the language in Hong Kong, further encouraging Hong Kong companies to set up companies or production plants. This helps to accelerate the economic growth of Guangdong province. Retail sales growth of Guangdong province in 2003 was at 9.3%. Wal-Mart's headquarters in China is located in Guangdong province.
Table 29 Retail Sales by Region 1999-2003
RMB billion
1999 2000 2001 2002 2003
North China 432.1 490.6 536.2 585.5 671.0
- Beijing 123.4 140.2 153.4 167.5 188.0
- Tianjin 60.1 70.4 83.3 93.0 107.0
- Hebei 145.6 168.4 177.8 190.0 219.0
- Shanxi 59.0 64.0 68.0 75.0 86.0
- Internal Mongolia 44.0 47.6 53.7 60.0 71.0
North-East China 322.3 354.0 389.8 425.0 477.0
- Liaoning 164.3 180.4 198.0 215.0 239.0
- Jilin 75.0 82.1 90.9 100.0 115.0
- Heilongjiang 83.0 91.5 100.9 110.0 123.0
East China 1,080.0 1,181.3 1,294.7 1,398.0 1,525.0
- Shanghai 163.5 162.5 186.1 210.0 238.0
- Jiangsu 225.0 248.1 268.9 285.0 305.0
- Zhejiang 210.0 224.3 245.6 264.0 281.0
- Anhui 86.0 95.6 104.3 115.0 124.0
- Fujian 125.0 138.0 150.0 162.0 180.0
- Jiangxi 62.5 69.4 76.3 82.0 91.0
- Shandong 228.0 243.4 263.5 280.0 306.0
South China 869.4 935.2 1,041.3 1,130.0 1,260.4
- Henan 153.0 163.5 178.0 192.0 215.4
- Hubei 152.0 162.3 179.5 194.0 215.0
- Hunan 124.0 132.0 151.1 160.0 178.0
- Guangdong 355.0 385.0 430.5 471.0 515.0
- Guangxi 73.0 77.0 83.4 92.0 112.0
- Hainan 12.4 15.4 18.8 21.0 25.0
South-West China 285.6 312.7 336.0 372.7 419.4
- Chongqing 55.0 63.0 69.9 75.0 86.0
- Sichuan 146.0 155.0 162.0 180.2 202.0
- Guizhou 32.0 35.5 37.8 42.0 47.0
- Yunnan 49.0 55.0 61.4 70.0 78.0
- Xizhuang 3.6 4.2 4.9 5.5 6.4
West China 122.0 141.5 161.5 179.9 131.5
- Shanxi 47.0 55.0 62.5 69.0 7.5
- Gansu 32.0 35.0 39.5 43.0 47.0
- Qinghai 7.0 8.0 9.0 10.2 11.0
- Ningxia 6.0 7.5 9.9 11.2 13.5
- Xinjiang 30.0 36.0 40.6 46.5 52.5
TOTAL 3,131.4 3,415.3 3,759.5 4,091.1 4,484.3
Source: 1999-2002 Euromonitor from official sources (Ministry of Statistics), trade press, 2003
Euromonitor estimates
Note: Totals may not sum due to rounding
5.4 Retail Sales by Type of Outlet
Retail sales as a whole grew by 43.2% over the review period. In food retailing, 33.4% of retail sales is attributable to the supermarket format. It also accounts for the second largest format when compared against the total retail industry as a whole in China. The growth of supermarket has been very stable and healthy. The concept of browsing the aisles and inspecting the goods before purchasing has been very well received amongst the Chinese consumers. The introduction of supermarkets brought a new retail concept to the consumers.
Hypermarkets was introduced to China in 1995 by foreign retailers such as Wal-Mart and Carrefour. Subsequently many domestic retailers followed suit and developed their businesses into hypermarkets. Outstanding domestic hypermarket retailers include Shanghai Lianhua Century Hypermarket, Shanghai Hualian Hypermarket, Beijing Hualian Hypermarket, Shanghai Nong-gong-shang Supermarket group and Suguo Hypermarket. Sales in 2003 reached 200.8 billion, accounting for 4.5% of the total retail industry. The growth of hypermarket sales in 2002 and 2003 was at 19.8% and 17.8% respectively, indicating a bright future of the retail format.
Independent grocers is the most important business format in the retail industry due to its sheer contribution to total retail sales in China. Usually the independent grocer can be managed by one person with a capital outlay of as low as 10,000 RMB. In some small cities, the amount can be even less than 1,000 RMB. The big quantity of independent grocers established the important position in total retail sales.
In the non-food sector, department stores captured over 18% of total non-food retail sales in 2003. In the big cities, department stores are usually located in city centres where consumer traffic is high. The average sales area of a typical department store in the big cities is very high, at more than 11,000 sq m. The average size tends to gradually get smaller in tandem with the size and prosperity of the cities. Sizes can be as small as 2,500 sq m in the smaller cities.
As disposable incomes rise with economic prosperity, inevitably consumers are more encouraged to spend on the less important necessities such as clothing /footwear/ leatherwear and accessories. More and more famous fashion labels have established their specialty stores in China. The imported designer clothing can now be easily found in the big cities such as Shanghai and Beijing.
Retail sales of home furniture and furnishings grew by 48% over the review period. The the rapid growth in demand for housing has been instrumental in fuelling the demand for household and home furniture and furnishing. In China, there are also many famous foreign home furniture and furnishing retailers such as Ikea, B&Q, OBI, all of which have large retail sales area. Ikea has two outlets in China, one is in Shanghai and the other is in Beijing. Retail sales area of the Shanghai outlet is in the region of 30,000 sq m. The biggest domestic home furniture and furnishings retailer in China is Shanghai
Homemart Co Ltd which belongs to Shanghai Friendship Group.
In 2003, convenience store sales grew by 11.5% over 2002 to RMB 92.1 billion. For convenience stores, 95% of the merchandise are food items. Generally convenience stores are located near or inside a residential area. The lower capital outlay alongside lower management costs has allowed the proliferation of convenience stores in the big cities. Growth in sales however has somewhat been affected by the stiff competition faced by the retail format. In some place, there will be 3 or 4 convenience stores located next to each other. As a result, net margins have been squeezed in an effort to remain competitive.
Table 30 Retail Sales by Type of Outlet 1999-2003
RMB billion
1999 2000 2001 2002 2003
Department stores 345.4 360.3 390.5 432.0 482.5
Hypermarkets 96.3 118.5 142.3 170.5 200.8
Convenience stores 61.4 67.4 73.5 82.6 92.1
Supermarkets 623.5 664.0 721.0 810.5 875.4
Other grocery retailers 1,028.8 1,120.3 1,263.0 1,347.4 1,450.3
Specialty stores
- Health and beauty products 158.7 172.2 184.8 195.0 215.2
- Clothing and footwear 120.4 138.2 150.1 165.0 183.0
- Home furnishing/Household goods 200.6 224.8 248.9 267.4 296.9
- Durable goods 183.0 195.1 206.5 218.0 232.0
- Personal and leisure goods 237.0 267.4 295.5 319.5 360.3
Others 76.3 87.1 83.4 83.2 95.8
TOTAL 3,131.4 3,415.3 3,759.5 4,091.1 4,484.3
Source: 1999-2002 Euromonitor from official sources (Ministry of Statistics), trade press, 2003
Euromonitor estimates
Note: Totals may not sum due to rounding
Table 31 Retail Sales by Type of Outlet: % Analysis 1999-2003
%
1999 2000 2001 2002 2003
Department stores 11.0 10.5 10.4 10.6 10.8
Hypermarkets 3.1 3.5 3.8 4.2 4.5
Convenience stores 2.0 2.0 2.0 2.0 2.1
Supermarkets 19.9 19.4 19.2 19.8 19.5
Other grocery retailers 32.9 32.8 33.6 32.9 32.3
Specialty stores
- Health and Beauty products 5.1 5.0 4.9 4.8 4.8
- Clothing and footwear 3.8 4.0 4.0 4.0 4.1
- Home furnishing/Household goods 6.4 6.6 6.6 6.5 6.6
- Durable goods 5.8 5.7 5.5 5.3 5.2
- Personal and leisure goods 7.6 7.8 7.9 7.8 8.0
Others 2.4 2.6 2.2 2.0 2.1
TOTAL 100.0 100.0 100.0 100.0 100.0
Source: 1999-2002 Euromonitor from official sources (Ministry of Statistics), trade press, 2003
Euromonitor estimates
Note: Totals may not sum due to rounding
Table 32 Retail Sales by Type of Outlet: % Growth 1999-2003
%
1999/2003 2002/2003
Department stores 39.7 11.7
Hypermarkets 108.5 17.8
Convenience stores 50.0 11.5
Supermarkets 40.4 8.0
Other grocery retailers 41.0 7.6
Specialty stores
- Health and beauty products 35.6 10.4
- Clothing and footwear 52.0 10.9
- Home furnishing/Household goods 48.0 11.0
- Durable goods 26.8 6.4
- Personal and leisure goods 52.0 12.8
Others 25.6 15.1
TOTAL 43.2 9.6
Source: 1999-2002 Euromonitor from official sources (Ministry of Statistics), trade press, 2003
Euromonitor estimates
Note: Totals may not sum due to rounding
5.1 Total Retail Sales
Total retail sales reached RMB4.48 trillion in 2003 in China. Although the Chinese retail industry was greatly impacted by SARS in the first half of 2003, total retail sales still maintained a high growth of 9.6%, marking a stronger performance over growth in 2002.
During the SARS infected period, sales impact on grocery retail was the heaviest. The China government issued some emergency policies though to support the retail industry such as the elimination or reduction of taxation. In the second half of 2003 after SARS was put under control, all sectors within the retail industry strong showed signs of a rebound.
2004 will be the last protected year before all entry barriers into China are brought down after the country's ascension into the WTO. In light of this development, total retail sales is expected to rake in strong growths into the forecast period. From 2005 onwards, all foreign retailers will be allowed to open their businesses with 100% foreign currency capital. The fastest and easiest way for foreign retailers to expand their business is to merge with domestic retailers. From 2005, there will be an influx of M&A activities between domestic and foreign retailers. Domestic retailers have been well aware of this potential threat and hence, many M&A activities are taking place between domestic retailers in preparation for 2005.
Table 27 Total Retail Sales 1999-2003
RMB billion
1999 2000 2001 2002 2003
Current prices 3,131.4 3,415.3 3,759.5 4,091.1 4,484.3
Source: 1999-2002 Euromonitor from official sources (Ministry of Statistics), trade press, 2003
Euromonitor estimates
5.2 Retail Sales by Food/Non-food Split
Food retail sales account for a larger proportion of total retail sales In China. In 2003, the sales share
on food was at 58.4% where absolute sales reached 2,618.3 billion RMB. Despite the larger share, growth slowed down slightly in 2003 as compared to 2002 due to the impact of SARs.
Non-food sector on the other hand clocked in stronger growth in 2003. Growth for the whole review period can be tied in with the development of the China economy which resulted in local consumer seeking a better lifestyle. This entailed increased purchases in clothing and footwear, household goods, leisure items, etc. The increasing disposable income is the main factor pushing the growth in retail sales.
Table 28 Retail Sales by Food/Non-food Split 1999-2003
RMB billion
1999 2000 2001 2002 2003
Food 1,810.0 1,970.2 2,199.8 2,411.0 2,618.3
% growth - 8.9 11.7 9.6 8.6
Index 1999 = 100 100 108.9 121.5 133.2 144.7
Non-food 1,321.4 1,445.1 1,559.7 1,680.1 1,866.0
% growth - 9.4 7.9 7.7 11.1
Index 1999 = 100 100 109.4 118 127.1 141.2
TOTAL 3,131.4 3,415.3 3,759.5 4,091.1 4,484.3
Source: 1999-2002 Euromonitor from official sources (Ministry of Statistics), trade press, 2003
Euromonitor estimates
Note: Food sales indicated here include sales of non-food groceries
5.3 Retail Sales by Region
China is a big country with a huge territory of 9.6 million sq km, there are 36 provinces and 655 cities in China. The China territory has been segmented into 6 geographical regions.
Retail sales in east China occupied one third of the total retail sales in 2003. Shanghai is the biggest city in China, its economy also ranked first in China. Among all the provinces in China, retail sales of Shanghai city is much higher than many provinces. The growth of Shanghai retail sales in 2003 was 13.3%, higher than the average growth in East China.
Beijing is the second largest city in China; its retail sales grew by 52.4% from 1999 to 2003. Beijing is the capital city of China, located in the north. In 2003, retail sales grew by 12.2%.
South China's retail sales account for 28.1% of total retail sales in China. The main reason for the South's big share is because of its proximity to Hong Kong and Taiwan. Specifically, Guangdong province is next to Hong Kong, and very near Taiwan. Guangdong province's retail sales comprise the largest province in South China. The language of Guangdong province is the same as the language in Hong Kong, further encouraging Hong Kong companies to set up companies or production plants. This helps to accelerate the economic growth of Guangdong province. Retail sales growth of Guangdong province in 2003 was at 9.3%. Wal-Mart's headquarters in China is located in Guangdong province.
Table 29 Retail Sales by Region 1999-2003
RMB billion
1999 2000 2001 2002 2003
North China 432.1 490.6 536.2 585.5 671.0
- Beijing 123.4 140.2 153.4 167.5 188.0
- Tianjin 60.1 70.4 83.3 93.0 107.0
- Hebei 145.6 168.4 177.8 190.0 219.0
- Shanxi 59.0 64.0 68.0 75.0 86.0
- Internal Mongolia 44.0 47.6 53.7 60.0 71.0
North-East China 322.3 354.0 389.8 425.0 477.0
- Liaoning 164.3 180.4 198.0 215.0 239.0
- Jilin 75.0 82.1 90.9 100.0 115.0
- Heilongjiang 83.0 91.5 100.9 110.0 123.0
East China 1,080.0 1,181.3 1,294.7 1,398.0 1,525.0
- Shanghai 163.5 162.5 186.1 210.0 238.0
- Jiangsu 225.0 248.1 268.9 285.0 305.0
- Zhejiang 210.0 224.3 245.6 264.0 281.0
- Anhui 86.0 95.6 104.3 115.0 124.0
- Fujian 125.0 138.0 150.0 162.0 180.0
- Jiangxi 62.5 69.4 76.3 82.0 91.0
- Shandong 228.0 243.4 263.5 280.0 306.0
South China 869.4 935.2 1,041.3 1,130.0 1,260.4
- Henan 153.0 163.5 178.0 192.0 215.4
- Hubei 152.0 162.3 179.5 194.0 215.0
- Hunan 124.0 132.0 151.1 160.0 178.0
- Guangdong 355.0 385.0 430.5 471.0 515.0
- Guangxi 73.0 77.0 83.4 92.0 112.0
- Hainan 12.4 15.4 18.8 21.0 25.0
South-West China 285.6 312.7 336.0 372.7 419.4
- Chongqing 55.0 63.0 69.9 75.0 86.0
- Sichuan 146.0 155.0 162.0 180.2 202.0
- Guizhou 32.0 35.5 37.8 42.0 47.0
- Yunnan 49.0 55.0 61.4 70.0 78.0
- Xizhuang 3.6 4.2 4.9 5.5 6.4
West China 122.0 141.5 161.5 179.9 131.5
- Shanxi 47.0 55.0 62.5 69.0 7.5
- Gansu 32.0 35.0 39.5 43.0 47.0
- Qinghai 7.0 8.0 9.0 10.2 11.0
- Ningxia 6.0 7.5 9.9 11.2 13.5
- Xinjiang 30.0 36.0 40.6 46.5 52.5
TOTAL 3,131.4 3,415.3 3,759.5 4,091.1 4,484.3
Source: 1999-2002 Euromonitor from official sources (Ministry of Statistics), trade press, 2003
Euromonitor estimates
Note: Totals may not sum due to rounding
5.4 Retail Sales by Type of Outlet
Retail sales as a whole grew by 43.2% over the review period. In food retailing, 33.4% of retail sales is attributable to the supermarket format. It also accounts for the second largest format when compared against the total retail industry as a whole in China. The growth of supermarket has been very stable and healthy. The concept of browsing the aisles and inspecting the goods before purchasing has been very well received amongst the Chinese consumers. The introduction of supermarkets brought a new retail concept to the consumers.
Hypermarkets was introduced to China in 1995 by foreign retailers such as Wal-Mart and Carrefour. Subsequently many domestic retailers followed suit and developed their businesses into hypermarkets. Outstanding domestic hypermarket retailers include Shanghai Lianhua Century Hypermarket, Shanghai Hualian Hypermarket, Beijing Hualian Hypermarket, Shanghai Nong-gong-shang Supermarket group and Suguo Hypermarket. Sales in 2003 reached 200.8 billion, accounting for 4.5% of the total retail industry. The growth of hypermarket sales in 2002 and 2003 was at 19.8% and 17.8% respectively, indicating a bright future of the retail format.
Independent grocers is the most important business format in the retail industry due to its sheer contribution to total retail sales in China. Usually the independent grocer can be managed by one person with a capital outlay of as low as 10,000 RMB. In some small cities, the amount can be even
less than 1,000 RMB. The big quantity of independent grocers established the important position in total retail sales.
In the non-food sector, department stores captured over 18% of total non-food retail sales in 2003. In the big cities, department stores are usually located in city centres where consumer traffic is high. The average sales area of a typical department store in the big cities is very high, at more than 11,000 sq m. The average size tends to gradually get smaller in tandem with the size and prosperity of the cities. Sizes can be as small as 2,500 sq m in the smaller cities.
As disposable incomes rise with economic prosperity, inevitably consumers are more encouraged to spend on the less important necessities such as clothing /footwear/ leatherwear and accessories. More and more famous fashion labels have established their specialty stores in China. The imported designer clothing can now be easily found in the big cities such as Shanghai and Beijing.
Retail sales of home furniture and furnishings grew by 48% over the review period. The the rapid growth in demand for housing has been instrumental in fuelling the demand for household and home furniture and furnishing. In China, there are also many famous foreign home furniture and furnishing retailers such as Ikea, B&Q, OBI, all of which have large retail sales area. Ikea has two outlets in China, one is in Shanghai and the other is in Beijing. Retail sales area of the Shanghai outlet is in the region of 30,000 sq m. The biggest domestic home furniture and furnishings retailer in China is Shanghai Homemart Co Ltd which belongs to Shanghai Friendship Group.
In 2003, convenience store sales grew by 11.5% over 2002 to RMB 92.1 billion. For convenience stores, 95% of the merchandise are food items. Generally convenience stores are located near or inside a residential area. The lower capital outlay alongside lower management costs has allowed the proliferation of convenience stores in the big cities. Growth in sales however has somewhat been affected by the stiff competition faced by the retail format. In some place, there will be 3 or 4 convenience stores located next to each other. As a result, net margins have been squeezed in an effort to remain competitive.
Table 30 Retail Sales by Type of Outlet 1999-2003
RMB billion
1999 2000 2001 2002 2003
Department stores 345.4 360.3 390.5 432.0 482.5
Hypermarkets 96.3 118.5 142.3 170.5 200.8
Convenience stores 61.4 67.4 73.5 82.6 92.1
Supermarkets 623.5 664.0 721.0 810.5 875.4
Other grocery retailers 1,028.8 1,120.3 1,263.0 1,347.4 1,450.3
Specialty stores
- Health and beauty products 158.7 172.2 184.8 195.0 215.2
- Clothing and footwear 120.4 138.2 150.1 165.0 183.0
- Home furnishing/Household goods 200.6 224.8 248.9 267.4 296.9
- Durable goods 183.0 195.1 206.5 218.0 232.0
- Personal and leisure goods 237.0 267.4 295.5 319.5 360.3
Others 76.3 87.1 83.4 83.2 95.8
TOTAL 3,131.4 3,415.3 3,759.5 4,091.1 4,484.3
Source: 1999-2002 Euromonitor from official sources (Ministry of Statistics), trade press, 2003
Euromonitor estimates
Note: Totals may not sum due to rounding
Table 31 Retail Sales by Type of Outlet: % Analysis 1999-2003
%
1999 2000 2001 2002 2003
Department stores 11.0 10.5 10.4 10.6 10.8
Hypermarkets 3.1 3.5 3.8 4.2 4.5
Convenience stores 2.0 2.0 2.0 2.0 2.1
Supermarkets 19.9 19.4 19.2 19.8 19.5
Other grocery retailers 32.9 32.8 33.6 32.9 32.3
Specialty stores
- Health and Beauty products 5.1 5.0 4.9 4.8 4.8
- Clothing and footwear 3.8 4.0 4.0 4.0 4.1
- Home furnishing/Household goods 6.4 6.6 6.6 6.5 6.6
- Durable goods 5.8 5.7 5.5 5.3 5.2
- Personal and leisure goods 7.6 7.8 7.9 7.8 8.0
Others 2.4 2.6 2.2 2.0 2.1
TOTAL 100.0 100.0 100.0 100.0 100.0
Source: 1999-2002 Euromonitor from official sources (Ministry of Statistics), trade press, 2003
Euromonitor estimates
Note: Totals may not sum due to rounding
Table 32 Retail Sales by Type of Outlet: % Growth 1999-2003
%
1999/2003 2002/2003
Department stores 39.7 11.7
Hypermarkets 108.5 17.8
Convenience stores 50.0 11.5
Supermarkets 40.4 8.0
Other grocery retailers 41.0 7.6
Specialty stores
- Health and beauty products 35.6 10.4
- Clothing and footwear 52.0 10.9
- Home furnishing/Household goods 48.0 11.0
- Durable goods 26.8 6.4
- Personal and leisure goods 52.0 12.8
Others 25.6 15.1
TOTAL 43.2 9.6
Source: 1999-2002 Euromonitor from official sources (Ministry of Statistics), trade press, 2003
Euromonitor estimates
Note: Totals may not sum due to rounding
6. ASPECTS OF RETAILING
6.1 Government Policy
New government policies for foreign retailing companies after entry to WTO
After China's entry to WTO, the Government defined a schedule regarding the opening of the retail industry. In the wholesaling industry, the government now allows the foreign capital to hold majority shares in joint-venture (JV) firms and removed the limit in area and quantity of foreign investment in wholesaling firms. These foreign-owned or -backed service suppliers can now provide full wholesaling services to its customers for its products, including after sales service.
In the retailing sector, foreign service suppliers may provide retail services (excluding tobacco) through joint ventures, subject to geographic restrictions. By December 11, 2003 however, foreign majority control was permitted to all provincial capitals including Chongqing and Ningbo.
Prior to China's accession, foreign service suppliers could form joint ventures to provide retail services in the five Special Economic Zones (Shenzhen, Zhuhai, Shantou, Xiamen, and Hainan) and six cities (Beijing, Shanghai, Tianjin, Guangzhou, Dalian, and Qingdao).
Additionally in Beijing and Shanghai, no more than four joint venture retailing enterprises are permitted. In each of the other cities, no more than two joint venture enterprises may be established.
Two enterprises out of the four established in Beijing may set up their branches in Beijing. Joint venture retailing enterprises may also be established in Wuhan and Zhengzhou.
China government will issue series of policies to enlarge the scale of using foreign capital in business
field
Since 1992, China had absorbed over USD 3 billion in foreign capital in authorising the establishment of more than 40 foreign commercial corporations to invest in China. In light of retailing, more than half of the world's 50 largest retailing groups had entered the China market. During a multinational retailing groups' meeting, the China government's Economic & Trading committee indicated measures that were in placed to improve the degree of opening up the retail market. The implementation of these measures are aimed at enlarging the scope of using foreign capital and also increase the quality of using foreign capital. These measures include:
Placing emphasis on supply-chain business and logistic; encourage the import of the advanced technological and logistic management know-how from overseas; encourage the reconstruction of traditional commerce with the usage of foreign capital and also the speeding up of constructing modern establishment structure. This also includes the import of foreign talent.
Leveraging on foreign investments.
In recent years, hypermarket, warehouse store and supermarket have been the main fields of which the Chinese government had made use of foreign capital. They will now push these retail formats inland to further develop its middle-west district. Known for their competence in offering sophisticated level of convenience, safer and better service to consumers, the Chinese government will continue to introduce and develop the hypermarket, convenience store, medium-size supermarket and professional store formats to leverage fully from their operational structure.
Multinational retailing corporation is hopeful to enlarge the scope of purchasing in China (New policy)
By 2004, a new policy should be in place to allow foreign retailing corporations to enlarge their scope of purchasing activities in China. According to China's Foreign Trading department, the new policy will allow foreign retailing corporations to establish purchasing centres in China and carry out direct purchasing activities. This will consequently increase foreign capital expenditure into the Chinese economy.
In most multinational corporations, operations are separated into two self-governed systems – Retailing and Wholesaling. At present, only retailing has made its bow into China, whereby players such as Carrefour and Wal-Mart's wholesaling operations are represented by a "representative office" and not as part of the core set-up of the retailing operations of the company in China. A government spokesman indicated that "to open wholesaling to foreigners would be in the same direction as the China government's enlarging export policy, in the meantime, also allowing for increased export efficiency with the usage of multinationals' commerce systems".
6.2 Retail Lobbying
In all cities and towns and even sometimes at lower regional levels, do Consumers Associations exist. These are quasi-governmental entities. The Consumer Associations are set up to promote consumer awareness, conduct periodic consumer surveys on product quality, price and after-sales service, mediate between consumers and retailers/suppliers, provide feedback and suggestions to relevant authorities, and monitor the law compliance on all aspects of commodity sales.
The Associations are presented as the voice of the Chinese consumers and the protector of consumers' legal rights especially when it comes to passing important retail legislation in the People's Congress.
The China Chain-store and Franchise Association (CCFA) is another influential organisation. The CCFA was established in 1997 as a nationwide retail trade organisation approved by and registered at the PRC Civil Affairs Ministry, with its headquarters in Beijing. By the end of October 1999, it had 307 members.
Most members are chain retailers in the medium-sized and big cities in China, and include supermarkets, convenience stores, specialised stores, hypermarkets, department stores and other businesses such as hotels, fast food restaurants and hairdressers. They have been very successful in expanding their businesses through chain retailing and franchising, and each of them is quite competitive with a significant share in the retail market.
The mission of the CCFA is to serve as a bridge between government authorities, relative trades and all walks of social community for better communication and cooperation, and to provide comprehensive services to chain retailers by creating an excellent external environment for the retailers' development.
The main responsibilities of the CCFA include implementing the tasks entrusted by the government authorities, improving communication among members and providing guidance, feedback the wishes and requests by the members to the authorities, protecting the lawful rights of its members and publishing data and books concerning chain retailing, among others. It is very influential in lobbying the government for certain legislation to improve the retailing business environment.
6.3 Retail Landscape
Main street versus out of town
Given the disparity between rural and urban cities, China's retail landscape varies significantly across different regions. In the city, constant upgrades and developments lace the retail scene with the presence of large-scale outlet. On the other hand, the retail scene in rural China assumes the reverse
trend. Supermarkets and hypermarkets, which thrive on large volume sales – albeit lower prices, cannot survive under such minuscule demand. This is further supported by the fact that, according to the national statistics bureau in 2003, urbanised retail sales accounted for 72% of total retail sales in the country.
Although the spending power of consumers in the different regions of China dictates the viability and availability of retail channels in the respective regions, the sophistication of retailers certainly plays a critical role is carving the retail landscape. Stereotypically, as rural retailers employ the management styles of the old economy, basking in their comfort zones, this further stifles growth in their service offerings.
Nevertheless, the adage "you win some, you lose some" is highly applicable to the micro aspects of the urbanised retail environment. With large department stores, specialty chain stores and foreign brand stores maintaining a strong foothold in the city landscape, the staying power of independent retailers falters. As such, the retail scene in the city is consistently changing with new start-ups and closures marking the market.
Shopping centres and malls
In 2003, there were 236 shopping centres in the major cities of China comprising of 94 new establishments within that same year. Based on the number of shopping centres by region, Shanghai, Guangzhou, Shenzhen, Beijing, Chengdu, Dalian, Chongqing and Wuhan collectively housed 72% of shopping centres in China.
This trend is expected to carry on over the next 3 years. As a reflection of investors confidence, developments that are anticipated during this time frame includes the following.
6.4 Emerging Retail Formats – Warehouse Clubs
Introduction
Warehouse clubs format is a new business type in China retail industry. The main consumers of warehouse clubs are usually some speciality consumer or companies, or restaurants and they would need to be members in order to shop there. Food merchandise is typically the priority for members when they make their purchase there. Other warehouse clubs in the world are Metro, Makro in Germany and Price/Costco in USA. The sales area of warehouse clubs is by far the biggest amongst the other retail formats to display more merchandise at lower prices.
Development of warehouse clubs
The first warehouse clubs retailer was Metro from Germany in 1996. After Metro, IKEA, the home furnishing group entered the China market in 1998 to open 2 outlets. Due to the sophisticated level of
operational expertise required for running the warehouse clubs format, China has yet seen the entrance of domestic players towards the end of 2003.
Trends in retailer turnover
Metro and IKEA contributed to the retail sales through warehouse clubs. The sales in 1999 was 4,655.5 million RMB. Warehouse clubs format has since enjoyed high growth of more than 16% annually to surpass a total sales of 10 billion RMB in 2003. The market has grown by 119.7% in 5 years with 2003 alone experiencing a dramatic growth by 36%.
Table 33 Retail Sales through Warehouse Clubs 1999-2003
RMB million
1999 2000 2001 2002 2003
TOTAL 4,655.5 5,400.4 6,318.5 7,519 10,226
% growth - 16.0 17.0 19.0 36.0
Source: 1999-2002 Euromonitor from trade press(China Daily), 2003 Euromonitor estimates
Leading retailers
Metro took the leading position of the warehouse clubs retailers in 2002 and 2003. The annual sales in 2003 grew by 36% to assume 8,885 million RMB. The sales per outlet reached 423.1 million RMB in 2003. In 8 years after entering the China market in 1996, Metro had opened 21 outlets.
Home furnishing giant IKEA opened 2 outlets in China since 1998. The outlet in Shanghai stands at 32,000 sq m sales area, while the other in Beijing at 15,400 sq m sales area. IKEA's annual sales in 2003 was 1,341 million RMB to mark a 36% growth from 2002. The main reason for IKEA's high growth in 2003 can be attributed to its opening of a new behemoth store in Shanghai after the closure of an older, smaller store that stood at 8,400 sq m,
Table 34 Leading Warehouse Clubs Retailers 2002-2003
RMB millions/outlets/sq metres
Sales 2002 Outlets 2002 Sales 2003 Outlets 2003
Metro 6,533 18 8,885 21
IKEA 986 2 1,341 2
TOTAL 7,519 20 10,226 23
Source: 1999-2002 Euromonitor from company research, company reports, trade press, 2003
Euromonitor estimates
6.5 Emerging Retail Formats – Internet Retailing
Introduction
Internet retailing in China is still in its infancy but it has been developing well and the prospects are bright. Euromonitor research revealed information about the internet economy from the consumers perspective. The research focused on 502 local residents with middle class and upwards degrees in Beijing, Shanghai and Guangzhou, the three major economic cities of China. The results showed that 85% of residents care about the internet economy and more than half of the residents have used the internet. 92.1% of residents thought that since the internet was the main method of information and knowledge transfer, its development would push rapid growth in communication and Information in China and further development between those two areas.
At the end of 2003, there were 4,488 consumer expenditure e-business websites in China. At that point, the number of shopping websites was 3,141, the number of auction websites was 445, the number of long distance education websites was 583 and the number of long distance medical treatment websites was 319. However, there are some problems regarding internet retailing in that 80% of consumers worry about the security of payment and the insurance of exchanging a purchase and 40% of consumers are used to traditional modes of expenditure, however 70% of consumers still want to try. The most active city for internet retailing in 2003 was Shanghai.
Development of internet retailing
The younger generation has affected internet retailing. Internet retailing is exerting more and more power due to the popularisation of the internet and the quantity of people who use it. There is a culture factor that cannot be ignored in that the younger generation, aged anywhere between 2-20 years old, is an 'internet generation'. They have grown up with the internet and they are not like their parent's generation, who look at the internet as a method of technology but not as a basic factor of life. The concept of expenditure is changing amidst this new generation, meaning that corporations need to adapt as soon as possible, to provide them with more numerous and satisfactory choices.
China's entry into the WTO is a beneficial factor, although it will also bring a huge challenge to the domestic retail industry and internet retailers. The country's entry into the WTO will push the development of internet retailing in various ways: the reduction in custom duty will make it possible for more computers to enter Chinese households, thus increasing the popularisation and usage rate of the internet; the opening up of the finance industry will solve the problem of back payment methods; and the opening up of the telecommunications industry will reduce the cost of internet sales and push the birth of more internet shops, making internet shopping fashionable. Over the long term, after entry into the WTO, old concepts and cultures will be impacted and people's concepts of value will change.
During this process, consumers will become more accustomed to accepting internet sales. Furthermore, the opening up and improvement of distribution and logistics will push the development of internet retailing.
Trends in retailer turnover
According to National Statistics Bureau data, at the end of 2003, the computer ownership rate of Chinese families was 33.2%. In some big cities like Shanghai and Beijing, the computer ownership rate within the city was more than 67%. This is a strong reason for the rapid growth of internet retailing. However, total annual sales through internet retailing were very low compared to total retail sales not through internet retailing. In 1999, retail sales through internet retailing amounted to RMB233.3 million. At the end of 2003, retail sales through internet retailing reached RMB790 million, an increase of almost 240% over the review period.
At the end of 2003, there were 70 million residents in China using the internet every week. But just 1-1.2 million of them have bought something over the internet. The main reasons for this low figure are that consumers feel security is not high enough, the payment method is not convenient, there is no assurance of the quality of the merchandise and no after-sales service. However, with the development of IT and better security for internet payment, internet retailing sales will become one of the main shopping methods.
Table 35 Retail Sales through Internet Retailing 1999-2003
RMB million
1999 2000 2001 2002 2003
TOTAL 233.3 350 443.2 585 790
% growth - 50 26.6 32 35
Source: 1999-2002 Euromonitor from official sources (Ministry of Statistics), trade press, 2003
Euromonitor estimates
Leading retailers
Most of the merchandise sold over the internet comprises of books, computers and home appliances.
Joyo.com is one domestic internet retailer. Its main products are books and media products like CD/VCD/DVD. It was established in 1998 and it achieved good sales results following that, which put the company first among the leading internet retailers in 2002 and 2003. Joyo.com achieved annual sales of RMB140 million in 2003, an increase of 46% over 2002. By reviewing the sales of Joyo.com over the review period, it is possible to see the rapid development of internet retail sales. Joyo.com achieved sales of RMB12 million in 2000, RMB57 million in 2001, RMB96 million in 2002, and RMB140
million in 2003.
Dangdang.com is another internet book retailer in China. It was ranked 2nd amongst leading internet retailers in 2003 with RMB95.5 million annual sales.
My8848.com and Sohu.com are another two big internet retailers, most of their products are books, videos and some new technological products with low prices.
Bettlesmen.com achieved RMB67 million in sales in 2003. Bettlesmen.com used many measures to attract consumers such as establishing a 'Book Friend Member Club', which offers a discount to its members.
The percentage of these six leading retailers was 57% of total retail sales through internet retailing in 2002, and 64% in 2003.
Table 36 Leading Internet Retailing Retailers 2002-2003
RMB million
Sales 2002 Sales 2003
Joyo.com 96.0 140.0
Dangdang.com 64.0 95.5
My8848.com 55.0 75.0
Sohu.com 52.0 68.0
Bettlesmen 45.0 67.0
Ctrip.com 23.0 59.5
TOTAL 335.0 505.0
Source: 1999-2002 Euromonitor from official sources (Ministry of Statistics),company
Discount stores are a new kind of community supermarket. Their main characteristics are high quality, low price and close quarters. Usually the sales area of a discount store is 300-600 square metres, its catchment area is within a radius of 8 minutes and 80% of consumers are neighbouring residents.
The main merchandise in discount stores is food and commodities of good quality, which are bought frequently. Usually the fascias of the discount store are a combination of both famous and private fascia. The price of famous fascia merchandise can strike a balance with the same merchandise in hypermarkets or shopping malls, whereas the private fascia merchandise can be 5-20% lower than in hypermarkets or shopping malls.
Development of discount stores
Before 2003, there were no real discount stores therefore discount stores are a new type of business in China. Before 2003, there were many small-scale discount shops selling goods at low and constant prices. The main merchandise in such discount shops was small items of low quality. The characteristics of these discount shops were cheap price and low quality, not the same as discount stores.
With its successful experience in hypermarkets, Carrefour decided to import its discount store brand, 'Dia daily'. Dia quotes lower prices than supermarkets, not only to develop its private label and reduce advertising costs, but also to reduce its management costs at every commercial level. The furnishing of the outlets is practical. Merchandise is displayed with the original manufacturer's packaging to reduce the cost of removing it. Storage is managed by computer in order to realise real time distribution. The merchandise is distributed using individual cars in order to reduce transportation costs.
Although discount stores are a new type of business in China, they are very suited to the situation in China. The population density of the big cities like Shanghai and Beijing can reach 29,821 people per square kilometre, which is much higher than the population density in America and Europe. This kind of population density is more suitable for discount stores.
The expenditure frequency of the Chinese is very high, which agrees with discount stores' principle of fast turnover. The proportion of expenditure of the Chinese is much higher than that of America and Europe. The proportion of food expenditure in America and Europe is 24% of total disposable income, whereas the proportion of food expenditure of the Chinese is more than 40%. Food is the dominant merchandise of discount stores.
Chinese consumers are very sensitive about price, so this sensitivity is reduced through the low price policy of discount stores. Most important is the fact that discount stores understand that most consumers go shopping on foot or by bicycle in China.
The fact that Dia and 5 RMB could plant their roots in Shanghai proved the leading position of Shanghai in innovative business. The core focus of chain discount stores is to offer the lowest prices with the biggest margin through building up a supply chain and controlling manufacture. The reason why discount stores were the last business type to be presented in China is the strong requirement for
managerial ability.
There are different reasons why chain discount stores can develop rapidly in China. Chain discount stores' low prices are not achieved through low quality but through optimisation, sourcing and management of the supply chain. The development of chain discount stores, IT technology and private labels will make it possible to reduce management costs through modern management measures.
The advantage of discount stores is that they provide an interesting environment. Although consumers spend a long time in the store, they do not need to spend a lot of money. The characteristics of discount stores are low price, abundant variety and wide selection.
Trends in retailer turnover
As a new type of retail business, discount stores are still in their infancy. In 1999, total retail sales through discount stores reached just RMB155.6 million, which meant the share of discount stores in total retail sales was less than 0.01%. In America and Europe, discount stores have already become one of the major business types and the share of retail sales through discount stores is around 30%.
Although the growth of retail sales through department stores was much higher than growth for other business types, at the end of 2003, total retail sales through discount store were still less than RMB400 million, which were almost nothing compared with total retail sales. However, in 2004, discount stores' annual sales should at least double. After the WTO protection period, the growth of discount stores will be more than 200% every year. By the end of 2010, discount stores will become one of the major retail business types. The growth of discount stores will remain strong even during future economic crises.
Table 37 Retail Sales through Discount Stores 1999-2003
RMB million
1999 2000 2001 2002 2003
TOTAL 155.6 195 240 307.2 399.4
% growth - 25.3 23.1 28.0 30.0
Source: 1999-2002 Euromonitor from official sources (Ministry of Statistics), trade press, 2003
Euromonitor estimates
Leading retailers
In discount stores, there were no real major players before 2003. As a new business type, discount stores were not really known until the end of 2002. In 2003,there are both domestic retailers and foreign retailers with discount stores in China.
Carrefour's discount store, Dia Daily, which is a joint venture with Shanghai Lianhua Supermarket Co Ltd, opened its first outlet in China in June 2003. The first outlet opened in Shanghai and by the end of 2003, the number of outlets in Shanghai had reached 55. In Beijing, Dia Daily opened 15 outlets. The development plan of Dia Daily in China is to open two outlets every week. By the end of 2006, there will be 300 outlets in Shanghai.
The domestic discount store '5 RMB', belongs to Shanghai Nong-gong-shang Supermarket Co Ltd. The price of all merchandise is RMB5. At the end of 2003, there were 22 5 RMB shops. The average sales area of each store is around 800-1,000 square metres. Sales reached RMB20 million in 2003. The company's development target is to achieve RMB100 million in sales in 2004, RMB300 million in 2005, and reach annual sales of RMB5 billion by the end of 2010.
Shenzhen Huarun Wanjia and Shenzhen Renrenle entered discount stores a little later on. Shenzhen Huarun Wanjia stopped opening standard supermarkets in September 2002 and began to develop discount stores in 2003. The company's development target is to open 300 discount stores in Guangdong province. Shenzhen Renrenle also began its discount store business in 2003, opening eight outlets.
Another big discount store retailer is Tianjin Nanxijiu which opened in August 2002, with a sales area of 15,000 square metres.
LCX discount store opened in November 2002 in Beijing's Time Square, with more than 300 international famous fascias, offering 50% discount.
Table 38 Leading Discount Stores Retailers 2002-2003
RMB millions/outlets/sq metres
Sales 2002 Outlets 2002 Sales 2003 Outlets 2003
5 RMB 12 15 20 22
Dia Daily - - 18 70
Outlets 6 3 14 10
Shenzhen Huarun Wanjia - - 2 2
Shenzhen Renrenle - - 4 8
Tianjin Nanxijiu 5 1 14 1
LCX 2 1 11 1
TOTAL 25 20 83 114
Source: 1999-2002 Euromonitor from company research, trade press, 2003 Euromonitor estimates
Note: 2003 data is preliminary
6.7 Concessions
Department stores
Most department stores stick to a consistent self-management style, where they take overall responsibility in employee salaries, shop-floor staff and sourcing of supplies. While some floor staff, who man counters, may collect commission from manufacturers based on his/her sales performance, the department store remains responsible for basic salary payment and employee deployment. Only a small number of department stores completely rent out their retail space to various manufacturers, who then hire their own sales staff. Although concessions are generally regarded as good for business, ensuring easier management, good profitability and more product variety, many department stores remain uncertain over the style of concession as they strive to maintain a good reputation and company image. So, the possibility of further concession development will depend on how closely they can integrate the interests of the lessee and lessor for mutual benefit.
Specialist markets
The majority of specialised markets pre-plan their total floor space into many business units, which are then leased to various factories and private businesses at a certain rent and administration fee. The leasing party takes all responsibility for its profit and loss, and hiring of staff. However, it is the market management's responsibility to oversee overall business promotion. Sometimes, the market will restrict the product range, so as to better support its market strategy.
Supermarkets and hypermarkets
Both outlet types still take charge of all aspects of the business – the sourcing and distribution, staff recruitment and marketing strategies. However, some hypermarkets do occasionally lease out retail space to manufacturers.
6.8 Retail Technology Development
Types of outlet and retail management measures were self-supporting 15 years ago in China. Retailing was very simple and department stores were the biggest type of business. Although there were also some chain stores, the number of outlets was very limited.
Supermarkets arrived in China in the1990's. The presence of supermarkets had a huge impact, with their totally new retail concept, and they became popular in a short time. In 1995 and 1996, there was another blast from large foreign retailers such as Carrefour and Wal-Mart with another new retailing concept, hypermarkets.
In 1997, the first convenience store arrived in China, which was a joint venture between Lawson and Shanghai Hualian Supermarket Co Ltd. This was a new type of retail business with higher requirements regarding retailers' management skills and experience and higher requirements regarding the business environment (GDP should reach US$ 3,000).
In 1996, some large foreign retailers enhanced the concept of another important type of business, department stores, which are traditional in China. The most famous foreign department chain stores are Pacific Department Store and Parkson.
However, with the development of the economy and new retail technology in China, certain negative phenomena have appeared. Owing to the presence of supermarkets and convenience stores, the structure of commerce has been adjusted, which has brought about change to the district economy and to consumers' lifestyles. There are also many problems because of fierce competition from supermarkets and convenience stores. For example, distribution by supermarkets and convenience stores is unreasonable. Overabundance starts competition, which reduces the net margin of all retailers. To attract customers, some retailers use bad measures or immoral commercial behaviour. Usually the merchandise in supermarkets and convenience stores is purchased and distributed by the general company, but since some supermarket and convenience store outlets are franchise stores, the franchise store can also purchase merchandise. Some dishonest franchise member stores purchase low quality merchandise so that they can quote lower prices to customers or they send low quality items to customers as a gift after a large purchase to further attract consumers.
There are a number of supermarkets that fall under franchising. Although known externally as a supermarket, inside is one internal contracted store, which is managed by individuals. Therefore, the purchasing channel of these supermarkets and similarly operated convenience stores presents the complication of 'one outlet, two policies'. This means that on one side large amounts of merchandise are distributed by the general company in order to enjoy a low purchase price while on the other side, the individuals within the internal store can purchase fast-food or seasonal merchandise themselves. To reduce costs, some retailers opt for the low prices they can obtain from personal peddlers, which means that counterfeit and bad quality merchandise enter the store.
6.9 Store Cards
Store cards were not present in China in 2003. According to sources, this was hardly surprising given the nascent state of credit cards in China. It is more common for stores to have some sort of loyalty or membership programme where shoppers who frequent a particular store are given either a paper-based or plastic card which they can show to obtain discounts on future purchases or to accumulate points that can subsequently be redeemed against gifts.
In the forecast period, it is anticipated that alongside the credit card revolution, retailers in China will similarly develop. As such, store cards may have a more significant presence then. However, it is more
likely that China's financial card industry's development will see the development of co-branded cards and not store cards. In other parts of Asia Pacific and indeed, the world, co-branded cards developed by banks, operators and retailers have become increasingly commonplace. For instance, in Singapore, there is the Citibank Tangs credit card, which is a credit card issued by Citibank Singapore that allows cardholders to have special privileges at Tangs Department Store on top of the other usual credit card benefits.
6.10 Loyalty Schemes
To obtain and build upon customer loyalty is an important measure in modern retailing. In China customer loyalty is on the low side. Only 18% of consumers will visit one fixed retail outlet whereas 44.4% of consumers will visit two or three retail outlets.
From the outside, the development of many city-based outlets is not systematic. The outlets develop in no particular order, the layout is unreasonable, and in some areas outlets are too concentrated which forms bad competition.
On the inside, certain companies marketing orientation is not strong enough, and their visualisation is not outstanding enough, therefore they cannot build up a guaranteed customer base.
To increase customer loyalty, retailers need an adjustment on the programming of outlets from the government and they need to make the distribution of their commercial outlets more reasonable in order to avoid excess competition. Retailers should also strengthen their marketing and corporate visualisation and direct this at the target customer base.
The initiative to increase customer loyalty rests with the retailers. The most important elements, which may affect customer loyalty, are good quality merchandise, abundant sources of merchandise, convenient traffic, nearness to home, good manners from retail staff and a clean, organised shopping environment. Therefore, retailers themselves can control many elements.
6.11 Private Label
In China, supermarkets and convenience stores are usually near the community, and sometimes very close at hand. Usually Chinese consumers' frequency of expenditure is high and they like to shop in different outlets.
The problem for retailers in China is how to enhance their own fascia and increase customer loyalty through their merchandise and service. With the trend of mergers and acquisitions and expansion in the number of outlets, the retailer's scale has been enlarged but sales per outlet have been falling. The main reason for this problem is private labels. While all retailers aim to expand their number of outlets or merge, not all retailers focus on building up their private label as a means of increasing their fascia.
Based on the experience of foreign retailers, domestic retailers in China also realise the importance of private labels in helping to improve retailing. Domestic retailers have realised that the growth of private labels is higher than non-private labels.
At the end of 2003, private labels were not highly developed. The perception of private labels was still quite low amongst Chinese consumers. However, although, for example, in Shanghai, the development of private labels was quite slow, it picked up speed in the first 7 months of 2003, and reached 32%.
6.1 Government Policy
New government policies for foreign retailing companies after entry to WTO
After China's entry to WTO, the Government defined a schedule regarding the opening of the retail industry. In the wholesaling industry, the government now allows the foreign capital to hold majority shares in joint-venture (JV) firms and removed the limit in area and quantity of foreign investment in wholesaling firms. These foreign-owned or -backed service suppliers can now provide full wholesaling services to its customers for its products, including after sales service.
In the retailing sector, foreign service suppliers may provide retail services (excluding tobacco) through joint ventures, subject to geographic restrictions. By December 11, 2003 however, foreign majority control was permitted to all provincial capitals including Chongqing and Ningbo.
Prior to China's accession, foreign service suppliers could form joint ventures to provide retail services in the five Special Economic Zones (Shenzhen, Zhuhai, Shantou, Xiamen, and Hainan) and six cities (Beijing, Shanghai, Tianjin, Guangzhou, Dalian, and Qingdao).
Additionally in Beijing and Shanghai, no more than four joint venture retailing enterprises are permitted. In each of the other cities, no more than two joint venture enterprises may be established. Two enterprises out of the four established in Beijing may set up their branches in Beijing. Joint venture retailing enterprises may also be established in Wuhan and Zhengzhou.
China government will issue series of policies to enlarge the scale of using foreign capital in business
field
Since 1992, China had absorbed over USD 3 billion in foreign capital in authorising the establishment of more than 40 foreign commercial corporations to invest in China. In light of retailing, more than half of the world's 50 largest retailing groups had entered the China market. During a multinational retailing groups' meeting, the China government's Economic & Trading committee indicated measures that were in placed to improve the degree of opening up the retail market. The implementation of these measures are aimed at enlarging the scope of using foreign capital and also increase the quality of using foreign capital. These measures include:
Placing emphasis on supply-chain business and logistic; encourage the import of the advanced technological and logistic management know-how from overseas; encourage the reconstruction of traditional commerce with the usage of foreign capital and also the speeding up of constructing modern establishment structure. This also includes the import of foreign talent.
Leveraging on foreign investments.
In recent years, hypermarket, warehouse store and supermarket have been the main fields of which the Chinese government had made use of foreign capital. They will now push these retail formats inland to further develop its middle-west district. Known for their competence in offering sophisticated level of convenience, safer and better service to consumers, the Chinese government will continue to introduce and develop the hypermarket, convenience store, medium-size supermarket and professional store formats to leverage fully from their operational structure.
Multinational retailing corporation is hopeful to enlarge the scope of purchasing in China (New policy)
By 2004, a new policy should be in place to allow foreign retailing corporations to enlarge their scope of purchasing activities in China. According to China's Foreign Trading department, the new policy will allow foreign retailing corporations to establish purchasing centres in China and carry out direct purchasing activities. This will consequently increase foreign capital expenditure into the Chinese economy.
In most multinational corporations, operations are separated into two self-governed systems – Retailing and Wholesaling. At present, only retailing has made its bow into China, whereby players such as Carrefour and Wal-Mart's wholesaling operations are represented by a "representative office" and not as part of the core set-up of the retailing operations of the company in China. A government spokesman indicated that "to open wholesaling to foreigners would be in the same direction as the China government's enlarging export policy, in the meantime, also allowing for increased export efficiency with the usage of multinationals' commerce systems".
6.2 Retail Lobbying
In all cities and towns and even sometimes at lower regional levels, do Consumers Associations exist. These are quasi-governmental entities. The Consumer Associations are set up to promote consumer awareness, conduct periodic consumer surveys on product quality, price and after-sales service, mediate between consumers and retailers/suppliers, provide feedback and suggestions to relevant authorities, and monitor the law compliance on all aspects of commodity sales.
The Associations are presented as the voice of the Chinese consumers and the protector of consumers' legal rights especially when it comes to passing important retail legislation in the People's Congress.
The China Chain-store and Franchise Association (CCFA) is another influential organisation. The CCFA was established in 1997 as a nationwide retail trade organisation approved by and registered at the
PRC Civil Affairs Ministry, with its headquarters in Beijing. By the end of October 1999, it had 307 members.
Most members are chain retailers in the medium-sized and big cities in China, and include supermarkets, convenience stores, specialised stores, hypermarkets, department stores and other businesses such as hotels, fast food restaurants and hairdressers. They have been very successful in expanding their businesses through chain retailing and franchising, and each of them is quite competitive with a significant share in the retail market.
The mission of the CCFA is to serve as a bridge between government authorities, relative trades and all walks of social community for better communication and cooperation, and to provide comprehensive services to chain retailers by creating an excellent external environment for the retailers' development.
The main responsibilities of the CCFA include implementing the tasks entrusted by the government authorities, improving communication among members and providing guidance, feedback the wishes and requests by the members to the authorities, protecting the lawful rights of its members and publishing data and books concerning chain retailing, among others. It is very influential in lobbying the government for certain legislation to improve the retailing business environment.
6.3 Retail Landscape
Main street versus out of town
Given the disparity between rural and urban cities, China's retail landscape varies significantly across different regions. In the city, constant upgrades and developments lace the retail scene with the presence of large-scale outlet. On the other hand, the retail scene in rural China assumes the reverse trend. Supermarkets and hypermarkets, which thrive on large volume sales – albeit lower prices, cannot survive under such minuscule demand. This is further supported by the fact that, according to the national statistics bureau in 2003, urbanised retail sales accounted for 72% of total retail sales in the country.
Although the spending power of consumers in the different regions of China dictates the viability and availability of retail channels in the respective regions, the sophistication of retailers certainly plays a critical role is carving the retail landscape. Stereotypically, as rural retailers employ the management styles of the old economy, basking in their comfort zones, this further stifles growth in their service offerings.
Nevertheless, the adage "you win some, you lose some" is highly applicable to the micro aspects of the urbanised retail environment. With large department stores, specialty chain stores and foreign brand stores maintaining a strong foothold in the city landscape, the staying power of independent retailers falters. As such, the retail scene in the city is consistently changing with new start-ups and closures marking the market.
Shopping centres and malls
In 2003, there were 236 shopping centres in the major cities of China comprising of 94 new establishments within that same year. Based on the number of shopping centres by region, Shanghai, Guangzhou, Shenzhen, Beijing, Chengdu, Dalian, Chongqing and Wuhan collectively housed 72% of shopping centres in China.
This trend is expected to carry on over the next 3 years. As a reflection of investors confidence, developments that are anticipated during this time frame includes the following.
6.4 Emerging Retail Formats – Warehouse Clubs
Introduction
Warehouse clubs format is a new business type in China retail industry. The main consumers of warehouse clubs are usually some speciality consumer or companies, or restaurants and they would need to be members in order to shop there. Food merchandise is typically the priority for members when they make their purchase there. Other warehouse clubs in the world are Metro, Makro in Germany and Price/Costco in USA. The sales area of warehouse clubs is by far the biggest amongst the other retail formats to display more merchandise at lower prices.
Development of warehouse clubs
The first warehouse clubs retailer was Metro from Germany in 1996. After Metro, IKEA, the home furnishing group entered the China market in 1998 to open 2 outlets. Due to the sophisticated level of operational expertise required for running the warehouse clubs format, China has yet seen the entrance of domestic players towards the end of 2003.
Trends in retailer turnover
Metro and IKEA contributed to the retail sales through warehouse clubs. The sales in 1999 was 4,655.5 million RMB. Warehouse clubs format has since enjoyed high growth of more than 16% annually to surpass a total sales of 10 billion RMB in 2003. The market has grown by 119.7% in 5 years with 2003 alone experiencing a dramatic growth by 36%.
Table 33 Retail Sales through Warehouse Clubs 1999-2003
RMB million
1999 2000 2001 2002 2003
TOTAL 4,655.5 5,400.4 6,318.5 7,519 10,226
% growth - 16.0 17.0 19.0 36.0
Source: 1999-2002 Euromonitor from trade press(China Daily), 2003 Euromonitor estimates
Leading retailers
Metro took the leading position of the warehouse clubs retailers in 2002 and 2003. The annual sales in 2003 grew by 36% to assume 8,885 million RMB. The sales per outlet reached 423.1 million RMB in 2003. In 8 years after entering the China market in 1996, Metro had opened 21 outlets.
Home furnishing giant IKEA opened 2 outlets in China since 1998. The outlet in Shanghai stands at 32,000 sq m sales area, while the other in Beijing at 15,400 sq m sales area. IKEA's annual sales in 2003 was 1,341 million RMB to mark a 36% growth from 2002. The main reason for IKEA's high growth in 2003 can be attributed to its opening of a new behemoth store in Shanghai after the closure of an older, smaller store that stood at 8,400 sq m,
Table 34 Leading Warehouse Clubs Retailers 2002-2003
RMB millions/outlets/sq metres
Sales 2002 Outlets 2002 Sales 2003 Outlets 2003
Metro 6,533 18 8,885 21
IKEA 986 2 1,341 2
TOTAL 7,519 20 10,226 23
Source: 1999-2002 Euromonitor from company research, company reports, trade press, 2003
Euromonitor estimates
6.5 Emerging Retail Formats – Internet Retailing
Introduction
Internet retailing in China is still in its infancy but it has been developing well and the prospects are bright. Euromonitor research revealed information about the internet economy from the consumers perspective. The research focused on 502 local residents with middle class and upwards degrees in Beijing, Shanghai and Guangzhou, the three major economic cities of China. The results showed that 85% of residents care about the internet economy and more than half of the residents have used the internet. 92.1% of residents thought that since the internet was the main method of information and knowledge transfer, its development would push rapid growth in communication and Information in China and further development between those two areas.
At the end of 2003, there were 4,488 consumer expenditure e-business websites in China. At that
point, the number of shopping websites was 3,141, the number of auction websites was 445, the number of long distance education websites was 583 and the number of long distance medical treatment websites was 319. However, there are some problems regarding internet retailing in that 80% of consumers worry about the security of payment and the insurance of exchanging a purchase and 40% of consumers are used to traditional modes of expenditure, however 70% of consumers still want to try. The most active city for internet retailing in 2003 was Shanghai.
Development of internet retailing
The younger generation has affected internet retailing. Internet retailing is exerting more and more power due to the popularisation of the internet and the quantity of people who use it. There is a culture factor that cannot be ignored in that the younger generation, aged anywhere between 2-20 years old, is an 'internet generation'. They have grown up with the internet and they are not like their parent's generation, who look at the internet as a method of technology but not as a basic factor of life. The concept of expenditure is changing amidst this new generation, meaning that corporations need to adapt as soon as possible, to provide them with more numerous and satisfactory choices.
China's entry into the WTO is a beneficial factor, although it will also bring a huge challenge to the domestic retail industry and internet retailers. The country's entry into the WTO will push the development of internet retailing in various ways: the reduction in custom duty will make it possible for more computers to enter Chinese households, thus increasing the popularisation and usage rate of the internet; the opening up of the finance industry will solve the problem of back payment methods; and the opening up of the telecommunications industry will reduce the cost of internet sales and push the birth of more internet shops, making internet shopping fashionable. Over the long term, after entry into the WTO, old concepts and cultures will be impacted and people's concepts of value will change. During this process, consumers will become more accustomed to accepting internet sales. Furthermore, the opening up and improvement of distribution and logistics will push the development of internet retailing.
Trends in retailer turnover
According to National Statistics Bureau data, at the end of 2003, the computer ownership rate of Chinese families was 33.2%. In some big cities like Shanghai and Beijing, the computer ownership rate within the city was more than 67%. This is a strong reason for the rapid growth of internet retailing. However, total annual sales through internet retailing were very low compared to total retail sales not through internet retailing. In 1999, retail sales through internet retailing amounted to RMB233.3 milliomillion, an increase of almost 240% over the review period.
At the end of 2003, there were 70 million residents in China using the internet every week. But just 1-1.2 million of them have bought something over the internet. The main reasons for this low figure are that consumers feel security is not high enough, the payment method is not convenient, there is no assurance of the quality of the merchandise and no after-sales service. However, with the development of IT and better security for internet payment, internet retailing sales will become one of
the main shopping methods.
Table 35 Retail Sales through Internet Retailing 1999-2003
RMB million
1999 2000 2001 2002 2003
TOTAL 233.3 350 443.2 585 790
% growth - 50 26.6 32 35
Source: 1999-2002 Euromonitor from official sources (Ministry of Statistics), trade press, 2003
Euromonitor estimates
Leading retailers
Most of the merchandise sold over the internet comprises of books, computers and home appliances.
Joyo.com is one domestic internet retailer. Its main products are books and media products like CD/VCD/DVD. It was established in 1998 and it achieved good sales results following that, which put the company first among the leading internet retailers in 2002 and 2003. Joyo.com achieved annual sales of RMB140 million in 2003, an increase of 46% over 2002. By reviewing the sales of Joyo.com over the review period, it is possible to see the rapid development of internet retail sales. Joyo.com achieved sales of RMB12 million in 2000, RMB57 million in 2001, RMB96 million in 2002, and RMB140 million in 2003.
Dangdang.com is another internet book retailer in China. It was ranked 2nd amongst leading internet retailers in 2003 with RMB95.5 million annual sales.
My8848.com and Sohu.com are another two big internet retailers, most of their products are books, videos and some new technological products with low prices.
Bettlesmen.com achieved RMB67 million in sales in 2003. Bettlesmen.com used many measures to attract consumers such as establishing a 'Book Friend Member Club', which offers a discount to its members.
The percentage of these six leading retailers was 57% of total retail sales through internet retailing in 2002, and 64% in 2003.
Table 36 Leading Internet Retailing Retailers 2002-2003
RMB million
Sales 2002 Sales 2003
Joyo.com 96.0 140.0
Dangdang.com 64.0 95.5
My8848.com 55.0 75.0
Sohu.com 52.0 68.0
Bettlesmen 45.0 67.0
Ctrip.com 23.0 59.5
TOTAL 335.0 505.0
Source: 1999-2002 Euromonitor from official sources (Ministry of Statistics),company
Discount stores are a new kind of community supermarket. Their main characteristics are high quality, low price and close quarters. Usually the sales area of a discount store is 300-600 square metres, its catchment area is within a radius of 8 minutes and 80% of consumers are neighbouring residents.
The main merchandise in discount stores is food and commodities of good quality, which are bought frequently. Usually the fascias of the discount store are a combination of both famous and private fascia. The price of famous fascia merchandise can strike a balance with the same merchandise in hypermarkets or shopping malls, whereas the private fascia merchandise can be 5-20% lower than in hypermarkets or shopping malls.
Development of discount stores
Before 2003, there were no real discount stores therefore discount stores are a new type of business in China. Before 2003, there were many small-scale discount shops selling goods at low and constant prices. The main merchandise in such discount shops was small items of low quality. The characteristics of these discount shops were cheap price and low quality, not the same as discount stores.
With its successful experience in hypermarkets, Carrefour decided to import its discount store brand, 'Dia daily'. Dia quotes lower prices than supermarkets, not only to develop its private label and reduce advertising costs, but also to reduce its management costs at every commercial level. The furnishing of the outlets is practical. Merchandise is displayed with the original manufacturer's packaging to reduce the cost of removing it. Storage is managed by computer in order to realise real time distribution. The merchandise is distributed using individual cars in order to reduce transportation
costs.
Although discount stores are a new type of business in China, they are very suited to the situation in China. The population density of the big cities like Shanghai and Beijing can reach 29,821 people per square kilometre, which is much higher than the population density in America and Europe. This kind of population density is more suitable for discount stores.
The expenditure frequency of the Chinese is very high, which agrees with discount stores' principle of fast turnover. The proportion of expenditure of the Chinese is much higher than that of America and Europe. The proportion of food expenditure in America and Europe is 24% of total disposable income, whereas the proportion of food expenditure of the Chinese is more than 40%. Food is the dominant merchandise of discount stores.
Chinese consumers are very sensitive about price, so this sensitivity is reduced through the low price policy of discount stores. Most important is the fact that discount stores understand that most consumers go shopping on foot or by bicycle in China.
The fact that Dia and 5 RMB could plant their roots in Shanghai proved the leading position of Shanghai in innovative business. The core focus of chain discount stores is to offer the lowest prices with the biggest margin through building up a supply chain and controlling manufacture. The reason why discount stores were the last business type to be presented in China is the strong requirement for managerial ability.
There are different reasons why chain discount stores can develop rapidly in China. Chain discount stores' low prices are not achieved through low quality but through optimisation, sourcing and management of the supply chain. The development of chain discount stores, IT technology and private labels will make it possible to reduce management costs through modern management measures.
The advantage of discount stores is that they provide an interesting environment. Although consumers spend a long time in the store, they do not need to spend a lot of money. The characteristics of discount stores are low price, abundant variety and wide selection.
Trends in retailer turnover
As a new type of retail business, discount stores are still in their infancy. In 1999, total retail sales through discount stores reached just RMB155.6 million, which meant the share of discount stores in total retail sales was less than 0.01%. In America and Europe, discount stores have already become one of the major business types and the share of retail sales through discount stores is around 30%.
Although the growth of retail sales through department stores was much higher than growth for other business types, at the end of 2003, total retail sales through discount store were still less than RMB400 million, which were almost nothing compared with total retail sales. However, in 2004, discount stores' annual sales should at least double. After the WTO protection period, the growth of discount stores will
be more than 200% every year. By the end of 2010, discount stores will become one of the major retail business types. The growth of discount stores will remain strong even during future economic crises.
Table 37 Retail Sales through Discount Stores 1999-2003
RMB million
1999 2000 2001 2002 2003
TOTAL 155.6 195 240 307.2 399.4
% growth - 25.3 23.1 28.0 30.0
Source: 1999-2002 Euromonitor from official sources (Ministry of Statistics), trade press, 2003
Euromonitor estimates
Leading retailers
In discount stores, there were no real major players before 2003. As a new business type, discount stores were not really known until the end of 2002. In 2003,there are both domestic retailers and foreign retailers with discount stores in China.
Carrefour's discount store, Dia Daily, which is a joint venture with Shanghai Lianhua Supermarket Co Ltd, opened its first outlet in China in June 2003. The first outlet opened in Shanghai and by the end of 2003, the number of outlets in Shanghai had reached 55. In Beijing, Dia Daily opened 15 outlets. The development plan of Dia Daily in China is to open two outlets every week. By the end of 2006, there will be 300 outlets in Shanghai.
The domestic discount store '5 RMB', belongs to Shanghai Nong-gong-shang Supermarket Co Ltd. The price of all merchandise is RMB5. At the end of 2003, there were 22 5 RMB shops. The average sales area of each store is around 800-1,000 square metres. Sales reached RMB20 million in 2003. The company's development target is to achieve RMB100 million in sales in 2004, RMB300 million in 2005, and reach annual sales of RMB5 billion by the end of 2010.
Shenzhen Huarun Wanjia and Shenzhen Renrenle entered discount stores a little later on. Shenzhen Huarun Wanjia stopped opening standard supermarkets in September 2002 and began to develop discount stores in 2003. The company's development target is to open 300 discount stores in Guangdong province. Shenzhen Renrenle also began its discount store business in 2003, opening eight outlets.
Another big discount store retailer is Tianjin Nanxijiu which opened in August 2002, with a sales area of 15,000 square metres.
LCX discount store opened in November 2002 in Beijing's Time Square, with more than 300
international famous fascias, offering 50% discount.
Table 38 Leading Discount Stores Retailers 2002-2003
RMB millions/outlets/sq metres
Sales 2002 Outlets 2002 Sales 2003 Outlets 2003
5 RMB 12 15 20 22
Dia Daily - - 18 70
Outlets 6 3 14 10
Shenzhen Huarun Wanjia - - 2 2
Shenzhen Renrenle - - 4 8
Tianjin Nanxijiu 5 1 14 1
LCX 2 1 11 1
TOTAL 25 20 83 114
Source: 1999-2002 Euromonitor from company research, trade press, 2003 Euromonitor estimates
Note: 2003 data is preliminary
6.7 Concessions
Department stores
Most department stores stick to a consistent self-management style, where they take overall responsibility in employee salaries, shop-floor staff and sourcing of supplies. While some floor staff, who man counters, may collect commission from manufacturers based on his/her sales performance, the department store remains responsible for basic salary payment and employee deployment. Only a small number of department stores completely rent out their retail space to various manufacturers, who then hire their own sales staff. Although concessions are generally regarded as good for business, ensuring easier management, good profitability and more product variety, many department stores remain uncertain over the style of concession as they strive to maintain a good reputation and company image. So, the possibility of further concession development will depend on how closely they can integrate the interests of the lessee and lessor for mutual benefit.
Specialist markets
The majority of specialised markets pre-plan their total floor space into many business units, which are then leased to various factories and private businesses at a certain rent and administration fee. The leasing party takes all responsibility for its profit and loss, and hiring of staff. However, it is the market
management's responsibility to oversee overall business promotion. Sometimes, the market will restrict the product range, so as to better support its market strategy.
Supermarkets and hypermarkets
Both outlet types still take charge of all aspects of the business – the sourcing and distribution, staff recruitment and marketing strategies. However, some hypermarkets do occasionally lease out retail space to manufacturers.
6.8 Retail Technology Development
Types of outlet and retail management measures were self-supporting 15 years ago in China. Retailing was very simple and department stores were the biggest type of business. Although there were also some chain stores, the number of outlets was very limited.
Supermarkets arrived in China in the1990's. The presence of supermarkets had a huge impact, with their totally new retail concept, and they became popular in a short time. In 1995 and 1996, there was another blast from large foreign retailers such as Carrefour and Wal-Mart with another new retailing concept, hypermarkets.
In 1997, the first convenience store arrived in China, which was a joint venture between Lawson and Shanghai Hualian Supermarket Co Ltd. This was a new type of retail business with higher requirements regarding retailers' management skills and experience and higher requirements regarding the business environment (GDP should reach US$ 3,000).
In 1996, some large foreign retailers enhanced the concept of another important type of business, department stores, which are traditional in China. The most famous foreign department chain stores are Pacific Department Store and Parkson.
However, with the development of the economy and new retail technology in China, certain negative phenomena have appeared. Owing to the presence of supermarkets and convenience stores, the structure of commerce has been adjusted, which has brought about change to the district economy and to consumers' lifestyles. There are also many problems because of fierce competition from supermarkets and convenience stores. For example, distribution by supermarkets and convenience stores is unreasonable. Overabundance starts competition, which reduces the net margin of all retailers. To attract customers, some retailers use bad measures or immoral commercial behaviour. Usually the merchandise in supermarkets and convenience stores is purchased and distributed by the general company, but since some supermarket and convenience store outlets are franchise stores, the franchise store can also purchase merchandise. Some dishonest franchise member stores purchase low quality merchandise so that they can quote lower prices to customers or they send low quality items to customers as a gift after a large purchase to further attract consumers.
There are a number of supermarkets that fall under franchising. Although known externally as a supermarket, inside is one internal contracted store, which is managed by individuals. Therefore, the purchasing channel of these supermarkets and similarly operated convenience stores presents the complication of 'one outlet, two policies'. This means that on one side large amounts of merchandise are distributed by the general company in order to enjoy a low purchase price while on the other side, the individuals within the internal store can purchase fast-food or seasonal merchandise themselves. To reduce costs, some retailers opt for the low prices they can obtain from personal peddlers, which means that counterfeit and bad quality merchandise enter the store.
6.9 Store Cards
Store cards were not present in China in 2003. According to sources, this was hardly surprising given the nascent state of credit cards in China. It is more common for stores to have some sort of loyalty or membership programme where shoppers who frequent a particular store are given either a paper-based or plastic card which they can show to obtain discounts on future purchases or to accumulate points that can subsequently be redeemed against gifts.
In the forecast period, it is anticipated that alongside the credit card revolution, retailers in China will similarly develop. As such, store cards may have a more significant presence then. However, it is more likely that China's financial card industry's development will see the development of co-branded cards and not store cards. In other parts of Asia Pacific and indeed, the world, co-branded cards developed by banks, operators and retailers have become increasingly commonplace. For instance, in Singapore, there is the Citibank Tangs credit card, which is a credit card issued by Citibank Singapore that allows cardholders to have special privileges at Tangs Department Store on top of the other usual credit card benefits.
6.10 Loyalty Schemes
To obtain and build upon customer loyalty is an important measure in modern retailing. In China customer loyalty is on the low side. Only 18% of consumers will visit one fixed retail outlet whereas 44.4% of consumers will visit two or three retail outlets.
From the outside, the development of many city-based outlets is not systematic. The outlets develop in no particular order, the layout is unreasonable, and in some areas outlets are too concentrated which forms bad competition.
On the inside, certain companies marketing orientation is not strong enough, and their visualisation is not outstanding enough, therefore they cannot build up a guaranteed customer base.
To increase customer loyalty, retailers need an adjustment on the programming of outlets from the government and they need to make the distribution of their commercial outlets more reasonable in
order to avoid excess competition. Retailers should also strengthen their marketing and corporate visualisation and direct this at the target customer base.
The initiative to increase customer loyalty rests with the retailers. The most important elements, which may affect customer loyalty, are good quality merchandise, abundant sources of merchandise, convenient traffic, nearness to home, good manners from retail staff and a clean, organised shopping environment. Therefore, retailers themselves can control many elements.
6.11 Private Label
In China, supermarkets and convenience stores are usually near the community, and sometimes very close at hand. Usually Chinese consumers' frequency of expenditure is high and they like to shop in different outlets.
The problem for retailers in China is how to enhance their own fascia and increase customer loyalty through their merchandise and service. With the trend of mergers and acquisitions and expansion in the number of outlets, the retailer's scale has been enlarged but sales per outlet have been falling. The main reason for this problem is private labels. While all retailers aim to expand their number of outlets or merge, not all retailers focus on building up their private label as a means of increasing their fascia.
Based on the experience of foreign retailers, domestic retailers in China also realise the importance of private labels in helping to improve retailing. Domestic retailers have realised that the growth of private labels is higher than non-private labels.
At the end of 2003, private labels were not highly developed. The perception of private labels was still quite low amongst Chinese consumers. However, although, for example, in Shanghai, the development of private labels was quite slow, it picked up speed in the first 7 months of 2003, and reached 32%.
7. RETAILING IN THE CORPORATE ENVIRONMENT
7.1 Leading Retailers in China
At the end of 2003, there were 65 listed A-share retailers in China. Of these, the top 10 retailing groups boasted a combined retail sales value of about RMB155 billion in 2003. This translates into about 3.5% of total retail sales in the country – a very small proportion when compared to developed economies that may boast much higher levels of industry consolidation.
Grocery retailers lead the way
As is the case in many developed economies, grocery and general merchandising retailers dominate the top 10 spots in China's top 10 retailers. Apart from the second largest retailer and durable goods specialist, the other nine leading retailers of the country's top 10 retail groups are all either grocery retailers or general merchandising retailers, inclusive of department stores.
A key theme of these leading retailers is that large retail format retailers can count on about 40 retail outlets, including Dashang's hypermarket and department stores, and also Shanghai No.1's chain of department stores. Global giants Carrefour and Wal-mart also have a similar number of retail outlets in China at the end of 2003.
In contrast, the four others boast over 1,000 retail outlets – in patr due to their presence in the smaller format supermarkets and convenience stores formats. These four players include the market-leading Shanghai Friendship which includes both a convenience store chain as well as a supermarket chain both of which number over 1,000 retail outlets each.
Leading players drive consolidation
Another key emerging theme in the ertailing industry, although this may not be obvious from all fronts, is the high level of consolidation taking place. Current indicators such as the total number of retail businesses in China and the total number of retail outlets in China, indicate that the retailing idustry is still very highly fragmented. This has been changing very rapidly though, as evidenced by the rate of growth of the leading 10 retailers below. Overall, the top 10 leading retailing groups grew by over 35% in terms of retail sales although the industry as a whole registered growth at a much lower 10%.
Although the top 10 leading retailers can only claim to contributing significantly to this trend towards consolidation, it should be noted that other retailers including cash and carry giant Metro have made even greater gains over the previous year in 2002 in terms of retail sales.
Table 39 Leading Retailers in China Ranked by Retail Turnover 2003
Shanghai No.1 Shanghai No.1, Shanghai No.1 Ba Bai Ban
Department store 39
Shanghai Nong-gong-shang Supermarket
Nong-gong-shang Supermarket
Supermarket 400
Shanghai Nong-gong-shang Supermarket Convenience
Alldays Convenience stores 600
Shanghai Nong-gong-shang Supermarket hypermarket
Nong-gong-shang Supermarket mart
Hypermarket 20
Shanghai Nong-gong-shang Supermarket dollar store
5 RMB Dollar stores 30
Jiangsu Suguo Convenience Suguo Convenience store 403
Jiangsu Suguo Hypermarket Suguo Hypermarket 22
Jiangsu Suguo Community store Suguo Community store 5
Jiangsu Suguo supermarket Suguo Supermarkets 670
Source: 1999-2002 Euromonitor from Official statistics, Trade associations, Company annual report,
Company research, Trade press, Trade interviews, 2003 Euromonitor estimatesNote: 2003 year end
data is preliminary
7.2 Major Retail Conglomerates
The main retail conglomerates in China tend to focus their activities on the food and grocery retailing, as well as large mixed retailing sectors. Of the top 10 leading retailers in China, five are retail conglomerates, to the extent that they operate various chains across verious formats. These five retail conglomerates are led by the market-leading Shanghai Friendship, and except for Beijing Hulian, are focused entirely on the retailing industry.
The only exception to the these leading retail conglomerates is Beijing Hulian Group, whose property arm also constructs, develops and manages shopping centres. This is clearly a directly related business asit will eventually allow Beijing Hulian Group's retailing operations first option on the choice locations of their shopping centres.
Other companies for whom retailing represents some but not a majority of their business includes Shanghai Yuyuan Tourist Mart and Shandong Sanlian Group.
Table 41 Major Retail Conglomerates in China 2003
Retail conglomerate Sectors of activity Turnover (RMB million)
Retail turnover 1
Shanghai Friendship Various food and grocery retailing
29,301 100.0
Shanghai Lianhua
Supermarket Various food and grocery retailing
24,746 100.0
Beijing Hulian Group Department stores, Shopping
centre construction and management
14,500 75.0
Dashang Group Various food and grocery retailing
13,600 100.0
Shanghai Nong-gong-
shang supermarket Various food and non-food retailing
10,100 100.0
Source: 1999-2002 Euromonitor from Official statistics, Trade associations, Company annual report,
Company research, Trade press, Trade interviews, 2003 Euromonitor estimates
Notes: 1 As a % of group turnover Retail turnover data represents turnover from domestic retailing
operations 2003 year end data is preliminary
7.3 Retailer Concentration
Without exception, all 10 of the leading retailers in 2003, have increased their share of the market in successive years from 2001. Cumulatively, their market share has increased too, from 2001 to 2003.
This growth on the part of leading retailers and the increase in their cumulative share of the market, is however, very limited. It is limited because, viewed in terms of their total share of the entire retailing indsutry, it can be seen that the top 10 retailers account for no more than 3.5% of the country's retail sales.
This is in itself another indication that there will continue to be alarge amount of mergers and acquisitions, in addition to aggressive organic growth strategies, from both local and foreign-owned retailers. The most enthusiastic of industry sources believe that the top 10 leading retailers' share of the total retail market will likely increase beyond a quarter of the total retail market before 2008.
Table 42 Leading Retailers' Shares of Retail Sales 2001-2003
Source: 1999-2002 Euromonitor from Official statistics, Trade associations, Company annual report,
Company research, Trade press, Trade interviews, 2003 Euromonitor estimates
7.4 Multinational Penetration
The truth of the matter
Over 300 foreign retailers have a presence in China. Our table below includes some of the most notable retailers. It is prudent to note that information such as this obtianed from published and official sources frequently understate the true extent of foreign penetration for two reasons.
Firstly, there are still many restrictions on foreign participation and, therefore, foreign retailers have an incentive to downplay their presence in China with many having opted to take part in a JV.
Secondly, while central government ministries (MOFTEC and the State Planning & Development Commission) have maintained controls on foreign retailers, regional and local governments are generally more than happy to embrace these foreign-owned retailers in the hope of a capital infusion and the infrastructure that foreign retailers generally build to support their own retail outlets' needs such as surrounding roads. In many cases, regional and local governments have granted licences that appear to breach central government policy. For example, according to mainland Chinese press sources the debate regarding Carrefour's operations in Shenyang and 26 other cities has led the retailer to apply for registration on a retrospective basis. Carrefour has reportedly apologised for not going through the 'proper' channels.
The official stand
What is China's commitment regarding foreign retailers' participation under the WTO entry accord? Firstly, China will allow foreign retailers to operate in the top 50 cities (including 31 provincial capitals, of which all are special economic zones, like Shenzhen and Zhuhai, and a few major cities with a population of a million or more). Secondly, foreign firms are allowed to operate a wholesale business as long as the local JV partner (or partners) holds a stake of at least 51%.
Third, foreign firms can take a controlling stake in a retail operation in the following three circumstances:
If the operation has no more than three stores;
for specialist chain stores and convenience stores, a local investor(s) must have at least a 35% stake—Carrefour is in the process of selling a 35% stake to local parties; and
if the foreign retailer will source "significant amounts" of products from China and/or help export Chinese products.
It is the view of some players that these administrative policies (not laws) are not well defined. For example, there is no definition as to what constitutes a significant amount, leaving the door open for regional governments to exercise discretion. This policy pronouncement made in November 2001, just before China's entry to the WTO, has in fact gone one step further than the actual commitment China
made to the WTO.
Why is wholesale nervous?
The Chinese government's control over the wholesale business is a historical legacy. Until the late-1980s, price controls were imposed on most consumer products, and thus there were shortages and associated rationing. Coupons, vouchers and wage payment in kind were commonplace.
In that time, the government wanted to control the supply of consumer products, hence the tight controls on the wholesale business. It also made it easier to control the all important consumer price index (CPI), a key indicator of prices in the country. Today, while wholesale is no longer wholly relevant in controlling the country's CPI or product supply, it appears that the previous legacy of controlling wholesale operations in China continue to persist. As leading retailers increase their bargaining power with ever increased shares of the retailing industry (in terms of retail sales), wholesalers will come under increased pressure to allow foreign-owned businesses to enter the wholesale market. This, if it happens, will in turn likely encourage more foreign-owned retailing businesses to enter China, as most have some form of wholesaling operations integrated with their core retailing operations.
Summary 3 Leading Multinational Groups 2002-2003
Retail group Fascia Number of outlets
Subsector
Wal-Mart Wal-Mart 31 Hypermarket
Carrefour Carrefour 40 Hypermarket
7-Eleven Liangyou Jinban convenience stores (JV)
50 Convenience stores
Metro AG Metro 21 Cash and carry
Ito Yokado Ito Yokado 2 Department stores
Ikea (Furniture) Ikea 2 Furnishing stores
Daiei (of Japan) Daiei 14 Department stores
Pricemart Pricemart (Indirect management)
22 Hypermarkets, Supermarket
Source: 1999-2002 Euromonitor from Official statistics, Trade associations, Company annual report,
Company research, Trade press, Trade interviews, 2003 Euromonitor estimatesNote: 2003 year end
data is preliminary
7.5 Retail Mergers and Acquisitions
The aircraft carrier of retailing
On 24 April 2003, Shanghai Bailian Group Co Ltd was established by four commercial corporations, namely Shanghai No.1 Group Co Ltd, Hualian Group Co Ltd, Shanghai Friendship Co Ltd and Shanghai Material trade Co Ltd. With total assets valued at RMB33.5 billion, this new entity boasted of over 4,500 retail outlets across more than 20 provinces.
Shanghai Bailian counts under its control various forms of modern retailing formats including hypermarkets, department stores, supermarkets, convenience stores and discount stores. With total turnover of RMB20 billion in 2002, Shanghai Material Trade was also the leading logistics player for primary materials in China. It is highly likely that with Shanghai Material Trade's strong logistics expertise, the Shanghai Bailian Group will become even more competitive.
The establishment of Shanghai Bailian is in theory a direct challenge to multinational retail conglomerates such as Wal-mart and Carrefour. Upon closer inspection, however, this may not necessarily be true. In the long run, Shanghai Bailian may not be able to compete with Wal-mart or Carrefour as it is currently operating as four disparate entities nominally held together by virute if being the local Shanghai government's corporations.
Other corporate activities
Foreign investors often ask why is there no real consolidation, given the high fragmentation of China's retailing industry? In truth, there has already been a lot of consolidation over the review period and there could potentially be much more to come, as foreign investors rush in at an increasing rate.
There have been at least 30 major M&A deals (backdoor listing, share transfers and debt-equity swaps) between listed retailers since 2000. Some listed retailers are themselves a product of mergers or acquisitions. For example Hualian Group sold management control of Hualian Supermarket to Shanghai Hualian Shopping Mall in June and September 2000 in two tranches worth over RMB213 million. Shortly after, in February 2001, the Shanghai Huangpu District Government sold its controlling stake in Wanxiang (Retail) Group to New World Group for RMB92 million.
Financial market restraints
At present, M&As related to SOEs still require the approval of the Ministry of Finance or regional governments. However, this hurdle does not appear to be insurmountable. Sources suggest that one lasting impediment is rigid stock market rules. For example, a key sticking point is that if a Chinese company wants to take over another, it must pay in cash—issuing new shares is not allowed.
There are problems even if the acquirer wants to issue new shares on the open market. Each rights issue, or new share issue, must gain approval from the stock exchange and the CSRC (China Securities
Regulatory Commission). But this process can take months if not years, usually frustrating and eventually thwarting many prospective M&A deals.
The logic behind the approval process is to ration scarce financial resources in the country. To that end, the CSRC has put in place certain minimum standards for new share issues. For example, to be allowed to issue new shares, companies must have achieved a minimum 6% return on equity (ROE) in the three years prior to the proposed issue, among other requirements.
The CSRC also wants to control the flow of equity market funds (including IPO calendar and new issue pipelines). Note though that the implementation of the approval process also means that even sound companies (in terms of financial results) may not get a chance to issue shares.
Other constraints
It is clear that industry consolidation is hampered by three other factors:
Firstly, despite heavy losses by some (mainly state-owned) retailers over the review period, many still hope that the good old days of exceptional profits will return, and that they will eventually be rewarded for their patience. Who can blame them? The retailing industry as a whole is expanding at close to 10% in spite of the past few years of economic sluggishness— and new retail formats (discount stores, specialist stores, and convenience stores) appear to offer the prospect of better returns in the immediate future. In particular, this has manifested in the manner of how relatively old-fashioned department stores owned by various state-owned enterprises (SOEs) have shown an extreme reluctance to give up control over prime retail sites.
Second, foreign players who have stronger financial and managerial resources are not allowed to grow as fast as they would like to or can. If foreign retailers were allowed to operate more freely, competition will likely intensify much more quickly and the current oversupply of total retail sales area could result in consolidation and efficiency gains that would ultimately benefit all parties more handsomely.
Finally, in the name of urban planning, the government still has restrictions on the location and the number of stores even for domestic retailers. This is also a barrier to consolidation, as the actual implementation of this policy is known to be open to political influences.
Summary 4 Retail Mergers and Acquisitions 2001-2003
Rationale Create a retail giant in Shanghai to compete against international retail giants, the main competitors are Wal-mart and Carrefour
Takeover company Shandong Shandong Sanlian Group Co Ltd
- Country China
- Subsector Real estate/ Hypermarket/ Newspaper/ Travel /Specialty stores
Acquired fascia/company Zhenzhou Baiwen Group Co Ltd
- Country China
- Subsector Supermarket/ Hypermarket
Date March 2003
Rationale Zhenzhou Baiwen group was bankruptcy in 2002, Shandong Sanlian want to enter Zhenzhou market and after this M&A, Shandong Sanlian was listed in Shanghai Stock Exchange market.
Takeover company Beijing Wumei Supermarket Co Ltd
- Country Beijing China
- Subsector Supermarket
Acquired fascia/company Jiahe Supermarket
- Country China
- Subsector Supermarket
Date November 2003
Rationale To spread its business to others origins
Takeover company Hefei Department Stores Co Ltd
- Country Anhui province China
- Subsector Department store
Acquired fascia/company Tongling Department stores
- Country China
- Subsector Department stores
Date September 2003
Rationale Spread its business to other province
Takeover company Dashang Group
- Country Liaoning, China
- Subsector Department stores/Supermarket/Hypermarket
The other main retail corporate development over the review period centred around Dashang Group, Beijing Chaoshifa Supermarket and Beijing Tiankelong. Beijing Chaoshifa Supermarket and Beijing Tiankelong merged their operations in 2001 in the face of intensifying competition in the capital city of Beijing, where both of these retailers centre their operations. Both of these retailers, by themselves, are amongst the 100 largest retailers in the country for the year ended 2003.
Chaoshifa-Tiankerong, the new entity's name lists Chaoshifa as the majority partner, as it braces itself against the tide of the then expected and now realised foreign compeition as well as more sophisticated domestic competition.
After a year though, in April 2003, both sides fell out over the issues of nine new outlets opened by Tiankelong after the signing of the joint-venture agreement. Eventually, Tiankelong cancelled contract, and separated from from the JV company taking with it its 28 outlets.
Chaoshifa then sued Tiankelong for withdrawing from its joint venture agreement. During that time, however, Dashang Group, a rival retail conglomerate from Liaoning province purchased a 92% share of Tiankelong, translating into a 34.77% share of the JV company indirectly between Chaoshifa and Tiankerong.
Summary 5 Other Corporate Developments in Retailing 2001-2003
Group Shanghai Friendship Group
- Country China
- Subsector Supermarket/Hypermarket/Department stores/Convenience store
Disposed fascia/company Shanghai U-Mart Shopping Center Co Ltd
- Country China
- Subsector Department Store
Date August 2002
Rationale To focus on core business
Group Shanghai Bright Entertainment Group
- Country China
- Subsector Entertainment/ Department stores
Disposed fascia/company Yuandong Department Store Co Ltd
- Country China
- Subsector Department Store
Date September 2002
Rationale To focus on core business.
Source: Euromonitor from Official statistics, Trade associations, Company annual report, Company
At the end of 2003, there were 65 listed A-share retailers in China. Of these, the top 10 retailing groups boasted a combined retail sales value of about RMB155 billion in 2003. This translates into about 3.5% of total retail sales in the country – a very small proportion when compared to developed economies that may boast much higher levels of industry consolidation.
Grocery retailers lead the way
As is the case in many developed economies, grocery and general merchandising retailers dominate the top 10 spots in China's top 10 retailers. Apart from the second largest retailer and durable goods specialist, the other nine leading retailers of the country's top 10 retail groups are all either grocery retailers or general merchandising retailers, inclusive of department stores.
A key theme of these leading retailers is that large retail format retailers can count on about 40 retail outlets, including Dashang's hypermarket and department stores, and also Shanghai No.1's chain of department stores. Global giants Carrefour and Wal-mart also have a similar number of retail outlets in China at the end of 2003.
In contrast, the four others boast over 1,000 retail outlets – in patr due to their presence in the smaller format supermarkets and convenience stores formats. These four players include the market-leading Shanghai Friendship which includes both a convenience store chain as well as a supermarket chain both of which number over 1,000 retail outlets each.
Leading players drive consolidation
Another key emerging theme in the ertailing industry, although this may not be obvious from all fronts,
is the high level of consolidation taking place. Current indicators such as the total number of retail businesses in China and the total number of retail outlets in China, indicate that the retailing idustry is still very highly fragmented. This has been changing very rapidly though, as evidenced by the rate of growth of the leading 10 retailers below. Overall, the top 10 leading retailing groups grew by over 35% in terms of retail sales although the industry as a whole registered growth at a much lower 10%.
Although the top 10 leading retailers can only claim to contributing significantly to this trend towards consolidation, it should be noted that other retailers including cash and carry giant Metro have made even greater gains over the previous year in 2002 in terms of retail sales.
Table 39 Leading Retailers in China Ranked by Retail Turnover 2003
Shanghai No.1 Shanghai No.1, Shanghai No.1 Ba Bai Ban
Department store 39
Shanghai Nong-gong-shang Supermarket
Nong-gong-shang Supermarket
Supermarket 400
Shanghai Nong-gong-shang Supermarket Convenience
Alldays Convenience stores 600
Shanghai Nong-gong-shang Supermarket hypermarket
Nong-gong-shang Supermarket mart
Hypermarket 20
Shanghai Nong-gong-shang Supermarket dollar store
5 RMB Dollar stores 30
Jiangsu Suguo Convenience Suguo Convenience store 403
Jiangsu Suguo Hypermarket Suguo Hypermarket 22
Jiangsu Suguo Community store Suguo Community store 5
Jiangsu Suguo supermarket Suguo Supermarkets 670
Source: 1999-2002 Euromonitor from Official statistics, Trade associations, Company annual report,
Company research, Trade press, Trade interviews, 2003 Euromonitor estimatesNote: 2003 year end
data is preliminary
7.2 Major Retail Conglomerates
The main retail conglomerates in China tend to focus their activities on the food and grocery retailing, as well as large mixed retailing sectors. Of the top 10 leading retailers in China, five are retail conglomerates, to the extent that they operate various chains across verious formats. These five retail conglomerates are led by the market-leading Shanghai Friendship, and except for Beijing Hulian, are focused entirely on the retailing industry.
The only exception to the these leading retail conglomerates is Beijing Hulian Group, whose property arm also constructs, develops and manages shopping centres. This is clearly a directly related business asit will eventually allow Beijing Hulian Group's retailing operations first option on the choice locations of their shopping centres.
Other companies for whom retailing represents some but not a majority of their business includes Shanghai Yuyuan Tourist Mart and Shandong Sanlian Group.
Table 41 Major Retail Conglomerates in China 2003
Retail conglomerate Sectors of activity Turnover (RMB million)
Retail turnover 1
Shanghai Friendship Various food and grocery retailing
29,301 100.0
Shanghai Lianhua
Supermarket Various food and grocery retailing
24,746 100.0
Beijing Hulian Group Department stores, Shopping
centre construction and management
14,500 75.0
Dashang Group Various food and grocery retailing
13,600 100.0
Shanghai Nong-gong-
shang supermarket Various food and non-food retailing
10,100 100.0
Source: 1999-2002 Euromonitor from Official statistics, Trade associations, Company annual report,
Company research, Trade press, Trade interviews, 2003 Euromonitor estimates
Notes: 1 As a % of group turnover Retail turnover data represents turnover from domestic retailing
operations 2003 year end data is preliminary
7.3 Retailer Concentration
Without exception, all 10 of the leading retailers in 2003, have increased their share of the market in successive years from 2001. Cumulatively, their market share has increased too, from 2001 to 2003.
This growth on the part of leading retailers and the increase in their cumulative share of the market, is however, very limited. It is limited because, viewed in terms of their total share of the entire retailing indsutry, it can be seen that the top 10 retailers account for no more than 3.5% of the country's retail sales.
This is in itself another indication that there will continue to be alarge amount of mergers and acquisitions, in addition to aggressive organic growth strategies, from both local and foreign-owned retailers. The most enthusiastic of industry sources believe that the top 10 leading retailers' share of the total retail market will likely increase beyond a quarter of the total retail market before 2008.
Table 42 Leading Retailers' Shares of Retail Sales 2001-2003
Source: 1999-2002 Euromonitor from Official statistics, Trade associations, Company annual report,
Company research, Trade press, Trade interviews, 2003 Euromonitor estimates
7.4 Multinational Penetration
The truth of the matter
Over 300 foreign retailers have a presence in China. Our table below includes some of the most notable retailers. It is prudent to note that information such as this obtianed from published and official sources frequently understate the true extent of foreign penetration for two reasons.
Firstly, there are still many restrictions on foreign participation and, therefore, foreign retailers have an incentive to downplay their presence in China with many having opted to take part in a JV.
Secondly, while central government ministries (MOFTEC and the State Planning & Development Commission) have maintained controls on foreign retailers, regional and local governments are generally more than happy to embrace these foreign-owned retailers in the hope of a capital infusion and the infrastructure that foreign retailers generally build to support their own retail outlets' needs such as surrounding roads. In many cases, regional and local governments have granted licences that appear to breach central government policy. For example, according to mainland Chinese press sources the debate regarding Carrefour's operations in Shenyang and 26 other cities has led the retailer to apply for registration on a retrospective basis. Carrefour has reportedly apologised for not going through the 'proper' channels.
The official stand
What is China's commitment regarding foreign retailers' participation under the WTO entry accord?
Firstly, China will allow foreign retailers to operate in the top 50 cities (including 31 provincial capitals, of which all are special economic zones, like Shenzhen and Zhuhai, and a few major cities with a population of a million or more). Secondly, foreign firms are allowed to operate a wholesale business as long as the local JV partner (or partners) holds a stake of at least 51%.
Third, foreign firms can take a controlling stake in a retail operation in the following three circumstances:
If the operation has no more than three stores;
for specialist chain stores and convenience stores, a local investor(s) must have at least a 35% stake—Carrefour is in the process of selling a 35% stake to local parties; and
if the foreign retailer will source "significant amounts" of products from China and/or help export Chinese products.
It is the view of some players that these administrative policies (not laws) are not well defined. For example, there is no definition as to what constitutes a significant amount, leaving the door open for regional governments to exercise discretion. This policy pronouncement made in November 2001, just before China's entry to the WTO, has in fact gone one step further than the actual commitment China made to the WTO.
Why is wholesale nervous?
The Chinese government's control over the wholesale business is a historical legacy. Until the late-1980s, price controls were imposed on most consumer products, and thus there were shortages and associated rationing. Coupons, vouchers and wage payment in kind were commonplace.
In that time, the government wanted to control the supply of consumer products, hence the tight controls on the wholesale business. It also made it easier to control the all important consumer price index (CPI), a key indicator of prices in the country. Today, while wholesale is no longer wholly relevant in controlling the country's CPI or product supply, it appears that the previous legacy of controlling wholesale operations in China continue to persist. As leading retailers increase their bargaining power with ever increased shares of the retailing industry (in terms of retail sales), wholesalers will come under increased pressure to allow foreign-owned businesses to enter the wholesale market. This, if it happens, will in turn likely encourage more foreign-owned retailing businesses to enter China, as most have some form of wholesaling operations integrated with their core retailing operations.
Summary 3 Leading Multinational Groups 2002-2003
Retail group Fascia Number of outlets
Subsector
Wal-Mart Wal-Mart 31 Hypermarket
Carrefour Carrefour 40 Hypermarket
7-Eleven Liangyou Jinban convenience stores (JV)
50 Convenience stores
Metro AG Metro 21 Cash and carry
Ito Yokado Ito Yokado 2 Department stores
Ikea (Furniture) Ikea 2 Furnishing stores
Daiei (of Japan) Daiei 14 Department stores
Pricemart Pricemart (Indirect management)
22 Hypermarkets, Supermarket
Source: 1999-2002 Euromonitor from Official statistics, Trade associations, Company annual report,
Company research, Trade press, Trade interviews, 2003 Euromonitor estimatesNote: 2003 year end
data is preliminary
7.5 Retail Mergers and Acquisitions
The aircraft carrier of retailing
On 24 April 2003, Shanghai Bailian Group Co Ltd was established by four commercial corporations, namely Shanghai No.1 Group Co Ltd, Hualian Group Co Ltd, Shanghai Friendship Co Ltd and Shanghai Material trade Co Ltd. With total assets valued at RMB33.5 billion, this new entity boasted of over 4,500 retail outlets across more than 20 provinces.
Shanghai Bailian counts under its control various forms of modern retailing formats including hypermarkets, department stores, supermarkets, convenience stores and discount stores. With total turnover of RMB20 billion in 2002, Shanghai Material Trade was also the leading logistics player for primary materials in China. It is highly likely that with Shanghai Material Trade's strong logistics expertise, the Shanghai Bailian Group will become even more competitive.
The establishment of Shanghai Bailian is in theory a direct challenge to multinational retail conglomerates such as Wal-mart and Carrefour. Upon closer inspection, however, this may not necessarily be true. In the long run, Shanghai Bailian may not be able to compete with Wal-mart or Carrefour as it is currently operating as four disparate entities nominally held together by virute if being the local Shanghai government's corporations.
Other corporate activities
Foreign investors often ask why is there no real consolidation, given the high fragmentation of China's retailing industry? In truth, there has already been a lot of consolidation over the review period and
there could potentially be much more to come, as foreign investors rush in at an increasing rate.
There have been at least 30 major M&A deals (backdoor listing, share transfers and debt-equity swaps) between listed retailers since 2000. Some listed retailers are themselves a product of mergers or acquisitions. For example Hualian Group sold management control of Hualian Supermarket to Shanghai Hualian Shopping Mall in June and September 2000 in two tranches worth over RMB213 million. Shortly after, in February 2001, the Shanghai Huangpu District Government sold its controlling stake in Wanxiang (Retail) Group to New World Group for RMB92 million.
Financial market restraints
At present, M&As related to SOEs still require the approval of the Ministry of Finance or regional governments. However, this hurdle does not appear to be insurmountable. Sources suggest that one lasting impediment is rigid stock market rules. For example, a key sticking point is that if a Chinese company wants to take over another, it must pay in cash—issuing new shares is not allowed.
There are problems even if the acquirer wants to issue new shares on the open market. Each rights issue, or new share issue, must gain approval from the stock exchange and the CSRC (China Securities Regulatory Commission). But this process can take months if not years, usually frustrating and eventually thwarting many prospective M&A deals.
The logic behind the approval process is to ration scarce financial resources in the country. To that end, the CSRC has put in place certain minimum standards for new share issues. For example, to be allowed to issue new shares, companies must have achieved a minimum 6% return on equity (ROE) in the three years prior to the proposed issue, among other requirements.
The CSRC also wants to control the flow of equity market funds (including IPO calendar and new issue pipelines). Note though that the implementation of the approval process also means that even sound companies (in terms of financial results) may not get a chance to issue shares.
Other constraints
It is clear that industry consolidation is hampered by three other factors:
Firstly, despite heavy losses by some (mainly state-owned) retailers over the review period, many still hope that the good old days of exceptional profits will return, and that they will eventually be rewarded for their patience. Who can blame them? The retailing industry as a whole is expanding at close to 10% in spite of the past few years of economic sluggishness— and new retail formats (discount stores, specialist stores, and convenience stores) appear to offer the prospect of better returns in the immediate future. In particular, this has manifested in the manner of how relatively old-fashioned department stores owned by various state-owned enterprises (SOEs) have shown an extreme reluctance to give up control over prime retail sites.
Second, foreign players who have stronger financial and managerial resources are not allowed to grow as fast as they would like to or can. If foreign retailers were allowed to operate more freely, competition will likely intensify much more quickly and the current oversupply of total retail sales area could result in consolidation and efficiency gains that would ultimately benefit all parties more handsomely.
Finally, in the name of urban planning, the government still has restrictions on the location and the number of stores even for domestic retailers. This is also a barrier to consolidation, as the actual implementation of this policy is known to be open to political influences.
Summary 4 Retail Mergers and Acquisitions 2001-2003
Acquired fascia/company Shanghai Friendship Group Co Ltd/ Shanghai No.1 Group Co Ltd/ Shanghai Hualian Group Co Ltd/ Shanghai Material trading center Co Ltd
Rationale Create a retail giant in Shanghai to compete against international retail giants, the main competitors are Wal-mart and Carrefour
Takeover company Shandong Shandong Sanlian Group Co Ltd
- Country China
- Subsector Real estate/ Hypermarket/ Newspaper/ Travel /Specialty stores
Acquired fascia/company Zhenzhou Baiwen Group Co Ltd
- Country China
- Subsector Supermarket/ Hypermarket
Date March 2003
Rationale Zhenzhou Baiwen group was bankruptcy in 2002, Shandong Sanlian want to enter Zhenzhou market and after this M&A, Shandong Sanlian was listed in Shanghai Stock Exchange market.
Takeover company Beijing Wumei Supermarket Co Ltd
- Country Beijing China
- Subsector Supermarket
Acquired fascia/company Jiahe Supermarket
- Country China
- Subsector Supermarket
Date November 2003
Rationale To spread its business to others origins
Takeover company Hefei Department Stores Co Ltd
- Country Anhui province China
- Subsector Department store
Acquired fascia/company Tongling Department stores
- Country China
- Subsector Department stores
Date September 2003
Rationale Spread its business to other province
Takeover company Dashang Group
- Country Liaoning, China
- Subsector Department stores/Supermarket/Hypermarket
The other main retail corporate development over the review period centred around Dashang Group, Beijing Chaoshifa Supermarket and Beijing Tiankelong. Beijing Chaoshifa Supermarket and Beijing Tiankelong merged their operations in 2001 in the face of intensifying competition in the capital city of Beijing, where both of these retailers centre their operations. Both of these retailers, by themselves, are amongst the 100 largest retailers in the country for the year ended 2003.
Chaoshifa-Tiankerong, the new entity's name lists Chaoshifa as the majority partner, as it braces itself against the tide of the then expected and now realised foreign compeition as well as more sophisticated domestic competition.
After a year though, in April 2003, both sides fell out over the issues of nine new outlets opened by Tiankelong after the signing of the joint-venture agreement. Eventually, Tiankelong cancelled contract,
and separated from from the JV company taking with it its 28 outlets.
Chaoshifa then sued Tiankelong for withdrawing from its joint venture agreement. During that time, however, Dashang Group, a rival retail conglomerate from Liaoning province purchased a 92% share of Tiankelong, translating into a 34.77% share of the JV company indirectly between Chaoshifa and Tiankerong.
Summary 5 Other Corporate Developments in Retailing 2001-2003
Group Shanghai Friendship Group
- Country China
- Subsector Supermarket/Hypermarket/Department stores/Convenience store
Disposed fascia/company Shanghai U-Mart Shopping Center Co Ltd
- Country China
- Subsector Department Store
Date August 2002
Rationale To focus on core business
Group Shanghai Bright Entertainment Group
- Country China
- Subsector Entertainment/ Department stores
Disposed fascia/company Yuandong Department Store Co Ltd
- Country China
- Subsector Department Store
Date September 2002
Rationale To focus on core business.
Source: Euromonitor from Official statistics, Trade associations, Company annual report, Company
Shanghai Lianhua Supermarket Co Ltd, hereafter called Shanghai Lianhua, is the leading supermarket chain in China and its success lies in local market knowledge and efficient working capital management. Leveraging on its strong foothold in eastern China, the chain is to open 2150 stores across China in 2004 and 2005 in order to drive earnings growth. However, with a large CAPEX requirement, which posed a financial risk, the company operated on a low net margin of 2.1% in 2003.
Shanghai Lianhua separates its business into 3 principal fascia according to business size. It has huge supermarkets under the name of Century Lianhua, medium-sized supermarkets under the name of Lianhua Supermarket, and small convenience stores under the name of Quik.
Industry restructuring has increased local competition. In addition, international companies, such as Walmart and Carrefour are keen to expand in China.
Shanghai Lianhua is to be listed on the Hong Kong stock exchange at an IPO price of HK$3.875 per share. Keen interest in its debut is expected. The stock is expensive in comparison to that of Shanghai Lianhua's peers but strong demand could offer support.
Summary 6 Company Factfile 2003
Ownership: Shanghai Friendship
Country of origin: Shanghai, China
Retail sectors of activity: Hypermarket/Supermarket/Convenience stores
Principal fascia: Century Lianhua, Lianhua Supermarket, Quik
Source: Euromonitor from company annual reports
Market position
Shanghai Lianhua is the largest retail chain operator in China. Lianhua has 2,402 retail outlets, 394 of which are supermarkets and 425 of which are convenience stores operating under the group's franchise arrangements. The group derives 83% of its turnover from Shanghai, 12% from Zhejiang and 5% from Jiangsu.
The company has developed an integrated information management system to effectively control inventories, distribution, sales, and financial management. This has enabled it to make timely purchases and maintain an efficient stock level, which is vital for the working capital management of a supermarket chain operator. Compared to its domestic peers, Shanghai Lianhua's logistics system is the most advanced.
As a result of a joint venture with Carrefour, Shanghai Lianhua has a 45% stake in supermarket Shanghai Carhua. Through collaboration with this international leader, Shanghai Lianhua has acquired western management skills. Furthermore, Shanghai Lianhua is blessed with local market knowledge and good understanding of mainland consumers' habits. This is definitely an advantage over its western counterparts.
Riding on growing affluence in China, Shanghai Lianhua is set to benefit from changing consumer patterns. While in the past, the Chinese used to shop in wet markets for fresh food, there is a growing trend to purchase more from supermarkets for hygiene and health reasons. Rising car ownership could encourage more Chinese to shop in supermarkets and hypermarkets.
Table 43 Company Shares 2002-2003
% value
2002 2003
Hypermarkets 1.8 2.3
Supermarkets 1.5 1.8
Convenience stores 1.7 2.5
Source: 1999-2002 Euromonitor from Official statistics, Trade associations, Company annual report,
Company research, Trade press, Trade interviews, 2003 Euromonitor estimates based on company
annual reports
Note: 2003 year end data is preliminary
Sales performance
Shanghai Friendship is the major shareholder with a 37% stake, followed by Shanghai Industrial Commercial Network with a 72.6% stake and Mitsubishi Corp with a 7.4% stake. The Shanghai government recently decided to merge the parent companies of Shanghai Lianhua, Hualian, Shanghai Material Trading Centre and Shanghai No.1 Department Store. Although Shanghai Friendship and Shanghai Industrial Commercial Network have established a non-competition undertaking with Lianhua, there remains a potential threat.
There has been strong sales growth, with a 30.3% increase in total sales in 2002 and a 35% increase in total sales in 2003. In 2003, the group opened around 900 new outlets, mainly convenience stores. However around 200 outlets were also closed by the end of 2003 due to the level of business or adjustments in the outlets. By the end of 2003 there were 2,402 outlets, showing an increase of 41.11% compared with 2002. The rapid increase in the number of outlets was higher than that of the total sales, owing to the reduction in sales per outlet.
Shanghai Lianhua, a subsidiary and one of the main enterprises under the Friendship Group, is currently the largest supermarket chain in China. Shanghai Lianhua's development has reached an incredible annual increase rate of 30%. By December 31, 2003, Shanghai Lianhua had 2,402 stores and its total sales area reached 903,000 square meters.
In 2003, Shanghai Lianhua was at the top ranking retailer in China, in terms of sales volume, and it is anticipated to keep that advantageous position in 2004. Shanghai Lianhua was the first enterprise among Chinese supermarkets to be awarded the ISO9002 International Quality Certification, and it also takes the lead in establishing the most advanced information management centre for intelligent logistics and distribution.
Table 44 Sales Performance 2001-2003
RMB/outlets/sq metres
Unit 2001 2002 2003
Total sales RMB million 14,063.4 18,330 24,745.5
Average weekly sales RMB million 270.5 352.5 475.9
Sales per outlet RMB million 12.7 10.8 10.3
Sales per sq m RMB 27,848.3 26,185.7 27,403.7
Number of outlets 1,104 1,702 2,402
Total assets RMB million 688.9 1,065.8 1,456
Total sales area Sq m 505,000 700,000 903,000
Source: 1999-2002 Euromonitor from Official statistics, Trade associations, Company annual report,
Company research, Trade press, Trade interviews, 2003 Euromonitor estimates based on company
annual reports
Note: 2003 year end data is preliminary
Financial performance
At the end of 2003, Shanghai Lianhua had accrued profit of RMB519.7million and profit per square metre was increased from RMB1,126 in 2002 to RMB1,179.5 in 2003. The company derives 42% of its net earnings from associate, Carhua. Such heavy reliance on its associate raises earnings-related risks. Furthermore, the group has a low business margin, which is typical of retail/consumer companies in China. The low business margin means there is limited room for mistakes within the operation.
The company had net cash of RMB135.7million in 2002, but requires a CAPEX of RMB3.4 billion. The company has a low current ratio of 0.5x, which could be a problem if working capital is mismanaged.
Similar to other Chinese retailers, Shanghai Lianhua achieved a low net margin of 2.1% in 2003. For Shanghai Lianhua, the biggest weakness is its logistics problem. Due to too many links in the logistics chain, the cost is very high. However, this problem will hopefully be solved leading to an increase in the net margin percentage in 2004.
Shanghai Lianhua's margin was slightly lower in 2003, than in 2002, due to the SARS outbreak. Also, although Shanghai Lianhua achieved several sales through its free delivery service, this also accrued logistics costs, which maybe reduced the net margin further.
Table 45 Financial Performance 2001-2003
RMB/%
Unit 2001 2002 2003
Net profit RMB million 267.2 403.3 519.7
Profit per sq m RMB 1,133.1 1,126 1,179.5
Gross margin % 12.7 13.5 14.2
Net margin % 1.9 2.2 2.1
Return on total assets % 38.8 37.8 35.7
Gearing ratio % 0.59 0.51 0.53
Source: 1999-2002 Euromonitor from Official statistics, Trade associations, Company annual report,
Company research, Trade press, Trade interviews, 2003 Euromonitor estimates based on company
annual reports
Note: 2003 year end data is preliminary
Company prospects
The company is set to expand beyond Shanghai and it plans to open 2,150 new stores over 2004-2005. An increase in the number of stores would be a future earnings driver. Further expansion could also lead to economies of scale and hence an improvement in margins.
8.2 Shanghai Friendship Group Incorporated
Company
Company factfile
Shanghai Friendship Group Incorporated Company, formerly named Shanghai Friendship Hua Qiao Co Ltd, hereafter called Friendship Group, was established in 1952 and restructured in 1993. It's A Shares
and B Shares were listed and traded on the Shanghai Stock Exchange on February 4, 1994 and January 5,1994 respectively. In December 2000, the company was renamed to take its current corporate name.
As a retail business, Friendship Group is the strongest player in China. However, between 80-90% of sales and profit come from one of subsidiary, Shanghai Lianhua Supermarket. Besides Shanghai Lianhua Supermarket, the other subsidiaries of Friendship Group are not performing so well, with some of them even suffering losses.
In 2000, through the foreseen re-incorporation of its outperforming resources, the company succeeded in shifting its business from a traditional department store operation to a retail chain operation. In doing so the company laid down the framework for its future development and decided upon the following five core businesses to support its development:
Food and commodities supermarket chain stores with benchmarks such as Lianhua Supermarket Co Ltd, which is currently the largest supermarket chain in China;
Specific-commodity-oriented shopping mall chain stores with benchmarks such as Homemart Decoration Materials Supermarket Co Ltd;
Department stores with modern and featured elements, and brand development chain stores with benchmarks such as Shanghai Friendship Department Store Co Ltd;
Community shopping centre chains supported with modernised logistics, resource allocation and e-commerce systems with benchmarks such as Friendship Shopping Centre.
In 2001, the company started its nation-wide market development strategy on all fronts.
Summary 7 Company Factfile 2003
Ownership: Friendship Group
Country of origin: Shanghai, China
Retail sectors of activity: Supermarket, Hypermarket, Specialty stores, Department stores
Principal fascia: Homemart (Furnishing specialty stores) Lianhua (Supermarket),Friendship Dept(Dept Stores), Friendship South Shopping City(Hypermarket)
Source: Euromonitor from company annual reports
Market position
The company's main business comprises of the operation of chained supermarkets and general department stores, and sales of decoration materials. The company also participates in imports and exports, catering, sales of old and new craft items, gold and silver goods, furniture and curios. The company, with commercial retailing as its main business, is currently a listed enterprise with the largest retail volume in China.
Furthermore, the company's main subsidiary, Lianhua Supermarket, realised the following five 'firsts' in domestic retailing:
the first large-scale chained supermarket in China;
the first enterprise to achieve ISO-9002 International Quality System status in the domestic supermarket industry;
the enterprise with the largest number of chain stores in China;
had the first large-scale delivery centre, forming wise cyber system management;
the first chained supermarket which explored an e-commerce system.
As a major retailer in China, the company's main business is in supermarkets and its market share for supermarkets was 1.76% in 2003 due to its successful market strategy, showing a slight increase compared to 2002.
Homemart is Friendship Group's own fascia in home furnishing. Homemart's major business is in Shanghai and the surrounding provinces. Although competition in home furnishing is very fierce, Homemart still maintained its position and increased its share in home furnishing slightly in 2003.
The company's other major business type, department stores, saw a reduction in share in 2003 to 0.11% due to supermarkets and hypermarkets.
Table 46 Company Shares 2002-2003
% value
2002 2003
Supermarket 1.52 1.76
Home Furnishing 3.09 3.29
Department 0.29 0.11
Source: Euromonitor from company annual reports
Sales performance
The company's main subsidiary, Lianhua Supermarket, has been ranked as number one in China regarding its sales volume, many times. In 2001, the sales volume of Lianhua Supermarket reached RMB14 billion, and Lianhua Supermarket became the only commercial enterprise in China whose sales volume exceeded 10 billion.
Homemart, one of the largest decoration-oriented supermarkets in China, has adopted an advanced chain management system. By possessing ten shopping malls and one professional interior decoration company, Homemart is capable of providing a one-stop service connecting distribution of decoration materials, design and construction work. As China's economy develops, Homemart is set to show great potential.
Friendship Department Store, another subsidiary of Friendship Group, is the parent company of several wholly owned entities or joint ventures, including Shanghai Friendship Shop and Hongqiao Friendship Shopping Center. Friendship Department Store's branches are mainly located in Shanghai's prosperous business districts and main residential areas. Friendship Department Store currently occupies a total sales area of over 100 thousand square meters. Friendship Department Store sells more than 80 thousand different commodities and is recognised both at home and abroad.
Friendship South Shopping Mall, which possesses a gigantic sales area of 80-thousand square meters, was the first shopping mall in Shanghai. Friendship-South Shopping Mall has become a new mode of business in domestic retailing.
By the end of 2003, the company, as a whole, had 2,442 outlets. In 2002, the company had 1,127 city stores and 593 stores outside of the city. In 2003, the company increased its total number of stores to 2,442, adding stores both in and outside of cities.
Table 47 Sales Performance 2001-2003
RMB/outlets/sq metres
Unit 2001 2002 2003
Total sales RMB million 16,126 20,923 26,957
Average weekly sales RMB million 310.1 402.4 518.4
Sales per outlet RMB million 14.39 12.16 11.04
Sales per sq m RMB 21,501.3 21,794.8 20,736
Number of outlets 1,121 1,720 2,442
Total assets RMB million 3,457.4 4,794.8 6,320.1
Total sales area Sq m 750,000 960,000 1,300,000
Source: 1999-2002 Euromonitor from Official statistics, Trade associations, Company annual report,
Company research, Trade press, Trade interviews, 2003 Euromonitor estimates based on company
annual reports
Note: 2003 year end data is preliminary
Financial performance
At the end of 2003, the company's total equity amounted to 330,151,300 shares, among which 106,040,000 were state-owned shares, accounting for 32% of the total equity; 15,613,800 were legally-owned shares, accounting for 5% of the total equity; 82,820,500 were traded A Shares, accounting for 25% of the total equity; 125,677,000 were traded B Shares, accounting for 38% of the total. Shanghai Friendship (Group) Company is the shareholder of the company's state-owned shares and hence the biggest shareholder of the company.
At the end of 2003, Friendship Group had achieved a profit of RMB280.4 million, an increase over 2002. Profit per square metre fell from RMB85.94 in 2001 to RMB77.23 in 2003.
Similar to other Chinese retailers, Friendship Group also achieved a low net margin in 2003, of 1.04%. For Friendship Group, the weakness was due to logistical problems. Due to too many links in the logistics chain, the costs were very high. This problem should hopefully be solved in 2004 by Shanghai Bialian Group, the new mergers and acquisitions group, with help from Shanghai Material Trade Centre and its experience of advanced management logistics, thereby helping Friendship Group to obtain a higher margin percentage.
Table 48 Financial Performance 2001-2003
RMB/%
Unit 2001 2002 2003
Net profit RMB million 191.2 165.9 280.4
Profit per sq m RMB 93.47 85.94 77.23
Gross margin % 11.5 8.4 13.8
EBITDA margin % 7.94 5.2 1.2
Net margin % 1.19 0.79 1.04
Return on total assets % 5.53 3.46 4.44
Source: 1999-2002 Euromonitor from Official statistics, Trade associations, Company annual report,
Company research, Trade press, Trade interviews, 2003 Euromonitor estimates based on company
annual reports
Note: 2003 year end data is preliminary
Company prospects
According to the company's 2001-2003 development plan, its business focus was on the following:
Business structure. The company should further expand its core businesses: grocery supermarkets, construction material oriented supermarkets and department stores; and, at the same time, accelerate its extension into shopping centres and e-commerce.
More exposure to the nationwide market. The company should focus its exploration on and expand its efforts towards the national market, and increase its occupation rate. It also aimed to re-shape its corporate structure, managing procedure, operation flow and information systems, and make its enterprise culture more adaptable.
Achieve first-tier retailing posts and business performance. The company's main retailing posts, operational and financial index are in leading positions compared to its domestic peers.
Achieve comparatively strong competitiveness. This is highlighted by the following elements which are in an advanced position compared with the company's domestic peers: supply chain management based on quality control, a business operation system founded on standardised service, information control through prompt, accurate sharing of resources, a delivery system based on speedy circulation, low costs and high efficiency, and appropriate management of fresh foods.
A strong risk prevention strategy. The company's capability in preventing and controlling risks has enabled it to become more adaptable to a market-oriented economy.
To achieve these five objectives, Friendship Group will join a new retailing group, Shanghai Bailian Group, which will become the biggest group within China's retailing industry. After joining the Bailian Group, Friendship Group will become more effective on logistics grounds with help from Shanghai Material Trade, which also joined Bailian Group. A solution to its logistical problems should help Friendship Group to reduce its operational costs.
The five strategies to be implemented in 2004-2006 are as follows: development of core businesses as first priority; strengthening of the company's presence in Shanghai and further exploration nationwide; promotion of core competitiveness; rapid expansion of capital operation; and an aggressive strategy of attracting talent.
According to the Company's five-year development plan, it started its national development strategy in 2001.
8.3 Shanghai Hualian Supermarket Co Ltd
Company factfile
Shanghai Hualian Supermarket Co Ltd, hereafter called Hualian Supermarket, was the first chained supermarket company to share the stock of Shanghai A shares. Hualian 's management principle is 'Low cost, Low devotion, High benefit'. It insists on a low cost policy, which it implements through franchise stores. Hualian Supermarket comprises of a group of supermarkets, hypermarkets and convenience stores. At the end of 2003, Hualian Supermarket had 20 branch companies in China, and 1560 outlets. Its business covers more than 10 provinces and cities in China. Hualian Supermarket's main business is chained supermarkets. Hualian Supermarket was established in Jan 1993. Its city of origin is Shanghai and its principal fascia is Hualian.
Hualian Supermarket is another strong supermarket chainstore after Shanghai Lianhua. The company has a free delivery hotline. Customers call the hotline, place a telephone order, and the store delivers the merchandise free-of-charge, directly to the customer's home. At the height of the SARS epidemic, customers did not want to go out in public, therefore the free delivery service proved profitable for the company.
Summary 8 Company Factfile 2003
Ownership: Shanghai Hualian Supermarket
Country of origin: Shanghai
Retail sectors of activity: Supermarket, Hypermarket, Department Store, Convenience Stores
Principal fascia: Hualian, 962828(Free delivery hotline)
Source: Euromonitor from company annual reports
Market position
The strongest advantage of Hualian Supermarket is its franchise stores. The company uses franchise stores to pass sales straight to the franchise member stores, along with access to its fascia.
By the end of 2003, Hualian Supermarket franchise stores numbered more than 1,000, covering more than 10 provinces and cities. The company's development strategy, although based in East China, is to radiate across the whole country.
Under directional service and support from Hualian Supermarket, the performance of many franchise member stores showed a marked increase. According to Hualian Supermarket's information, 300 franchise member stores were losing business or going to close down. After joining Hualian Supermarket, 92% of stores entered a payoff period, 6% of stores achieved balance between profit and loss, and 2% of stores reduced their losses rapidly.
The main competitor of Hualian Supermarket is Shanghai Lianhua Supermarket. Both companies are in the same city, Shanghai, and their core business is supermarkets. Hualian Supermarket will attempt to compete with Shanghai Lianhua Supermarket by increasing the number of its outlets and placing them in more locations near to the community. Another method is to spread its outlets outside of Shanghai.
Table 49 Company Shares 2002-2003
% value
2002 2003
Supermarkets 0.9 1.1
Department stores 0.5 0.6
Convenience stores 0.6 0.1
Source: 1999-2002 Euromonitor from Official statistics, Trade associations, Company annual report,
Company research, Trade press, Trade interviews, 2003 Euromonitor estimates based on company
annual reports
Note: 2003 year end data is preliminary
Sales performance
'To be bigger, to be stronger, to be better' is the strategic target of Hualian Supermarket. When the company was established, total sales amounted to less than RMB100 million, then sales grew to RMB12.5 billion in 2003. Now, the company's economic structure, sales performance and profit level have become leading examples in China.
At the end of 2003, Hualian Supermarket achieved total sales of RMB12.5 billion, showing an increase of 22% compared with 2002. Hualian Supermarket's strength lies in franchise chain stores. Between 2000-2003, the development speed of its franchise stores was the fastest out of all types of retail. In 2001, Hualian Supermarket had 799 stores, mainly its own supermarkets, but in 2002 the company changed its operating policy to franchise chain stores, in order to absorb some small chain stores which were not doing so well in business, thereby providing technical support and service to improve their economic performance. This was also a good way for Hualian Supermarket to increase its number of outlets at the lowest cost. Under this strategy, Hualian increased its outlets by 48% in 2002, and saw a further increase of 29% in 2003.
However, sales did not develop as rapidly as the number of outlets, which led to a decrease in sales per outlet. In line with the development in the number of outlets, the sales area also increased very rapidly, which in turn led to a decrease in sales per square metre.
Table 50 Sales Performance 2001-2003
RMB/outlets/sq metres
Unit 2001 2002 2003
Total sales RMB million 8,504 10,250 12,500
Average weekly sales RMB million 163.5 197.1 240.4
Sales per outlet RMB million 10.4 8.5 8
Sales per sq m RMB 19,351.5 15,263.2 14,702.4
Number of outlets 818 1,210 1,560
Total assets RMB million 1,136.4 1,239.7 1,358.2
Total sales area Sq m 439,450 671,550 850,200
Source: 1999-2002 Euromonitor from Official statistics, Trade associations, Company annual report,
Company research, Trade press, Trade interviews, 2003 Euromonitor estimates based on company
annual reports
Note: 2003 year end data is preliminary
Financial performance
At the end of 2003, Hualian Supermarket achieved a profit of RMB79.76 million, showing little change from 2002. Profit per square metre fell from RMB137.7 in 2001 to RMB93.8 in 2003.
Hualian Supermarket also saw a low net margin of 0.64% in 2003. For Hualian Supermarket, just as with other leading retailers, its biggest weakness is in logistics, owing to too many links in the logistics chain, thus making the cost very high. However, help should be on its way in 2004, in the form of Shanghai Bailian Group and Shanghai Material Trade Centre and its advanced management experience of logistics.
In 2003, Hualian's net margin was lower than in 2001 and 2002, due to the SARS outbreak. Although Hualian achieved many sales through its free delivery service, it also accrued more costs on logistics, which maybe reduced the margin further.
Table 51 Financial Performance 2001-2003
RMB/%
Unit 2001 2002 2003
Net profit RMB million 60.5 80.6 79.76
Profit per sq m RMB 137.7 120.0 93.8
Gross margin % 11.5 12.1 13.6
EBITDA margin % 6.87 9.61 1.26
Net margin % 0.71 0.79 0.64
Return on total assets % 4.4 5.4 3.5
Source: 1999-2002 Euromonitor from Official statistics, Trade associations, Company annual report,
Company research, Trade press, Trade interviews, 2003 Euromonitor estimates based on company
annual reports
Note: 2003 year end data is preliminary
Company prospects
Under strong threats from many multinational retailers such as Wal-Mart, Carrefour, Metro and Trust-Mart, Hualian Supermarket joined a new group, Shanghai Bailian Group, through mergers and acquisitions in April 2003. Shanghai Bailian Group hopes to be listed on the Shanghai Stock Exchange in 2004 which should enlarge its total assets.
Hualian Supermarket will open more outlets in 2004 especially outside of Shanghai, because there are threats not only from foreign retailers, but also from domestic retailers. The main plan for expansion of Hualian Supermarket will be to absorb more small chain stores and help them become franchise member stores in 2004. In this way Hualian Supermarket can obtain the highest profit at the lowest cost because the small chain stores already have a formal system in place with experienced staff.
Hualian Supermarket will also open some hypermarkets in Shanghai or Beijing in 2004 to compete with others competitors. There is a strong chance that its core business will focus on electrical products.
8.4 Shanghai No.1 Department Co Ltd
Company factfile
Shanghai No.1 Department Co Ltd, hereafter called Shanghai No. 1, is a large scale retail corporation comprising of department stores, wholesale, groceries, hotels, estates, travel, medicine, storage, import and export trading, and production. Shanghai No.1 Department store's principal fascias are 'Shanghai No.1' and 'Shanghai No.1 Ba Bai Ban', Shanghai No.1 manages more than 100,000 kinds of products. Shanghai No.1 has been one of the leading retailers in China since 1950.
Summary 9 Company Factfile 2003
Ownership: Shanghai No.1
Country of origin: Shanghai
Retail sectors of activity: Department Store, wholesale, grocery, hotel, estate, travel, medicine, storage, import/export trading, and
production
Principal fascia: Shanghai No.1 Shanghai No.1 Ba Bai Ban
Source: Euromonitor from company annual reports
Market position
Shanghai No.1 is one of the oldest retailers in China. It began its operations in the 1950's, starting its business from a department store. Based on traditional local culture, Shanghai No.1 expanded its businesses into travel and grocery etc.
The main competitor of the company is Shanghai New World Department Store, which is opposite Shanghai No.1, in the same street. Shanghai New World is a new department store, with a new and younger shopping style. Although it is a young department store, it achieved good results in a short time. Many of its customers come from Shanghai No.1's old customer base.
The strength of Shanghai No.1 is that it is a famous, old brand, which has left a deep impression of good standing in consumers' minds. Its history is also another strength known even to overseas tourists. However, the history of Shanghai No.1 is also its biggest weakness. The shopping environment is dark, old and dirty in consumer's opinions, which causes them to give up on the idea of shopping there.
Table 52 Company Shares 2002-2003
% value
2002 2003
Department store 2.27 2.14
Source: 1999-2002 Euromonitor from Official statistics, Trade associations, Company annual report,
Company research, Trade press, Trade interviews, 2003 Euromonitor estimates based on company
annual reports
Note: 2003 year end data is preliminary
Sales performance
Shanghai No.1 saw a reduction of 3% in total assets in 2002 over the level of total assets in 2001, mainly due to group restructuring whereby some poorly performing outlets were sold.
Total sales increased over the review period, rising by 40% in 2002 and 4.5% in 2003. Shanghai No.1 opened a new building next to its mother building in 2003 with a new and younger shopping environment in order to compete with Shanghai New World Department Store. However, total sales
were still in line with those of 2002, the main reason being the SARS outbreak in the middle of 2003. Shanghai No.1's main consumers are tourists from other cities in China and tourists from abroad.
Table 53 Sales Performance 2001-2003
RMB/outlets/sq metres
Unit 2001 2002 2003
Total sales RMB million 7,199.1 10,100 10,550
Average weekly sales RMB million 138.4 194.2 202.9
Sales per outlet RMB million 205.7 273 270.5
Sales per sq m RMB 25,574.1 34,237.3 34,590.2
Number of outlets 35 37 39
Total assets RMB million 3,901.9 3,784.9 3,801.2
Total sales area Sq m 281,500 295,000 305,000
Source: 1999-2002 Euromonitor from Official statistics, Trade associations, Company annual report,
Company research, Trade press, Trade interviews, 2003 Euromonitor estimates based on company
annual reports
Note: 2003 year end data is preliminary
Financial performance
In 2002, the company's profit reduced by 5.3%, owing to competition from other retailers and a change in taxation. The government changed the taxation rate from 15% to 33% in 2002.
In 2003, the company achieved a higher gross margin compared with previous years, but its complex logistics cycle meant it achieved a very low net margin of only 0.9%.
Table 54 Financial Performance 2001-2003
RMB/%
Unit 2001 2002 2003
Net profit RMB million 92.4 87.5 98
Profit per sq m RMB 328.2 296.4 321.3
Gross margin % 9.6 7.8 10.3
EBITDA margin % 3.3 3.9 1.4
Net margin % 1.3 0.9 0.9
Return on total assets % 1.8 1.3 1.7
Source: 1999-2002 Euromonitor from Official statistics, Trade associations, Company annual report,
Company research, Trade press, Trade interviews, 2003 Euromonitor estimates based on company
annual reports
Note: 2003 year end data is preliminary
Company prospects
In the face of strong competition from domestic and foreign retailers, Shanghai No.1 always tries to find ways to exit in the future when retailing in China is opened to foreign retailers, without any protection.
On management experience, Shanghai No.1 cannot compete with large retailers such as Wal-Mart or Carrefour, but it does have the advantage of strong knowledge of local consumers' expenditure habits.
After joining the Shanghai Bailian Group, which began its business in September 2003, Shanghai No.1 will retain its name and hopes to compete with foreign retailers after the restructuring.
8.5 Beijing Wangfujing Department Store Co Ltd
(Group)
Company factfile
Beijing Wangfujing Department Store Co Ltd (Group), a comprehensive public company mainly engaged in retailing through department stores, was listed on the Shanghai Securities Exchange (SSE) in May, 1994, and selected as a sample of SSE 30 indexes. It joined the Beijing Holding Company Ltd in May 1997 and became listed in Hong Kong. On September 19, 2000, Beijing Wangfujing Department Store Co Ltd (Group) merged with the Dong An Group, resulting in one of the largest retail department store groups.
Beijing Wangfujing Department Store Co Ltd (Group), hereafter called Wangfujing Department Store, owns 16 sole and holding enterprises and operates eight large department stores including Beijing Department Store, Beijing Dong An Plaza, Beijing Chang An Market, Beijing Shuangan Mall, Beijing Haiwen Wangfujing Department Store, Guangzhou Wangfujing Department Store, Wuhan Wangfujing Department Store and Chengdu Wangfujing Department Store. In addition, Wangfujing Mansion is under construction, and will be open in 2003. Moreover, Beijing Hongye Real Estate Company and Shenzhen Wangfujing Import & Export Trade Company, two sole-venture subsidiaries under the group, are important forces in helping the group to perform its multi-faceted development strategy. Wangfujing Department Store has developed into a share-holding group mainly engaged in
department store retailing but it is also involved in real estate, import and export trade, advertising, grocery and beverages, and service.
Wangfujing Department Store felt the pressure and competition of retailing especially after China's entry into the WTO, which is why it wants to develop other businesses and enhance its competitive position while waiting for fiercer competition over the next five years.
Summary 10 Company Factfile 2003
Ownership: Beijing Wangfujing Department Store Co Ltd
Country of origin: Beijing
Retail sectors of activity: Department
Principal fascia: Wangfujing
Source: Euromonitor from company annual reports
Market position
The company tends to serve national middle-class customers with all kinds of cheap but quality goods. All new stores keep the same features, while simultaneously making efforts to meet local requirements as soon as possible and showing unique local products.
The company aims to construct a first-grade Beijing-based chain-sale network throughout the golden locations in the central cities in southern, south-western, middle and eastern China, then expanding second-grade networks around the cities.
As the major business of Wangfujing Department Store, department stores showed good performance in the review period, and increased its value share from 0.94% in 2002 to 1.07% in 2003.
Table 55 Company Shares 2002-2003
% value
2002 2003
Department store 0.94 1.07
Source: 1999-2002 Euromonitor from Official statistics, Trade associations, Company annual report,
Company research, Trade press, Trade interviews, 2003 Euromonitor estimates based on company
annual reports
Note: 2003 year end data is preliminary
Sales performance
Wangfujing Department Store is one of the most famous retailers in China, with comprehensive strength. At the end of 2003, the company achieved total sales of RMB5.4 billion, which meant growth of total retail sales was 28% in one year. The main reason for this high growth was the opening of six new department stores in 2003.
Table 56 Sales Performance 2001-2003
RMB/outlets/sq metres
Unit 2001 2002 2003
Total sales RMB million 3,105 4,222.8 5,405
Average weekly sales RMB million 59.7 81.2 103.9
Sales per outlet RMB million 345 301.6 103.9
Sales per sq m RMB 21,413.8 25,225.8 27,025
Number of outlets 9 14 20
Total assets RMB million 2,999.4 3,049.5 3,257
Total sales area Sq m 145,000 167,400 200,000
Source: 1999-2002 Euromonitor from Official statistics, Trade associations, Company annual report,
Company research, Trade press, Trade interviews, 2003 Euromonitor estimates based on company
annual reports
Note: 2003 year end data is preliminary
Financial performance
Over 2001-2002, the net margin of the company fell from 2.26% to 1.38%, and in 2002 the profit of the company decreased to RMB58.3 million, what meant profit decreased 17% from the previous year. The main reason for the decrease in profit was the failure of the company's marketing strategy in 2002. However, profit picked up in 2003, increasing 15% to RMB67.1 million.
Table 57 Financial Performance 2001-2003
RMB/%
Unit 2001 2002 2003
Net profit RMB million 70.2 58.3 67.1
Profit per sq m RMB 484.1 348.3 335.5
Gross margin % 18 15 13
EBITDA margin % 1.72 1.62 1.08
Net margin % 2.26 1.38 1.24
Return on total assets % 2.34 1.91 2.06
Source: 1999-2002 Euromonitor from Official statistics, Trade associations, Company annual report,
Company research, Trade press, Trade interviews, 2003 Euromonitor estimates based on company
annual reports
Note: 2003 year end data is preliminary
Company prospects
Wangfujing Department Store is based in northern China, mainly covering the Beijing, Tianjin, and Hebei provinces. The biggest Chinese retailer, Shanghai Lianhua, is not in direct competition owing to different areas of business.
In 2004, Wangfujing Department Store will also try to expand its business in the northern area and within its business range, based on local culture.
8.6 Shanghai Nong-gong-shang Supermarket Co Ltd
Company factfile
Shanghai Nong-gong-shang Supermarket Co Ltd was established in April 1994. After ten years in operation, it holds total assets of over RMB2 billion. The company was ranked 12th in the Top 100 Shanghai corporations 2002.
The core business of the company is in hypermarkets and convenience stores. The company has its own brands namely, Nong-gong-shang Supermarket, Alldays convenience stores, 5 RMB discount stores, p costume, Jiu-jiu Specialty stores, and Zhende food.
By the end of 2003, the company had more than 1,000 outlets, covering more than six provinces in China. The main products of the company are in agriculture and food.
Summary 11 Company Factfile 2003
Ownership: Shanghai Nong-gong-shang Supermarket Co Ltd
Country of origin: Shanghai
Retail sectors of activity: Supermarket
Principal fascia: Nong gong shang (Supermarket, Hypermarket); Alldays (Convenience Stores) 5 RMB(discount store) p (costume)
Source: Euromonitor from company annual reports
Market position
Shanghai Nong-gong-shang Supermarket was established in 1994. It started with 48 staff and a bank loan of just RMB2 million. After ten years in operation, it become a company with more than 20,000 staff, more than RMB10 billion in total sales and total assets of over RMB2 billion. At the end of 2003, it achieved profit of RMB128.5 million.
The company separates its business into three main brands, namely, Nong-gong-shang Supermarket/Hypermarket, Alldays convenience stores and 5 RMB discount stores.
Its main competitors are Shanghai Lianhua and Shanghai Hualian, as well as foreign grocery retailers such as Carrefour, Lotus Supercenter, Trust-mart and Metro.
Owing to its management and logistics, Nong-gong-shang Supermarket achieved good results in 2003 even under the threat of SARS, with its amount of total sales exceeding RMB10 billion, increasing 20% over 2002.
The strength of the company lies in its agriculture base as the company has lower costs than other retailers. Furthermore, Shanghai Nong-gong-shang Supermarket also has policy support from the government.
Nong-gong-shang Supermarket put a lot of effort into developing its hypermarkets, which go under the operation name of Nong-gong-shang Supermarket. Its share in hypermarkets in 2002 was 1.58%, but it reduced slightly in 2003 to 1.56%.
Convenience stores are another focus of the company, The market share of convenience stores almost doubled in 2003 and total retail sales through its convenience stores was around RMB1 billion.
Supermarkets form the basic and major business of the company, although the company's business started later than that of other competitors such as Shanghai Lianhua Supermarket and Shanghai Hualian Supermarket. In 2003, the market share of its supermarkets was 0.53%, slightly increasing from 2002.
Table 58 Company Shares 2002-2003
% value
2002 2003
Hypermarket 1.58 1.56
Convenience stores 0.57 1.02
Supermarket 0.51 0.53
Source: 1999-2002 Euromonitor from Official statistics, Trade associations, Company annual report,
Company research, Trade press, Trade interviews, 2003 Euromonitor estimates based on company
annual reports
Note: 2003 year end data is preliminary
Sales performance
Shanghai Nong-gong-shang Supermarket's total sales reached RMB6.1 billion, in 2001, with the company ranking third in supermarkets. The company was further developed in 2002 and 2003, realising total sales of RMB8.4 billion and an increase by 37% and RMB10.1 billion and an increase by 20% respectively.
Total sales growth was lower in 2003 than in 2002, owing to the SARS outbreak. However, growth of 20% was still very high compared to others retailers. In 2003, most other retailers either witnessed a reduction in sales or sales remained level with 2002.
The number of outlets grew very rapidly, by 180% from 2001 to 2003. Total assets also saw growth of 64% between 2001 and 2003. The main reason for this was management strategies.
Sales mainly come from hypermarkets, however, convenience stores, with the advantage of rapid growth and low costs, look set to become the growth engine of the company in 2004.
Table 59 Sales Performance 2001-2003
RMB/outlets/sq metres
Unit 2001 2002 2003
Total sales RMB million 6,117.7 8,400 10,100
Average weekly sales RMB million 117.6 161.5 194.2
Sales per outlet RMB million 16.3 12.8 9.6
Sales per sq m RMB 9,063.3 10,980.4 9,619
Number of outlets 375 655 1,050
Total assets RMB million 1,250 1,635 2,050
Total sales area Sq m 675,000 765,000 1,050,000
Source: 1999-2002 Euromonitor from Official statistics, Trade associations, Company annual report,
Company research, Trade press, Trade interviews, 2003 Euromonitor estimates based on company
annual reports
Note: 2003 year end data is preliminary
Financial performance
Shanghai Nong-gong-shang Supermarket, similarly to others retailers, saw a low margin in 2003 of 1.3%. However, with the development of the company's total sales and expansion into others cities and provinces, the company witnessed strong growth in profit.
The main reason behind the strong growth in profit was the growth of outlets outside of Shanghai. Owing to low labour costs and low housing rents, the company achieved much higher profit from its outlets outside of Shanghai compared with the outlets in the Shanghai area. Total profits grew 60% between 2001 and 2003.
Another important reason for the growth in profit is that when the company opens new outlets outside of Shanghai, it tries to find local suppliers in order to reduce the cost of logistics.
Table 60 Financial Performance 2001-2003
RMB/%
Unit 2001 2002 2003
Net profit RMB million 80.5 95.6 128.5
Profit per sq m RMB 119.3 125.0 122.4
Gross margin % 11.1 12.5 10.5
EBITDA margin % 5.6 3.5 4.2
Net margin % 1.3 1.1 1.3
Return on total assets % 6.4 5.9 6.3
Source: 1999-2002 Euromonitor from Official statistics, Trade associations, Company annual report,
Company research, Trade press, Trade interviews, 2003 Euromonitor estimates based on company
annual reports
Note: 2003 year end data is preliminary
Company prospects
With total assets of over RMB2 billion, Shanghai Nong-gong-shang Supermarket aims to be listed on the Shanghai Stock Exchange in 2004 or 2005, which will make it a stronger competitor against both domestic and foreign retailers.
The company is still going to develop its business base of agricultural products and it plans to join department stores in 2004, which it will base in community areas.
8.7 Shanghai Yuyuan Tourist Mart Co Ltd
Company factfile
Shanghai Yuyuan Tourist Mart Co Ltd has more than 20 subsidiary companies. The company was established in 1992. It was formerly known as Lao Cheng Huang Miao Market, which had more than 100 years of history. It focuses on traditional Chinese culture and its business mainly covers gold jewellery, artwork, grocery, foodstuff, entertainment, Chinese and western medicine, estate, imports and exports and production.
Shanghai Yuyuan Tourist Mart also possesses many old principal fascias, which are famous in China and all over the world.
Summary 12 Company Factfile 2003
Ownership: Shanghai Yuyuan Tourist Mart Co Ltd
Country of origin: Shanghai
Retail sectors of activity: Commercial retailing
Principal fascia: Laomiao Gold, Yuyuan Tourist Mart, Tong Han Chun Tang ( Drugstore), Qiao Jia Shan (Foodstuff)
Source: Euromonitor from company annual reports
Market position
The company's core business is in the travel industry under which it is linked to gold jewellery, department stores, grocery, foodstuff, imports and exports, pharmaceuticals, artwork and estate.
Gold jewellery is the most important business for the company. In 2003, the value share of gold jewellery was 1.15%, a slight increase compared with 2002.
Department stores are not the major focus of the company, but its department store still accounted for a value share of 0.07% in 2003.
The strength of the company is its famous brand based on traditional local culture, which attracts many tourists every year.
The company's weakness is the old structure of the building. It is too old to be restructured and the
narrow, small shopping environment makes consumers less enthusiastic about shopping.
Table 61 Company Shares 2002-2003
% value
2002 2003
Golden jewellery 1.07 1.15
Department 0.08 0.07
Source: 1999-2002 from company annual reports
Note: 2003 year end data is preliminary
Sales performance
The company's total assets were reduced by RMB519.7 million, 14.5%, in 2002, due to the loss of three companies and the repayment of bank loans. In 2003, the company added 12 outlets, but also lost 4 outlets, bringing the final number that year to eight additional outlets. The total assets were also reduced in 2002 due to restructuring which caused the loss of three outlets. Another important reason why the total assets fell was the increase in taxation, in 2002, from 15% to 33%.
In 2003, the company's total sales fell slightly, by 1.3%, after rising 30% in 2002. There were two main reasons for the decline in retail sales in 2003. One was company restructuring; the other was the SARS outbreak, which impacted the travel industry strongly.
Table 62 Sales Performance 2001-2003
RMB/outlets/sq metres
Unit 2001 2002 2003
Total sales RMB million 4,987.2 6,483.4 6,400
Average weekly sales RMB million 95.9 124.7 123.1
Sales per outlet RMB million 71.2 97.8 85.3
Sales per sq m RMB 10,477.3 14,442.9 12,457.4
Number of outlets 70 67 75
Total assets RMB million 3,585.7 3,066 3,569.3
Total sales area Sq m 476,000 448,900 513,750
Source: 1999-2002 Euromonitor from Official statistics, Trade associations, Company annual report,
Company research, Trade press, Trade interviews, 2003 Euromonitor estimates based on company
annual reports
Note: 2003 year end data is preliminary
Financial performance
Although the company's total assets saw a reduction in 2002, profit was a little bit higher than in 2001. However, due to the SARS epidemic, profit fell 35% in 2003, to RMB80.5 million. Parts of the company's core business, such as travel and grocery, saw almost no sales during the SARS period from April to July 2003. As a result, profit per square metre also saw a reduction.
The net margin in 2002 was 1.9%, falling from 2.5% in 2001. The main reason for the reduction was that the government increased taxation from 15% to 33%.
Compared to other retailers, the company's margins are much higher. It was only in 2003, due to SARS, that the company's core business suffered, thus leading to a reduction in the net margin of total sales.
Table 63 Financial Performance 2001-2003
RMB/%
Unit 2001 2002 2003
Net profit RMB million 123.46 124 80.54
Profit per sq m RMB 259.4 276.2 156.8
Gross margin % 22.0 15.0 11.5
EBITDA margin % 1.625 1.901 1.225
Net margin % 2.48 1.91 1.26
Return on total assets % 3.44 3.08 2.26
Source: 1999-2002 Euromonitor from Official statistics, Trade associations, Company annual report,
Company research, Trade press, Trade interviews, 2003 Euromonitor estimates based on company
annual reports
Note: 2003 year end data is preliminary
Company prospects
The company has various development plans for the 2004-2008 period. It plans to keep on pushing the adjustment of its structure and enhance the company's core competitive ability. It will focus on gold jewellery aiming to grow such business and make it stronger as well as steadily expand estate space. It will also increase and enhance grocery, develop its import and export business and try to find new sources of business.
It also plans to continue deepening the bond between internal and external sources to obtain the highest profit. The company will push development by inviting public bidding for large projects, as well as combine fascia and take over good quality capital sources. It also wants to develop commerce based on traditional travel culture.
8.8 Dashang Group Co Ltd
Company factfile
Dashang Group Co Ltd is one of the biggest commercial groups in China and it was the first company in Dalian city to be listed on the Shanghai Stock Exchange.
The company has a staff force of more than 20,000 and 42 outlets. The core business of the company is department stores, which cover 17 cities in northern China. At the end of 2003, total sales reached RMB13.6 billion, which kept the company in the leading position in northern China for the eighth time.
In 2001, the company began to build supermarkets in north-east China and northern China, which developed rapidly. The company also has some other business in hotels and estate.
Summary 13 Company Factfile 2003
Ownership: Dashang Group Co Ltd
Country of origin: Dalian city, Liaoning province
Retail sectors of activity: Department stores, supermarket,
Principal fascia: Xin-Mart, Dashang
Source: Euromonitor from company annual reports
Market position
The company is located in Dalian city in Liaoning province. It expanded its business to cover all of north-east China, which put it in the No.1 position for eight years.
In North China, the company has almost no real competitors, although there are some multinational retailers such as Carrefour. Dashang Group still controls the main cities' department stores, and it plans to develop supermarkets/hypermarkets to resist competition from foreign competitors or other domestic competitors.
The strength of the company lies in its 60-year history. In the North the company has a very good and loyal customer base. It is very easy for the company to develop new products and new ideas based on traditional local culture and attract consumers.
The company's main weakness is its lack of modern management experience. The structure of its department stores is behind in fashion. When the large department store players, such as Shanghai Baisheng Department Store and Shanghai Pacific Department Store, enter the North, offering a fashionable and modern shopping environment and style, this is certain to attract a large group of younger generation consumers.
At the end of 2003, retail sales from Dashang Department store held a 2.40% share, which meant 20% growth compared with the share in 2002. The main reason for the rapid growth was the aggressive policy of Dashang Group. According to the president of the company, the main operation policy was to merge, as much as possible, high performing local department stores, in order to expand its business into one area, more easily and quickly.
As for hypermarkets, its share also increased rapidly in 2003, due to the aggressive policy of Dashang Group.
Table 64 Company Shares 2002-2003
% value
2002 2003
Department store 2.01 2.40
Hypermarket 0.47 0.59
Source: 1999-2002 Euromonitor from Official statistics, Trade associations, Company annual report,
Company research, Trade press, Trade interviews, 2003 Euromonitor estimates based on company
annual reports
Note: 2003 year end data is preliminary
Sales performance
In 2003, Dashang Group achieved total sales of RMB13.6 million, which meant an increase of 36% compared with 2002. The main reason for this success, even under the threat of SARS, was expansion.
In 2003, the company added 12 outlets. Five of the new outlets are department stores, which cost nearly RMB500 million, two of the new outlets are new hotels in northern China and the other five new outlets are through mergers and acquisitions.
The development plan of the group is to build a north-eastern store network. By the end of 2003, half of the plan was almost complete.
Table 65 Sales Performance 2001-2003
RMB/outlets/sq metres
Unit 2001 2002 2003
Total sales RMB million 7,500 10,000 13,600
Average weekly sales RMB million 144.2 192.3 261.5
Sales per outlet RMB million 340.9 333.3 323.8
Sales per sq m RMB 18,270.4 19,230.8 20,000
Number of outlets 22 30 42
Total assets RMB million 2,494.2 3,943.4 4,226.1
Total sales area Sq m 410,500 520,000 680,000
Source: 1999-2002 Euromonitor from Official statistics, Trade associations, Company annual report,
Company research, Trade press, Trade interviews, 2003 Euromonitor estimates based on company
annual reports
Note: 2003 year end data is preliminary
Financial performance
With the successful growth in total sales of 2003, the company also achieved a profit of RMB194.7 million, which showed an increase of 38.5% compared with 2002. However, the net margin of the company was still very low at 1.4%, mainly due to complex logistics and too many staff members.
Because the company is an old company with more than 60 years of history, and owing to the government policy in northern China, it has to pay many salaries and allowances to retired staff every year, which makes the net margin very low.
Table 66 Financial Performance 2001-2003
RMB/%
Unit 2001 2002 2003
Net profit RMB million 112 140.5 194.7
Profit per sq m RMB 272.8 270.2 286.3
Gross margin % 10.5 9.6 11.5
EBITDA margin % 3.1 2.6 5.3
Net margin % 1.5 1.4 1.4
Return on total assets % 3.6 2.1 4.6
Source: 1999-2002 Euromonitor from Official statistics, Trade associations, Company annual report,
Company research, Trade press, Trade interviews, 2003 Euromonitor estimates based on company
annual reports
Note: 2003 year end data is preliminary
Company prospects
By the end of 2005, the development targets of the company are to have more than 1 million square metres of sales area, to open 100 stores in 40 cities, to realise annual total sales of RMB20 billion, with RMB1 billion taxation, to complete its north-east store network and its northern store network and to expand its brand all over China.
8.9 Wal-Mart China Co Ltd
Company fictile
In 1996, under authorisation from the China State Department, Wal-Mart established the first Wal-Mart Hypermarket and Sams Club in Asia, located in Shenzhen city, Guangdong province, China.
At the end of 2003, Wal-Mart opened 31 outlets including hypermarkets, clubs and community stores in China. However, because of government policy, Wal-Mart can not open any outlets in Shanghai. By the end of 2003, Wal-Mart had more than 10,000 staff in China.
With years of retailing experience and advanced management technology, Wal-Mart found many local wholesalers. 95% of Wal-Mart China's products are made in China.
Through global purchasing, Wal-Mart also exports Chinese products overseas every year. In 2002, Wal-Mart purchased more than USD12 billion in goods through direct or indirect means. These goods will be sold in Wal-Mart outlets all over the world.
Summary 14 Company Factfile 2003
Ownership: Wal-Mart
Country of origin: U.S.A
Retail sectors of activity: Hypermarket, Sams Club, Community store
Principal fascia: Wal-mart, Sams Club,Walmart community stores
Source: Euromonitor from company annual reports
Market position
Wal-Mart entered China very early in 1996. After seven years of operation in China, Wal-Mart opened 31 outlets mainly in Guangdong Province. However, Wal-Mart still does not have any outlets in the biggest city, Shanghai, which has stronger purchasing strength. The reason for this is government policy.
At the beginning of July 2003, Wal-Mart opened its first outlet in Beijing, a community store with 16,500 square metres of sales area over two floors and 1,300 packing places.
In 2002, Wal-Mart Global realised total sales of USD245 billion placing it at Number One position in Fortune 500. Sales in China accounted for around USD1 billion, but Wal-Mart would like more.
Wal-Mart is behind its competitor, Carrefour, in China. The biggest weakness is the separation of its outlets and its logistics. Wal-Mart traditionally places outlets outside of the city centre, as the benefit of a countryside location is the low cost of ground rent and labour. Its main target consumer group is the middle- and high-income earners who usually have private cars. However, in China, road construction and private car ownership are much lower than in other developed countries. The main battlefield of retailing in China is still the city centre. Regarding outlet location, Carrefour did much better than Wal-Mart in China.
Another important reason why Wal-Mart is behind Carrefour is its clearance centre. In 1995, Wal-Mart, after trying to co-operate with the authorities in Shanghai, insisted on putting its clearance centre in Shenzhen city instead of Shanghai city, which meant that the Shanghai authorities lost taxation. This put Wal-Mart in a disadvantageous position in Shanghai, when a new policy was issued by the Shanghai authorities stating that the hypermarket could not set up in the centre of city.
Another weakness of Wal-Mart's is its distribution centre. Highly effective logistics centres are one of the most important reasons behind Wal-Mart's success in the world. Building many stores around one logistics centre means the logistics centre can exert its power to assure price advantages. However, this kind of modern distribution centre requires capital of around USD80 million, to support about 120 stores in a 300-mile catchment area. At the end of 2003, Wal-Mart had opened only 31 outlets. Furthermore, China is very big and Wal-Mart had only one distribution centre in Shenzhen city, which could only be used to half effect. The result of this situation is that Wal-Mart could not reduce the costs, which affect the final product price.
The strength of Wal-Mart in China is its good relationship with the Government of China. In 2002, the export goods purchased by Wal-Mart exceeded USD12 billion, more than that of any other foreign enterprise in China. This large amount made many local governments hospitable to Wal-Mart.
Another strength of Wal-Mart is that it has maintained a good business image. For suppliers, Wal-Mart never charges an entry fee, instead it teaches suppliers how to reduce their labour costs, how to improve product quality, and even shares Wal-Mart's information system. Wal-Mart does not want short-term profit, but rather long-term and durable value. Wal-Mart has not transferred the pressure to suppliers.
Its hypermarkets held a 5.25% value share in 2003. The development of its hypermarkets was rapid. After China's entry into the WTO, Wal-Mart wanted rapid occupation in order to be more competitive as the battle becomes tougher over the next five years. Hypermarkets form the core business of Wal-Mart with an internal share of 98% in 2003.
As for community stores, these are a new business type in Chinese retailing. At the end of 2003, few retailers had community stores. Amongst the domestic retailers, only Shanghai Nong-gong-shang Supermarket Co Ltd and Jiangsu Suguo Supermarket had community stores.
Table 67 Company Shares 2002-2003
% value
2002 2003
Hypermarket 4.22 5.25
Community stores 20 24
Source: 1999-2002 Euromonitor from Official statistics, Trade associations, Company annual report,
Company research, Trade press, Trade interviews, 2003 Euromonitor estimates based on company
annual reports
Note: 2003 year end data is preliminary
Sales performance
Wal-Mart grew very rapidly between 2001 and 2003. Over three years, the company increased the number of its outlets by 63%, to 31 in 15 cities in China and more than doubled total sales. The core business of the company is hypermarkets, which accounted for more than 90% of total sales.
The company's hypermarkets were mainly located in southern China. By the end of 2003, the company had opened 29 hypermarkets. The average sales area of each hypermarket was between 15,000-20,000 square metres. The remaining two stores are Wal-Mart community stores.
Table 68 Sales Performance 2001-2003
RMB/outlets/sq metres
Unit 2001 2002 2003
Total sales RMB million 4,558 9,960 14,939.2
Average weekly sales RMB million 87.7 191.5 287.3
Sales per outlet RMB million 239.9 369.2 481.9
Sales per sq m RMB 19,991.2 27,666.7 29,206.6
Number of outlets 19 26 31
Total assets RMB million n/a n/a n/a
Total sales area Sq m 228,000 360,000 511,500
Source: 1999-2002 Euromonitor from Official statistics, Trade associations, Company annual report,
Company research, Trade press, Trade interviews, 2003 Euromonitor estimates based on company
annual reports
Note: 2003 year end data is preliminary
Financial performance
In 2003, after seven years of operating in China, Wal-Mart began to make profit. The speed of Wal-Mart's expansion was very fast.
Company prospects
Wal-Mart received authorisation to open outlets in Shanghai in 2004. Wal-Mart plans to open three hypermarkets in Shanghai with a total investment of USD18 million. In other cities in China, Wal-Mart plans to open seven more outlets in 2004, to reach 41 outlets by the end of 2004.
Asia, especially China, will become the growth engine of Wal-Mart over the next five years, as there is still huge potential to be developed in China.
The company will increase its number of hypermarkets to 50 in 2005. In the meantime, Wal-Mart will join the competition amongst convenience stores, which has grown rapidly. The middle class in China is estimated to reach 160 million by the end of 2010, so the Sam-Club should have a very bright future.
Globally, Wal-Mart uses a strong information management system to keep ahead of others competitors. Through this system, Wal-Mart can control the manufacturers and suppliers together. But in China, this system is useless, as limitations due to government policy mean that Wal-Mart can not use it.
If Wal-Mart wants to reach the same heights in China as it has done in the USA, it has to wait patiently for more openness regarding retailing in China, import and export rights and logistics.