14
Rethinking capital structure today? A fireside Q&A for senior decision-makers MARCH 2017

Rethinking capital structure today? A fireside Q&A for senior decision-makers
MARCH 2017

Published by Corporate Finance Advisory
For questions or further information, please contact:
Corporate Finance Advisory
Marc Zenner [email protected] (212) 834-4330
Evan Junek [email protected] (212) 834-5110
Ram Chivukula [email protected] (212) 622-5682

RETHINKING CAPITAL STRUCTURE TODAY? | 1
Why do we talk about capital structure today?Boards of directors and management teams continuously evaluate whether they have the right capital structure. The typical conclusion is often the status quo, potentially with a little fine-tuning. Occasionally, however, decision-makers across an entire sector, or even the entire market, face structural shifts that warrant a more thorough re-examination. For instance, the financial sector during the great financial crisis and the oil & gas and mining sectors during the recent commodity price downturn focused on equitizing their balance sheets following significant downside pressures.
Today, a potential structural reform of the U.S. corporate tax code is leading firms across all industries to re-evaluate their capital structures. Several key tax laws could change, and potentially impact capital structure:
• A lower tax rate (e.g., from 35% to 20%) would reduce the tax shield on debt — But higher after-tax cash flows would increase the ability to pay down debt
• A loss of interest deductibility would entirely eliminate the debt tax shield
• A one-time or ongoing lower tax rate on offshore earnings would provide access to global cash flow — Reduce the need to raise debt domestically to offset cash balances that cannot efficiently be repatriated, but — Increase debt capacity because firms would have greater access to worldwide cash flows, and — Increase net leverage in the near-term if firms do not use most of the repatriated cash to pay down debt
2 | Corporate Finance Advisory
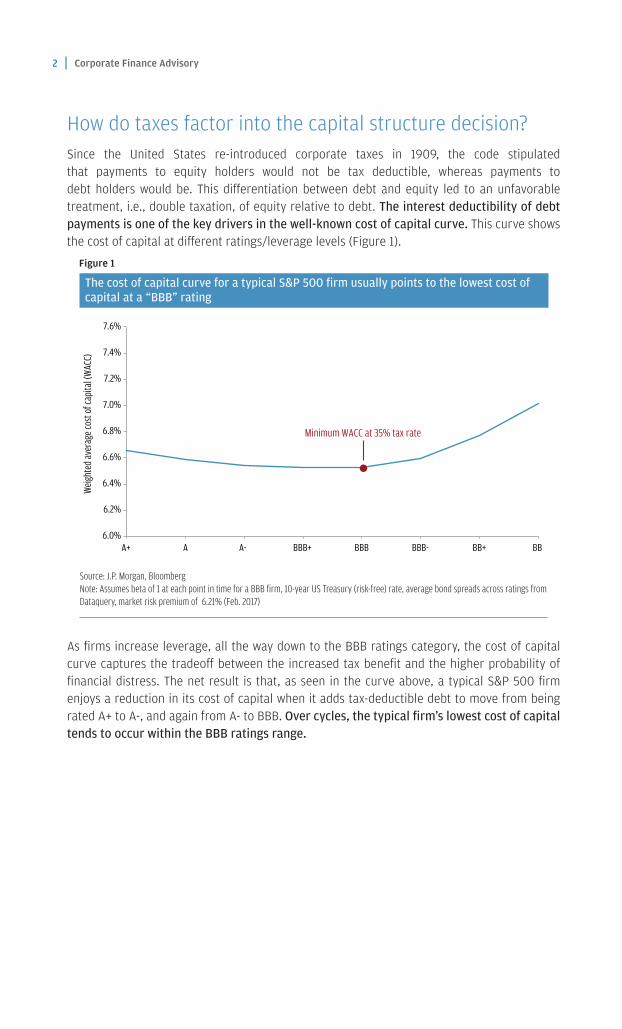
How do taxes factor into the capital structure decision?Since the United States re-introduced corporate taxes in 1909, the code stipulated that payments to equity holders would not be tax deductible, whereas payments to debt holders would be. This differentiation between debt and equity led to an unfavorable treatment, i.e., double taxation, of equity relative to debt. The interest deductibility of debt payments is one of the key drivers in the well-known cost of capital curve. This curve shows the cost of capital at different ratings/leverage levels (Figure 1).
Figure 1
The cost of capital curve for a typical S&P 500 firm usually points to the lowest cost of capital at a “BBB” rating
As firms increase leverage, all the way down to the BBB ratings category, the cost of capital curve captures the tradeoff between the increased tax benefit and the higher probability of financial distress. The net result is that, as seen in the curve above, a typical S&P 500 firm enjoys a reduction in its cost of capital when it adds tax-deductible debt to move from being rated A+ to A-, and again from A- to BBB. Over cycles, the typical firm’s lowest cost of capital tends to occur within the BBB ratings range.
6.0%
6.2%
6.4%
6.6%
6.8%
7.0%
7.2%
7.4%
7.6%
A+ A A- BBB+ BBB BBB- BB+ BB
Weig
hted
aver
age c
ost o
f cap
ital (
WAC
C)
Minimum WACC at 35% tax rate
Source: J.P. Morgan, BloombergNote: Assumes beta of 1 at each point in time for a BBB firm, 10-year US Treasury (risk-free) rate, average bond spreads across ratings from Dataquery, market risk premium of 6.21% (Feb. 2017)

RETHINKING CAPITAL STRUCTURE TODAY? | 3
1 A seminal academic article in this field is: Graham, John R. (2000), “How Big Are the Tax Benefits of Debt?”, Journal of Finance 55, 1901-1941
2 For further reading, please see our report “Here We Go Again… Financial Policies in Volatile Environments” located at https://www.jpmorgan.com/directdoc/JPMorgan_CorporateFinanceAdvisory_FinancialPoliciesInVolatileEnvironments.pdf
Payments on debt are lower than payments on equity, and are also tax deductible. Then why is the lowest cost of capital not occurring at much higher leverage levels, i.e., at a rating lower than BBB?Figure 1 shows the cost of capital declines moderately until the BBB ratings level, beyond which it begins to rise more rapidly. As firms increase leverage, both their cost of debt and cost of equity increase. The cost of debt increases particularly quickly once a firm’s rating is non-investment grade (that is, below BBB-). Also note that firms tend not to benefit from the full tax shield as their leverage continues to increase (because they often incur other losses that generate tax shields, as well).1 Similarly, the cost of equity increases as a firm’s leverage increases. The higher cost of equity reflects the notion that equity investors will require higher returns to compensate them for the increased risks of investing in a more levered company.
The experience of the oil & gas sector in recent years showcases the riskiness of higher leverage for equity holders. Commodity prices began a precipitous decline following their peak in the summer of 2014. As oil prices fell, many firms in the oil & gas industry experienced steep drops in revenue, EBITDA, and enterprise values. As a result, the equity values plummeted across the board, with lower-rated firms the most impacted (Figure 2).2
Figure 2
Firms with higher leverage are much more vulnerable during downturns
(18%)
(28%)
(40%)
(61%)
(100%)
(80%)
(60%)
(40%)
(20%)
0%
20%
Jun 2014 Nov 2014 Apr 2015 Sep 2015 Jan 2016 Jun 2016 Sep 2016 Oct 2016 Dec 2016
WTI Crude Oil A- BBB+ to BBB- BB+ to BB- B+
Tota
l ret
urns
Source: J.P. Morgan, Bloomberg, FactSet, S&P as of 12/30/16Note: Includes all firms in the GICS Energy Sector with a market capitalization of over $100mm

4 | Corporate Finance Advisory
BBB seems to be the rating at which the cost of capital is minimized. Why aren’t all large firms rated BBB?Indeed, the cost of capital is often lowest for capital structures associated with a BBB ratings level. The cost of capital curve is a useful concept to think about capital structure, but is just one of many inputs to the capital structure decision-making toolbox. An oft-cited survey exemplifies the range of factors CFOs consider when making capital structure decisions (Figure 3).
Figure 3
Financial flexibility/credit rating is top of mind for CFOs when issuing debt
Financial flexibility and credit ratings are the two top considerations of CFOs making capital structure decisions. Interest tax savings (tax shields) are a consideration, but only rank sixth in importance. Interestingly, companies often target specific credit ratings because they provide more secure access to the debt markets, and hence more financial flexibility. In other words, better credit ratings and improved financial flexibility capture similar concepts.
59%
57%
48%
46%
47%
45%
34%
31%
23%
21%
19%
Financial flexibility
Credit rating
Earnings and cash flow volatility
Level of interest rates
Insu cient internal funds
Interest tax savings
Transaction costs and fees
Equity undervaluation/overvaluation
Comparable firm debt levels
Bankruptcy/distress costs
Customer/supplier comfort
Percent of CFOs identifying factor as “important” or “very important” in their decision to issue debt
Source: J.P. Morgan, cfosurvey.org
RETHINKING CAPITAL STRUCTURE TODAY? | 5
3 For further reading, please see our report “The Great Migration: Evolving Market Conditions Transform the Credit Rating Landscape” located at https://www.jpmorgan.com/directdoc/JPMorgan_CorporateFinanceAdvisory_GreatMigration.pdf
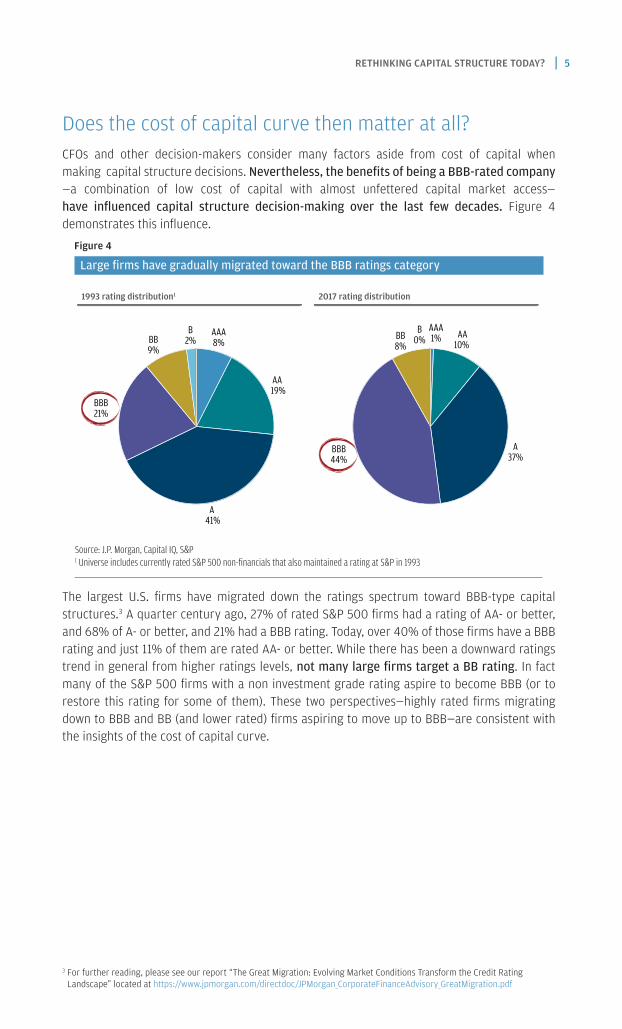
Does the cost of capital curve then matter at all?CFOs and other decision-makers consider many factors aside from cost of capital when making capital structure decisions. Nevertheless, the benefits of being a BBB-rated company —a combination of low cost of capital with almost unfettered capital market access—have influenced capital structure decision-making over the last few decades. Figure 4 demonstrates this influence.
Figure 4
Large firms have gradually migrated toward the BBB ratings category
The largest U.S. firms have migrated down the ratings spectrum toward BBB-type capital structures.3 A quarter century ago, 27% of rated S&P 500 firms had a rating of AA- or better, and 68% of A- or better, and 21% had a BBB rating. Today, over 40% of those firms have a BBB rating and just 11% of them are rated AA- or better. While there has been a downward ratings trend in general from higher ratings levels, not many large firms target a BB rating. In fact many of the S&P 500 firms with a non investment grade rating aspire to become BBB (or to restore this rating for some of them). These two perspectives—highly rated firms migrating down to BBB and BB (and lower rated) firms aspiring to move up to BBB—are consistent with the insights of the cost of capital curve.
1993 rating distribution1 2017 rating distribution
AAA8%
AA 19%
A 41%
BBB21%
BB9%
B2%
AAA1% AA
10%
A37%
BBB44%
BB8%
B0%
Source: J.P. Morgan, Capital IQ, S&P1 Universe includes currently rated S&P 500 non-financials that also maintained a rating at S&P in 1993
6 | Corporate Finance Advisory
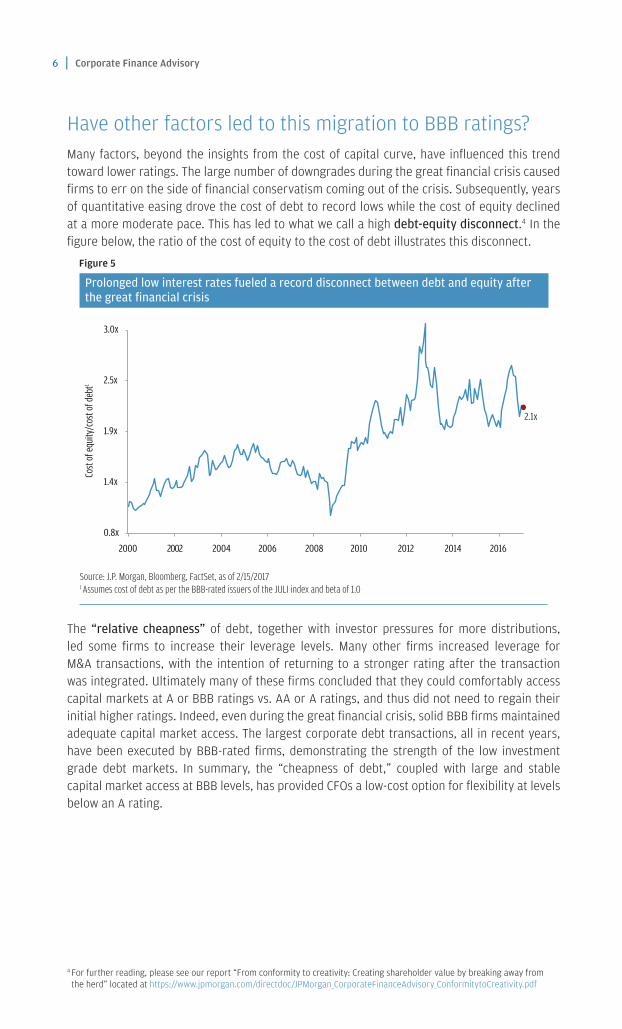
Have other factors led to this migration to BBB ratings?Many factors, beyond the insights from the cost of capital curve, have influenced this trend toward lower ratings. The large number of downgrades during the great financial crisis caused firms to err on the side of financial conservatism coming out of the crisis. Subsequently, years of quantitative easing drove the cost of debt to record lows while the cost of equity declined at a more moderate pace. This has led to what we call a high debt-equity disconnect.4 In the figure below, the ratio of the cost of equity to the cost of debt illustrates this disconnect.
Figure 5
Prolonged low interest rates fueled a record disconnect between debt and equity after the great financial crisis
The “relative cheapness” of debt, together with investor pressures for more distributions, led some firms to increase their leverage levels. Many other firms increased leverage for M&A transactions, with the intention of returning to a stronger rating after the transaction was integrated. Ultimately many of these firms concluded that they could comfortably access capital markets at A or BBB ratings vs. AA or A ratings, and thus did not need to regain their initial higher ratings. Indeed, even during the great financial crisis, solid BBB firms maintained adequate capital market access. The largest corporate debt transactions, all in recent years, have been executed by BBB-rated firms, demonstrating the strength of the low investment grade debt markets. In summary, the “cheapness of debt,” coupled with large and stable capital market access at BBB levels, has provided CFOs a low-cost option for flexibility at levels below an A rating.
2000 2002 2004 2006 2008 2010 2012 2014 2016
2.1x
0.8x
1.4x
1.9x
2.5x
3.0x
Cost
of eq
uity
/cos
t of d
ebt1
Source: J.P. Morgan, Bloomberg, FactSet, as of 2/15/20171 Assumes cost of debt as per the BBB-rated issuers of the JULI index and beta of 1.0
4 For further reading, please see our report “From conformity to creativity: Creating shareholder value by breaking away from the herd” located at https://www.jpmorgan.com/directdoc/JPMorgan_CorporateFinanceAdvisory_ConformitytoCreativity.pdf

RETHINKING CAPITAL STRUCTURE TODAY? | 7
How does the cost of capital curve change if the tax shield on debt declines or disappears entirely?At lower tax levels, the tax shields on debt become less valuable. As a result, as is shown in the figure below, the lowest point on the cost of capital curve moves from a BBB rating to an A- rating if the tax rate fell from 35% to 25% (Figure 6). If the tax shield drops all the way to 0%, i.e., interest payments are no longer deductible, then a capital structure consistent with virtually no leverage would minimize the cost of capital.
Figure 6
At lower tax levels, the cost of capital is minimized at higher ratings
6.0%
6.5%
7.0%
7.5%
8.0%
8.5%
9.0%
A+ A A- BBB+ BBB BBB- BB+ BB
Weig
hted
aver
age c
ost o
f cap
ital (
WAC
C)
Minimum WACC at 0% tax rate
Minimum WACC at 25% tax rate
Minimum WACC at 35% tax rate
Source: J.P. Morgan, BloombergNote: Assumes beta of 1 at each point in time for a BBB firm, 10-year US Treasury (risk-free) rate, average bond spreads across ratings from Dataquery, market risk premium of 6.21% (Feb. 2017)

8 | Corporate Finance Advisory
Does this analysis imply that firms will have very limited or no debt if they no longer have tax shields? The answer to this question is a resounding no. As noted before, tax shields on debt are just one of many (and perhaps not even the most important) determinants of capital structure. The reduction in tax shields will likely impact some firms’ decisions at the margin, but many firms will still have significant amounts of debt. Several anecdotes and empirical data indicate a weak relationship, if any, between capital structure and tax rates (Figure 7).
Figure 7
Across sectors and countries, firms with low corporate tax rates and less tax shields do not have less leverage
Figure 7 indicates that firms in several countries with lower corporate tax rates than the United States operate at leverage levels in line, or even higher, than those in the United States. In fact, the United Kingdom and China not only have lower tax rates, but also more specific limitations on interest deductibility.5 Closer to home, Real Estate Investment Trusts (REITs) and Master Limited Partnerships (MLPs) are tax-free pass-through vehicles, thereby not obtaining the benefit of tax shields. Yet, REITs and MLPs have a lot more debt than typical tax-paying corporations. Interestingly, even before the United States introduced corporate taxes, and thus tax deductible debt, many U.S. firms had already begun using debt to finance their growth.Historical data shows no clear linkage between tax rates and debt level
2.2x
3.7x
4.7x
6.6x
0.0x
1.0x
2.0x
3.0x
4.0x
5.0x
6.0x
7.0x
8.0x
9.0x
S&P 5001 (United States)
Shanghai A-Share1
(China)MLPs2
REITs3
Medi
an D
ebt/E
BITD
A
t = 35% t = 25%
t = 20% t = 0% t = 0%
Tax rate
2.4x
FTSE 1001
(United Kingdom)
Source: J.P. Morgan, Bloomberg 1 Excludes financials2 Firms in the Alerian MLP index3 U.S. REITs greater than $1bn in market capitalization
5 For further reading, please see our report “A Primer on the Financial Policies of Chinese Firms” located at https://www.jpmorgan.com/directdoc/JPMorgan_CorporateFinanceAdvisory_FinancialPoliciesChineseFirms.pdf

RETHINKING CAPITAL STRUCTURE TODAY? | 9
What can we learn from previous situations where the tax rates changed or the tax advantage of debt disappeared?A great way to analyze the capital structures of U.S. firms is to look at how their leverage has evolved over time. Figure 8 graphs corporate tax rates as well as corporate debt to GDP. It is apparent that there is no clear linkage between aggregate debt levels and tax rates. If anything, as tax rates have gradually come down over time, corporate leverage ratios have crept up (Figure 8).
Figure 8
Historical data shows no clear linkage between tax rates and debt levels
Overall, academics have not found strong relations between tax shields and leverage levels. One recent study examined the trend in leverage following a change in the tax code in Belgium that reduced the relative tax advantage to debt by also allowing deductions for part of the cost of equity. This study found that, at the margin, firms in Belgium added less debt over time than comparable firms in border regions. One conclusion of this analysis is that firms may not proactively pay down debt but, instead, they may simply add less debt than expected over time.
10%
20%
30%
40%
50%
60%
1950 1955 1960 1965 1970 1975 1980 1985 1990 1995 2000 2005 2010 2015
Top federal statutory corporate tax rate (%) Non-financial corporate debt to GDP (%)
Source: J.P. Morgan, Federal Reserve database, World Tax database
10 | Corporate Finance Advisory
Here is the big question then: Will we experience a de-levering of corporate America? All else being equal, we could experience a moderate decline in leverage levels if one of the advantages of debt (the tax shield) is reduced or eliminated. In addition, firms might also issue less debt going forward if they can access their global free cash flow, since many of the largest firms in the United States were issuing debt over the last few years to compensate for their rising piles of offshore cash.6 To the extent these firms allocate most of the repatriated cash to shareholders or new investments, the net leverage (i.e., debt less cash) ratios of these firms will actually increase in the near-term. These effects will likely be most pronounced for the more highly levered firms. Finally, though unrelated to tax reform, commodity-price-driven firms (such as those in the oil & gas and mining sectors) may also issue less debt than they did previously in an effort to continue to strengthen their balance sheet.
However, as we discussed, many other non-tax factors influence the decision to issue debt. So much so that non-tax payers have continued to issue debt, while in contrast many tax payers issued little or no debt. As they have historically, investors will continue to seek bond-like returns. As a result, if firms issue fewer bonds than expected, bond investors will be willing to accept tighter pricing, assuming other variables do not change. This could, in turn, induce the marginal borrower to continue to issue debt.
What should decision-makers do today?The specifics of tax reform are yet to be publicly announced. Still, we encourage executives to proactively evaluate various scenarios to understand their impact on cash flow, growth opportunities, valuation, and investor and other stakeholder expectations. Further, the uncertainty associated with tax reform highlights the importance of maintaining ample balance sheet liquidity and flexibility on an ongoing basis. From a tactical perspective, decision-makers should ensure that they preserve sufficient optionality in their capital structure to take advantage of various possible outcomes. Over time, once details of the reform unfold, firms will be able to make more specific decisions to adapt their financial policies. A major de-levering is unlikely to be the optimal outcome for most firms.
6 For further reading, please see our report “The name is Cash, just Cash: Demystifying the “spectre” of record corporate cash” located at https://www.jpmorgan.com/directdoc/JPMorgan_CorporateFinanceAdvisory_TheNameIsCash.pdf

We thank Mark De Rocco and John Graham for their invaluable comments and suggestions. We also thank Jennifer Chan, Sarah Farmer and the Creative Services group for their help with the editorial process and Daniel Rodriguez for his contributions to the analytics in this report.
This material is not a product of the Research Departments of J.P. Morgan and is not a research report. Unless otherwise specifically stated, any views or opinions expressed herein are solely those of the authors listed, and may differ from the views and opinions expressed by J.P. Morgan’s Research Departments or other departments or divisions of J.P. Morgan and its affiliates.
RESTRICTED DISTRIBUTION: Distribution of these materials is permitted to investment banking clients of J.P. Morgan. Distribution of these materials to others is not permitted unless specifically approved by J.P. Morgan. These materials are for your personal use only. Any distribution, copy, reprints and/or forward to others is strictly prohibited. Information has been obtained from sources believed to be reliable but J.P. Morgan does not warrant its completeness or accuracy. Information herein constitutes our judgment as of the date of this material and is subject to change without notice. Actual events or conditions are unlikely to be consistent with, and may differ materially from, those assumed. Accordingly, actual results will vary and the variations may be material.
This material is not intended as an offer or solicitation for the purchase or sale of any financial instrument. In no event shall J.P. Morgan be liable for any use by any party of, for any decision made or action taken by any party in reliance upon, or for any inaccuracies or errors in, or omissions from, the information contained herein and such information may not be relied upon by you in evaluating the merits of participating in any transaction. J.P. Morgan makes no representations as to the legal, tax or accounting consequences of a transaction. The recipient should consult their own legal, regulatory, investment, tax, accounting and other professional advisers as deemed necessary in connection with any purchase of a financial product. This material is for the general information of our clients and is a “solicitation” only as that term is used within CFTC Rule 1.71 and 23.605 promulgated under the U.S. Commodity Exchange Act. Questions regarding swap transactions or swap trading strategies should be directed to one of the Associated Persons of J.P. Morgan’s Swap Dealers.
JPMorgan Chase and its affiliates do not provide tax, legal or accounting advice. This material has been prepared for informational purposes only, and is not intended to provide, and should not be relied on for, tax, legal or accounting advice. You should consult your own tax, legal and accounting advisors before engaging in any transaction.
J.P. Morgan is a marketing name for investment banking businesses of JPMorgan Chase & Co. and its subsidiaries worldwide. Securities, syndicated loan arranging, financial advisory and other investment banking activities are performed by a combination of J.P. Morgan Securities LLC, J.P. Morgan Limited, J.P. Morgan Securities plc and the appropriately licensed subsidiaries of JPMorgan Chase & Co. in EMEA and Asia-Pacific. Lending, derivatives and other commercial banking activities are performed by JPMorgan Chase Bank, N.A. J.P. Morgan deal team members may be employees of any of the foregoing entities.
Copyright 2017 JPMorgan Chase & Co. All rights reserved.


