1 FOR FINANCIAL PROFESSIONAL USE ONLY / NOT FOR PUBLIC VIEWING OR DISTRIBUTION. FOR FINANCIAL PROFESSIONAL USE ONLY / NOT FOR PUBLIC VIEWING OR DISTRIBUTION. Rethinking Fixed Income in Defined Contribution Plans
Transcript
1
FOR FINANCIAL PROFESSIONAL USE ONLY / NOT FOR PUBLIC VIEWING OR DISTRIBUTION. FOR FINANCIAL PROFESSIONAL USE ONLY / NOT FOR PUBLIC VIEWING OR DISTRIBUTION.
Rethinking Fixed Income in Defined Contribution Plans
2
FOR FINANCIAL PROFESSIONAL USE ONLY / NOT FOR PUBLIC VIEWING OR DISTRIBUTION.
Agenda
Rationalizing Your Plan’s Fixed Income LineupAligning Participant Expectations with Your Plan’s Core Plus Manager Janus Fixed Income Capabilities
2
3
FOR FINANCIAL PROFESSIONAL USE ONLY / NOT FOR PUBLIC VIEWING OR DISTRIBUTION. FOR FINANCIAL PROFESSIONAL USE ONLY / NOT FOR PUBLIC VIEWING OR DISTRIBUTION.
Rationalizing Your Plan’s Fixed Income Lineup
4
FOR FINANCIAL PROFESSIONAL USE ONLY / NOT FOR PUBLIC VIEWING OR DISTRIBUTION.
Fixed Income Is Often Underrepresented In Menus
According to the nonprofit Plan Sponsor Council of America (PSCA), the average DC plan has 18 offerings in its investment menu, but only two or three are fixed-income fundsLimiting choice of fixed income funds may pose significant fiduciary and retirement readiness risks including the inability to properly diversify the fixed income portion of a participant’s portfolio
4
5
FOR FINANCIAL PROFESSIONAL USE ONLY / NOT FOR PUBLIC VIEWING OR DISTRIBUTION.
Too Many Options Leads to “Choice Overload”
Several academic studies have concluded that too many options within a Defined Contribution plan confuses participants and leads to sub-optimal behavior:• Procrastination
• Low levels of participation
• Naïve diversification strategies
5
6
FOR FINANCIAL PROFESSIONAL USE ONLY / NOT FOR PUBLIC VIEWING OR DISTRIBUTION.
A Framework for Fixed Income Menu Construction
Assuming a lineup of 18 options and a target-date series of 5 to 6 funds, a fixed income lineup of 5 funds offering distinct risk and reward characteristics will leave 7 to 8 funds for equity options
The 5 fixed income funds can be selected beginning with the most conservative option
6
7
FOR FINANCIAL PROFESSIONAL USE ONLY / NOT FOR PUBLIC VIEWING OR DISTRIBUTION.
A Framework for Fixed Income Menu Construction
7
Step 1: Capital Preservation
Lower HigherRisk/Return Tradeoff
Money Market/Stable Value
Primary objective is to preserve principal
8
FOR FINANCIAL PROFESSIONAL USE ONLY / NOT FOR PUBLIC VIEWING OR DISTRIBUTION.
A Framework for Fixed Income Menu Construction
On July 23, 2014, the SEC finalized its ruling on money market mutual fund reform. The new rules, which must be in place within two years, include:• Prime Funds that service institutions must move to a floating NAV;
• Prime Funds that service “only” retail shareholders can continue to use stable NAV accounting;
• US Government and Treasury Funds are exempt from rule changes;
• In times of stress, a fund’s Board can halt redemption activity for up to 10 days and/or impose a 2% redemption fee; and
• Funds will be required to make public their 7-day and 30-day liquidity positions on a daily basis
8
9
FOR FINANCIAL PROFESSIONAL USE ONLY / NOT FOR PUBLIC VIEWING OR DISTRIBUTION.
A Framework for Fixed Income Menu Construction
9
Step 2: US Short-Term Investment Grade
Lower HigherRisk/Return Tradeoff
Short-Term/Low-Duration
May provide slightly higher yield than the capital preservation option but principal is not “guaranteed”
10
FOR FINANCIAL PROFESSIONAL USE ONLY / NOT FOR PUBLIC VIEWING OR DISTRIBUTION.
Average Annual Return
Standard Deviation 2008 Return
US Money Market-Taxable 1.46% 0.51% 2.01%
US Short-Term Bond 2.48% 1.87% -4.61%
10
Money Market vs. Short-Term Bond Managers (1/1/04-12/31/13)
A Framework for Fixed Income Menu Construction
Source: Category average returns for period 1/1/04-12/31/13, Morningstar
11
FOR FINANCIAL PROFESSIONAL USE ONLY / NOT FOR PUBLIC VIEWING OR DISTRIBUTION.
A Framework for Fixed Income Menu Construction
11
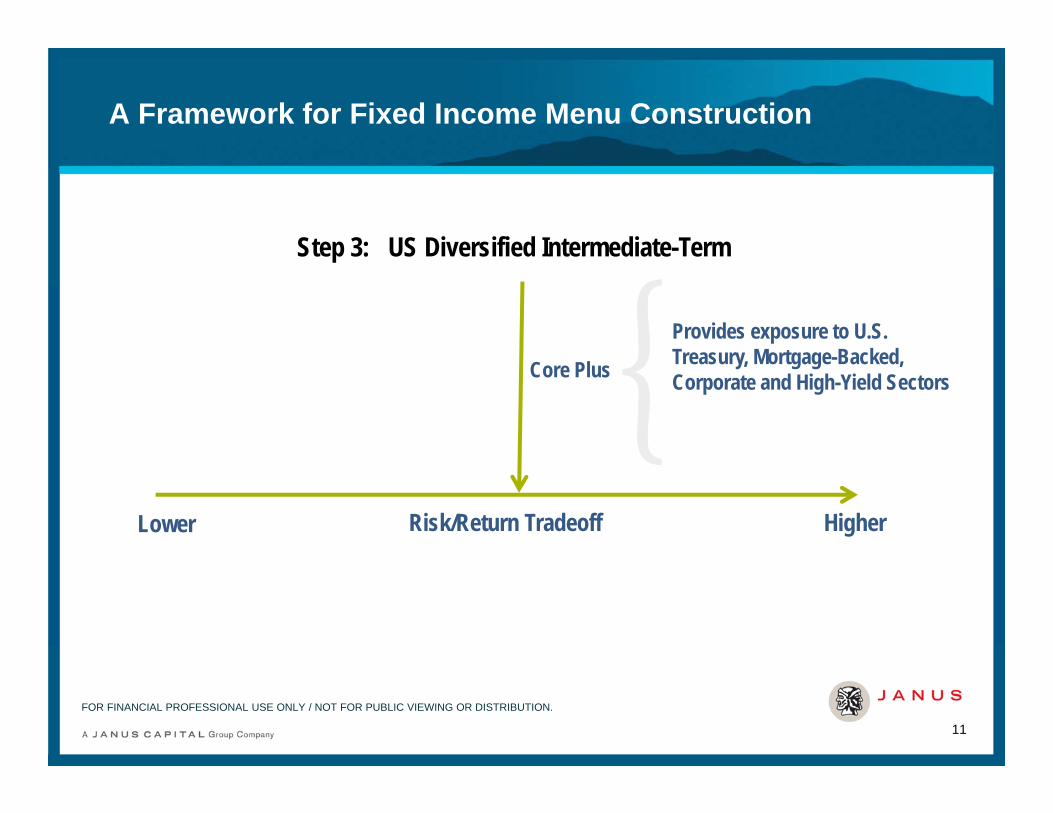
Step 3: US Diversified Intermediate-Term
Lower HigherRisk/Return Tradeoff
Core Plus
Provides exposure to U.S. Treasury, Mortgage-Backed, Corporate and High-Yield Sectors
12
FOR FINANCIAL PROFESSIONAL USE ONLY / NOT FOR PUBLIC VIEWING OR DISTRIBUTION.
A Framework for Fixed Income Menu Construction
12
2004 2005 2006 2007 2008 2009 2010 2011 2012 2013
High-Yield
11.13%
US Treasury2.79%
High-Yield
11.85%
USTreasury9.01%
US Treasury13.74%
High-Yield
58.21%
High-Yield
15.12%
US Treasury9.81%
High-Yield
15.81%
High-Yield
7.44%
Corporate5.24%
High-Yield
2.74%
MBS5.22%
MBS6.90%
MBS8.34%
Corporate16.04%
Corporate8.47%
Corporate8.35%
Corporate9.37%
MBS-1.41%
MBS4.70%
MBS2.61%
Corporate4.26%
Corporate5.11%
Corporate-3.08%
MBS5.89%
USTreasury5.87%
MBS6.23%
MBS2.59%
Corporate-2.01%
US Treasury3.54%
Corporate1.96%
US Treasury3.08%
High-Yield
1.87%
High-Yield
-26.16%
US Treasury-3.57%
MBS5.37%
High-Yield
4.98%
US Treasury1.99%
USTreasury-2.75%
Core Plus Offers Broad Diversification – Four Categories in One
Source: Barclays U.S. Aggregate Corporate – High Yield (High Yield), Government – Treasury (US Treasury), Credit – Mortgage (MBS), Corporate AAA (Corporate); Morningstar
13
FOR FINANCIAL PROFESSIONAL USE ONLY / NOT FOR PUBLIC VIEWING OR DISTRIBUTION.
A Framework for Fixed Income Menu Construction
13
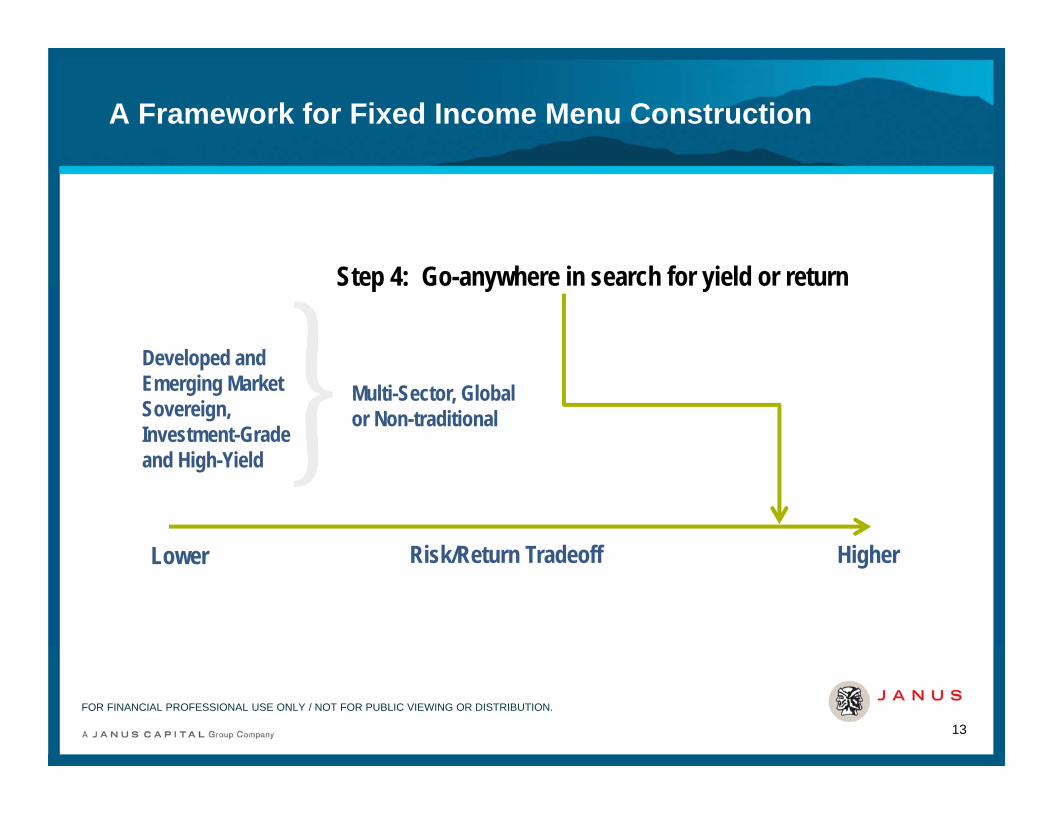
Step 4: Go-anywhere in search for yield or return
Lower HigherRisk/Return Tradeoff
Multi-Sector, Global or Non-traditional
Developed and Emerging Market Sovereign,Investment-Grade and High-Yield
14
FOR FINANCIAL PROFESSIONAL USE ONLY / NOT FOR PUBLIC VIEWING OR DISTRIBUTION.
US Intermediate-Term vs. Go-Anywhere Fixed Income Managers
Source: Category average returns, Morningstar
15
FOR FINANCIAL PROFESSIONAL USE ONLY / NOT FOR PUBLIC VIEWING OR DISTRIBUTION.
A Framework for Fixed Income Menu Construction
15
Step 5: Inflation Protection
Real Return
Hedges for inflation through the use of TIPS, Real Estate, Commodities, Gold, Natural Resources, etc.
16
FOR FINANCIAL PROFESSIONAL USE ONLY / NOT FOR PUBLIC VIEWING OR DISTRIBUTION.
A Framework for Fixed Income Menu Construction
2004 2005 2006 2007 2008 2009 2010 2011 2012 2013
S&P Global REIT
31.97%
S&P Global Natural
Resources26.79%
FTSE EPRA/NAREIT
Global REITs39.20%
S&P Global Natural
Resources41.73%
S&P GSCI Gold Spot
5.53%
S&P GlobalNatural
Resources36.14%
S&P GSCI Gold Spot29.67%
Barclays U.S. Treasury U.S. TIPS13.56%
FTSE EPRA/NAREIT
Global REITs22.97%
FTSE EPRA/NAREIT
Global REITs2.32%
S&P Global Natural
Resources 24.38%
BloombergCommodity
21.36%
S&P Global Natural
Resources29.78%
S&P GSCI Gold Spot31.35%
Barclays U.S. Treasury U.S. TIPS
-2.35%
FTSE EPRA/NAREIT
Global REITs32.60%
FTSE EPRA/NAREIT
Global REITs22.83%
S&P GSCI Gold Spot10.23%
S&P Global Natural
Resources7.15%
S&P Global Natural
Resources1.55%
BloombergCommodity
9.15%
S&P GSCI Gold Spot18.36%
S&P GSCI Gold Spot22.95%
BloombergCommodity
16.23%
BloombergCommodity
-35.65%
S&P GSCI Gold Spot23.96%
Bloomberg Commodity
16.83%
FTSE EPRA/NAREIT
Global REITs2.26%
Barclays U.S. Treasury U.S. TIPS
6.98%
Barclays U.S. Treasury U.S. TIPS
-8.61%
Barclays U.S.
Treasury U.S. TIPS
8.46%
S&P GlobalREIT9.13%
BloombergCommodity
2.07%
Barclays U.S. Treasury U.S. TIPS11.64%
S&P Global Natural
Resources-38.29%
BloombergCommodity
18.91%
S&P Global Natural
Resources10.97%
BloombergCommodity
-13.32%
S&P GSCI Gold Spot
6.96%
Bloomberg Commodity
-9.52%
S&P GSCI Gold Spot
5.36%
Barclays U.S. Treasury U.S. TIPS
2.84%
Barclays U.S. Treasury U.S.
TIPS0.41%
FTSE EPRA/NAREIT
Global REITs-10.84%
FTSE EPRA/NAREIT
Global REITs-44.43%
Barclays U.S. Treasury U.S. TIPS11.41%
Barclays U.S. Treasury U.S. TIPS
6.31%
S&P Global Natural
Resources-14.86%
Bloomberg Commodity
-1.06%
S&P GSCI Gold Spot-28.26%
Real Return Offers Broad Diversification
Source: Index returns, Morningstar
16
17
FOR FINANCIAL PROFESSIONAL USE ONLY / NOT FOR PUBLIC VIEWING OR DISTRIBUTION.
A Framework for Fixed Income Menu Construction
In summary, we consider using 5 fixed-income asset strategies with distinct risk and reward characteristics
17
Lower HigherRisk/Return Tradeoff
Money Market/ Short-Term/ Core Plus Multi-Sector, Real Stable Value Low-Duration Global or Non- Return
Traditional
InflationHedge
18
FOR FINANCIAL PROFESSIONAL USE ONLY / NOT FOR PUBLIC VIEWING OR DISTRIBUTION. FOR FINANCIAL PROFESSIONAL USE ONLY / NOT FOR PUBLIC VIEWING OR DISTRIBUTION.
Aligning Participant Expectations with Your Plan’s Core Plus Manager
19
FOR FINANCIAL PROFESSIONAL USE ONLY / NOT FOR PUBLIC VIEWING OR DISTRIBUTION.
What Are Your Participant’s Expectations?
19
Preserve principalReduce or dampen volatility during times of market stressGenerate a modest or reasonable amount of income
20
FOR FINANCIAL PROFESSIONAL USE ONLY / NOT FOR PUBLIC VIEWING OR DISTRIBUTION.
0.00
0.50
1.00
1.50
2.00
2.50
3.00
3.50
4.00
4.50
Jan-
08M
ar-0
8M
ay-0
8Ju
l-08
Sep
-08
Nov
-08
Jan-
09M
ar-0
9M
ay-0
9Ju
l-09
Sep
-09
Nov
-09
Jan-
10M
ar-1
0M
ay-1
0Ju
l-10
Sep
-10
Nov
-10
Jan-
11M
ar-1
1M
ay-1
1Ju
l-11
Sep
-11
Nov
-11
Jan-
12M
ar-1
2M
ay-1
2Ju
l-12
Sep
-12
Nov
-12
Jan-
13M
ar-1
3M
ay-1
3Ju
l-13
Sep
-13
Nov
-13
Jan-
14M
ar-1
4M
ay-1
4
10-Year Treasury2008-2014
20
History of Interest Rates Since 2008
Source: Federal Reserve Bank of St. Louis
21
FOR FINANCIAL PROFESSIONAL USE ONLY / NOT FOR PUBLIC VIEWING OR DISTRIBUTION.
A Secular Bear Market May Actually Create Opportunity
21
Despite the inverse relationship between interest rates and bond prices, a secular bear market may create opportunities if properly managed:• Historically, long-term interest rate trends do not move in a perfectly
linear direction and• Maturing bonds can be reinvested into higher-coupon bonds offsetting
the decline in price
22
FOR FINANCIAL PROFESSIONAL USE ONLY / NOT FOR PUBLIC VIEWING OR DISTRIBUTION.
Interest Rate Movements Are Not Linear
Time Period of Rising Rates* 10-year Treasury (Start) 10-Year Treasury (End) Yield Change (bp)Nov 1981-Feb 1982 12.92 14.95 +203
May 1982-Jun 1982 13.46 14.76 +130
May 1983-May 1984 10.12 13.95 +383
Apr 1986-Jun 1986 6.95 8.31 +136
Dec 1986-Oct 1987 6.92 10.23 +331
Mar 1988-Mar 1989 8.11 9.54 +143
Dec 1991-Mar 1992 6.69 7.69 +100
Oct 1993-Nov 1994 5.17 8.03 +286
Jan 1996-Jun 1996 5.52 7.06 +154
Oct 1998-Jan 2000 4.16 6.79 +263
Oct 2001-Apr 2002 4.18 5.43 +125
Jun 2003-Jun 2004 3.11 4.88 +177
Jun 2005-Jun 2006 3.88 5.24 +136
Dec 2008-Jun 2009 2.06 3.95 +189
Oct 2010-Feb 2011 2.38 3.74 +136
May 2013-Dec 2013 1.63 3.03 +140
22
Source: Bloomberg, FactSet. Data presented reflects past performance, which is no guarantee of future results.*From first day of beginning month of the period to final day of ending month of the period.
23
FOR FINANCIAL PROFESSIONAL USE ONLY / NOT FOR PUBLIC VIEWING OR DISTRIBUTION.
Reinvesting at Higher Rates Could Yield Positive Returns
-4%
-2%
0%
2%
4%
6%
8%
10%
12%
14%
16%
18%
Total Return
23
The Last Long-Term Rising Rate Environment• Total Return of U.S. Intermediate-Term Government Bond Index vs. 10-Year Treasury Rate
10-Yr. Treas. Rate
Int.-Term Govt. Bond Index
KEY
Source: Barclays
24
FOR FINANCIAL PROFESSIONAL USE ONLY / NOT FOR PUBLIC VIEWING OR DISTRIBUTION.
Passive Doesn’t Mean “Safe”
24
5.55
2.48
0
1
2
3
4
5
6
Barclays U.S. Aggregate Index Duration Barclays U.S. Aggregrate Index Yield to Worst
Yield Duration of the Barclays U.S. Aggregate Bond Index
Source: Bloomberg, Barclays (as of 12/31/2013)
25
FOR FINANCIAL PROFESSIONAL USE ONLY / NOT FOR PUBLIC VIEWING OR DISTRIBUTION.
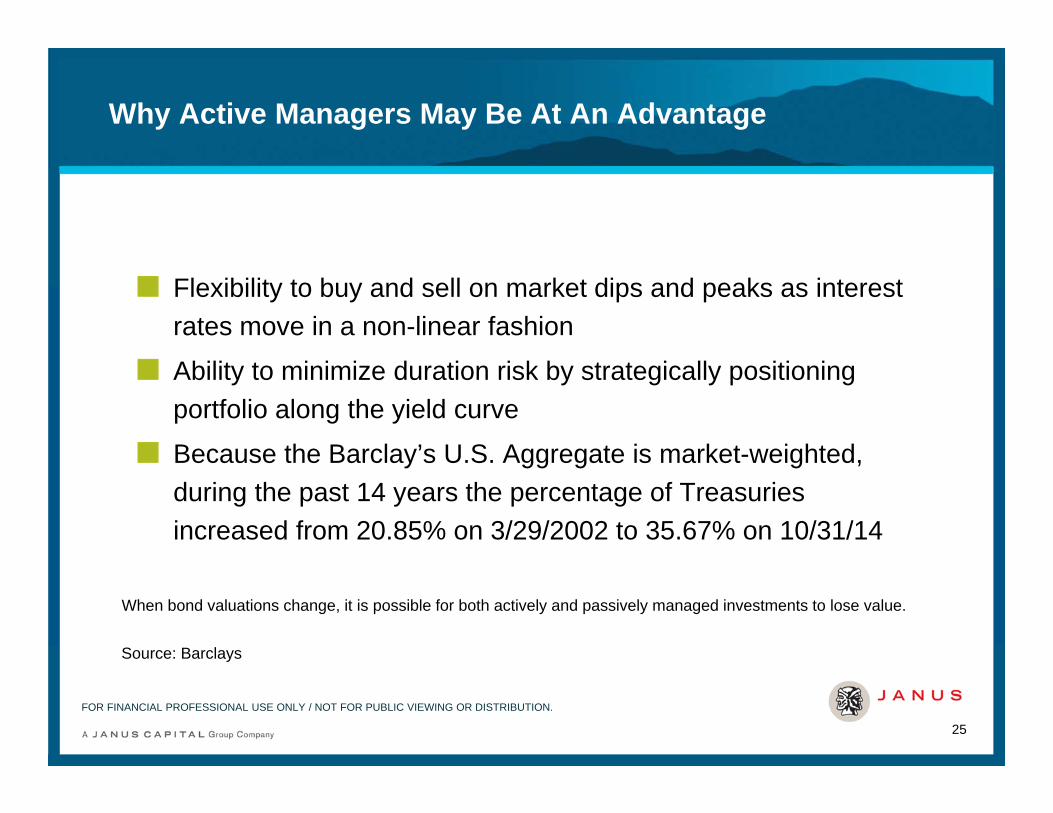
Why Active Managers May Be At An Advantage
Flexibility to buy and sell on market dips and peaks as interest rates move in a non-linear fashion
Ability to minimize duration risk by strategically positioning portfolio along the yield curve
Because the Barclay’s U.S. Aggregate is market-weighted, during the past 14 years the percentage of Treasuries increased from 20.85% on 3/29/2002 to 35.67% on 10/31/14
25
When bond valuations change, it is possible for both actively and passively managed investments to lose value.
Source: Barclays
26
FOR FINANCIAL PROFESSIONAL USE ONLY / NOT FOR PUBLIC VIEWING OR DISTRIBUTION.
What Are Your Participant’s Expectations?
Preserve principalReduce or dampen volatility during times of market stressGenerate a modest or reasonable amount of income
26
27
FOR FINANCIAL PROFESSIONAL USE ONLY / NOT FOR PUBLIC VIEWING OR DISTRIBUTION. FOR FINANCIAL PROFESSIONAL USE ONLY / NOT FOR PUBLIC VIEWING OR DISTRIBUTION.
Pre-Crises Correlations to Equities – as of September 2007
27
0
50
100
150
200
Freq
uenc
y
Distribution of 7-Year Correlation to the S&P 500 IndexMorningstar Intermediate-Term Bond Funds
Barclays U.S. Aggregate Index: -0.31 correlationFund Average: -0.22 correlation
CorrelationSource: Morningstar
28
FOR FINANCIAL PROFESSIONAL USE ONLY / NOT FOR PUBLIC VIEWING OR DISTRIBUTION. FOR FINANCIAL PROFESSIONAL USE ONLY / NOT FOR PUBLIC VIEWING OR DISTRIBUTION.
Post-Crises Correlations to Equities – as of June 2014
28
Distribution of 7-Year Correlation to the S&P 500 IndexMorningstar Intermediate-Term Bond Funds
0
20
40
60
80
100
120
140
Freq
uenc
y
Barclays U.S. Aggregate Index: .07 correlationFund Average: .32 correlation
CorrelationSource: Morningstar
29
FOR FINANCIAL PROFESSIONAL USE ONLY / NOT FOR PUBLIC VIEWING OR DISTRIBUTION. FOR FINANCIAL PROFESSIONAL USE ONLY / NOT FOR PUBLIC VIEWING OR DISTRIBUTION.
Equity Correlation and Max Drawdown – as of June 2014
29
Distribution of 7-Year Correlation to the S&P 500 Index vs. Max DrawdownMorningstar Intermediate-Term Bond Funds
-45
-40
-35
-30
-25
-20
-15
-10
-5
-.3 -.2 -.1 .0 .1 .2 .3 .4 .5 .6 .7 .8 .9
Max
Dra
wdo
wn
(%)
Correlation
Source: Morningstar
30
FOR FINANCIAL PROFESSIONAL USE ONLY / NOT FOR PUBLIC VIEWING OR DISTRIBUTION.
Is Your Core Plus Manager a Downside Volatility Dampener or Contributor?
2008 Return 2008 Maximum Drawdown
3rdQ 2011 Return
3rdQ 2011 MaximumDrawdown
S&P 500 -37.00% -13.87%
1st Percentile Core Plus Manager 11.19% -.56% 7.40% -.01%
20th Percentile Core Plus Manager 3.76% -3.31% 3.22% -.17%
Average Core Plus Manager -3.30% -4.05% 1.84% -1.01%
80th Percentile Core Plus Manager -9.59% -4.65% .87% -1.82%
100th Percentile Core Plus Manager -36.24% -17.83% -6.86% -6.86%
30
Source: Morningstar
31
FOR FINANCIAL PROFESSIONAL USE ONLY / NOT FOR PUBLIC VIEWING OR DISTRIBUTION.
Areas of Caution for Plan Sponsors
In an effort to obtain a higher yield, some Core Plus managers have assumed a greater degree of risk
During periods of market stress and uncertainty, these strategies may exhibit a high correlation with equity markets, at a time when participants rely on diversification the most
31
32
FOR FINANCIAL PROFESSIONAL USE ONLY / NOT FOR PUBLIC VIEWING OR DISTRIBUTION.
What Are Your Participant’s Expectations?
Preserve principalReduce or dampen volatility during times of market stressGenerate a modest or reasonable amount of income
32
33
FOR FINANCIAL PROFESSIONAL USE ONLY / NOT FOR PUBLIC VIEWING OR DISTRIBUTION.
Yields Above 5% are Difficult to Find
5.29% 5.20%
2.86% 2.76%2.17% 2.11%
1.38% 1.29%
0%
1%
2%
3%
4%
5%
6%
Yield-to-Worst as of 8/29/2014
33
Source: Barclays Live Index Returns
34
FOR FINANCIAL PROFESSIONAL USE ONLY / NOT FOR PUBLIC VIEWING OR DISTRIBUTION.
Low Yields May Mean Limited Price Appreciation
34
0
5
10
15
20
25
1/1/
1987
10/1
/198
77/
1/19
884/
1/19
891/
1/19
9010
/1/1
990
7/1/
1991
4/1/
1992
1/1/
1993
10/1
/199
37/
1/19
944/
1/19
951/
1/19
9610
/1/1
996
7/1/
1997
4/1/
1998
1/1/
1999
10/1
/199
97/
1/20
004/
1/20
011/
1/20
0210
/1/2
002
7/1/
2003
4/1/
2004
1/1/
2005
10/1
/200
57/
1/20
064/
1/20
071/
1/20
0810
/1/2
008
7/1/
2009
4/1/
2010
1/1/
2011
10/1
/201
17/
1/20
124/
1/20
131/
1/20
14
Barclays U.S. Corporate High Yield Bond Index Yield-to-Worst
Source: Barclays
35
FOR FINANCIAL PROFESSIONAL USE ONLY / NOT FOR PUBLIC VIEWING OR DISTRIBUTION.
Tale of Two Companies: Ford
35
Ford’s credit was rated BB+ in early 2013
Research suggests:• The company made improvements to its business model in recent
years, including reducing costs, improving liquidity and providing a better product mix and
• The improving US economy, replacement demand and low interest rates provided a positive business climate for the auto industry
In September 2013, S&P raised its credit rating from BB+ to BBB-
Despite higher rates in 2013, the Ford 3% 2017 closed at $104.04, up from $102.74
36
FOR FINANCIAL PROFESSIONAL USE ONLY / NOT FOR PUBLIC VIEWING OR DISTRIBUTION.
Tale of Two Companies: Dell
36
An A-rated issue in early 2013, with spreads trading close to the A-rated index
Research suggests:• PC Market in decline as tablets like the iPad took significant
market share;
• Management was focused on friendly equity shareholder activities such as debt-funded acquisitions and share repurchases; and
• Concerned about a potential leveraged-buyout given the bonds lacked a protective change of control covenant
When a LBO was announced in 2013, the 5.4% 2040 bonds troughed at a low of $68 compared to trading at $100 earlier in the year
37
FOR FINANCIAL PROFESSIONAL USE ONLY / NOT FOR PUBLIC VIEWING OR DISTRIBUTION.
Important Lessons About Credit Risk
Managers must be able to discern between attractively priced corporate bonds and those of ailing companies with a justified depressed market valuation
Security avoidance can be as important as security selection
37
38
FOR FINANCIAL PROFESSIONAL USE ONLY / NOT FOR PUBLIC VIEWING OR DISTRIBUTION. FOR FINANCIAL PROFESSIONAL USE ONLY / NOT FOR PUBLIC VIEWING OR DISTRIBUTION.
Janus Fixed Income Capabilities
39
FOR FINANCIAL PROFESSIONAL USE ONLY / NOT FOR PUBLIC VIEWING OR DISTRIBUTION.
Fixed Income Background at Janus
39
Janus Fixed Income manages $31.3 billion (as of 9/30/14) for clients globally in multi-sector investingHistory dates back to 1987 with the inception of the Janus Flexible Bond FundPortfolio managers average more than 25 years of investment experienceTwo distinct and separate fixed income investing platforms:• Bottom-up, fundamental fixed income• Top-down, global macro fixed income
40
FOR FINANCIAL PROFESSIONAL USE ONLY / NOT FOR PUBLIC VIEWING OR DISTRIBUTION.
Shared Strategies of Equity and Fixed Income
40
Shared focus on fundamental research integrates our equity and fixed income teamResearch and business contacts for accessing management are shared between investment teams to form a collective opinion regarding management’s intentionsA deep understanding of potential catalysts and more data points is acquired as a result of shared research for a particular company
41
FOR FINANCIAL PROFESSIONAL USE ONLY / NOT FOR PUBLIC VIEWING OR DISTRIBUTION.
Fixed Income Strategies
41
Bottom-up, Fundamental Fixed IncomeJanus Core Plus/Flexible Bond
• Employs a bottom-up fundamentally driven investment process that focuses on credit-oriented investments• Fundamental credit research is used to build a mosaic of information in an effort to identify macro trends
and inform allocations across fixed income sectors• Credit research emphasizes free cash flow generation, quality of management and security valuation
Janus Global Multi-Sector• Flexibility to deviate significantly from the index on a sector, country, currency and duration basis, seeking
risk-adjusted returns and capital preservation• Fundamental corporate and sovereign credit research drives portfolio allocation and security selection• Sophisticated, proprietary fixed income portfolio and risk-management system, Quantum Global
Janus Short Duration• Employs a bottom-up fundamentally driven investment process that focuses on credit-oriented investments• Fundamental credit research is used to build a mosaic of information in an effort to identify macro trends
and inform allocations to corporate and government fixed income securities• Credit research emphasizes free cash flow generation, quality of management and security valuation
Janus High Yield• Moderate beta approach, driven by a bottom-up, fundamentally based investment process• Designed to serve as a long-term strategic allocation, not a tactical allocation• Credit research emphasizes free cash flow generation, quality of management and security valuation
42
FOR FINANCIAL PROFESSIONAL USE ONLY / NOT FOR PUBLIC VIEWING OR DISTRIBUTION.
Fixed Income Strategies
42
Top-down, Global Macro Fixed IncomeJanus Global Unconstrained Bond
• Seeks to achieve long-term positive returns in diverse market environments over full market cycles• Invests broadly across global fixed income markets and is not constrained by benchmark-specific guidelines• Managed by world-renowned fixed income investor Bill Gross
There is no assurance that the investment process will consistently lead to successful investing. There is no assurance the stated objective(s) will be met. Diversification neither assures a profit nor eliminates the risk of experiencing investment losses.
Fixed income securities are subject to interest rate, inflation, credit and default risk. The bond market is volatile. As interest rates rise, bond prices usually fall, and vice versa. The return of principal is not guaranteed, and prices may decline if an issuer fails to make timely payments or its credit strength weakens.
High-yield/high-risk bonds, also known as "junk" bonds, involve a greater risk of default and price volatility than U.S. Government and other high quality bonds. High-yield/high-risk bonds can experience sudden and sharp price swings which will affect net asset value.
Foreign securities are subject to additional risks including currency fluctuations, political and economic uncertainty, increased volatility and differing financial and information reporting standards, all of which are magnified in emerging markets.
Sovereign debt securities are subject to the additional risk that, under some political, diplomatic, social or economic circumstances, some developing countries that issue lower quality debt securities may be unable or unwilling to make principal or interest payments as they come due.
No investment strategy, including an absolute return strategy, can ensure a profit or protect against loss. Additionally, investing in an absolute return strategy may result in underperformance during a bull market.
43
FOR FINANCIAL PROFESSIONAL USE ONLY / NOT FOR PUBLIC VIEWING OR DISTRIBUTION.
Thank You
43
For more information contact your Janus Sales Director at 877.33JANUSPast performance is no guarantee of future results.
This presentation is for information purposes only and should not be used or construed as an offer to sell, a solicitation of an offer to buy, or a recommendation for any security. There is no guarantee that the information supplied is accurate, complete, or timely, nor does it make any warranties with regards to the results obtained from its use. It is not intended to indicate or imply in any manner that current or past results are indicative of future profitability or expectations. As with all investments, there are inherent risks that individuals would need to consider.
Please consider the charges, risk, expenses and investment objectives carefully before investing or recommending to clients for investment. For a prospectus containing this and other information, please call Janus at 877.33JANUS (52687) or download the file from janus.com/info. Read it carefully before you invest or send money.
This document is not intended to be legal or fiduciary advice or a full representation of all responsibilities of plan sponsors and advisors. In preparing this document, Janus has relied upon and assumed, without independent verification, the accuracy and completeness of all information available from public sources.


![GOVERNMENTAL DEFINED CONTRIBUTION … DEFINED CONTRIBUTION VOLUME SUBMITTER PLAN AND TRUST BASIC PLAN DOCUMENT [DC-BPD #05] © Copyright 2014 Governmental Defined Contribution Basic](https://static.documents.pub/doc/80x56/5b0419f67f8b9a4e538d36ff/governmental-defined-contribution-defined-contribution-volume-submitter-plan.jpg)


