2011 ICC Global Survey on Trade and Finance Trade and financial markets development 2009-2010 Routes to recovery: a regional perspective Impacts of the regulatory regime on trade and finance Market outlook Rethinking Trade and Finance
Transcript
2011ICC Global Survey on Trade and Finance
Trade and financial markets development 2009-2010
Routes to recovery: a regional perspective
Impacts of the regulatory regime on trade and finance
Market outlook
Rethinking Trade and
Finance
Rethinking Trade & Finance: Global Survey 2011
Editor
Thierry Senechal
Senior Policy Manager, International Chamber of Commerce
Steering Committee
Gary Collyer
Senior Technical Advisor, ICC Banking Commission
Leo Cullen
Partner, Coastline Solutions
Vincent O’Brien
Chair, ICC Banking Commission Market Intelligence Group
All rights reserved. ICC holds all copyright and other intellectual
property rights in this collective work. No part of this work may be
reproduced, copied, distributed, transmitted, translated or adapted
in any form or by any means – graphic, electronic or mechanical,
and including without limitation, photocopying, scanning, recording,
taping, or by use of computer, the internet or information retrieval
systems – without written permission of ICC through ICC Services,
Publications Department.
“ICC Global Survey on Trade & Finance” is a registered trademark
of the International Chamber of Commerce.
ICC Services
Publications
38 Cours Albert 1er
75008 Paris
France
ICC Publication No. 710E
ISBN: 978-92-842-0100-6
www.iccbooks.com
Acknowledgements
The ICC Survey would not have been possible without the pathfinding work done during 2007-2011 by the ICC Banking Commission. We would like to thank Gary Collyer, Senior Technical Adviser of the Banking Commission; Vincent O’Brien, Chair of the ICC Market Intelligence Group; and Leo Cullen of Coastline Solutions for their timely inputs to this report. Ron Katz, the Editor of ICC’s quarterly newsletter, DCInsight, has reviewed the document with great care and made numerous valuable suggestions. We would like to express our gratitude to ICC’s network of 92 national committees for providing information and advice to lead us through the often-complex process of conducting such a global survey.
The present report depended on the support of various experts from organizations outside ICC. Marc Auboin of the World Trade Organization was instrumental in requesting that this Survey be established. We would like to extend our special thanks to our partners in this Survey: Jean-Pierre Chauffour and Mariem Malouche of The World Bank Group; Steven Beck of the Asian Development Bank; Ghazi Ben Ahmed of the African Development Bank; Rudolf Putz of the European Bank for Reconstruction and Development; Bonnie Galat and H. Scott Stevenson of the International Finance Corporation; and Daniela Carrera Marquis of the Inter-American Development Bank.
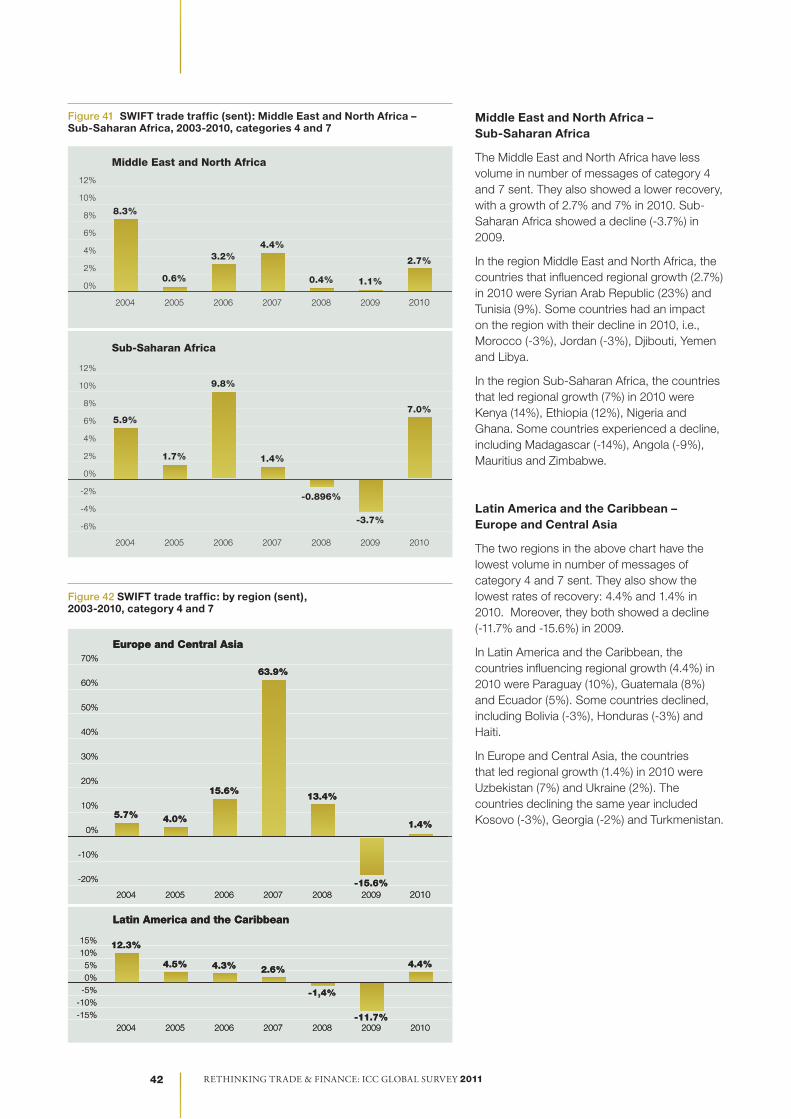
André Casterman of SWIFT once again graciously provided background information and contemporaneous data on trade finance messaging volumes worldwide on an exclusive basis. Fabrice Morel from the Berne Union provided the much-needed analysis on credit insurance.
We would like to thank three leading experts for providing their industry outlook: Kah Chye Tan, Global Head of Corporate Cash and Trade, Standard Chartered Bank and Chairman of the Banking Commission; John Ahearn, Managing Director, Global Head of Trade, Global Transaction Services, Treasury and Trade Solutions Group, Citibank; and Daniel Cotti, Head of Global Trade, JPMorgan Chase.
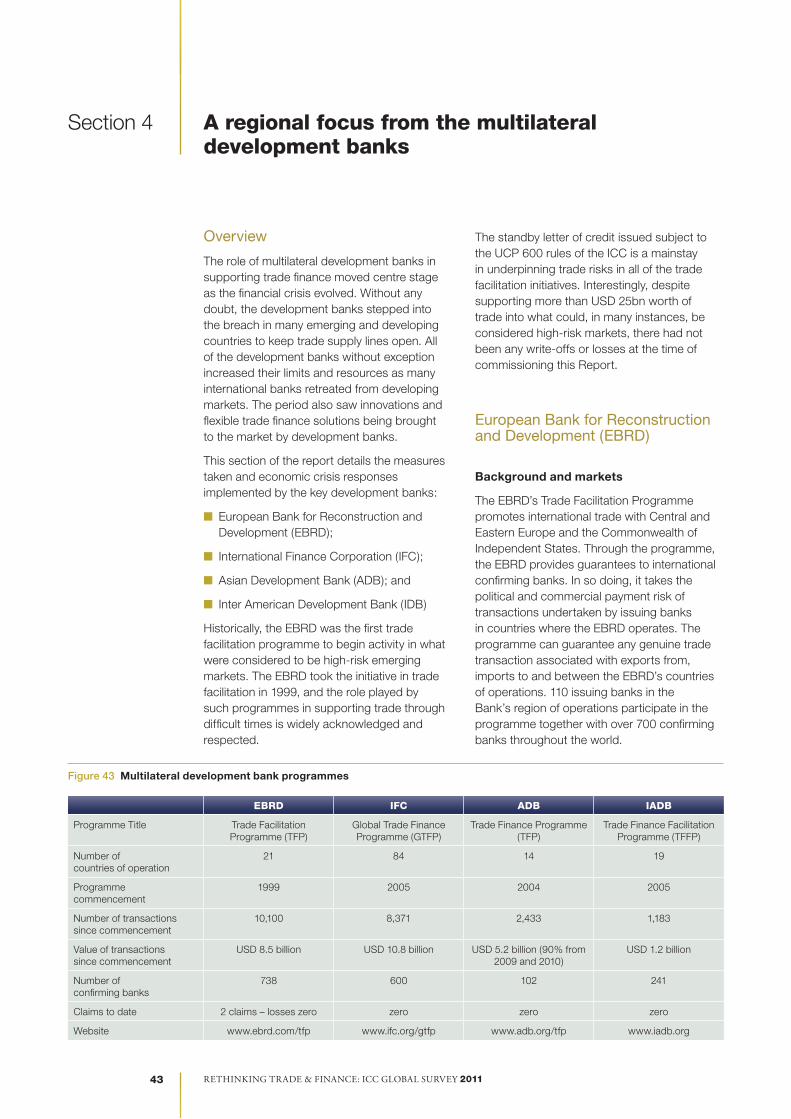
More than ever, we renew our thanks to ICC’s technology partner, Coastline Solutions, for compiling the online Survey.
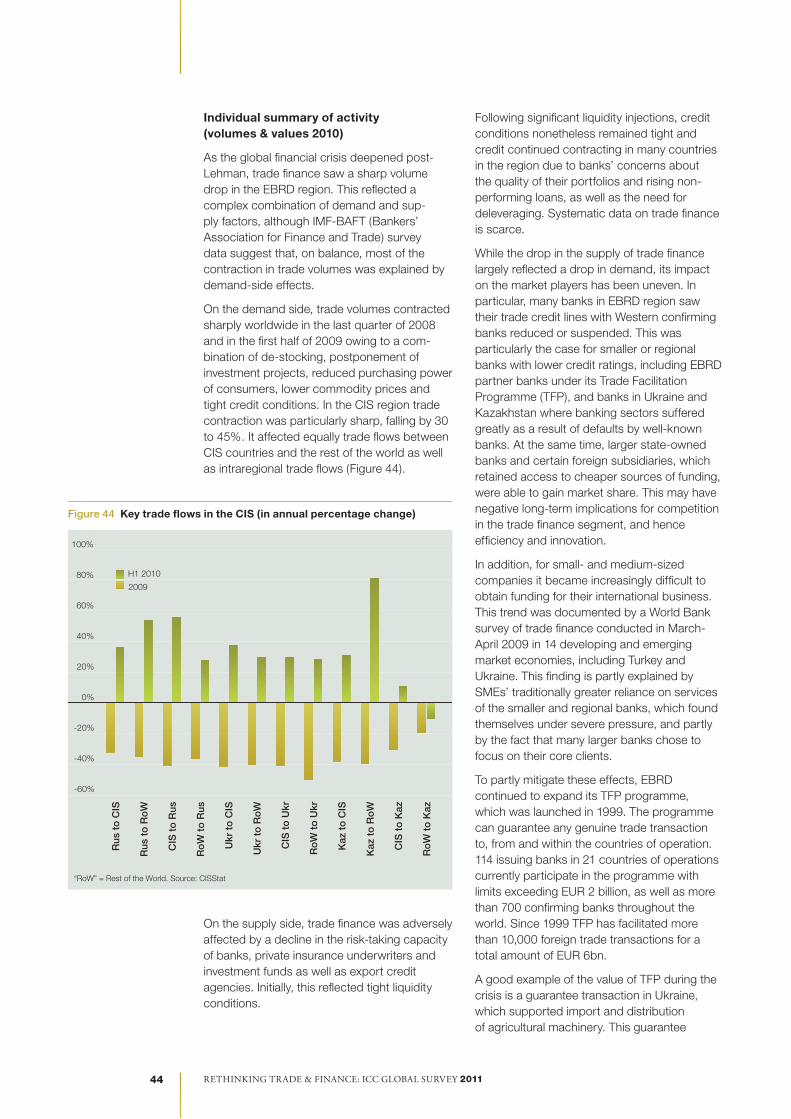
The International Chamber of Commerce (ICC) thanks its partners and sponsors for their support in the preparation of this Survey
Rethinking tRade & Finance: icc global SuRvey 2011 4
Contents
Acknowledgements 3
List of figures 6
List of acronyms 7
Foreword 9
Introduction 10
Executive summary 13
An industry outlook on the recovery 18
Section 1 Background and methodology 21
Purpose and scope of ICC Survey 2011 21
Methodology outline and timetable 21
Participation in ICC Survey 2011 22
Section 2 World economy: Expectations point to recovery 24
The great trade collapse and recovery – a quick overview 24
An improvement in the world economic climate 25
Changes in growth patterns: recovery is more broadly distributed 25
Some sectors have been hit harder 26
Continued commitment to keep markets open 27
Support to trade finance in low-income countries must continue 27
Section 3 Trade finance statistics: Global and regional trends 29
Trade is rebounding 29
Trade finance demand 31
Affordability of trade finance 31
Operational impacts 32
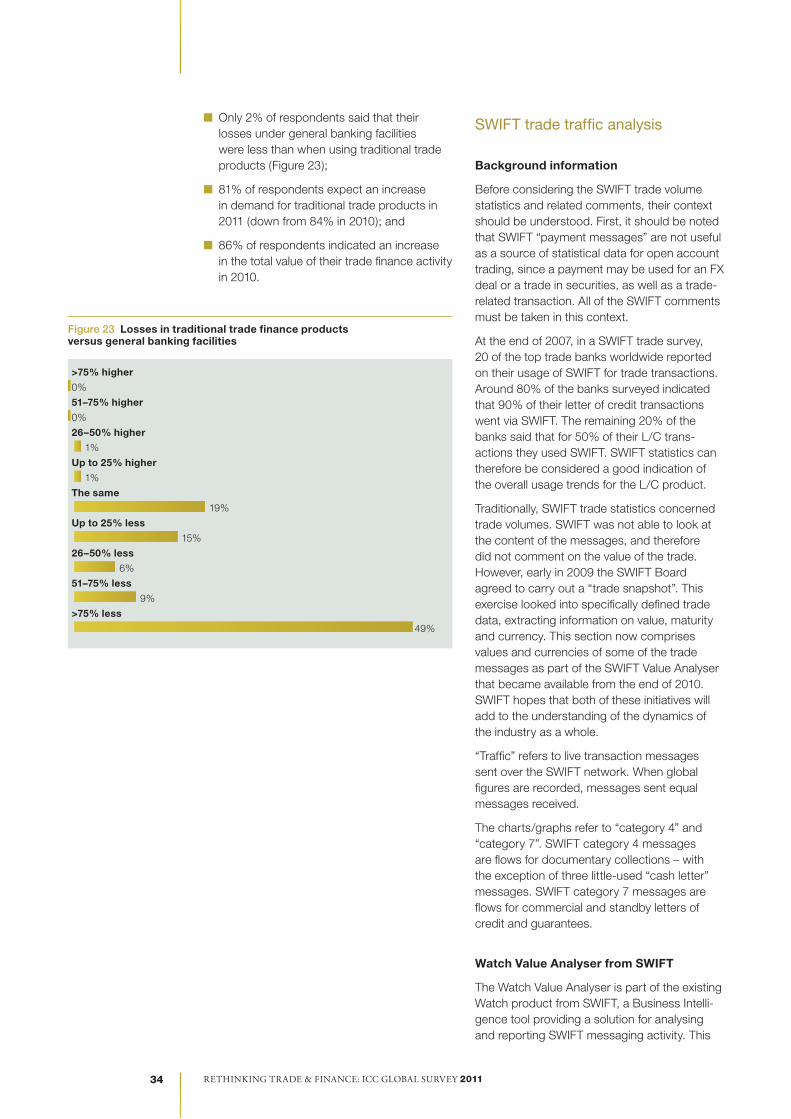
SWIFT trade traffic analysis 34
SWIFT regional analysis 38
Special SWIFT insights on developing countries 41
Rethinking tRade & Finance: icc global SuRvey 2011 Rethinking tRade & Finance: icc global SuRvey 2011 5
Section 4 A regional focus from the multilateral development banks 43
Overview 43
The European Bank for Reconstruction and Development (EBRD) 43
The Inter-American Development Bank (IDB) 47
The International Finance Corporation (IFC) 51
The Asian Development Bank (ADB) 54
The African Development Bank (AfDB) 56
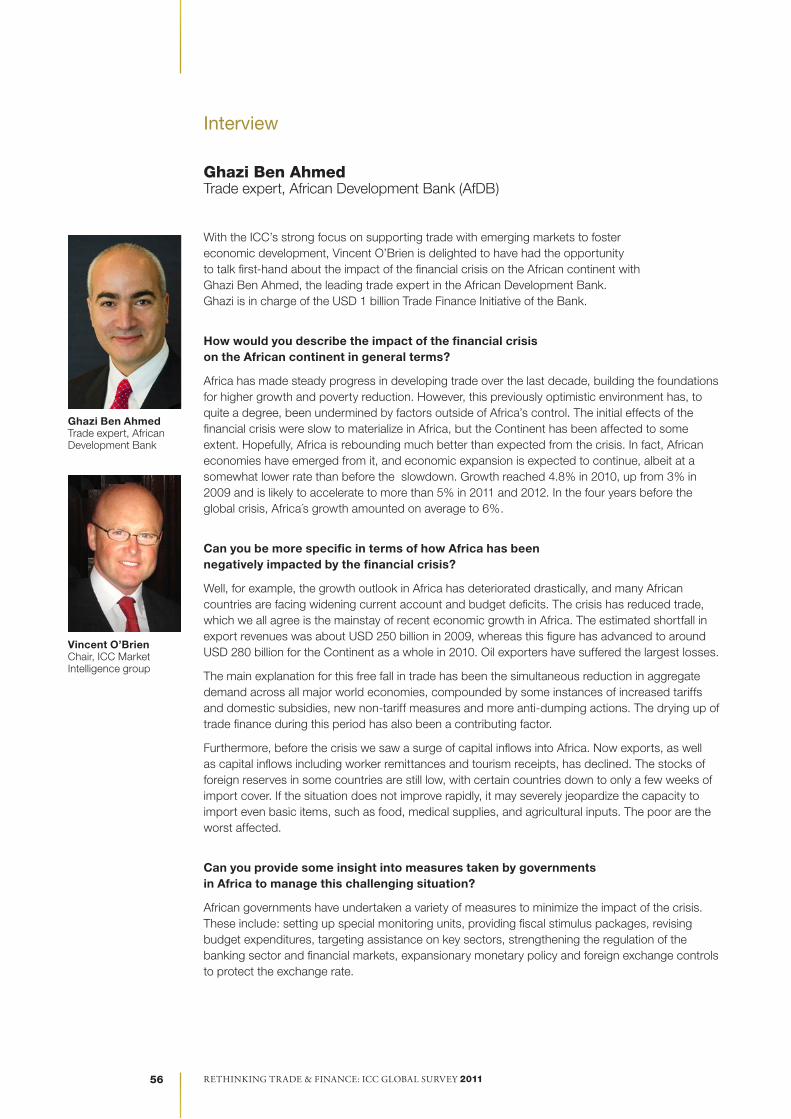
Interview with Gazi Ben Ahrmed (AfDB) 56
Multilateral investment banks: Conclusion 61
Section 5 Business trends in export credit insurance 61
Insuring risk to sustain global trade 61
Short-term capacity stable 62
Medium long term on a continued high level 62
Outlook 63
Coverage of trade finance instruments 63
Section 6 Impacts of the new regulatory regime 64
Background 64
Banks’ awareness of the new regulatory regime 64
Unintended consequences of the new regulatory regime for trade 65
Regulatory treatment of trade finance as a low-risk form of finance 66
ICC Survey 2011 points to key issues concerning the new regulatory regime 69
Recommendations 70
Section 7 The way forward and conclusion 72
Rethinking tRade & Finance: icc global SuRvey 2011 6
List of figures
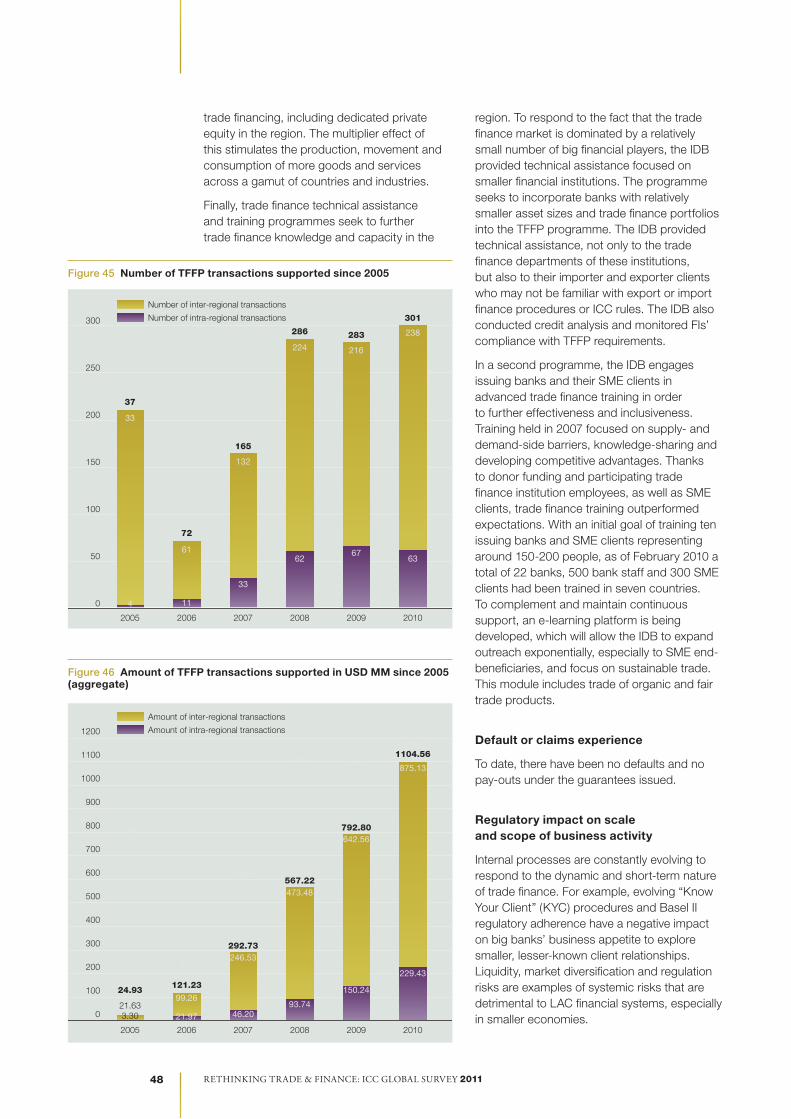
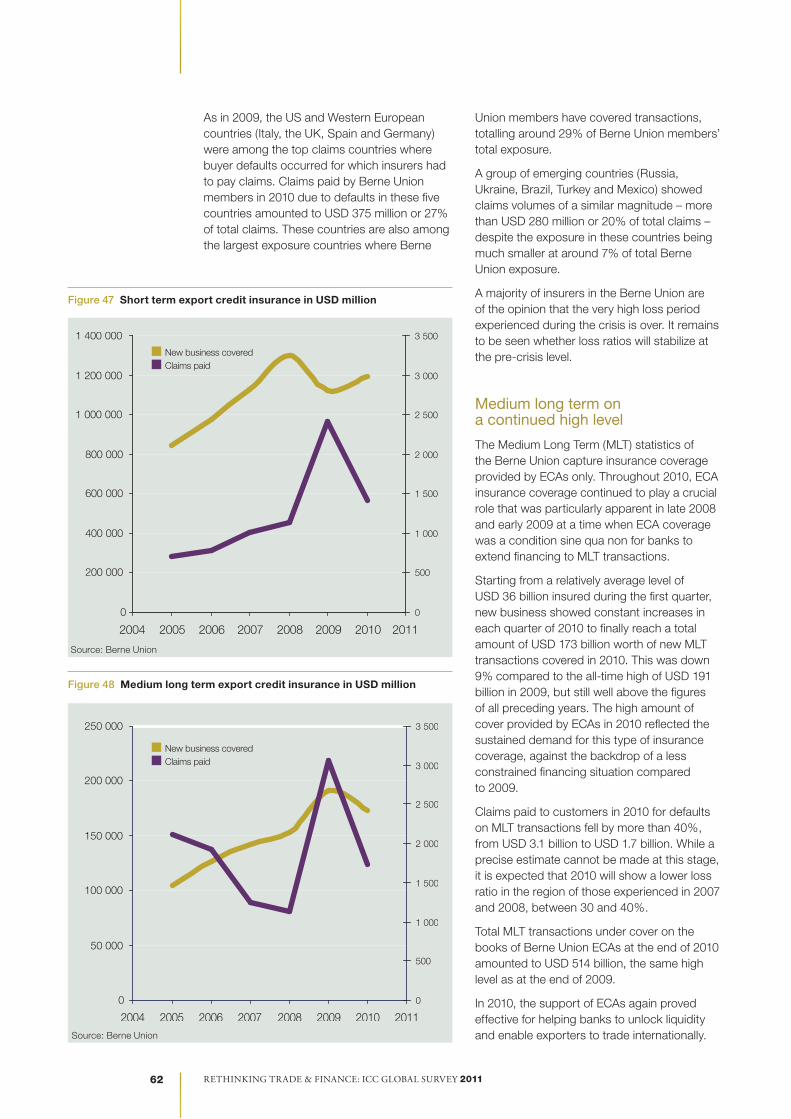
Figure 1 ICC 2011 Survey timetable 21 Figure 2 Location of respondents 22 Figure 3 Banks’ employee levels involved in processing trade finance transactions 22 Figure 4 Trade processing profile of ICC respondents 23 Figure 5 Export transaction volumes 23 Figure 6 Import transaction volumes 23 Figure 7 The global cycle, world trade 2007Q1 – 2010Q3 24 Figure 8 Trade recovery trend 25 Figure 9 Merchandise export volume 26 Figure 10 Coverage of trade restrictive measures for all WTO members 26 Figure 11 Value of trade finance activity between 2009 and 2010 29 Figure 12 Export processing volume trends – 2009 29 Figure 13 Import processing volume trends – 2009 29 Figure 14 Availability of trade finance 30 Figure 15 Product mix, by percentage, of international trade products handled by banks 31 Figure 16 Change in fees for issuance of bank undertakings 31 Figure 17 Requests for confirmations 32 Figure 18 Change in confirmation fees 32 Figure 19 Increased applicant pressure to refuse documents 33 Figure 20 Refused documents without seeking/accepting waiver 33 Figure 21 Increased number of spurious discrepancies 33 Figure 22 Claims under guarantees and standbys 33 Figure 23 Losses in traditional trade finance products versus general banking facilities 34 Figure 24 SWIFT trade traffic worldwide in number of messages, 2003-2010 35 Figure 25 SWIFT top 3 messages, 2008-2010 35 Figure 26 SWIFT trade traffic worldwide – comparison by month, 2009-2010 35 Figure 27 Comparing MT 700 with MT 734, 2008-2010 35 Figure 28 SWIFT MT 700 (Sent), issue of a documentary credit comparison, 2008-2010 36 Figure 29 Currency percentage breakdown for L/Cs, December 2010 36 Figure 30 Currency volume of L/Cs issued 37 Figure 31 SWIFT trade traffic by region (sent), 2008-2010, category 4 and 7 38 Figure 32 Traffic for Africa and Asia-Pacific 38 Figure 33 SWIFT trade traffic by region (received), 2008-2010, category 4 and 7 39 Figure 34 Africa and Asia-Pacific Export transactions received 39 Figure 35 Category 4 by region sent, 2008, 2009 & 2010 40 Figure 36 Category 7 by region sent, 2008, 2009 & 2010 40 Figure 37 SWIFT trade traffic: major recipient regions 2010 40 Figure 38 Trade traffic: Categories 4 & 7 cross-border messaging 2008, 2009 & 2010 (sent) 41 Figure 39 Trade traffic: Categories 4 & 7 cross-border messaging 2008, 2009 & 2010 (received) 41 Figure 40 SWIFT trade traffic (sent): East Asia and Pacific – South Asia, 2003-2010, category 4 and 7 41 Figure 41 SWIFT trade traffic (sent): Middle East and North Africa – Sub-Saharan Africa, 2003-2010, categories 4 and 7 42 Figure 42 SWIFT trade traffic: by region (sent), 2003-2010, category 4 and 7 42 Figure 43 Multilateral development bank programmes 43 Figure 44 Key trade flows in the CIS (in annual percentage change) 44 Figure 45 Number of TFFP transactions supported since 2005 48 Figure 46 Amount of TFFP transactions supported in USD MM since 2005 (aggregate) 48 Figure 47 Short term export credit insurance in USD million 62 Figure 48 Medium long term export credit insurance in USD million 62 Figure 49 Bank’s awareness of Basel III 65 Figure 50 Will Basel III cause your bank to reassess trade products? 65 Figure 51 Perception of the impact of Basel III 65 Figure 52 Average rate of default on traditional trade products, 2005-2009 (%) 68 Figure 53 South-South Trade 1996-2008 72
Rethinking tRade & Finance: icc global SuRvey 2011 Rethinking tRade & Finance: icc global SuRvey 2011 7
List of acronyms
ADB Asian Development Bank
AfDB African Development Bank
BAFT Bankers Association for Finance and Trade
BCBS Basel Committee on Banking Supervision
BIS Bank for International Settlements
Bp Basis Point
BRIC Fast-growing developing economies of Brazil, Russia, India, and China
EBRD European Bank for Reconstruction and Development
ECA Export Credit Agency
EUR Euro
GDP Gross Domestic Product
ICC International Chamber of Commerce
IDB Inter-American Development Bank
IFC International Finance Corporation
Ifo Institute for Economic Research
IFSA International Financial Services Association
ILO International Labor Organization
IMF International Monetary Fund
LCs Letters of credit
LGD Loss given default
LICs Lower income countries
MDB Multilateral Development Bank
MDGs Millennium Development Goals
MIC Middle-Income Countries
PRC People’s Republic of China
SME Small and Medium-sized Enterprise
SWIFT Society for Worldwide Interbank Financial Telecommunication
UCP Uniform Customs and Practices for Documentary Credits (ICC Rules)
UK United Kingdom
USD United States Dollar
WTO World Trade Organization
Rethinking tRade & Finance: icc global SuRvey 2011 8
Rethinking tRade & Finance: icc global SuRvey 2011 Rethinking tRade & Finance: icc global SuRvey 2011 9
The year 2010 was the year of recovery for world trade, with global trade in volume having grown by at least 13.5%. It is also expected to grow at a sustained rate in 2011. Trade finance markets which, during the worst of the financial crisis, have been a significant cause of the “big trade collapse”, are returning to more normal conditions. However, traders at the “periphery” of grand trade routes, particularly low-income countries, remain subject to serious difficulties in accessing trade finance at an affordable cost. Small- and medium-sized enterprises, wherever they operate, also suffer from more difficult access to trade credit.
In the midst of the financial crisis, we at the G-20 Summit in London decided to mobilize USD 250 billion in additional short-term trade finance to restore confidence in the trade finance markets. What is needed now is a more targeted use of resources, focusing on the poorer countries and small and medium-sized enterprises around the world. They should not be paying the high price for the repair and re-regulation of the global finance industry.
In view of the remaining difficulties for these actors, World Bank President Robert Zoellick and I, with the support of the heads of multilateral development banks, drew the attention of the international community to this problem. At the G-20 Seoul Summit in November 2010, the heads of states and governments adopted a Declaration which, in paragraph 44 (Fighting Protectionism and Promoting Trade and Investment section), stated: “To support LIC capacity to trade (...), we note our commitment to (…) support measures to increase the availability of trade finance in developing countries, particularly LICs. In this respect, we also agree to monitor and to assess trade finance programmes in support of developing countries, in particular their coverage and impact on LICs, and to evaluate the impact of regulatory regimes on trade finance.”
Monitoring these developments requires data. In the absence of a comprehensive set of international statistics for trade finance, the International Chamber of Commerce continues to provide a much-needed contribution by preparing useful data through its Market Intelligence Survey on trade finance, taking advantage of its large membership across the world. The results of this fourth Survey have relied on a more robust participation of banks in a large number of countries.
ICC has also made great progress in developing an ICC Register on Trade Finance. This initiative is particularly useful in providing evidence that trade finance is safe and worth promoting. I therefore welcome the publication of the ICC’s Banking Commission new Market Intelligence Survey focusing on developments in trade finance in 2010, as well as the upcoming progress on the Register. These will be useful inputs to our efforts to improve conditions for the functioning of the trade finance market.
I take this occasion to thank ICC for their contribution to the work of the WTO Expert Group on Trade Finance and count on their continued involvement during the course of 2011.
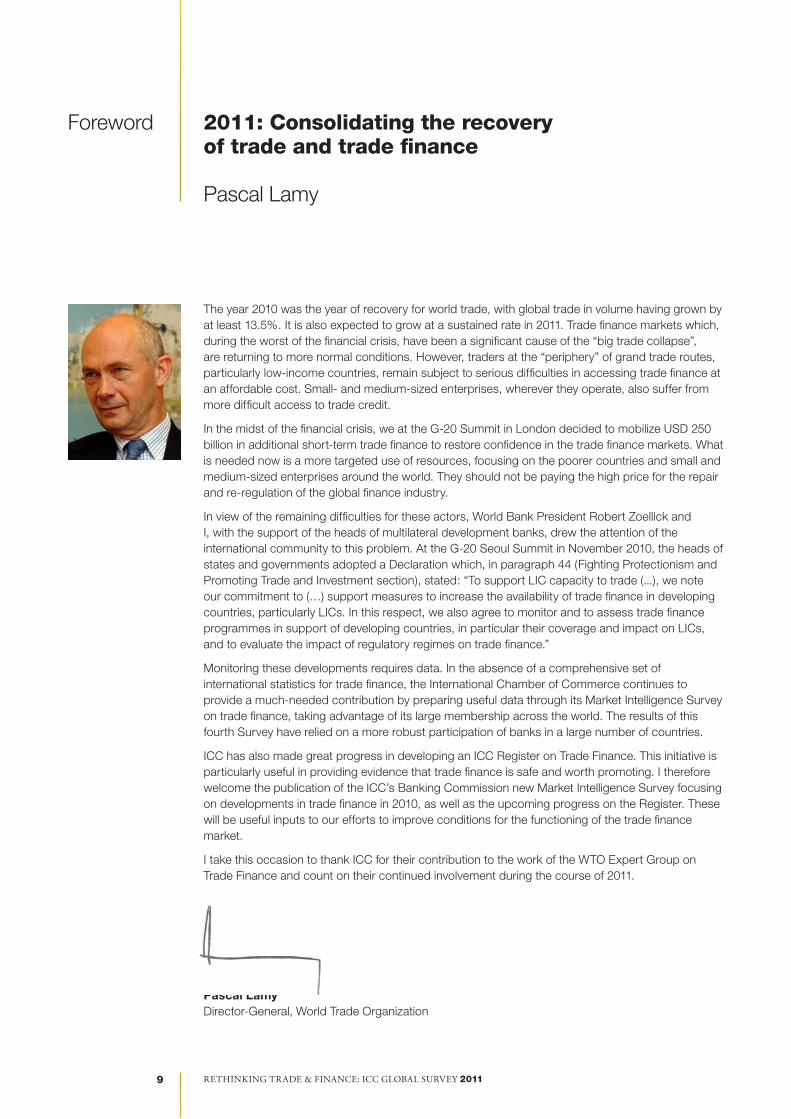
Pascal LamyDirector-General, World Trade Organization
Foreword 2011: Consolidating the recovery of trade and trade finance
Pascal Lamy
Rethinking tRade & Finance: icc global SuRvey 2011 10
Introduction ICC Banking Commission: Three years of leadership bridging the information gap
Thierry Senechal
We are pleased to release the International Chamber of Commerce’s (ICC)’s latest edition of Rethinking Trade & Finance, the annual Survey of global trade & finance. In these Surveys our aim is to provide leaders with independent, accurate and in-depth analysis of trends in trade finance to keep them at the forefront of industry knowledge.
More than ever, our increasingly interconnected and interdependent world faces far-reaching uncertainties. The financial crisis in recent years has demonstrated that events that were formerly localized or isolated now have systemic global consequences. Now we are also facing major risks of disruptions as a consequence of the political turmoil in Africa and the Middle East and the fears concerning the nuclear crisis in Japan.
These are important times for our industry, and they require that we remain updated and informed. The ICC Global Surveys have become an important information source enabling bankers, traders and government officials to gain an accurate snapshot of the trends prevailing in the markets and to gauge future expectations for global trade.
In this Survey, completed in collaboration with leading international institutions, we have brought together some of the most forward-thinking industry experts in banking and international institutions to scan the world for signs of change in business and trade and to help our members make sense of emerging patterns and their implications.
Because these changes are accelerating – driven by revolutionary technologies, fast-moving emerging markets and collapsing products and firms – the ICC Survey 2011 provides an enhanced regional focus, with exclusive data provided from emerging economies. In the past, we have been successful in presenting a global picture of trade and finance. It is logical that we now offer cutting-edge information on regional developments.
ICC Global Surveys: Gathering market intelligence
How do financial institutions and policy makers respond to the worst financial crisis in decades and develop policies to restore trade to normal levels? They first need to focus on improving market intelligence so that future financial decisions can be based on solid evidence.
In 2008, there was no knowledge management tool at the aggregate industry level that could provide an overview of the pressing needs for accessible trade finance, one that could clarify the links between trade finance and economic growth. Apart from the piecemeal data available for some market segments or particular regions, no global aggregates were available. Nor did the industry formally document information or experience that could be useful to others, especially during periods of crisis.
The ICC Global Surveys were made possible when the World Trade Organization (WTO) asked ICC to provide data for the G-20 meeting of world leaders at their first economic Summit, held in 2008 in Washington, DC. The WTO Expert Group on Trade Finance became an important forum during the crisis, holding regular meetings with partners from commercial banks, the Berne Union, regional development banks and other multilateral export credit and specialized agencies. This group, of which ICC was a member, was instrumental in understanding the causes of the shortage of trade finance and in devising cooperative solutions through which public institutions could help private sector financial institutions shoulder the risk of operating in an unstable financial environment.
In 2008, when planning the Surveys, ICC foresaw that the work would be most beneficial when acquired from the greatest number of sources and disseminated to the widest possible audience.
Rethinking tRade & Finance: icc global SuRvey 2011 Rethinking tRade & Finance: icc global SuRvey 2011 11
Impact of ICC Surveys
The ICC Global Surveys were important for many reasons. They were conducted at a crucial time for the global economy, during a period of uncertainty about the course of economic recovery, during which major economic policy and financial regulatory reforms were at the centre of G-20 Summit discussions.
These factors rendered the Surveys influential in several ways:
n They collected feedback on the timing and the calibration of reforms, helping policy makers to achieve the right balance between stability and growth. In fact, the information was used to formulate coordinated and targeted measures to stimulate trade finance markets and to prioritize the direction of available support. WTO Director-General Pascal Lamy confirmed that ICC research ahead of the 2009 G-20 Summit in London “contributed to help leaders make informed decisions on a support package for trade finance”.
n In their comprehensiveness, the Surveys included full industry representation and coverage. The present 2011 Survey, for example, received responses from representatives of 210 banks in 94 countries – a 30% increase over the 2010 Survey. More important, the Surveys were conducted in partnership with eminent international institutions – the World Bank, SWIFT, the Berne Union, the European Bank for Reconstruction and Development (EBRD), the International Finance Corporation (IFC), the Asian Development Bank (ADB), the African Development Bank (AfDB), and the Inter-American Development Bank (IADB).
n These institutions provided the backup enabling ICC to propose specific mitigation measures to policy makers and to engage in a dialogue with regulators. The issues involved in financial regulation and the elements of policy change are highly complex and require an understanding on all sides. ICC collected relevant market intelligence so that policy decisions could be evidence-based. By obtaining information from the private sector, governments, multilateral financial institutions, and official bilateral credit agencies, the Surveys were a unique tool encouraging the parties to develop a mutual understanding of the issues with a view to reaching a consensus on processes and a new regulatory framework.
The increasing role of the ICC Banking Commission in trade and finance
The work of the ICC Banking Commission involves more than the production of pertinent market intelligence.
Around 80% of total trade transactions, estimated at USD 16 trillion, involve a form of credit, insurance or guarantee. Trade finance covers a spectrum of payment arrangements between importers and exporters, the ICC’s universally used rules on documentary credits, Incoterms and demand guarantees, plays an active role in facilitating trade.
Despite the serious impacts of the financial crisis, countries must continue to trade. The availability of trade finance is critical to the sustenance of emerging markets, especially for small- to medium-sized enterprises that rely on short-term trade finance for their trading activities.
Over the years, the Banking Commission has become a leading global rule-making body for the banking industry, not only producing universally accepted rules and guidelines for international banking practice, but also providing leading edge research and analysis. With over 600 members in 85 countries, many of them emerging, the Banking Commission is one of the largest worldwide groupings of trade finance experts. Their common aim is to facilitate trade finance worldwide.
The Banking Commission’s work is now more important than ever. International trade has evolved dramatically pre- and post-crisis, and trade instruments, embracing innovative, technology-based solutions, has become an essential component of trade finance.
Trade finance products have significantly different risk profiles, default rates and capital uses from other corporate products. Traders and producers in developing countries with weak institutions are generally more reliant on bank-intermediated trade finance than their peers in developed markets. The vast majority of trade financed from low-income countries employs traditional trade products such as letters of credit (L/Cs) and guarantees. In regions such as Africa, Asia, and Latin America, L/Cs are widely used and are the principal instruments of finance. The smaller the trader, the more
Rethinking tRade & Finance: icc global SuRvey 2011 12
inclined they are to use L/Cs. Without this means of finance, many SMEs, which provide the vast majority of export trade, would not be able to finance their operations.
Consequently, it is not surprising that trade finance is considered to be the lifeblood of trade. This is the reason the ICC Banking Commission, the source of the most widely used rules on trade finance, has been accepted as a recognized authority on global trade and finance.
Becoming a partner helping policy makers to design the next generation of banking regulations
The ICC Banking Commission has consistently advocated a fair and rules-based multilateral trading system that would work to the benefit of nations at all levels of development.
ICC re-affirms its intention to maintain a constructive dialogue with policy makers and regulators worldwide. As a source of meaningful industry information on trade and finance, we believe we can make a valuable contribution to discussions concerning how key regulatory regimes are designed and implemented in a dynamic international environment.
We trust readers will find the information in the following pages helpful to both business and governments, enabling leaders to think more creatively about the ways trade is conducted and regulated.
Rethinking tRade & Finance: icc global SuRvey 2011 Rethinking tRade & Finance: icc global SuRvey 2011 13
Executive summary A continuing tradition of providing leading information on trade and finance
This 2011 ICC Global Survey received responses from representatives of 210 banks located in 94 countries. This represents a 30% increase over the 2010 Survey in the number of banks that have submitted opinions and statistics concerning the current trade finance landscape in their respective countries.
Since the Survey attracted comments from an additional 19 countries, when compared with the 2010 Survey, the results are again displayed on a global basis rather than drawing comparisons between responses from banks in Europe, Asia and North America, which were the major contributors to the 2009 Survey.
Recovery is taking place globally
The ICC Surveys 2009 and 2010 revealed that bank-intermediated trade finance was severely affected by the financial crisis. During 2008-2009, global trade fell by 23% or USD 3.5 trillion in value, and banks significantly reduced the availability of trade finance to shore up capital positions.
The 2011 Survey shows that trade flows have rebounded in many regions. Most experts agreed that business has been significantly improving since the final quarter of 2009. Markets in several advanced economies are quickly returning to normal trading conditions, in terms of liquidity and the availability of trade finance. Similar improvements are to be seen in the acceptance of risk and in pricing. On the whole, the recovery is being driven by increased trade within North America, Europe and Asia, and between Asia and the rest of the world.
Unfortunately, the recovery has been uneven, and several regions, particularly in Africa, continue to experience markets under stress. Moreover, traders in many low-income countries still have considerable difficulty accessing trade finance at an affordable cost, particularly for import finance. One positive development is that the average price for L/Cs in large emerging economies fell from 150-250 basis points in 2009 to 70-150 basis points in 2010.
In Asia and Latin America, liquidity has returned, but there is still a market gap resulting from a general deterioration in the credit-worthiness of traders, coupled with greater risk aversion by commercial banks. As a result, the cost of trade finance in these regions remains disturbingly high.
The supply of trade finance has significantly improved both in value and volume
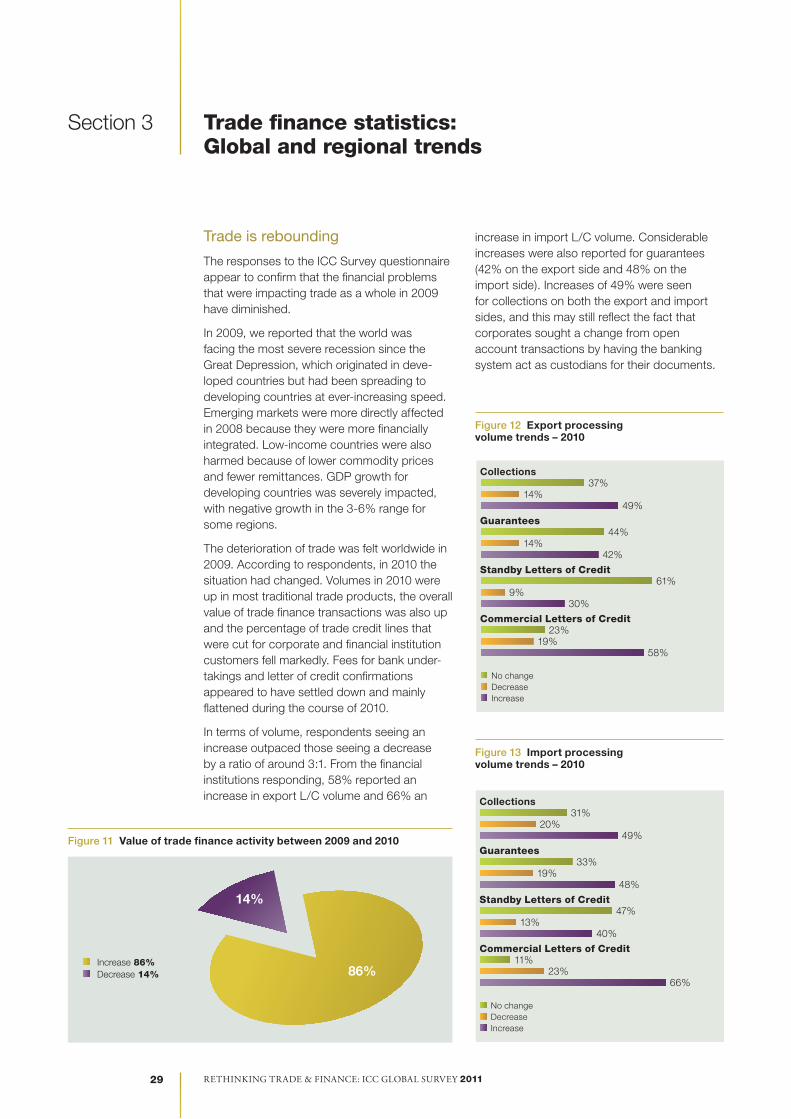
In 2010, according to respondents, both the volumes and the overall value of trade finance transactions increased. The percentage of trade credit lines that were cut for corporate and financial institution customers fell markedly. Fees for bank undertakings and L/C confirmations appear to have settled down and mainly flattened during the course of 2010.
Respondents reporting an increase outpaced those reporting a decrease by a ratio of around 3:1. Some 58% of the financial institutions responding reported an increase in export L/C volume and 66% an increase in import L/C volume. Considerable increases were also reported for guarantees (42% for exports and 48% for imports).
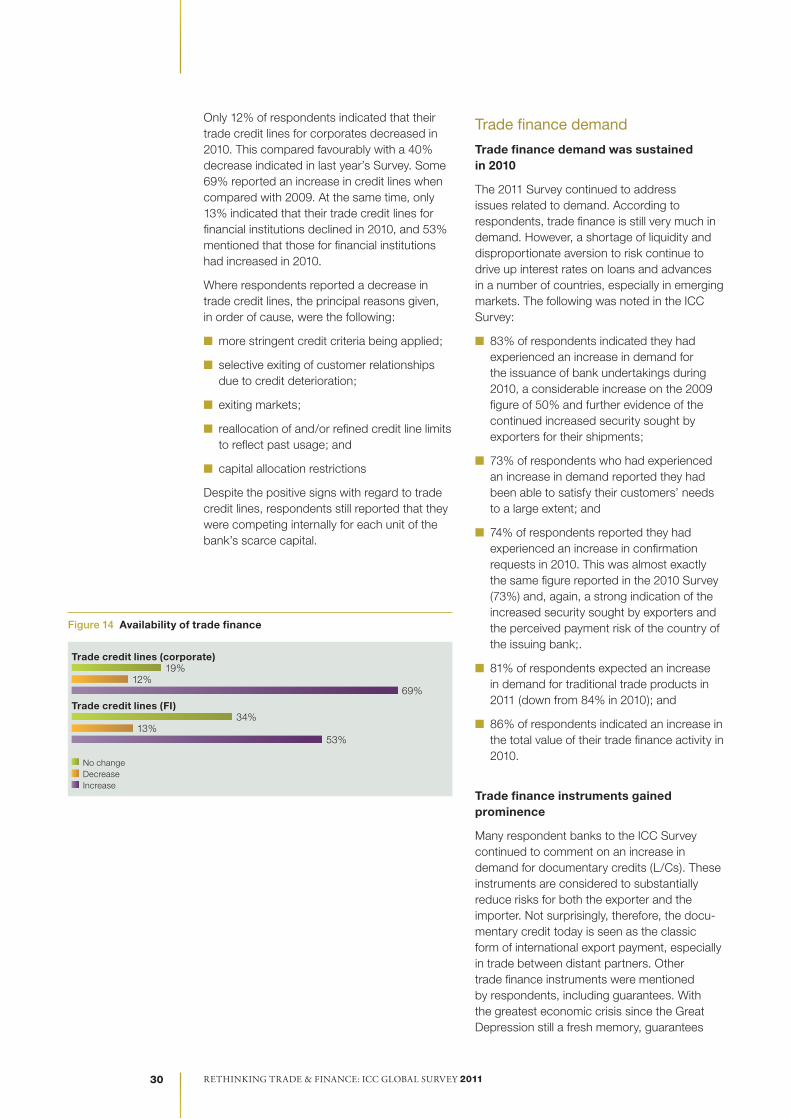
Increases of 49% were seen for collections for both the exports and imports. This may reflect the fact that corporates sought a change from open account transactions by having the banking system act as custodians for their documents. Only 12% of respondents indicated that in 2010 their trade credit lines for corporates decreased. This compared favourably with a 40% decrease reported in the 2010 Survey.
Rethinking tRade & Finance: icc global SuRvey 2011 14
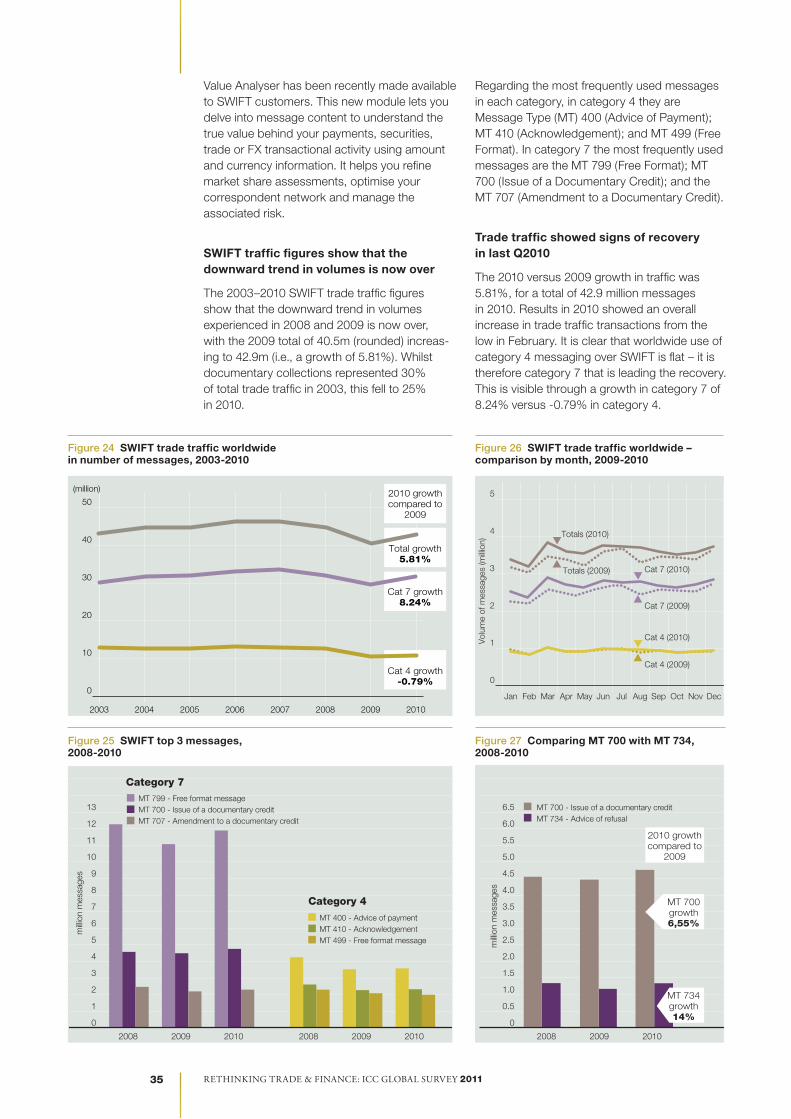
The 2003–2010 SWIFT trade traffic figures also show that the downward trend in volumes experienced in 2008 and 2009 has ended; the 2009 message volume of 40.5m (rounded) increased to 42.9m (i.e. a growth of 5.81%). Whilst documentary collections represented 30% of total trade traffic in 2003, this fell to 25% in 2010.
According to SWIFT, the regions show uneven results
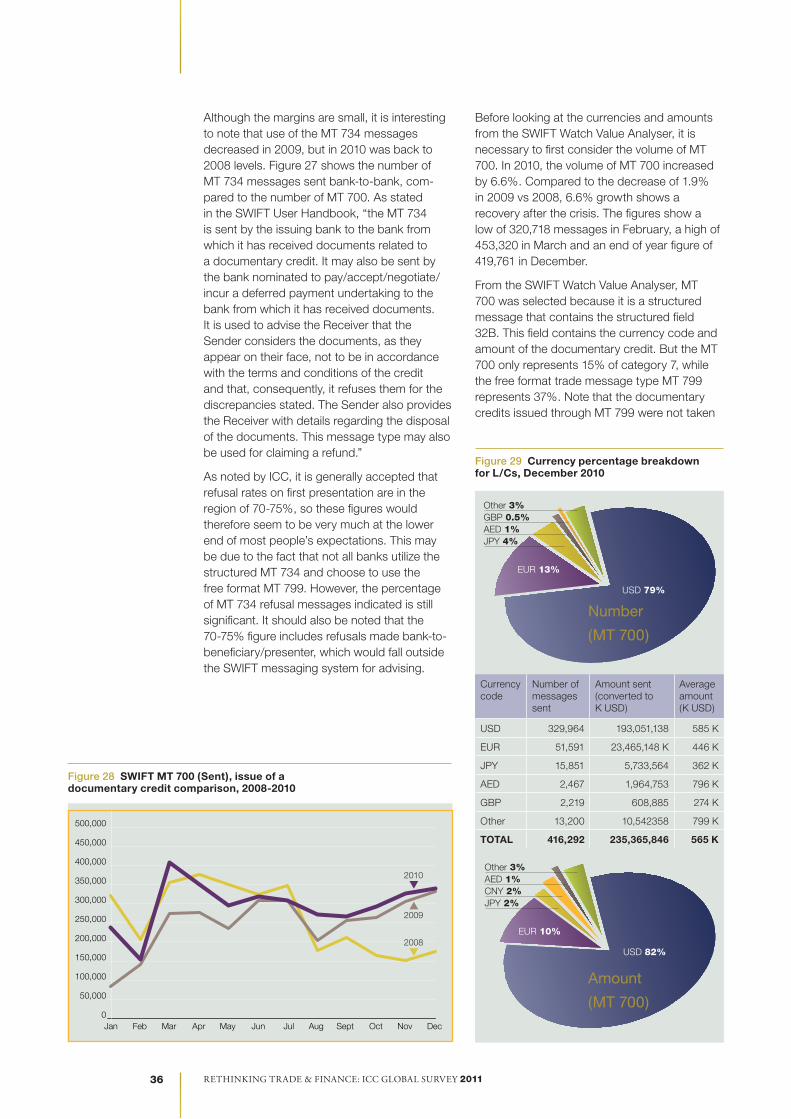
In December 2010, Asia-Pacific was the region initiating 64% of the import transactions, sending almost 64% of the MT 700 messages (in volume), followed by the Europe–Eurozone with 11%. But in average value (converted in K USD), these two regions were not the most important.
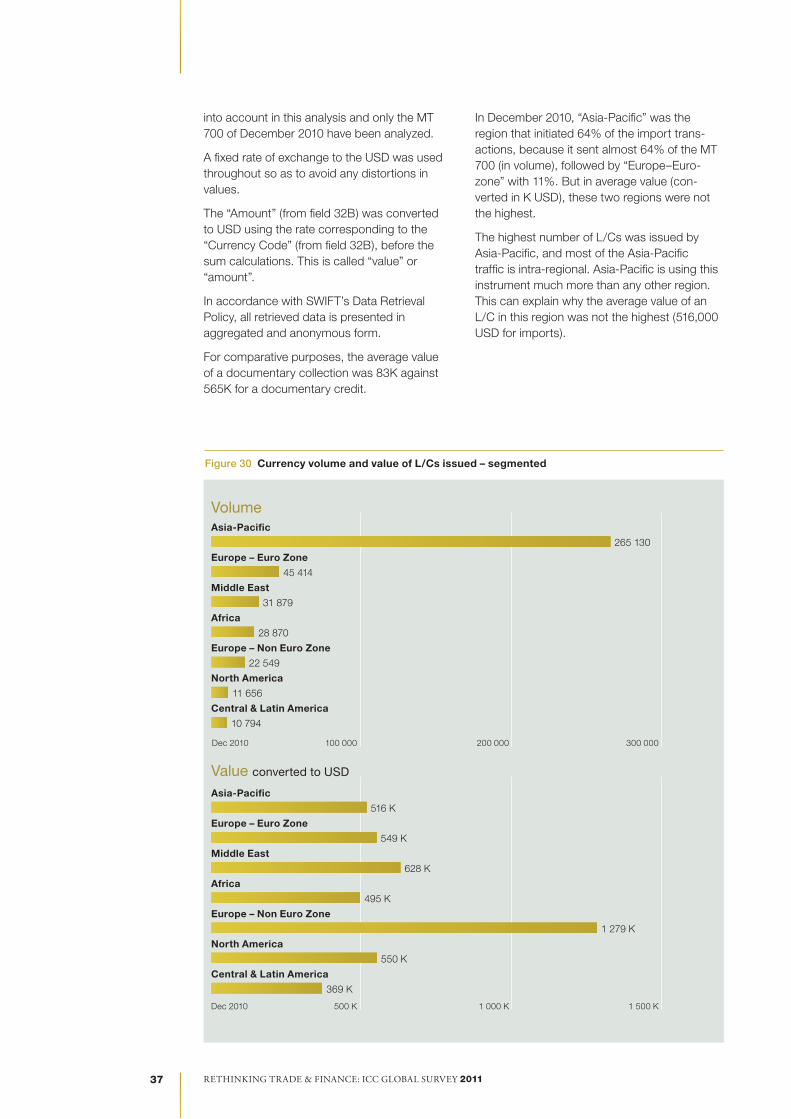
The greatest number of L/Cs were issued in the Asia-Pacific countries, with most of this traffic consisting of intra-regional transactions. The region has been using L/Cs more than any other. At the same time, the average value of an L/C in the region is not the highest (516,000 USD for imports).
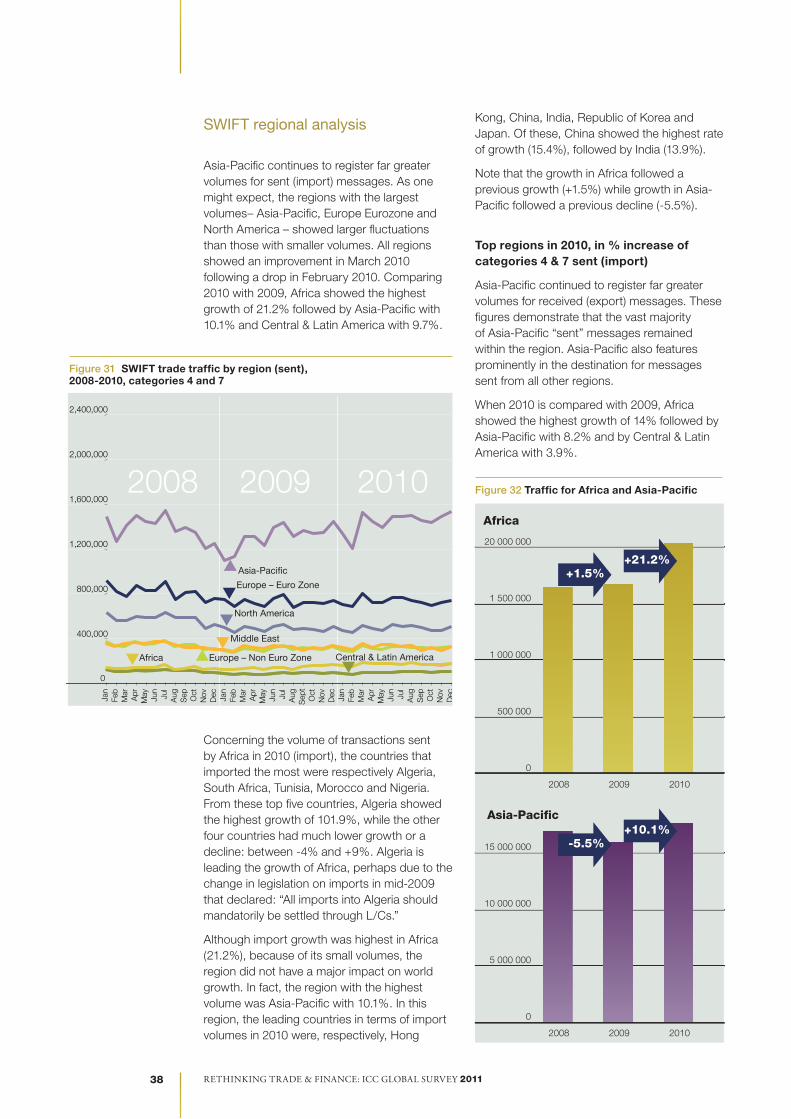
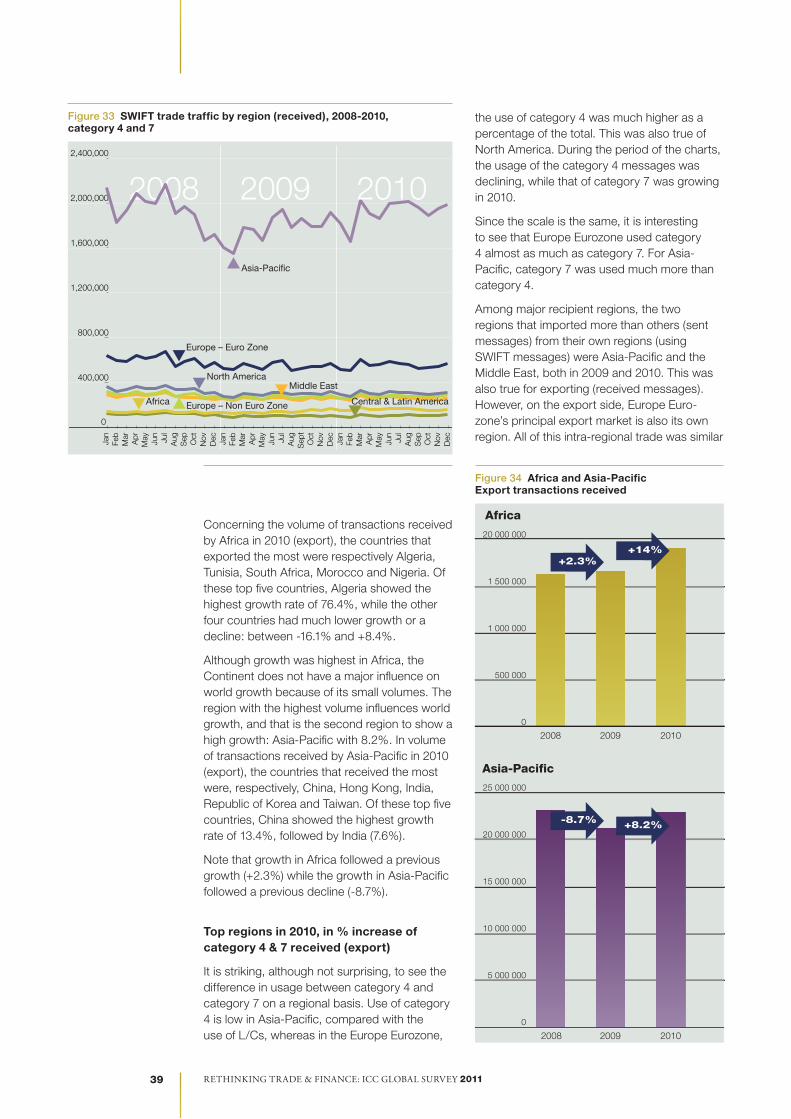
Asia-Pacific continues to register far greater volumes of sent (import) messages than any other region. As one might expect, the regions with the largest volumes – Asia-Pacific, Europe Eurozone and North America – show larger fluctuations than those with smaller volumes, though all regions showed an improvement in March 2010 following a drop in February 2010. When 2010 was compared with 2009, Africa showed the largest growth (21.2%) followed by Asia-Pacific (10.1%) and Central & Latin America (9.7%).
With regard to volumes of import transactions by African countries in 2010, the countries importing the most were, respectively, Algeria, South Africa, Tunisia, Morocco and Nigeria. Of these five, Algeria showed the highest growth (101.9%), with the other four showing much lower growth or a decline: between -4% and +9%. Algeria’s lead in import growth in Africa is likely due to changes made in mid-2009 in the country’s legislation concerning imports, mandating that all the country’s imports be settled by L/Cs.
Although import growth was highest in Africa (21.2%), because of its small volumes, the region does not have a major impact on world growth. In fact, the region with the highest volume was Asia-Pacific with 10.1%. In this region, the leading countries in terms of import volumes in 2010 were, respectively, Hong Kong, China, India, Republic of Korea and Japan. Of these, China showed the highest rate of growth (15.4%), followed by India (13.9%).
Note that the growth in Africa followed a previous year of growth (+1.5%), while growth in Asia-Pacific follows a previous decline (-5.5%).
Trade finance demand was sustained in 2010
The 2011 Survey continued to address issues related to demand. According to respondents, trade finance is still very much in demand.
n 83% of respondents indicated they had experienced an increase in demand for the issuance of bank undertakings during 2010, a considerable increase on the 2009 figure of 50% and further evidence of the continued increased security sought by exporters for their shipments;
n 73% of respondents that had experienced an increase in demand reported they had been able to satisfy their customers’ needs to a large extent; and
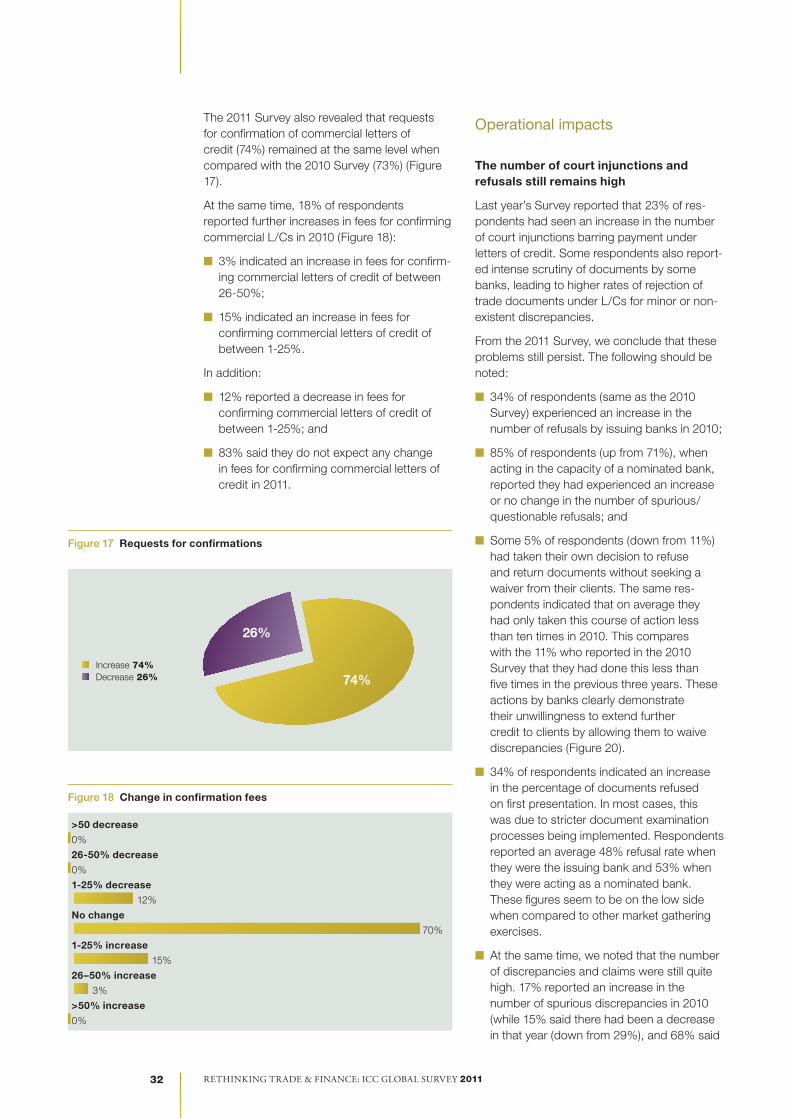
n 74% of respondents reported they had experienced an increase in L/C confirmation requests in 2010.
Traditional trade finance instruments gained prominence
Many respondent banks to the ICC Survey continued to report an increase in demand for documentary credits. These instruments are considered to substantially reduce risks for both exporter and importer. Not surprisingly, therefore, today the L/C is considered to be the classic form of international export payment, especially in trade between distant partners.
Rethinking tRade & Finance: icc global SuRvey 2011 Rethinking tRade & Finance: icc global SuRvey 2011 15
ICC noted that there was an increased demand for implementation of ICC rules governing trade finance. For instance, there were increased demands for training on the use of the Uniform Rules for Demand Guarantees (URDG), which apply to billions of US dollars of guarantees securing monetary and performance obligations in a wide array of international and domestic contracts. The same trend existed for UCP rules on documentary credits.
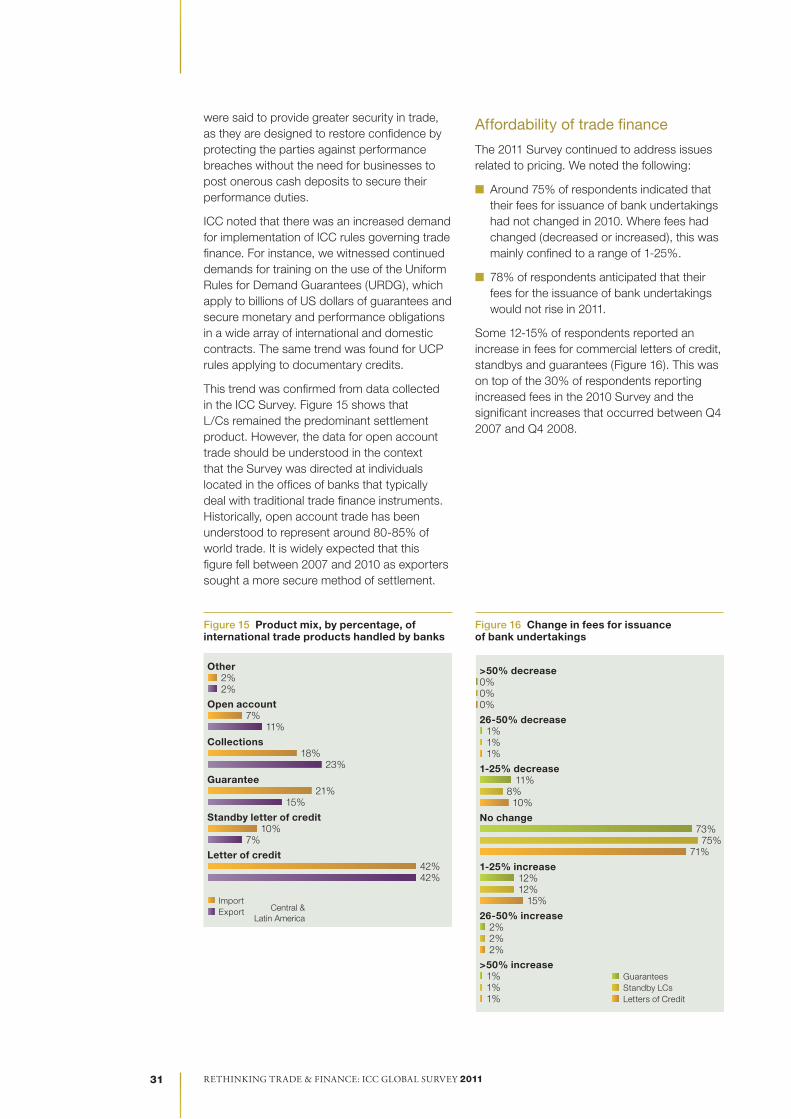
Affordability of trade finance
The 2011 Survey continued to address issues related to pricing.
n Around 75% of respondents indicated that their fees for issuing bank undertakings had not changed in 2010. Where fees had changed (decreased or increased), this was mainly confined to a range of 1-25%.
n 78% of respondents anticipated that their fees for the issuance of bank undertakings would not rise in 2011.
Nonetheless, 12-15% of respondents indicated an increase in fees for commercial letters of credit, standbys and guarantees.
There is still intense scrutiny of documents, leading to a large number of refusals. Levels of court injunctions have also increased
Last year’s Survey reported that 23% of respondents had seen an increase in the number of court injunctions barring payment under letters of credit. At the time, some respondents also reported intense scrutiny of documents by some banks, eventually leading to higher rates of rejection of trade documents under L/Cs for minor or non-existent discrepancies.
From the 2011 Survey, we conclude that these problems still persist.
n 34% of respondents (same as in the 2010 Survey) experienced an increase in the number of refusals by issuing banks in 2010;
n When acting in the capacity of a nominated bank, 85% of respondents (up from 71%), reported they had experienced an increase or no change in the number of spurious/questionable refusals; and
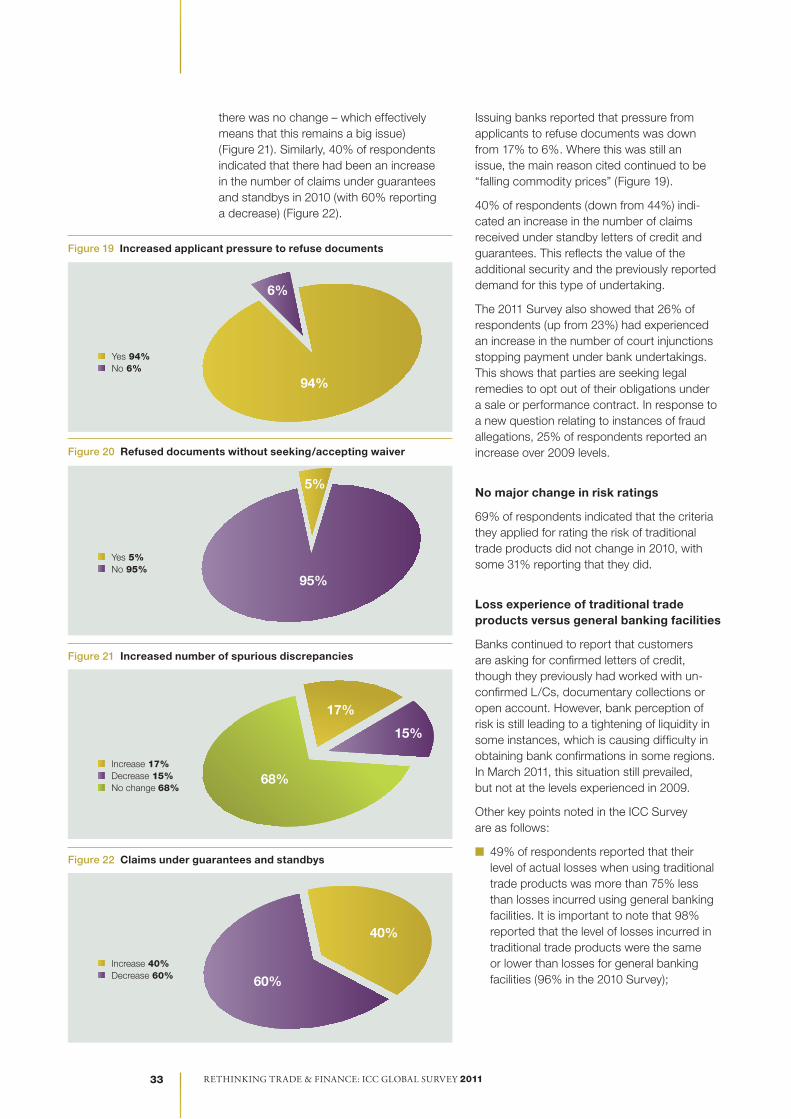
n Some 5% of respondents (down from 11%) had taken their own decision to refuse and return documents without seeking a waiver from their clients. The same respondents indicated that on average they had taken this course of action less than ten times in 2010. This compares with the 11% who, in the 2010 Survey, reported they done so less than five times in the previous three years. These actions by banks clearly demonstrate their unwillingness to extend further credit to clients by allowing them to waive discrepancies.
The 2011 Survey also showed that 26% of respondents (up from 23%) had experienced an increase in the number of court injunctions stopping payment under bank undertakings. This indicates that parties are seeking legal remedies to opt out of their obligations under a sale or performance contract.
40% of respondents (down from 44%) reported an increase in the number of claims received under standby letters of credit and guarantees. This reflects the value of the additional security and the previously reported demand for this type of undertaking.
ICC has demonstrated to regulators that trade finance is safer than they thought
Three years ago, we experienced considerable difficulty in collecting comprehensive data from trade finance markets. Today, we are in a different position. When the crisis developed in 2007, the ICC Banking Commission expressed concern to policy makers and regulators that trade finance had been severely affected and that specific measures would be required to restore liquidity and trust in the markets. But at the same time, we had little or no documented evidence concerning the contraction in trade.
Rethinking tRade & Finance: icc global SuRvey 2011 16
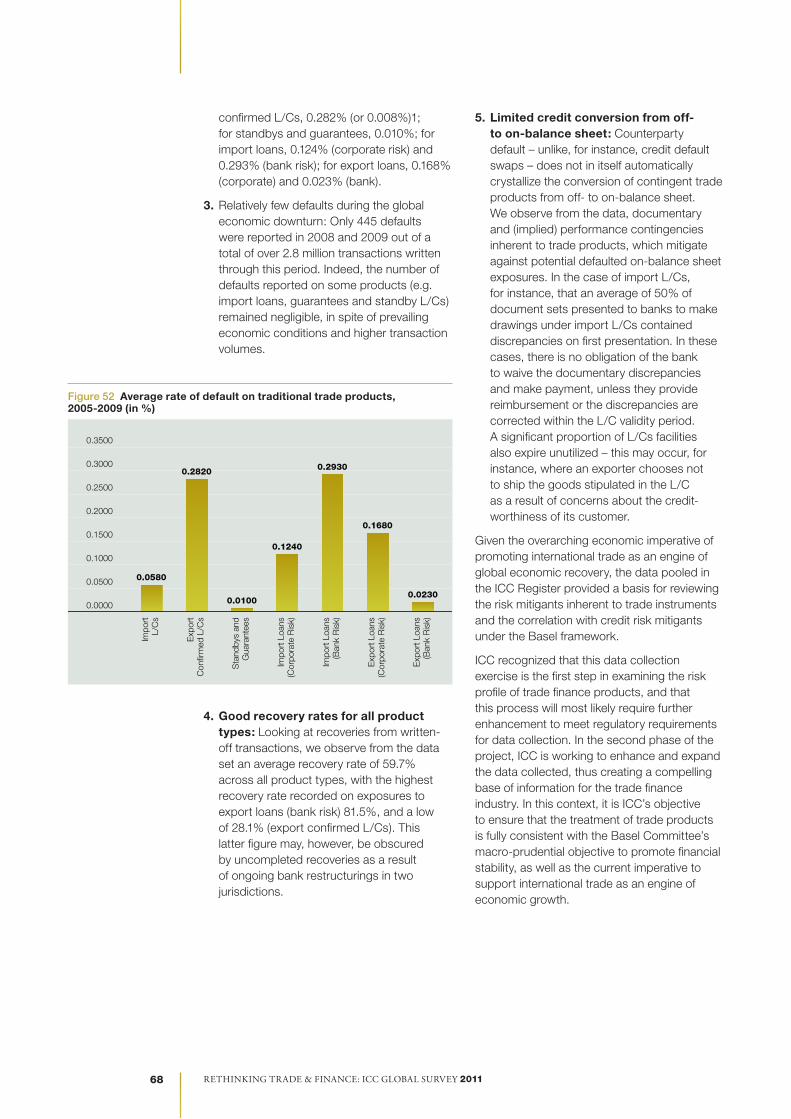
In 2010, ICC designed a Register to collect performance data on trade and finance. The ICC Register looking at the default risk of trade finance instruments between 2005 and 2009 – and pooling trade finance performance data covering a total of 5.2 million transactions with a total value of over USD 2.5 trillion – found that off-balance sheet trade finance transactions had an average tenor of just 80 days and an insignificant incidence of default. Even during the global economic downturn these transactions experienced relatively low levels of default, with fewer than 500 defaults for 2.8 million transactions. For written-off products, recovery rates averaged 60% for all product types.
The new regulatory regime may have important unintended consequences
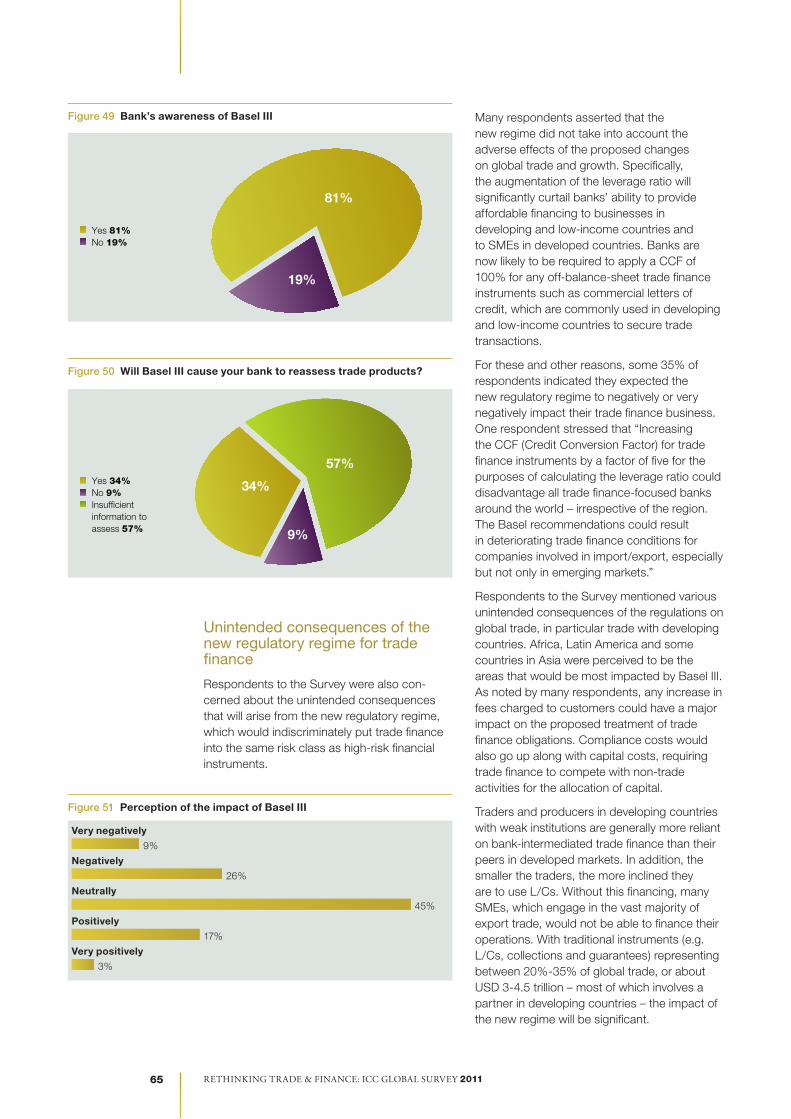
In the present Survey, 81% of respondents indicated that their financial institution was aware of the new regulatory regime imposing new capital, liquidity and leverage requirements on all banking activities. When asked the question “Do you anticipate that the Basel III requirements will cause your bank to re-assess its trade finance strategy and products?”, 34% of respondents indicated that they would.
An alarming 57% of respondents said they lacked sufficient information on new regulatory requirements at this stage. This indicates the existence of an information gap between the industry and policy makers. Some 35% of respondents said they expected the Basel III requirements to negatively or very negatively impact their trade finance business.
Altogether, 31% of respondents indicated that in 2010 regulatory constraints negatively affected their business. As one example, 27% of respondents said they had considered closing correspondent relationships in 2010 due to the increasing cost of compliance (including more stringent KYC rules).
Not surprisingly, ICC respondents have been seriously concerned about the unintended consequences that could arise from the new regulatory regime, which indiscriminately puts trade finance in the same risk class as other high-risk financial instruments.
According to the respondents, the increase in the leverage ratio under the new regime would significantly curtail their banks’ ability to provide affordable financing to businesses in developing countries and to SMEs in developed countries. In the calculation of the leverage ratio, banks are now likely to be required to apply a CCF of 100% for any off-balance-sheet trade finance instruments such as commercial letters of credit, which are commonly used in developing and low-income countries to secure trade transactions.
In addition to the problem posed by the new leverage ratio, ICC respondents indicated that there should be reconsideration of the Basel rules in respect of the one-year maturity floor applied to trade assets under the advanced model. Substantial ICC research has shown the low risk, self-liquidating nature of trade finance.
Multilateral developments banks are playing a vital role
Respondents, including many ICC Banking Commission members, underscore the importance of targeted temporary financing and, in some cases, agreements with international banks to address liquidity shortages and problems of risk perception.
The role played by the development banks in supporting international trade and finance is accelerating at a greater pace than increases in trade volumes. These banks’ initial stance of providing risk coverage has now been supplemented by innovative solutions to provide liquidity and to fill market gaps as they arise.
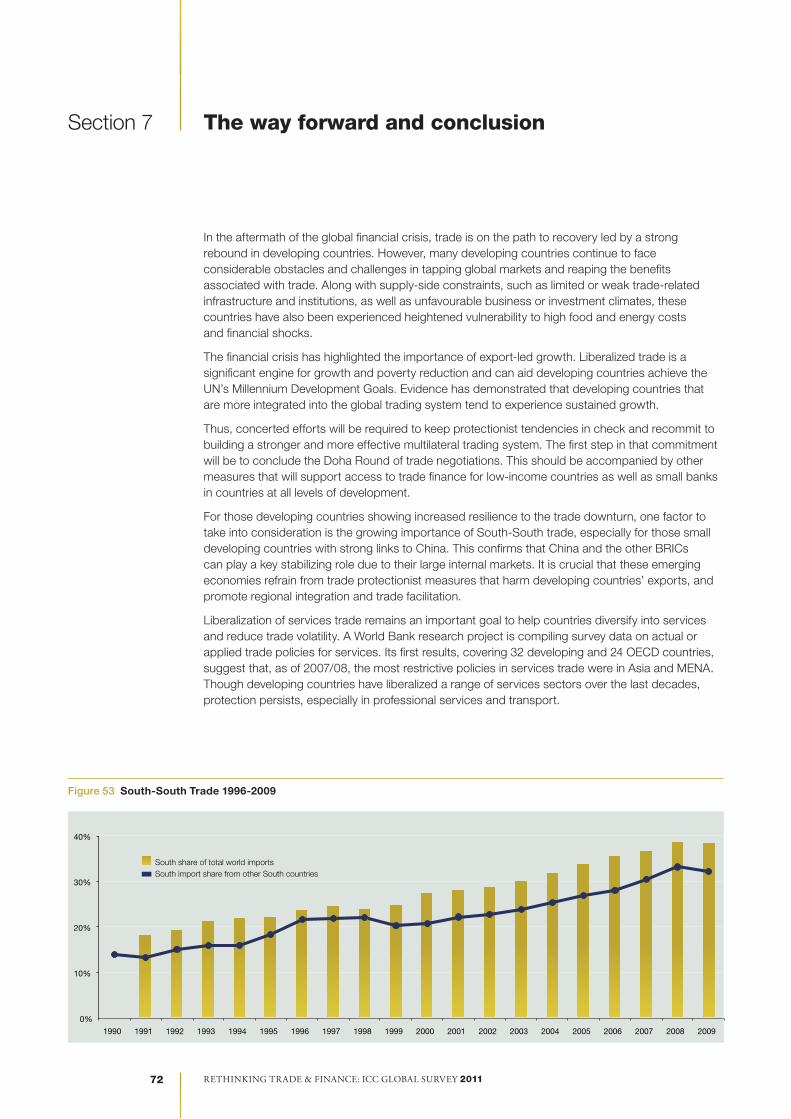
ICC noted with interest the important role played by development banks in building trade supply chain networks between banks in emerging markets. The accelerated advancement of South-South trade supported by the development banks’ programmes is an interesting phenomenon and one that we expect to continue.
Rethinking tRade & Finance: icc global SuRvey 2011 Rethinking tRade & Finance: icc global SuRvey 2011 17
With a significant emphasis on supporting SME trade in emerging markets, the positive development impact of development bank support is evident. Furthermore, based on the findings of this Survey, we can expect to see continued expansion of the development banks’ portfolios of trade finance support as well as a greater proportion of trade deals being initiated by confirming banks as the impact of tighter global banking regulation is felt in the market.
Conclusion and recommendations
In the aftermath of the global financial crisis, trade has begun its path to recovery, led by a strong rebound in some regions, particularly in Asia.
However, many developing countries continue to face considerable obstacles and challenges in tapping global markets and reaping the benefits associated with trade. On top of supply-side constraints – such as limited or weak trade-related infrastructures and institutions, and unfavourable business or investment climates – developing countries have also experienced vulnerabilities to high food and energy costs as well as financial shocks.
To maintain the recent momentum toward recovery, concerted efforts will be required to keep protectionist tendencies in check and to recommit to build a stronger and more effective multilateral trading system that serves developing countries. Concluding the Doha Round is particularly important in this respect.
These efforts will need to be accompanied by measures to support access to trade finance for low-income countries and small banks in developing countries. Increasing trade liberalization among developing countries and export diversification into services can help mitigate the impact of crises and global volatility.
Adequate and affordable trade finance is also fundamental to economic recovery and growth. In developing countries, the shortage of available trade finance is critical, as it is for SMEs in developed countries, which often rely on smaller banks as their sources of financing. ICC continues to stress the key role this kind of finance plays in economic growth.
Rethinking tRade & Finance: icc global SuRvey 2011 18
An industry outlook on the recovery
To provide a market update for the Survey, we asked three trade finance experts: Kah Chye Tan, Global Head of Corporate Cash and Trade, Standard Chartered Bank and Chairman of the Banking Commission; John Ahearn, Managing Director, Global Head of Trade, Global Transaction Services, Treasury and Trade Solutions Group, Citibank; and Daniel Cotti, Head of Global Trade, JPMorgan Chase to give us their views.
What are your thoughts concerning the recovery of global trade during the past year?
Kah Chye Tan
In short, most countries have recovered. But we are living in a volatile world. Just before the crisis, economists were talking about a decoupled world. In the midst of the crisis, the decoupling theory was thrown out of the window. Today, after the crisis has eased, the theory is making a comeback.
We are currently witnessing strong growth in emerging markets, and will not be surprised if many Asian economies post double-digit GDP and export growth rates. Asian governments are actively taming inflation, managing growth and preventing a property bubble. While there is growth in OECD trade, it is more muted when compared to Asia.
John Ahearn
Citi has a slightly different view. While we have seen significant growth across many regions, we do not believe that decoupling is a reality. With most of the OECD still very much in a recession and the public sector struggling with significant debt loads, we believe that economic activity will remain weak for the foreseeable future.
When you add the backdrop of the recent issues in the Middle East, especially in Egypt, we believe that sovereign risk will again become a major issue, if not because of current account deficits, then as the result of political instability.
We make these statements against what we acknowledge is a decreasing price scenario, which we believe is overdone.
Daniel Cotti
Entering 2010 we viewed the world through a cautiously optimistic prism. In 2009, we saw the work of central banks and international finance organizations increase to supplement the limited trade finance being made available through the remaining strong providers. As a result, in 2010 the global economy got a boost on its road to recovery.
The stronger economies, Asia and Latin America, continued demonstrating their strength as intra-Asia trade and South-South trade showed continued growth and vitality. Western Europe and the United States began a slower rebound, while some regions such as Africa, Central Asia and Central America continued to lag behind the other economies.
During the course of 2010, we saw demand increase, especially in manufactured and finished goods. Commodity flows were strong as well, as China’s and India’s voracious appetite for raw materials to support internal infrastructure and increased production capacity continued unabated. In the US, consumers returned as they saw markedly improved investment returns and low inflation. Europe’s economic engine, Germany, resumed its usual strong export performance, providing stability and funding to the euro economies.
Kah Chye Tan
Standard Chartered Bank
John Ahearn
Citibank
Daniel Cotti
JPMorgan Chase
Rethinking tRade & Finance: icc global SuRvey 2011 Rethinking tRade & Finance: icc global SuRvey 2011 19
While there was mostly good news on the macroeconomic front, we saw trade finance pricing continue to fall. In many markets, prices are at or near pre-crisis pricing levels. Secondary markets have been restored, as investors’ appetites continuing to increase. There has also been continued utilization of development bank support programmes.
Market participation has expanded as well to pre-crisis levels as banks that withdrew during the crisis are coming back in. Unfortunately, some are demonstrating the bad behaviour that was in evidence before the crisis and taking risks without the possibility of reasonable and rational returns.
What new trends are you seeing in global trade?
Kah Chye Tan
The challenges the industry faces today have evolved significantly. Competition is no longer limited to global or local banks. The industry is faced with an unprecedented barrage of new regulations. Although Basel has received a lot of attention, there are many other developments. Just to name a few, there are new regulations in the areas of KYC, sanctions, AML, etc. We recognize the intention of these new regulations, and agree that their objectives make perfect sense. But, I have two caveats to highlight:
1) Collectively, they are adding an enormous amount of costs to our clients, and I encourage our regulators to take a holistic view of these regulations.
2) Regulators should step up their engagement with the industry and seek feedback to ensure that the regulations are on track to achieve what they are intended to accomplish.
There is a lot of room for more frequent and open communication between the industry and the regulators.
John Ahearn
From a regulator’s point of view I would agree strongly with Kah Chye. No one wants to support money laundering or terrorist financing, and I truly believe that banks are strongly engaged in ways to stop these flows However, trying to manage ambiguous regulations that require each institution to interpret the laws and then try and find solutions is not cost-effective. A more consultative approach with clear guidelines between the regulators and banks would yield more fruit.
With regard to competition, this is an area we are just beginning to understand. Historically, my competition was with other banks. However, given the new regulations that are coming out, especially Basel III and others, we may find ourselves competing against our customers. The traditional model of banking was to say to our customers: “Consider my balance sheet. I have the cheapest form of capital and I have leverage” With the regulations and the need for banks to raise much more capital and reduce our leverage, that may no longer be the case. Instead, companies may find themselves going to the capital markets and raising cash to self-finance themselves. That may be a more attractive model going forward.
Daniel Cotti
The product mix in 2010 continued along the same lines that were experienced in 2009. Letters of credit usage continued remained flat with the volume concentrated in support of SMEs and smaller economies. We saw our correspondent bank customers increasing their demand for dollar-based financing to support the needs of their local customers. Supply chain finance demand continued its growth trajectory as major buyers continued to strengthen their supply chains while negotiating more favourable terms. Sellers are finding more appetite for their counterparty’s paper and, as a result, previously constrained liquidity sources are freeing capacity. Highly structured transactions re-emerged but with greater transparency and fortified documentation. The credit insurance market also saw improvement.
Rethinking tRade & Finance: icc global SuRvey 2011 20
As one repercussion of the economic crisis, regulators, both local and global, have intensified their scrutiny of the banking community in an effort to prevent a reoccurrence of the 2008 debacle. In 2010, we saw the emergence of Basel III, which sent shockwaves through the banking industry. Requirements for increased capital and higher risk premiums for trade finance transactions have banks seriously reconsidering their involvement in trade finance. Global sanctions imposed by the United Nations against Iran have also had a major impact on most banks, as greater scrutiny of transactions, especially transportation information, has been required.
What is your outlook for global trade in 2011 and 2012?
Kah Chye Tan
2011 is looking good for our clients, as trade pricing is heading back to pre-crisis levels. For example, top-tier Indian banks priced at 0.8% before the crisis and that shot up to a high of 6.5% for a short period of time during the crisis. Competition is coming back with a vengeance. That has created a war for talent in an already paper thin market.
John Ahearn
2011 and 2012 look to be very interesting, to say the least. Competition will continue to be strong as Kah Chye says, but our belief is that this will not be the case through the entire period. At some point we need to get back to fundamentals in the business, especially in the form of pricing. Spread compression has brought transactional pricing below the credit default swap level for many countries. As an example, we are seeing deals priced at 17 bps for some ECA pricing. When you look at that against the sovereign risk rating and CDS pricing in the market, you see Sovereign CDSs for the same risk at 49bps. When this is coupled with new capital charges and internal liquidity premiums that some banks need to pay for liquidity, clearly current pricing is not sustainable.
In addition we believe that certain banks will be faced with a decision based on their need for capital as to whether they will remain in the trade business or not.
Clearly, this will be a time of change.
Daniel Cotti
Our outlook for 2011 is bullish. Major trading partners are expected to continue their rebound and growth trajectory. Trade finance will increase, but capacity in most markets will improve, reducing prices even more. Initial forecasts indicate that by early 2012, global trade will have recouped its losses and resume its traditional growth rates. Letter of credit utilization will remain concentrated in SME markets and in the smaller economies, since their growth prospects are not as favourable as those of the major markets.
Though increasingly less likely, the threat of a double-dip recession is still present, since deleveraging and the purging of “bad” assets will continue unabated in 2011. Also, the dreaded risk of inflation still lurks, as economies with cheap liquidity will heat up until this risk has been reduced or eliminated. The Eurozone’s problems are far from resolved, and any future disruptions threatening the fundamentals of the currency could plunge it back into recession. That said, these threats will not negate the continued strong growth we see in trade finance markets.
Rethinking tRade & Finance: icc global SuRvey 2011 Rethinking tRade & Finance: icc global SuRvey 2011 21
Section 1 Background and methodology
Purpose and scope of ICC Survey 2011
The ICC Banking Commission has undertaken another global trade finance Survey (the third in the series) to gather reliable quantitative and qualitative data for the trade finance mar ket and to gauge the outlook for trade in 2011. The purpose of the Survey is to obtain information from the marketplace that reflects current com mercial and operational practice in the international trade finance banking com-munity that can aid world leaders to formulate policy in this field.
In addition to the participation of members of the ICC Banking Commission, the cooperation and partnership of the following trade organiza-tions was key to the production of this Survey:
n The World Bank;
n Society for Worldwide Interbank Financial Telecommunications (SWIFT);
n The Berne Union;
n The European Bank for Reconstruction and Development (EBRD);
n The International Finance Corporation (IFC);
n The Asian Development Bank (ADB);
n The Inter-American Development Bank (IDB);
n The African Development Bank (AfDB); and
n ICC national committee network.
The contributions of these organizations have helped build on the success of last year’s Survey – both in terms of content examined and participation. The World Bank and SWIFT have again provided recent and exclusive his-torical trade flow data (volume and value) for contextual and comparative purposes. This year, the Berne Union has again contributed an analysis with key data concerning the activities of Export Credit Agencies (ECAs).
The members of the ICC Banking Commission once again responded to the call to provide information on trade products to the market-place. Responses to the Survey were up sig nificantly from last year, both in terms of the number of participating banks and countries. The development banks (EBRD, IFC, AfDB, IDB and ADB) once again mobilized the member banks in their respective trade facilitation programmes to participate in the online Survey and contributed a section with their responses to the crisis.
The methodology for this Survey was, primarily based on a 37-item questionnaire developed to collect information from the trade finance banking members of the participating organizations.
Methodology outline and timetable
The Survey questions targeted trends in the trade finance operations of banks in 2010 and specifically addressed the following topics:
n Trends in volumes and values of traditional trade products
n Trends in demand and pricing for bank undertakings and L/C confirmations
n Trade credit line availability
n Loss experience in rating traditional trade products compared to general banking facilities
n Operational impact of Basel II and market perception (and awareness) of the impending implementation of Basel III
n Other regulatory considerations
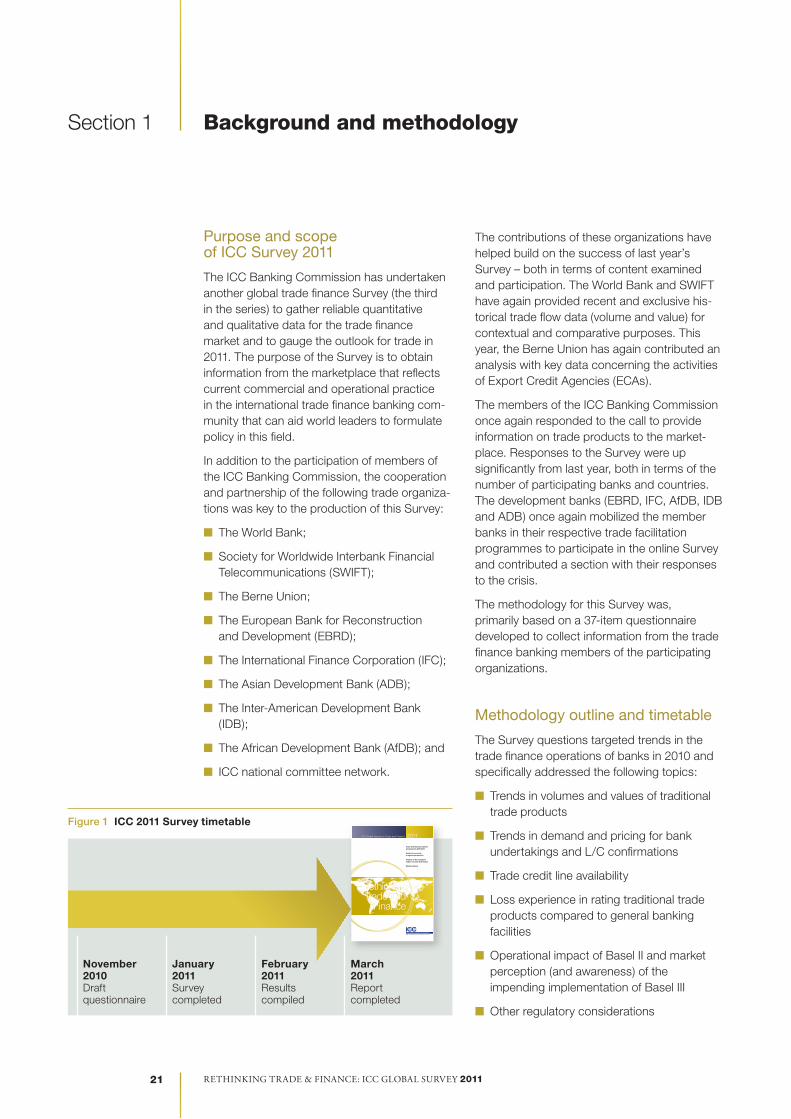
Figure 1 ICC 2011 Survey timetable
November 2010 Draft questionnaire
January 2011 Survey completed
February 2011 Results compiled
March 2011 Report completed
2011ICC Global Survey on Trade and Finance
Trade and financial markets development 2009-2010
Routes to recovery: a regional perspective
Impacts of the regulatory regime on trade and finance
Market outlook
Rethinking Trade and
Finance
Rethinking tRade & Finance: icc global SuRvey 2011 22
Participation in the 2011 ICC Survey
The present report has been prepared by the ICC Secretariat based on a Survey conducted worldwide in early 2011. Coastline Solutions, ICC’s information technology partner, has been responsible for the collection of the data.
The 2011 Survey received responses from 210 banks in 94 countries. This is a sharp increase over the 2010 Survey, which received responses from 161 banks in 75 countries (the 2009 Survey received responses from 122 banks in 59 countries, already a satisfactory response level).
We are therefore pleased to note that ICC Surveys have been gaining wide recognition in the industry and are taking the lead in providing key information on trade & finance, thereby significantly bridging the information gap.
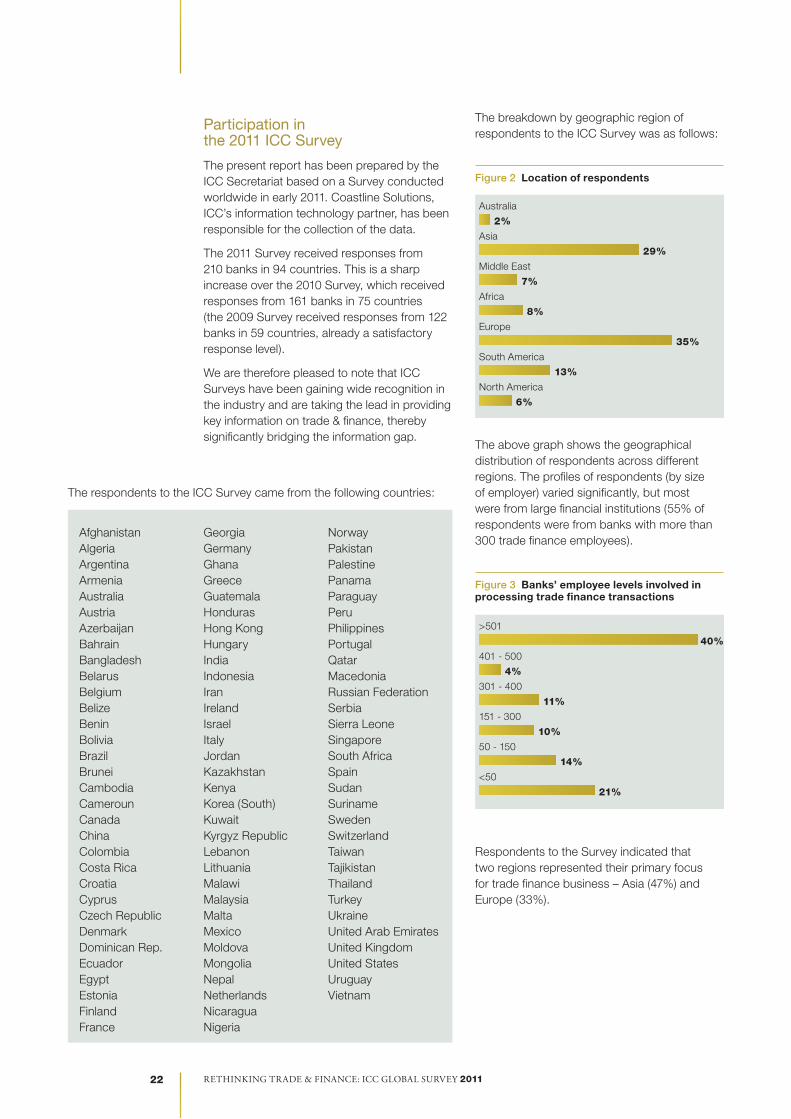
The breakdown by geographic region of respondents to the ICC Survey was as follows:
Figure 2 Location of respondents
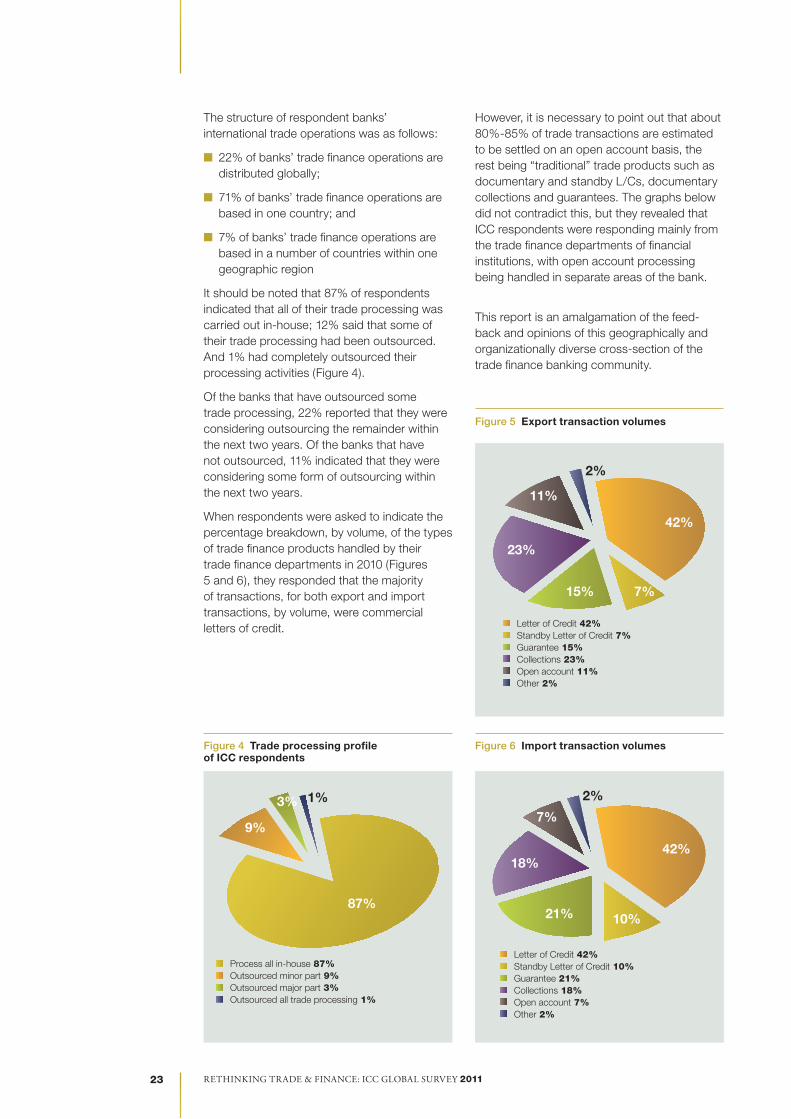
The above graph shows the geographical distribution of respondents across different regions. The profiles of respondents (by size of employer) varied significantly, but most were from large financial institutions (55% of respondents were from banks with more than 300 trade finance employees).
Rethinking tRade & Finance: icc global SuRvey 2011 Rethinking tRade & Finance: icc global SuRvey 2011 23
The structure of respondent banks’ international trade operations was as follows:
n 22% of banks’ trade finance operations are distributed globally;
n 71% of banks’ trade finance operations are based in one country; and
n 7% of banks’ trade finance operations are based in a number of countries within one geographic region
It should be noted that 87% of respondents indicated that all of their trade processing was carried out in-house; 12% said that some of their trade processing had been outsourced. And 1% had completely outsourced their processing activities (Figure 4).
Of the banks that have outsourced some trade processing, 22% reported that they were considering outsourcing the remainder within the next two years. Of the banks that have not outsourced, 11% indicated that they were considering some form of outsourcing within the next two years.
When respondents were asked to indicate the percentage breakdown, by volume, of the types of trade finance products handled by their trade finance departments in 2010 (Figures 5 and 6), they responded that the majority of transactions, for both export and import transactions, by volume, were commercial letters of credit.
However, it is necessary to point out that about 80%-85% of trade transactions are estimated to be settled on an open account basis, the rest being “traditional” trade products such as documentary and standby L/Cs, documentary collections and guarantees. The graphs below did not contradict this, but they revealed that ICC respondents were responding mainly from the trade finance departments of financial institutions, with open account processing being handled in separate areas of the bank.
This report is an amalgamation of the feed-back and opinions of this geographically and organizationally diverse cross-section of the trade finance banking community.
Figure 4 Trade processing profile of ICC respondents
Figure 6 Import transaction volumes
Figure 5 Export transaction volumes
Process all in-house 87%Outsourced minor part 9%Outsourced major part 3%Outsourced all trade processing 1%
Letter of Credit 42%Standby Letter of Credit 10%Guarantee 21%Collections 18%Open account 7%Other 2%
Letter of Credit 42%Standby Letter of Credit 7%Guarantee 15%Collections 23%Open account 11%Other 2%
87%
42%
42%
10%21%
15%
23%
11%
18%
7%
7%
2%
2%
9%
3% 1%
Fig4
Fig5 (Export)
Fig6 (Import)
Rethinking tRade & Finance: icc global SuRvey 2011 24
Section 2 World economy: Expectations point to recovery
The great trade collapse and recovery – a quick overview
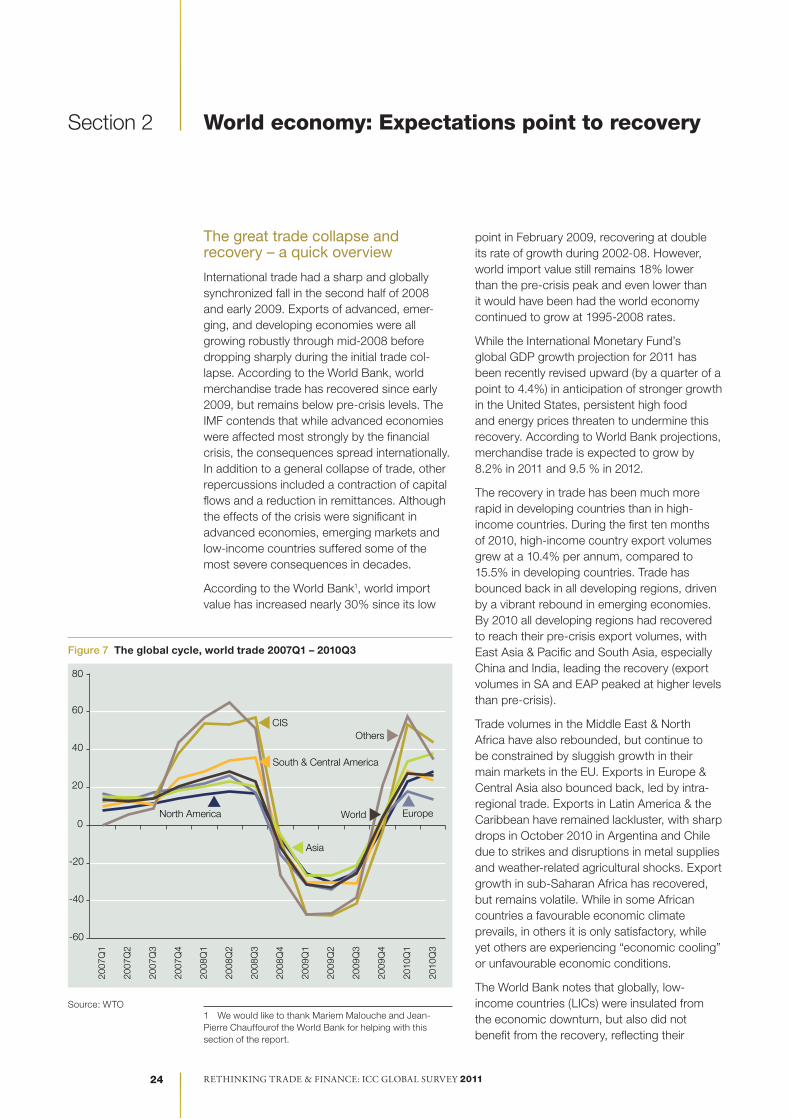
International trade had a sharp and globally synchronized fall in the second half of 2008 and early 2009. Exports of advanced, emer-g ing, and developing economies were all growing robustly through mid-2008 before dropping sharply during the initial trade col-lapse. According to the World Bank, world merchandise trade has recovered since early 2009, but remains below pre-crisis levels. The IMF contends that while advanced economies were affected most strongly by the financial crisis, the consequences spread internationally. In addition to a general collapse of trade, other repercussions included a contraction of capital flows and a reduction in remittances. Although the effects of the crisis were significant in advanced economies, emerging markets and low-income countries suffered some of the most severe consequences in decades.
According to the World Bank1, world import value has increased nearly 30% since its low
1 We would like to thank Mariem Malouche and Jean-Pierre Chauffourof the World Bank for helping with this section of the report.
point in February 2009, recovering at double its rate of growth during 2002-08. However, world import value still remains 18% lower than the pre-crisis peak and even lower than it would have been had the world economy continued to grow at 1995-2008 rates.
While the International Monetary Fund’s global GDP growth projection for 2011 has been recently revised upward (by a quarter of a point to 4.4%) in anticipation of stronger growth in the United States, persistent high food and energy prices threaten to undermine this recovery. According to World Bank projections, merchandise trade is expected to grow by 8.2% in 2011 and 9.5 % in 2012.
The recovery in trade has been much more rapid in developing countries than in high-income countries. During the first ten months of 2010, high-income country export volumes grew at a 10.4% per annum, compared to 15.5% in developing countries. Trade has bounced back in all developing regions, driven by a vibrant rebound in emerging economies. By 2010 all developing regions had recovered to reach their pre-crisis export volumes, with East Asia & Pacific and South Asia, especially China and India, leading the recovery (export volumes in SA and EAP peaked at higher levels than pre-crisis).
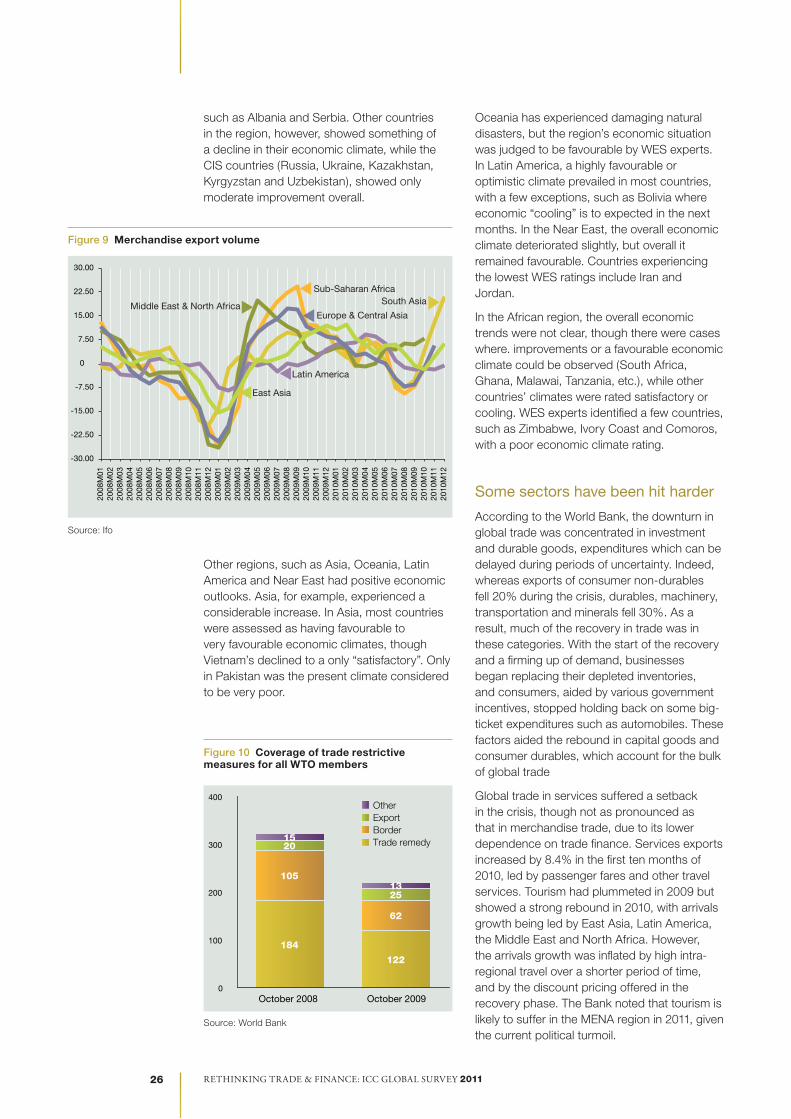
Trade volumes in the Middle East & North Africa have also rebounded, but continue to be constrained by sluggish growth in their main markets in the EU. Exports in Europe & Central Asia also bounced back, led by intra-regional trade. Exports in Latin America & the Caribbean have remained lackluster, with sharp drops in October 2010 in Argentina and Chile due to strikes and disruptions in metal supplies and weather-related agricultural shocks. Export growth in sub-Saharan Africa has recovered, but remains volatile. While in some African countries a favourable economic climate prevails, in others it is only satisfactory, while yet others are experiencing “economic cooling” or unfavourable economic conditions.
The World Bank notes that globally, low-income countries (LICs) were insulated from the economic downturn, but also did not benefit from the recovery, reflecting their
-60
-40
-20
0
20
40
60CIS
80
2007
Q1
2007
Q2
2007
Q3
2007
Q4
2008
Q1
2008
Q2
2008
Q3
2008
Q4
2009
Q1
2009
Q2
2009
Q3
2009
Q4
2010
Q1
2010
Q3
Asia
Others
South & Central America
North America World Europe
Figure 7 The global cycle, world trade 2007Q1 – 2010Q3
Source: WTO
Rethinking tRade & Finance: icc global SuRvey 2011 Rethinking tRade & Finance: icc global SuRvey 2011 25
lack of integration in the world economy. The exports and imports of these countries, in both volume and value terms, remained comparatively flat during both the crisis and post-crisis periods. However, as high-income countries account for the bulk of the world total import volume, their contribution to overall import demand exceeded that of developing countries. Much of the import demand was for capital goods, a sector still dominated by high-income countries.
An improvement in the world economic climate
The Institute for Economic Research (Ifo) and ICC have just released the new World Economic Survey (WES), which assessed worldwide economic trends by polling transnational as well as national organizations worldwide concerning current economic development in their respective countries2.
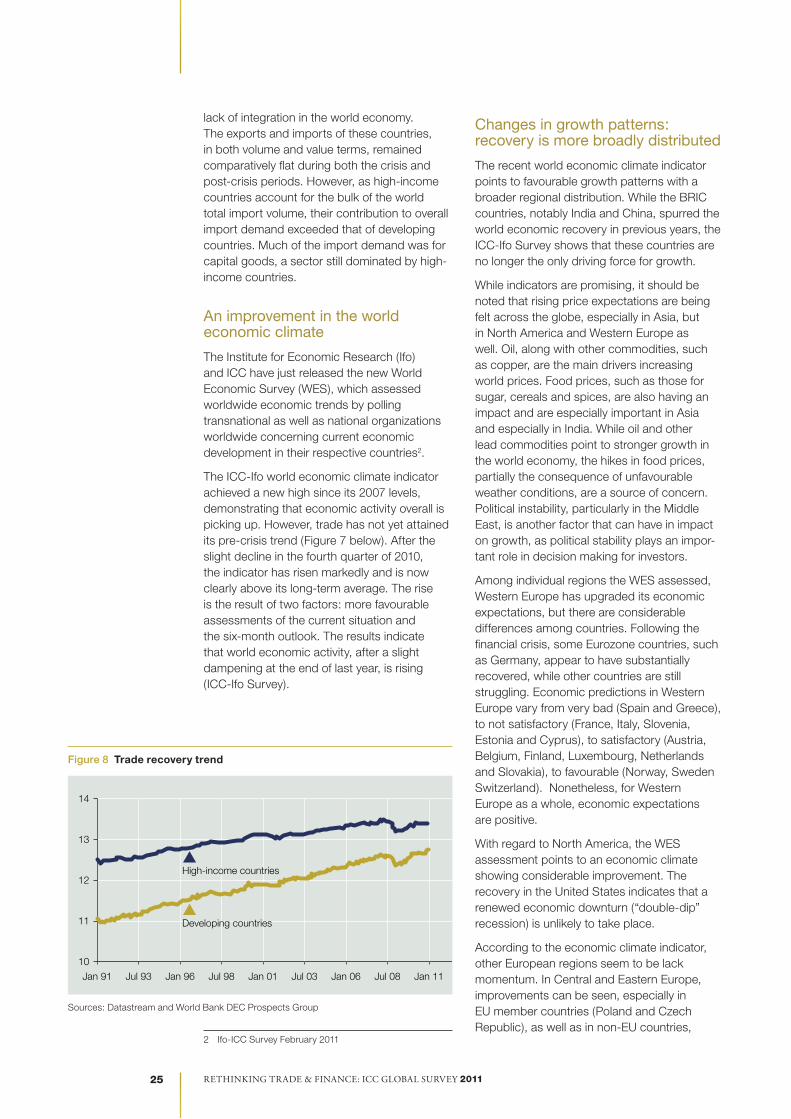
The ICC-Ifo world economic climate indicator achieved a new high since its 2007 levels, demonstrating that economic activity overall is picking up. However, trade has not yet attained its pre-crisis trend (Figure 7 below). After the slight decline in the fourth quarter of 2010, the indicator has risen markedly and is now clearly above its long-term average. The rise is the result of two factors: more favourable assessments of the current situation and the six-month outlook. The results indicate that world economic activity, after a slight dampening at the end of last year, is rising (ICC-Ifo Survey).
2 Ifo-ICC Survey February 2011
Changes in growth patterns: recovery is more broadly distributed
The recent world economic climate indicator points to favourable growth patterns with a broader regional distribution. While the BRIC countries, notably India and China, spurred the world economic recovery in previous years, the ICC-Ifo Survey shows that these countries are no longer the only driving force for growth.
While indicators are promising, it should be noted that rising price expectations are being felt across the globe, especially in Asia, but in North America and Western Europe as well. Oil, along with other commodities, such as copper, are the main drivers increasing world prices. Food prices, such as those for sugar, cereals and spices, are also having an impact and are especially important in Asia and especially in India. While oil and other lead commodities point to stronger growth in the world economy, the hikes in food prices, partially the consequence of unfavourable weather conditions, are a source of concern. Political instability, particularly in the Middle East, is another factor that can have in impact on growth, as political stability plays an impor-tant role in decision making for investors.
Among individual regions the WES assessed, Western Europe has upgraded its economic expectations, but there are considerable differences among countries. Following the financial crisis, some Eurozone countries, such as Germany, appear to have substantially recovered, while other countries are still struggling. Economic predictions in Western Europe vary from very bad (Spain and Greece), to not satisfactory (France, Italy, Slovenia, Estonia and Cyprus), to satisfactory (Austria, Belgium, Finland, Luxembourg, Netherlands and Slovakia), to favourable (Norway, Sweden Switzerland). Nonetheless, for Western Europe as a whole, economic expectations are positive.
With regard to North America, the WES assessment points to an economic climate showing considerable improvement. The recovery in the United States indicates that a renewed economic downturn (“double-dip” recession) is unlikely to take place.
According to the economic climate indicator, other European regions seem to be lack momentum. In Central and Eastern Europe, improvements can be seen, especially in EU member countries (Poland and Czech Republic), as well as in non-EU countries,
Figure 8 Trade recovery trend
Sources: Datastream and World Bank DEC Prospects Group
Log of merchandise export volumes, 2005 dollars
Sources: Datastream and World Bank DEC Prospects Group
Jul 93 Jan 96Jan 91 Jul 98 Jan 01 Jul 03 Jan 06 Jul 08 Jan 11
14
13
12
11
10
Developing countries
High-income countries
Rethinking tRade & Finance: icc global SuRvey 2011 26
such as Albania and Serbia. Other countries in the region, however, showed something of a decline in their economic climate, while the CIS countries (Russia, Ukraine, Kazakhstan, Kyrgyzstan and Uzbekistan), showed only moderate improvement overall.
Other regions, such as Asia, Oceania, Latin America and Near East had positive economic outlooks. Asia, for example, experienced a considerable increase. In Asia, most countries were assessed as having favourable to very favourable economic climates, though Vietnam’s declined to a only “satisfactory”. Only in Pakistan was the present climate considered to be very poor.
Figure 10 Coverage of trade restrictive measures for all WTO members
Source: World Bank
Oceania has experienced damaging natural disasters, but the region’s economic situation was judged to be favourable by WES experts. In Latin America, a highly favourable or optimistic climate prevailed in most countries, with a few exceptions, such as Bolivia where economic “cooling” is to expected in the next months. In the Near East, the overall economic climate deteriorated slightly, but overall it remained favourable. Countries experiencing the lowest WES ratings include Iran and Jordan.
In the African region, the overall economic trends were not clear, though there were cases where. improvements or a favourable economic climate could be observed (South Africa, Ghana, Malawai, Tanzania, etc.), while other countries’ climates were rated satisfactory or cooling. WES experts identified a few countries, such as Zimbabwe, Ivory Coast and Comoros, with a poor economic climate rating.
Some sectors have been hit harder
According to the World Bank, the downturn in global trade was concentrated in investment and durable goods, expenditures which can be delayed during periods of uncertainty. Indeed, whereas exports of consumer non-durables fell 20% during the crisis, durables, machinery, transportation and minerals fell 30%. As a result, much of the recovery in trade was in these categories. With the start of the recovery and a firming up of demand, businesses began replacing their depleted inventories, and consumers, aided by various government incentives, stopped holding back on some big-ticket expenditures such as automobiles. These factors aided the rebound in capital goods and consumer durables, which account for the bulk of global trade
Global trade in services suffered a setback in the crisis, though not as pronounced as that in merchandise trade, due to its lower dependence on trade finance. Services exports increased by 8.4% in the first ten months of 2010, led by passenger fares and other travel services. Tourism had plummeted in 2009 but showed a strong rebound in 2010, with arrivals growth being led by East Asia, Latin America, the Middle East and North Africa. However, the arrivals growth was inflated by high intra-regional travel over a shorter period of time, and by the discount pricing offered in the recovery phase. The Bank noted that tourism is likely to suffer in the MENA region in 2011, given the current political turmoil.
Rethinking tRade & Finance: icc global SuRvey 2011 Rethinking tRade & Finance: icc global SuRvey 2011 27
While global imbalances had already started narrowing in 2006, they were given further impetus during the crisis. China increased its public sector and consumer spending, while the US increased its private savings. Global imbalances peaked at 5.6% of global GDP in 2005, coming down to 3.9% in 2009 and an estimated 3.3% in 2010. Further narrowing of the imbalances will depend on oil prices; the impact and size of the withdrawal of the US fiscal stimulus, especially on interest rates; and China’s ability to maintain consumer spending. Global imbalances remain at the heart of the G-20 agenda, as they may trigger or augment crises and destabilize the world economy. In one case, the G-20 Seoul Summit in November 2010 mandated France to reach agreement in the first half of 2011 on a list of economic indicators and benchmark values to quantify imbalances, and make policy recommendations on how to deal with them.
Continued commitment to keep markets open
Benefits from global trade require continued vigilance against protectionist tendencies. Given the importance of trade and investment for the global economic recovery, the G-20 countries’ continued commitment to resist all forms of protectionist measures, to keep markets open and liberalize trade and invest-ment as a means to promote economic progress for all and narrow the development gap is welcomed. This commitment, reiterated during the November 2010 meeting in Seoul, has been a centerpiece of the G-20 response to the global economic crisis. It may have spared the world economy from falling into a 1930s Depression-era scenario.
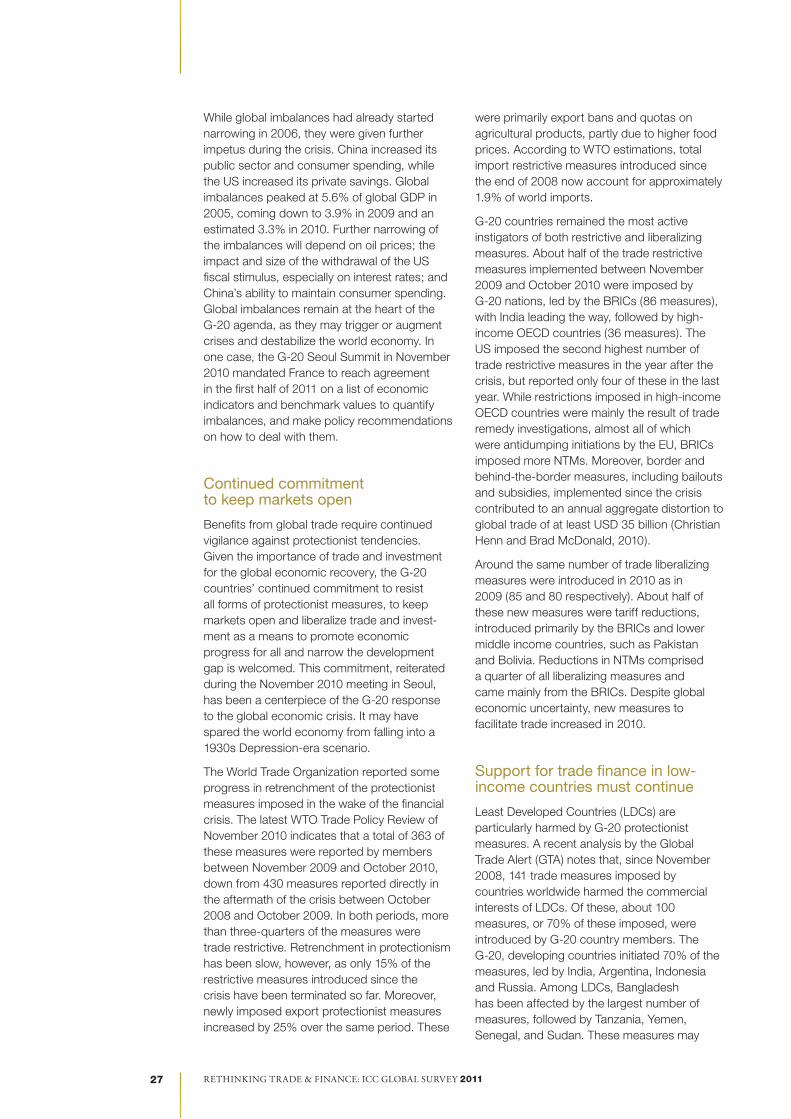
The World Trade Organization reported some progress in retrenchment of the protectionist measures imposed in the wake of the financial crisis. The latest WTO Trade Policy Review of November 2010 indicates that a total of 363 of these measures were reported by members between November 2009 and October 2010, down from 430 measures reported directly in the aftermath of the crisis between October 2008 and October 2009. In both periods, more than three-quarters of the measures were trade restrictive. Retrenchment in protectionism has been slow, however, as only 15% of the restrictive measures introduced since the crisis have been terminated so far. Moreover, newly imposed export protectionist measures increased by 25% over the same period. These
were primarily export bans and quotas on agricultural products, partly due to higher food prices. According to WTO estimations, total import restrictive measures introduced since the end of 2008 now account for approximately 1.9% of world imports.
G-20 countries remained the most active instigators of both restrictive and liberalizing measures. About half of the trade restrictive measures implemented between November 2009 and October 2010 were imposed by G-20 nations, led by the BRICs (86 measures), with India leading the way, followed by high-income OECD countries (36 measures). The US imposed the second highest number of trade restrictive measures in the year after the crisis, but reported only four of these in the last year. While restrictions imposed in high-income OECD countries were mainly the result of trade remedy investigations, almost all of which were antidumping initiations by the EU, BRICs imposed more NTMs. Moreover, border and behind-the-border measures, including bailouts and subsidies, implemented since the crisis contributed to an annual aggregate distortion to global trade of at least USD 35 billion (Christian Henn and Brad McDonald, 2010).
Around the same number of trade liberalizing measures were introduced in 2010 as in 2009 (85 and 80 respectively). About half of these new measures were tariff reductions, introduced primarily by the BRICs and lower middle income countries, such as Pakistan and Bolivia. Reductions in NTMs comprised a quarter of all liberalizing measures and came mainly from the BRICs. Despite global economic uncertainty, new measures to facilitate trade increased in 2010.
Support for trade finance in low-income countries must continue
Least Developed Countries (LDCs) are particularly harmed by G-20 protectionist measures. A recent analysis by the Global Trade Alert (GTA) notes that, since November 2008, 141 trade measures imposed by countries worldwide harmed the commercial interests of LDCs. Of these, about 100 measures, or 70% of these imposed, were introduced by G-20 country members. The G-20, developing countries initiated 70% of the measures, led by India, Argentina, Indonesia and Russia. Among LDCs, Bangladesh has been affected by the largest number of measures, followed by Tanzania, Yemen, Senegal, and Sudan. These measures may
Rethinking tRade & Finance: icc global SuRvey 2011 28
significantly restrict LDCs’ exports, in particular for products in which they are specialized, contravening the undertaking at the G-20 Summit. Keeping markets open for LDCs’ exports would help lift these economies out of poverty. Extending 100% duty-free quota-free (DFQF) access to all exports of LDCs would promote new export opportunities for these countries, opening market access for products in which LDCs have a comparative advantage.
The international community should continue to increase the availability of trade finance in developing countries, particularly LICs, to facilitate trade. Trade finance underpins the financial infrastructure that allows countries and firms to trade with one another, and the lack of it can have severe implications for a pro-development global trading system. The issue of trade finance availability became especially relevant during the global financial crisis in 2008-2009, when higher lending costs, higher risk premiums and liquidity pressures due to scarcity of capital caused a sudden shortage in this finance.
Lack of affordable trade finance has been particularly harmful to SMEs, particularly in LICs. Results from the financial markets and surveys of firms taken during the crisis by the IMF, the International Chamber of Commerce and the World Bank to overcome the lack of data on trade finance, as well as post-crisis empirical analyses, all indicate the prevalence of tighter trade finance conditions during the crisis and significant adverse effects on trade flows.
The shortfall in trade finance seems to have been a moderate factor in the sharp drop in global trade flows during the crisis, which was mostly a result of the spillover of the financial crisis to the real economy, lower activity and inventory de-stocking. Nevertheless, the impact on trade by SMEs, especially those based in low-income countries with underdeveloped financial systems, was considerable. Post-crisis surveys and data on trade finance indicate signs of improvement in this regard.
Two years into the crisis, a look at the institutional response in providing trade finance confirms that it has been timely and substantial. In the midst of the crisis, the international community responded swiftly – spearheaded by the G-20 – in committing USD 250 billion over the course of two years in funding for co-financing arrangements that support trade transactions. This was implemented through a partnership between development banks, export credit agencies, foreign commercial banks, private insurance underwriters and investment funds. While the G-20 support was mainly directed at large banks and international banking institutions, the World Bank’s private arm, the International Finance Corporation, and the regional development banks stepped in as well to target their efforts at smaller banks and banks in developing countries. With the continued uncertainty in trade finance markets, particularly for low-income countries and small firms, governments and international organizations need to be cautious about the timing and pace of the withdrawal of these trade finance programmes.
Rethinking tRade & Finance: icc global SuRvey 2011 Rethinking tRade & Finance: icc global SuRvey 2011 29
Section 3 Trade finance statistics: Global and regional trends
Trade is rebounding
The responses to the ICC Survey questionnaire appear to confirm that the financial problems that were impacting trade as a whole in 2009 have diminished.
In 2009, we reported that the world was facing the most severe recession since the Great Depression, which originated in deve-loped countries but had been spreading to developing countries at ever-increasing speed. Emerging markets were more directly affected in 2008 because they were more financially integrated. Low-income countries were also harmed because of lower commodity prices and fewer remittances. GDP growth for developing countries was severely impacted, with negative growth in the 3-6% range for some regions.
The deterioration of trade was felt worldwide in 2009. According to respondents, in 2010 the situation had changed. Volumes in 2010 were up in most traditional trade products, the overall value of trade finance transactions was also up and the percentage of trade credit lines that were cut for corporate and financial institution customers fell markedly. Fees for bank under-takings and letter of credit confirmations appeared to have settled down and mainly flattened during the course of 2010.
In terms of volume, respondents seeing an increase outpaced those seeing a decrease by a ratio of around 3:1. From the financial institutions responding, 58% reported an increase in export L/C volume and 66% an
increase in import L/C volume. Considerable increases were also reported for guarantees (42% on the export side and 48% on the import side). Increases of 49% were seen for collections on both the export and import sides, and this may still reflect the fact that corporates sought a change from open account transactions by having the banking system act as custodians for their documents.
Figure 12 Export processing volume trends – 2010
Figure 13 Import processing volume trends – 2010
ICC Global Survey on Trade and FInanCe 2011 ICC Global Survey on Trade and FInanCe 2011 29
Graphs Page 29 Trade finance statistics: Global and regional trends
Figure 2 Export processing volume trends – 2009
Collections37%
14%49%
Guarantees44%
14%42%
Standby Letters of Credit61%
9%30%
Commercial Letters of Credit23%
19%58%
No changeDecreaseIncrease
ICC Global Survey on Trade and FInanCe 2011 ICC Global Survey on Trade and FInanCe 2011 29
Graphs Page 29 Trade finance statistics: Global and regional trends
Figure 12 Export processing volume trends – 2009
Figure 13 Import processing volume trends – 2009
Collections37%
14%49%
Guarantees44%
14%42%
Standby Letters of Credit61%
9%30%
Commercial Letters of Credit23%
19%58%
No changeDecreaseIncrease
Collections31%
20%49%
Guarantees33%
19%48%
Standby Letters of Credit47%
13%40%
Commercial Letters of Credit11%
23%66%
No changeDecreaseIncrease
Figure 11 Value of trade finance activity between 2009 and 2010
Increase 86%Decrease 14%
Increase 74%Decrease 26%
Fig 11
Fig 17
86%
14%
74%
26%
Rethinking tRade & Finance: icc global SuRvey 2011 30
Only 12% of respondents indicated that their trade credit lines for corporates decreased in 2010. This compared favourably with a 40% decrease indicated in last year’s Survey. Some 69% reported an increase in credit lines when compared with 2009. At the same time, only 13% indicated that their trade credit lines for financial institutions declined in 2010, and 53% mentioned that those for financial institutions had increased in 2010.
Where respondents reported a decrease in trade credit lines, the principal reasons given, in order of cause, were the following:
n more stringent credit criteria being applied;
n selective exiting of customer relationships due to credit deterioration;
n exiting markets;
n reallocation of and/or refined credit line limits to reflect past usage; and
n capital allocation restrictions
Despite the positive signs with regard to trade credit lines, respondents still reported that they were competing internally for each unit of the bank’s scarce capital.
Trade finance demand
Trade finance demand was sustained in 2010
The 2011 Survey continued to address issues related to demand. According to respondents, trade finance is still very much in demand. However, a shortage of liquidity and disproportionate aversion to risk continue to drive up interest rates on loans and advances in a number of countries, especially in emerging markets. The following was noted in the ICC Survey:
n 83% of respondents indicated they had experienced an increase in demand for the issuance of bank undertakings during 2010, a considerable increase on the 2009 figure of 50% and further evidence of the continued increased security sought by exporters for their shipments;
n 73% of respondents who had experienced an increase in demand reported they had been able to satisfy their customers’ needs to a large extent; and
n 74% of respondents reported they had experienced an increase in confirmation requests in 2010. This was almost exactly the same figure reported in the 2010 Survey (73%) and, again, a strong indication of the increased security sought by exporters and the perceived payment risk of the country of the issuing bank;.
n 81% of respondents expected an increase in demand for traditional trade products in 2011 (down from 84% in 2010); and
n 86% of respondents indicated an increase in the total value of their trade finance activity in 2010.
Trade finance instruments gained prominence
Many respondent banks to the ICC Survey con tinued to comment on an increase in demand for documentary credits (L/Cs). These instruments are considered to substantially reduce risks for both the exporter and the importer. Not surprisingly, therefore, the docu-mentary credit today is seen as the classic form of international export payment, especially in trade between distant partners. Other trade finance instruments were mentioned by respondents, including guarantees. With the greatest economic crisis since the Great Depression still a fresh memory, guarantees
Figure 14 Availability of trade finance
Trade credit lines (corporate)19%
12%69%
Trade credit lines (FI)34%
13%53%
No changeDecreaseIncrease
Rethinking tRade & Finance: icc global SuRvey 2011 Rethinking tRade & Finance: icc global SuRvey 2011 31
were said to provide greater security in trade, as they are designed to restore confidence by protecting the parties against performance breaches without the need for businesses to post onerous cash deposits to secure their performance duties.
ICC noted that there was an increased demand for implementation of ICC rules governing trade finance. For instance, we witnessed continued demands for training on the use of the Uniform Rules for Demand Guarantees (URDG), which apply to billions of US dollars of guarantees and secure monetary and performance obligations in a wide array of international and domestic contracts. The same trend was found for UCP rules applying to documentary credits.
This trend was confirmed from data collected in the ICC Survey. Figure 15 shows that L/Cs remained the predominant settlement product. However, the data for open account trade should be understood in the context that the Survey was directed at individuals located in the offices of banks that typically deal with traditional trade finance instruments. Historically, open account trade has been understood to represent around 80-85% of world trade. It is widely expected that this figure fell between 2007 and 2010 as exporters sought a more secure method of settlement.
Affordability of trade finance
The 2011 Survey continued to address issues related to pricing. We noted the following:
n Around 75% of respondents indicated that their fees for issuance of bank undertakings had not changed in 2010. Where fees had changed (decreased or increased), this was mainly confined to a range of 1-25%.
n 78% of respondents anticipated that their fees for the issuance of bank undertakings would not rise in 2011.
Some 12-15% of respondents reported an increase in fees for commercial letters of credit, standbys and guarantees (Figure 16). This was on top of the 30% of respondents reporting increased fees in the 2010 Survey and the significant increases that occurred between Q4 2007 and Q4 2008.
ICC Global Survey on Trade and FInanCe 2011 30
Figure 4 Availability of trade finance
Figure 6 Change in fees for issuance of bank undertakings
Figure 5 Product mix, by percentage, of international trade products handled by banks
Trade credit lines (corporate)19%
12%69%
Trade credit lines (FI)34%
13%53%
No changeDecreaseIncrease
>50% decrease0%0%0%
26-50% decrease1%1%1%
1-25% decrease11%
8%10%
No change73%
75%71%
1-25% increase12%12%
15%
26-50% increase2%2%2%
>50% increase1%1%1%
GuaranteesStandby LCsLetters of Credit
Other2%2%
Open account7%
11%
Collections18%
23%
Guarantee21%
15%
Standby letter of credit10%
7%
Letter of credit42%42%
ImportExport
GuaranteesStandby LCsLetters of Credit
Figure 15 Product mix, by percentage, of international trade products handled by banks
Figure 16 Change in fees for issuance of bank undertakings
Central &Latin America
Rethinking tRade & Finance: icc global SuRvey 2011 32
The 2011 Survey also revealed that requests for confirmation of commercial letters of credit (74%) remained at the same level when compared with the 2010 Survey (73%) (Figure 17).
At the same time, 18% of respondents reported further increases in fees for confirming commercial L/Cs in 2010 (Figure 18):
n 3% indicated an increase in fees for con firm-ing commercial letters of credit of between 26-50%;
n 15% indicated an increase in fees for confirm ing commercial letters of credit of between 1-25%.
In addition:
n 12% reported a decrease in fees for confirming commercial letters of credit of between 1-25%; and
n 83% said they do not expect any change in fees for confirming commercial letters of credit in 2011.
Operational impacts
The number of court injunctions and refusals still remains high
Last year’s Survey reported that 23% of res-pon dents had seen an increase in the number of court injunctions barring payment under letters of credit. Some respondents also report-ed intense scrutiny of documents by some banks, leading to higher rates of rejection of trade documents under L/Cs for minor or non-existent discrepancies.
From the 2011 Survey, we conclude that these problems still persist. The following should be noted:
n 34% of respondents (same as the 2010 Survey) experienced an increase in the number of refusals by issuing banks in 2010;
n 85% of respondents (up from 71%), when acting in the capacity of a nominated bank, reported they had experienced an increase or no change in the number of spurious/questionable refusals; and
n Some 5% of respondents (down from 11%) had taken their own decision to refuse and return documents without seeking a waiver from their clients. The same res-pon dents indicated that on average they had only taken this course of action less than ten times in 2010. This com pares with the 11% who reported in the 2010 Survey that they had done this less than five times in the previous three years. These actions by banks clearly demonstrate their unwillingness to extend further credit to clients by allowing them to waive discrepancies (Figure 20).
n 34% of respondents indicated an increase in the percentage of documents refused on first presentation. In most cases, this was due to stricter document examination processes being implemented. Respondents reported an average 48% refusal rate when they were the issuing bank and 53% when they were acting as a nominated bank. These figures seem to be on the low side when compared to other market gathering exercises.
n At the same time, we noted that the number of discrepancies and claims were still quite high. 17% reported an increase in the number of spurious discrepancies in 2010 (while 15% said there had been a decrease in that year (down from 29%), and 68% said
Increase 86%Decrease 14%
Increase 74%Decrease 26%
Fig 11
Fig 17
86%
14%
74%
26%
Figure 18 Change in confirmation fees
Figure 17 Requests for confirmations
>50 decrease
0%
26-50% decrease
0%
1-25% decrease
12%
No change
70%
1-25% increase
15%
26–50% increase
3%
>50% increase
0%
Rethinking tRade & Finance: icc global SuRvey 2011 Rethinking tRade & Finance: icc global SuRvey 2011 33
there was no change – which effectively means that this remains a big issue) (Figure 21). Similarly, 40% of respondents indicated that there had been an increase in the number of claims under guarantees and standbys in 2010 (with 60% reporting a decrease) (Figure 22).
Issuing banks reported that pressure from appli cants to refuse documents was down from 17% to 6%. Where this was still an issue, the main reason cited continued to be “falling commodity prices” (Figure 19).
40% of respondents (down from 44%) indi-cated an increase in the number of claims received under standby letters of credit and guarantees. This reflects the value of the additional security and the pre viously reported demand for this type of under taking.
The 2011 Survey also showed that 26% of res pondents (up from 23%) had experienced an increase in the number of court injunctions stopping payment under bank undertakings. This shows that parties are seeking legal remedies to opt out of their obligations under a sale or performance contract. In response to a new question relating to instances of fraud allegations, 25% of respondents reported an increase over 2009 levels.
No major change in risk ratings
69% of respondents indicated that the criteria they applied for rating the risk of traditional trade products did not change in 2010, with some 31% reporting that they did.
Loss experience of traditional trade products versus general banking facilities
Banks continued to report that customers are asking for confirmed letters of credit, though they previously had worked with un-confirmed L/Cs, documentary collections or open account. However, bank perception of risk is still leading to a tightening of liquidity in some instances, which is causing difficulty in obtaining bank confirmations in some regions. In March 2011, this situation still prevailed, but not at the levels experienced in 2009.
Other key points noted in the ICC Survey are as follows:
n 49% of respondents reported that their level of actual losses when using traditional trade products was more than 75% less than losses incurred using general banking facilities. It is important to note that 98% reported that the level of losses incurred in traditional trade products were the same or lower than losses for general banking facilities (96% in the 2010 Survey);
Figure 19 Increased applicant pressure to refuse documents
Figure 20 Refused documents without seeking/accepting waiver
Figure 21 Increased number of spurious discrepancies
Figure 22 Claims under guarantees and standbys
Yes 94%No 6%
Increase 17%Decrease 15%No change 68%
Increase 40%Decrease 60%
Yes 5%No 95%
Fig 19
94%
6%
Fig 20
Fig 21
Fig 22
95%
5%
17%
40%
60%
15%
68%
Yes 94%No 6%
Increase 17%Decrease 15%No change 68%
Increase 40%Decrease 60%
Yes 5%No 95%
Fig 19
94%
6%
Fig 20
Fig 21
Fig 22
95%
5%
17%
40%
60%
15%
68%
Yes 94%No 6%
Increase 17%Decrease 15%No change 68%
Increase 40%Decrease 60%
Yes 5%No 95%
Fig 19
94%
6%
Fig 20
Fig 21
Fig 22
95%
5%
17%
40%
60%
15%
68%
Yes 94%No 6%
Increase 17%Decrease 15%No change 68%
Increase 40%Decrease 60%
Yes 5%No 95%
Fig 19
94%
6%
Fig 20
Fig 21
Fig 22
95%
5%
17%
40%
60%
15%
68%
Rethinking tRade & Finance: icc global SuRvey 2011 34
n Only 2% of respondents said that their losses under general banking facilities were less than when using traditional trade products (Figure 23);
n 81% of respondents expect an increase in demand for traditional trade products in 2011 (down from 84% in 2010); and
n 86% of respondents indicated an increase in the total value of their trade finance activity in 2010.
SWIFT trade traffic analysis
Background information
Before considering the SWIFT trade volume statistics and related comments, their context should be understood. First, it should be noted that SWIFT “payment messages” are not useful as a source of statistical data for open account trading, since a payment may be used for an FX deal or a trade in securities, as well as a trade-related transaction. All of the SWIFT comments must be taken in this context.
At the end of 2007, in a SWIFT trade survey, 20 of the top trade banks worldwide reported on their usage of SWIFT for trade transactions. Around 80% of the banks surveyed indicated that 90% of their letter of credit transactions went via SWIFT. The remaining 20% of the banks said that for 50% of their L/C trans-actions they used SWIFT. SWIFT statistics can therefore be considered a good indication of the overall usage trends for the L/C product.
Traditionally, SWIFT trade statistics concerned trade volumes. SWIFT was not able to look at the content of the messages, and therefore did not comment on the value of the trade. However, early in 2009 the SWIFT Board agreed to carry out a “trade snapshot”. This exercise looked into specifically defined trade data, extracting information on value, maturity and currency. This section now comprises values and currencies of some of the trade messages as part of the SWIFT Value Analyser that became available from the end of 2010. SWIFT hopes that both of these initiatives will add to the understanding of the dynamics of the industry as a whole.
“Traffic” refers to live transaction messages sent over the SWIFT network. When global figures are recorded, messages sent equal messages received.
The charts/graphs refer to “category 4” and “category 7”. SWIFT category 4 messages are flows for documentary collections – with the exception of three little-used “cash letter” messages. SWIFT category 7 messages are flows for commercial and standby letters of credit and guarantees.
Watch Value Analyser from SWIFT
The Watch Value Analyser is part of the existing Watch product from SWIFT, a Business Intelli-gence tool providing a solution for analysing and reporting SWIFT messaging activity. This
>75% higher
0%
51–75% higher
0%
26–50% higher
1%
Up to 25% higher
1%
The same
19%
Up to 25% less
15%
26–50% less
6%
51–75% less
9%
>75% less
49%
Figure 23 Losses in traditional trade finance products versus general banking facilities
Rethinking tRade & Finance: icc global SuRvey 2011 Rethinking tRade & Finance: icc global SuRvey 2011 35
Value Analyser has been recently made available to SWIFT customers. This new module lets you delve into message content to understand the true value behind your pay ments, securities, trade or FX transactional activity using amount and currency information. It helps you refine market share assessments, optimise your correspondent network and manage the associated risk.
SWIFT traffic figures show that the downward trend in volumes is now over
The 2003–2010 SWIFT trade traffic figures show that the downward trend in volumes experienced in 2008 and 2009 is now over, with the 2009 total of 40.5m (rounded) increas-ing to 42.9m (i.e., a growth of 5.81%). Whilst documentary collections represented 30% of total trade traffic in 2003, this fell to 25% in 2010.
Regarding the most frequently used messages in each category, in category 4 they are Message Type (MT) 400 (Advice of Payment); MT 410 (Acknowledgement); and MT 499 (Free Format). In category 7 the most frequently used messages are the MT 799 (Free Format); MT 700 (Issue of a Documentary Credit); and the MT 707 (Amendment to a Documentary Credit).
Trade traffic showed signs of recovery in last Q2010
The 2010 versus 2009 growth in traffic was 5.81%, for a total of 42.9 million mes sages in 2010. Results in 2010 showed an over all increase in trade traffic transactions from the low in February. It is clear that worldwide use of category 4 messaging over SWIFT is flat – it is therefore category 7 that is leading the recovery. This is visible through a growth in category 7 of 8.24% versus -0.79% in category 4.
Figure 24 SWIFT trade traffic worldwide in number of messages, 2003-2010
Figure 25 SWIFT top 3 messages, 2008-2010
Figure 27 Comparing MT 700 with MT 734, 2008-2010
Figure 26 SWIFT trade traffic worldwide – comparison by month, 2009-2010
Figure 24 SWIFT trade traffic worldwidein number of messages, 2003-2010
50
40
30
20
10
0
2003 2004 2005 2006 2007 2008 2009 2010
(million) 2010 growthcompared to
2009
Total growth5.81%
Cat 7 growth8.24%
Cat 4 growth-0.79%
Figure 26 SWIFT trade traffic worldwide – comparison by month, 2009-2010
5
4
3
2
1
0
Jan Feb Mar Apr May Jun Jul Aug Sep Oct Nov Dec
Vol
ume
of m
essa
ges
(milli
on) Totals (2010)
Totals (2009) Cat 7 (2010)
Cat 7 (2009)
Cat 4 (2010)
Cat 4 (2009)
13
12
11
10
9
8
7
6
5
4
3
2
1
0
2008 2009 2010 2008 2009 2010
milli
on m
essa
ges
MT 799 - Free format message MT 700 - Issue of a documentary credit MT 707 - Amendment to a documentary credit
MT 400 - Advice of payment MT 410 - Acknowledgement MT 499 - Free format message
Category 7
Category 4
MT 700 - Issue of a documentary credit MT 734 - Advice of refusal
6.5
6.0
5.5
5.0
4.5
4.0
3.5
3.0
2.5
2.0
1.5
1.0
0.5
0
2008 2009 2010
milli
on m
essa
ges
2010 growth compared to
2009
MT 700 growth 6,55%
MT 734 growth 14%
Rethinking tRade & Finance: icc global SuRvey 2011 36
Although the margins are small, it is interesting to note that use of the MT 734 messages decreased in 2009, but in 2010 was back to 2008 levels. Figure 27 shows the number of MT 734 messages sent bank-to-bank, com-pared to the number of MT 700. As stated in the SWIFT User Handbook, “the MT 734 is sent by the issuing bank to the bank from which it has received documents related to a documentary credit. It may also be sent by the bank nominated to pay/accept/negotiate/incur a deferred payment undertaking to the bank from which it has received documents. It is used to advise the Receiver that the Sender considers the documents, as they appear on their face, not to be in accordance with the terms and conditions of the credit and that, conse quently, it refuses them for the discrepancies stated. The Sender also provides the Receiver with details regarding the disposal of the documents. This message type may also be used for claiming a refund.”
As noted by ICC, it is generally accepted that refusal rates on first presentation are in the region of 70-75%, so these figures would there fore seem to be very much at the lower end of most people’s expectations. This may be due to the fact that not all banks utilize the structured MT 734 and choose to use the free format MT 799. However, the percentage of MT 734 refusal messages indicated is still significant. It should also be noted that the 70-75% figure includes refusals made bank-to-beneficiary/presenter, which would fall outside the SWIFT messaging system for advising.
Before looking at the currencies and amounts from the SWIFT Watch Value Analyser, it is necessary to first consider the volume of MT 700. In 2010, the volume of MT 700 increased by 6.6%. Compared to the decrease of 1.9% in 2009 vs 2008, 6.6% growth shows a recovery after the crisis. The figures show a low of 320,718 messages in February, a high of 453,320 in March and an end of year figure of 419,761 in December.
From the SWIFT Watch Value Analyser, MT 700 was selected because it is a structured message that contains the structured field 32B. This field contains the currency code and amount of the documentary credit. But the MT 700 only represents 15% of category 7, while the free format trade message type MT 799 represents 37%. Note that the documentary credits issued through MT 799 were not taken
Figure 28 SWIFT MT 700 (Sent), issue of a documentary credit comparison, 2008-2010
Figure 29 Currency percentage breakdown for L/Cs, December 2010
500,000
450,000
400,000
350,000
300,000
250,000
200,000
150,000
100,000
50,000
0Jan Feb Mar Apr May Jun Jul Aug Sept Oct Nov Dec
2010
2009
2008
Other 3%GBP 0.5%AED 1%JPY 4%
EUR 13%
USD 79%
Other 3%AED 1%CNY 2%JPY 2%
EUR 10%
USD 82%
Other 3%GBP 0.5%AED 1%JPY 4%
EUR 13%
USD 79%
Other 3%AED 1%CNY 2%JPY 2%
EUR 10%
USD 82%
Currencycode
Number ofmessagessent
Amount sent (converted to K USD)
Average amount (K USD)
USD 329,964 193,051,138 585 K
EUR 51,591 23,465,148 K 446 K
JPY 15,851 5,733,564 362 K
AED 2,467 1,964,753 796 K
GBP 2,219 608,885 274 K
Other 13,200 10,542358 799 K
TOTAL 416,292 235,365,846 565 K
Number
(MT 700)
Amount
(MT 700)
Rethinking tRade & Finance: icc global SuRvey 2011 Rethinking tRade & Finance: icc global SuRvey 2011 37
into account in this analysis and only the MT 700 of December 2010 have been analyzed.
A fixed rate of exchange to the USD was used throughout so as to avoid any distortions in values.
The “Amount” (from field 32B) was converted to USD using the rate corresponding to the “Currency Code” (from field 32B), before the sum calculations. This is called “value” or “amount”.
In accordance with SWIFT’s Data Retrieval Policy, all retrieved data is presented in aggregated and anonymous form.
For comparative purposes, the average value of a documentary collection was 83K against 565K for a documentary credit.
In December 2010, “Asia-Pacific” was the region that initiated 64% of the import trans-actions, because it sent almost 64% of the MT 700 (in volume), followed by “Europe–Euro-zone” with 11%. But in average value (con-verted in K USD), these two regions were not the highest.
The highest number of L/Cs was issued by Asia-Pacific, and most of the Asia-Pacific traffic is intra-regional. Asia-Pacific is using this instrument much more than any other region. This can explain why the average value of an L/C in this region was not the highest (516,000 USD for imports).
Figure 30 Currency volume and value of L/Cs issued – segmented
Asia-Pacific
265 130
Europe – Euro Zone
45 414
Middle East
31 879
Africa
28 870
Europe – Non Euro Zone
22 549
North America
11 656
Central & Latin America
10 794
Volume
Value converted to USD
Asia-Pacific
516 K
Europe – Euro Zone
549 K
Middle East
628 K
Africa
495 K
Europe – Non Euro Zone
1 279 K
North America
550 K
Central & Latin America
369 K
200 000
1 000 K
300 000
1 500 K
100 000Dec 2010
500 KDec 2010
Rethinking tRade & Finance: icc global SuRvey 2011 38
SWIFT regional analysis
Asia-Pacific continues to register far greater volumes for sent (import) messages. As one might expect, the regions with the largest volumes– Asia-Pacific, Europe Eurozone and North America – showed larger fluctuations than those with smaller volumes. All regions showed an improvement in March 2010 following a drop in February 2010. Comparing 2010 with 2009, Africa showed the highest growth of 21.2% followed by Asia-Pacific with 10.1% and Central & Latin America with 9.7%.
Concerning the volume of transactions sent by Africa in 2010 (import), the countries that imported the most were respectively Algeria, South Africa, Tunisia, Morocco and Nigeria. From these top five countries, Algeria showed the highest growth of 101.9%, while the other four countries had much lower growth or a decline: between -4% and +9%. Algeria is leading the growth of Africa, perhaps due to the change in legislation on imports in mid-2009 that declared: “All imports into Algeria should mandatorily be settled through L/Cs.”
Although import growth was highest in Africa (21.2%), because of its small volumes, the region did not have a major impact on world growth. In fact, the region with the highest volume was Asia-Pacific with 10.1%. In this region, the leading countries in terms of import volumes in 2010 were, respectively, Hong
Kong, China, India, Republic of Korea and Japan. Of these, China showed the highest rate of growth (15.4%), followed by India (13.9%).
Note that the growth in Africa followed a previous growth (+1.5%) while growth in Asia-Pacific followed a previous decline (-5.5%).
Top regions in 2010, in % increase of categories 4 & 7 sent (import)
Asia-Pacific continued to register far greater volumes for received (export) messages. These figures demonstrate that the vast majority of Asia-Pacific “sent” messages remained within the region. Asia-Pacific also features prominently in the destination for messages sent from all other regions.
When 2010 is compared with 2009, Africa showed the highest growth of 14% followed by Asia-Pacific with 8.2% and by Central & Latin America with 3.9%.
Figure 31 SWIFT trade traffic by region (sent), 2008-2010, categories 4 and 7
2008 2009 2010
0
400,000
800,000
1,200,000
1,600,000
2,000,000
2,400,000
Jan
Feb
Mar
Apr
May
Jun
Jul
Aug
Sep Oct
Nov
Dec Jan
Feb
Mar
Apr
May
Jun
Jul
Aug
Sep
tO
ctN
ovD
ec Jan
Feb
Mar
Apr
May
Jun
Jul
Aug
Sep Oct
Nov
Dec
Asia-Pacific
Europe – Non Euro Zone
Europe – Euro Zone
Africa
North America
Central & Latin America
Middle East
Figure 32 Traffic for Africa and Asia-Pacific
2008
20 000 000
1 500 000
1 000 000
500 000
0
15 000 000
10 000 000
5 000 000
0
2009 2010
2008 2009 2010
+1.5%+21.2%
-5.5%+10.1%
Africa
Asia-Pacific
Rethinking tRade & Finance: icc global SuRvey 2011 Rethinking tRade & Finance: icc global SuRvey 2011 39
Concerning the volume of transactions received by Africa in 2010 (export), the countries that exported the most were respectively Algeria, Tunisia, South Africa, Morocco and Nigeria. Of these top five countries, Algeria showed the highest growth rate of 76.4%, while the other four countries had much lower growth or a decline: between -16.1% and +8.4%.
Although growth was highest in Africa, the Continent does not have a major influence on world growth because of its small volumes. The region with the highest volume influences world growth, and that is the second region to show a high growth: Asia-Pacific with 8.2%. In volume of transactions received by Asia-Pacific in 2010 (export), the countries that received the most were, respectively, China, Hong Kong, India, Republic of Korea and Taiwan. Of these top five countries, China showed the highest growth rate of 13.4%, followed by India (7.6%).
Note that growth in Africa followed a previous growth (+2.3%) while the growth in Asia-Pacific followed a previous decline (-8.7%).
Top regions in 2010, in % increase of category 4 & 7 received (export)
It is striking, although not surprising, to see the difference in usage between category 4 and category 7 on a regional basis. Use of category 4 is low in Asia-Pacific, compared with the use of L/Cs, whereas in the Europe Eurozone,
the use of category 4 was much higher as a percentage of the total. This was also true of North America. During the period of the charts, the usage of the category 4 messages was declining, while that of category 7 was growing in 2010.
Since the scale is the same, it is interesting to see that Europe Eurozone used category 4 almost as much as category 7. For Asia-Pacific, category 7 was used much more than category 4.
Among major recipient regions, the two regions that imported more than others (sent messages) from their own regions (using SWIFT messages) were Asia-Pacific and the Middle East, both in 2009 and 2010. This was also true for exporting (received messages). However, on the export side, Europe Euro-zone’s principal export market is also its own region. All of this intra-regional trade was similar
in 2009 and 2010.
Figure 34 Africa and Asia-Pacific Export transactions received
Figure 33 SWIFT trade traffic by region (received), 2008-2010, category 4 and 7
2008
0
400,000
800,000
1,200,000
1,600,000
2,000,000
2,400,000
Jan
Feb
Mar
Apr
May
Jun
Jul
Aug
Sep Oct
Nov
Dec Jan
Feb
Mar
Apr
May
Jun
Jul
Aug
Sep
tO
ctN
ovD
ec Jan
Feb
Mar
Apr
May
Jun
Jul
Aug
Sep Oct
Nov
Dec
Asia-Pacific
Europe – Euro Zone
Africa
North America
Europe – Non Euro Zone Central & Latin America
2009 2010
Middle East
2008
20 000 000
1 500 000
1 000 000
500 000
0
25 000 000
20 000 000
15 000 000
10 000 000
5 000 000
0
2009 2010
2008 2009 2010
+2.3%+14%
-8.7%
Africa
Asia-Pacific
+8.2%
Rethinking tRade & Finance: icc global SuRvey 2011 40
As one example from Figure 37 regarding messages sent, Africa sent 36% of its trade messages to the Europe Eurozone. This meant that 36% of Africa’s imports come from the Europe-Eurozone. Most of the imports in Asia-Pacific came from their own region (71%).
As an example of messages received, Africa received 41% of its trade messages from Europe Eurozone. This meant that 41% of Africa’s exports go to Europe Eurozone. Most of the exports from Asia-Pacific go to other countries in its region (53%).
Figure 37 SWIFT trade traffic: major recipient regions 2010
Total SWIFT Messages Sent(% of each row total)
Africa Asia-PacificCentral & Latin
America
Europe – Euro Zone
Europe – Non Euro
ZoneMiddle East
North America
All counterparty countries
Africa 16% 22% 0% 36% 12% 6% 7% 100.00%
Asia-Pacific 1% 71% 2% 9% 4% 3% 10% 100.00%
Central & Latin America 0% 36% 23% 15% 3% 1% 22% 100.00%
Europe - Euro Zone 9% 41% 3% 28% 10% 6% 3% 100.00%
Europe - Non Euro Zone 7% 42% 2% 18% 19% 7% 5% 100.00%
Middle East 3% 29% 1% 18% 8% 32% 9% 100.00%
North America 3% 61% 6% 7% 6% 6% 11% 100.00%
All Countries 4% 54% 3% 15% 8% 7% 8% 100.00%
Total SWIFT Messages Received(% of each row total)
Africa Asia-PacificCentral & Latin
America
Europe – Euro Zone
Europe – Non Euro
ZoneMiddle East
North America
All counterparty countries
Africa 17% 11% 0% 41% 14% 7% 10% 100.00%
Asia-Pacific 2% 53% 2% 15% 7% 5% 16% 100.00%
Central & Latin America 1% 21% 22% 21% 5% 2% 29% 100.00%
Europe - Euro Zone 11% 22% 3% 37% 11% 10% 6% 100.00%
Europe - Non Euro Zone 8% 22% 1% 27% 22% 10% 11% 100.00%
Middle East 4% 19% 0% 18% 8% 40% 10% 100.00%
North America 4% 48% 7% 8% 5% 10% 18% 100.00%
All Countries 5% 40% 3% 20% 9% 9% 14% 100.00%
Figure 35 Category 4 by region sent, 2008, 2009 & 2010
Figure 36 Category 7 by region sent, 2008, 2009 & 2010Figure 35 Fig 36
16m
14m
12m
10m
8m
6m
4m
2m
0
16m
14m
12m
10m
8m
6m
4m
2m
0
2008
Eur
ope–
Eur
o Zo
ne
Eur
ope–
Eur
o Zo
ne
Nor
th A
mer
ica
Nor
th A
mer
ica
Asi
a-P
acifi
c
Asi
a-P
acifi
c
Eur
ope–
Non
Eur
o Zo
ne
Eur
ope–
Non
Eur
o Zo
ne
Mid
dle
Eas
t
Mid
dle
Eas
t
Afri
ca
Afri
ca
Cen
tral
&La
tin A
mer
ica
Cen
tral
&La
tin A
mer
ica
2010 2009 2008 20102009
Figure 35 Fig 36
16m
14m
12m
10m
8m
6m
4m
2m
0
16m
14m
12m
10m
8m
6m
4m
2m
0
2008
Eur
ope–
Eur
o Zo
ne
Eur
ope–
Eur
o Zo
ne
Nor
th A
mer
ica
Nor
th A
mer
ica
Asi
a-P
acifi
c
Asi
a-P
acifi
c
Eur
ope–
Non
Eur
o Zo
ne
Eur
ope–
Non
Eur
o Zo
ne
Mid
dle
Eas
t
Mid
dle
Eas
t
Afri
ca
Afri
ca
Cen
tral
&La
tin A
mer
ica
Cen
tral
&La
tin A
mer
ica
2010 2009 2008 20102009
Rethinking tRade & Finance: icc global SuRvey 2011 Rethinking tRade & Finance: icc global SuRvey 2011 41
More than 90% of import (sent messages) and export (received messages) – messages sent over SWIFT – are cross-border. North America (Canada the US, and Mexico) and the Middle East showed the lowest level of
exports cross-border (received messages), but both increased in 2010. Central and Latin America countries figured highest on both import and export.
Special SWIFT insights on developing countries
East Asia and Pacific – South Asia
These two regions represented the largest volume in number of messages of category 4 and 7 sent. They also showed the strongest recovery in 2010, with growth rates of 13.1% and 15.5%. During the period of 2004-2010, they never experienced a decline.
In 2010, in the region East Asia and Pacific, the countries that influenced regional growth of 13.1% were China (15%) and Indonesia (15%). Some countries that year, such as Vanatu and Kiribati, showed a decline, but their trade volumes are very low and do not impact the region.
In South Asia” in 2010, the countries that influenced regional growth of 15.5% were India (14%) and Bangladesh (22%). None of the countries in this region showed a decline.
Figure 40 SWIFT trade traffic (sent): East Asia and Pacific – South Asia, 2003-2010, category 4 and 7
20%
18%
16%
14%
12%
10%
8%
6%
4%
2%
0%
2004
17.3%
2005
8.3%
2006
8.9%
2007
7.3%
2008
1.4%
2009
2.7%
2010
15.5%
20%
18%
16%
14%
12%
10%
8%
6%
4%
2%
0%
2004
10.1%
South Asia
East Asia and Pacific
2005
2.8%
2006
6.1%
2007
8.7%
2008
1.8%
2009
0.5%
2010
13.1%
Figure 38 Fig 39
100%
95%
90%
85%
80%
75%
70%
2008
Cen
tral
&
Latin
Am
eric
a
Eur
ope–
E
uro
Zone
Afri
ca
Nor
th A
mer
ica
Eur
ope–
N
on E
uro
Zone
Asi
a-P
acifi
c
Mid
dle
Eas
t
All
coun
trie
s
Cen
tral
&
Latin
Am
eric
a
Eur
ope–
E
uro
Zone
Afri
ca
Nor
th A
mer
ica
Eur
ope–
N
on E
uro
Zone
Asi
a-P
acifi
c
Mid
dle
Eas
t
All
coun
trie
s
100%
95%
90%
85%
80%
75%
70%
2010 2009 2008 20102009
Rethinking tRade & Finance: icc global SuRvey 2011 42
Figure 41 SWIFT trade traffic (sent): Middle East and North Africa – Sub-Saharan Africa, 2003-2010, categories 4 and 7
Figure 42 SWIFT trade traffic: by region (sent), 2003-2010, category 4 and 7
Middle East and North Africa – Sub-Saharan Africa
The Middle East and North Africa have less volume in number of messages of category 4 and 7 sent. They also showed a lower recovery, with a growth of 2.7% and 7% in 2010. Sub-Saharan Africa showed a decline (-3.7%) in 2009.
In the region Middle East and North Africa, the countries that influenced regional growth (2.7%) in 2010 were Syrian Arab Republic (23%) and Tunisia (9%). Some countries had an impact on the region with their decline in 2010, i.e., Morocco (-3%), Jordan (-3%), Djibouti, Yemen and Libya.
In the region Sub-Saharan Africa, the countries that led regional growth (7%) in 2010 were Kenya (14%), Ethiopia (12%), Nigeria and Ghana. Some countries experienced a decline, including Madagascar (-14%), Angola (-9%), Mauritius and Zimbabwe.
Latin America and the Caribbean – Europe and Central Asia
The two regions in the above chart have the lowest volume in number of messages of category 4 and 7 sent. They also show the lowest rates of recovery: 4.4% and 1.4% in 2010. Moreover, they both showed a decline (-11.7% and -15.6%) in 2009.
In Latin America and the Caribbean, the countries influencing regional growth (4.4%) in 2010 were Paraguay (10%), Guatemala (8%) and Ecuador (5%). Some countries declined, including Bolivia (-3%), Honduras (-3%) and Haiti.
In Europe and Central Asia, the countries that led regional growth (1.4%) in 2010 were Uzbekistan (7%) and Ukraine (2%). The countries declining the same year included Kosovo (-3%), Georgia (-2%) and Turkmenistan.
12%
10%
8%
6%
4%
2%
0%
-2%
-4%
-6%
2004
5.9%
2005
1.7%
2006
9.8%
2007
1.4%
2008
-0.896%
2009
-3.7%
2010
7.0%
12%
10%
8%
6%
4%
2%
0%
2004
8.3%
Sub-Saharan Africa
Middle East and North Africa
2005
0.6%
2006
3.2%
2007
4.4%
2008
0.4%
2009
1.1%
2010
2.7%
15% 10% 5% 0%
-5% -10% -15%
12.3%
4.5% 4.3% 2.6%
-1,4%
-11.7% 2004 2005 2006 2007 2008 2009 2010
4.4%
70%
60%
50%
40%
30%
20%
10%
0%
-10%
-20%
5.7%
Latin America and the Caribbean
Europe and Central Asia
4.0%
15.6%
63.9%
13.4%
-15.6% 2004 2005 2006 2007 2008 2009 2010
1.4%
15% 10% 5% 0%
-5% -10% -15%
12.3%
4.5% 4.3% 2.6%
-1,4%
-11.7% 2004 2005 2006 2007 2008 2009 2010
4.4%
70%
60%
50%
40%
30%
20%
10%
0%
-10%
-20%
5.7%
Latin America and the Caribbean
Europe and Central Asia
4.0%
15.6%
63.9%
13.4%
-15.6% 2004 2005 2006 2007 2008 2009 2010
1.4%
Rethinking tRade & Finance: icc global SuRvey 2011 Rethinking tRade & Finance: icc global SuRvey 2011 43
EBRD IFC ADB IADB
Programme Title Trade Facilitation Programme (TFP)
Global Trade Finance Programme (GTFP)
Trade Finance Programme (TFP)
Trade Finance Facilitation Programme (TFFP)
Number of countries of operation
21 84 14 19
Programme commencement
1999 2005 2004 2005
Number of transactions since commencement
10,100 8,371 2,433 1,183
Value of transactions since commencement
USD 8.5 billion USD 10.8 billion USD 5.2 billion (90% from 2009 and 2010)
USD 1.2 billion
Number of confirming banks
738 600 102 241
Claims to date 2 claims – losses zero zero zero zero
Figure 43 Multilateral development bank programmes
Section 4 A regional focus from the multilateral development banks
Overview
The role of multilateral development banks in supporting trade finance moved centre stage as the financial crisis evolved. Without any doubt, the development banks stepped into the breach in many emerging and developing countries to keep trade supply lines open. All of the development banks without exception increased their limits and resources as many international banks retreated from developing markets. The period also saw innovations and flexible trade finance solutions being brought to the market by development banks.
This section of the report details the measures taken and economic crisis responses implemented by the key development banks:
n European Bank for Reconstruction and Development (EBRD);
n International Finance Corporation (IFC);
n Asian Development Bank (ADB); and
n Inter American Development Bank (IDB)
Historically, the EBRD was the first trade facilitation programme to begin activity in what were considered to be high-risk emerging markets. The EBRD took the initiative in trade facilitation in 1999, and the role played by such programmes in supporting trade through difficult times is widely acknowledged and respected.
The standby letter of credit issued subject to the UCP 600 rules of the ICC is a mainstay in underpinning trade risks in all of the trade facilitation initiatives. Interestingly, despite supporting more than USD 25bn worth of trade into what could, in many instances, be considered high-risk markets, there had not been any write-offs or losses at the time of commissioning this Report.
European Bank for Reconstruction and Development (EBRD)
Background and markets
The EBRD’s Trade Facilitation Programme pro motes international trade with Central and Eastern Europe and the Commonwealth of Independent States. Through the programme, the EBRD provides guarantees to international confirming banks. In so doing, it takes the poli ti cal and commercial payment risk of trans actions undertaken by issuing banks in countries where the EBRD operates. The programme can guarantee any genuine trade trans action associated with exports from, imports to and between the EBRD’s countries of operations. 110 issuing banks in the Bank’s region of operations participate in the programme together with over 700 confirming banks throughout the world.
Rethinking tRade & Finance: icc global SuRvey 2011 44
Individual summary of activity (volumes & values 2010)
As the global financial crisis deepened post-Lehman, trade finance saw a sharp volume drop in the EBRD region. This reflected a com plex combination of demand and sup-ply factors, although IMF-BAFT (Bankers’ Association for Finance and Trade) survey data suggest that, on balance, most of the contraction in trade volumes was explained by demand-side effects.
On the demand side, trade volumes contracted sharply worldwide in the last quarter of 2008 and in the first half of 2009 owing to a com-bi nation of de-stocking, postponement of invest ment projects, reduced purchasing power of consumers, lower commodity prices and tight credit conditions. In the CIS region trade contraction was particularly sharp, falling by 30 to 45%. It affected equally trade flows between CIS countries and the rest of the world as well as intraregional trade flows (Figure 44).
On the supply side, trade finance was adversely affected by a decline in the risk-taking capacity of banks, private insurance underwriters and investment funds as well as export credit agencies. Initially, this reflected tight liquidity conditions.
Following significant liquidity injections, credit conditions nonetheless remained tight and credit continued contracting in many countries in the region due to banks’ concerns about the quality of their portfolios and rising non-performing loans, as well as the need for deleveraging. Systematic data on trade finance is scarce.
While the drop in the supply of trade finance largely reflected a drop in demand, its impact on the market players has been uneven. In particular, many banks in EBRD region saw their trade credit lines with Western confirming banks reduced or suspended. This was particularly the case for smaller or regional banks with lower credit ratings, including EBRD partner banks under its Trade Facilitation Programme (TFP), and banks in Ukraine and Kazakhstan where banking sectors suffered greatly as a result of defaults by well-known banks. At the same time, larger state-owned banks and certain foreign subsidiaries, which retained access to cheaper sources of funding, were able to gain market share. This may have negative long-term implications for competition in the trade finance segment, and hence efficiency and innovation.
In addition, for small- and medium-sized companies it became increasingly difficult to obtain funding for their international business. This trend was documented by a World Bank survey of trade finance conducted in March-April 2009 in 14 developing and emerging market economies, including Turkey and Ukraine. This finding is partly explained by SMEs’ traditionally greater reliance on services of the smaller and regional banks, which found themselves under severe pressure, and partly by the fact that many larger banks chose to focus on their core clients.
To partly mitigate these effects, EBRD continued to expand its TFP programme, which was launched in 1999. The programme can guarantee any genuine trade transaction to, from and within the countries of operation. 114 issuing banks in 21 countries of operations currently participate in the programme with limits exceeding EUR 2 billion, as well as more than 700 confirming banks throughout the world. Since 1999 TFP has facilitated more than 10,000 foreign trade transactions for a total amount of EUR 6bn.
A good example of the value of TFP during the crisis is a guarantee transaction in Ukraine, which supported import and distribution of agri cultural machinery. This guarantee
Figure 44 Key trade flows in the CIS (in annual percentage change)
100%
80%
60%
40%
20%
0%
-20%
-40%
-60%
H1 2010
2009
“RoW” = Rest of the World. Source: CISStat
Rus
to
CIS
Rus
to
Ro
W
CIS
to
Rus
Ro
W t
o R
us
Ukr
to
CIS
Ukr
to
Ro
W
CIS
to
Ukr
Ro
W t
o U
kr
Kaz
to
CIS
Kaz
to
Ro
W
CIS
to
Kaz
Ro
W t
o K
az
Rethinking tRade & Finance: icc global SuRvey 2011 Rethinking tRade & Finance: icc global SuRvey 2011 45
covered a letter of credit issued by a bank in Ukraine and confirmed by a bank in Germany. The original agreement predated the crisis and was concluded without EBRD support, but in order for shipments of equipment to continue throughout 2009, EBRD was asked to guarantee payments under this contract up to an aggregate value of EUR 50 million. The TFP programme remained in great demand in 2010, with support provided to 1,274 foreign trade transactions for a total of EUR774 million.
Through the TFP’s donor-funded Technical Co-operation (TC), consultancy services and seminars were delivered on a range of trade-related topics to banks in EBRD countries of operations in Central, Southern and Eastern Europe, Central Asia and the Caucasus. The TC projects have helped to establish trade finance departments in various banks by transferring specialist knowledge, optimizing the under-standing and processing of trade finance products, providing for better transactional structuring skills and organizing trade finance banking conferences and workshops for bankers and corporate customers.
Since 2002, more than 800 bankers from more than 100 banks in 17 countries have received consultancy services and have been trained through presentations, case studies, workshops, seminars, meetings with clients and team discussions.
Default or claims experience
Economies and subsequently banks in EBRD’s countries of operation were affected by the financial crises of 2008/2009. During this period, under the programme the EBRD’s TFP was confronted with two claims from confirming banks for guarantees which covered trade from issuing banks in Kazakhstan and Ukraine. Both claims were settled immediately, and the EBRD is in the process of restructuring and recovering outstanding amounts.
Regulatory impact on scale and scope of business activity
Despite the recent recovery, the attractiveness of trade finance to banks may be negatively affected by the changes currently under discussion in related Basel rules. Under Basel II, short term off balance sheet products such as letters of credit and shipping guarantees are subject to a 20% credit conversion factor used in risk weighted assets calculations, while over one-year L/Cs and some other trade products are subject to a 50% factor. Under Basel III, these conversion factors may be increased to 100%. This general rule was designed to curb creative use of off-balance-sheet exposures, but it may end up having the unintended consequences of sharply raising capital costs of providing trade finance.
Outlook for the future
In 2010, trade bounced back strongly, and credit growth appears to have resumed towards the middle of the year. Recovery in the region generally started by the end of the first quarter of 2010 in line with the general recovery in global trade (with the notable exception of Kazakhstan, where import volumes continued contracting). The recovery has since been sustained, but the level of trade activity in the CIS remains around 10-15% below pre-crisis levels. Trade finance volumes also began to recover from the lows of 2008/2009, although credit growth in this segment appears to have been moderate and is likely to be uneven, as many local banks in Eastern Europe and the CIS region are still suffering from high levels of non-performing loans, while confirming banks often remain reluctant to increase trade credit lines.
See EBRD case study, page 46
Rethinking tRade & Finance: icc global SuRvey 2011 46
EBRD case study
Victoria ChentsovaHead of Trade & Structured Finance Credit Bank of Moscow
Credit Bank of Moscow was one of the first private banks established in the USSR and, over a short period of time, has achieved a strong position in supporting the international trade and finance needs of the emerging Russian corporate market, especially in the small- to medium-sized (SME) sectors.
In common with most countries, the Russian market was severely challenged by the financial crisis that emerged in the last quarter of 2008. Throughout 2009 and into 2010, liquidity for trade finance was difficult to come by, as was risk coverage for trade finance instruments with deferred payment maturities. However, with the support of the development banks’ trade finance programs, such as the TFP of the EBRD and the GTFP of the IFC, the bank managed to serve all of its customers’ needs through this challenging period.
In terms of trade finance operations, Credit Bank of Moscow fared well. Of course, some of its customers experienced difficulties, but by working closely with customers in structuring transactions and in negotiating the best possible terms, the bank is pleased to advise that in the end it had few adverse effects from the financial crisis.
It is worth highlighting that once the crisis took hold, the Russian Government followed a two-strand approach for supporting the economy and in particular international trade activity. First, through an unprecedented injection of liquid funds for Russian banks, the Central Bank addressed the liquidity tightening gap that nearly crushed the banking system in late 2008. Over 200 of the largest banks were given access to short-term Central Bank loans. In this way, the Russian monetary authorities delivered support of RUB3.5 to Russian banks, the equivalent of USD 100bln or 8% of Russian GDP.
Furthermore, the Russian Government was one of the G-20 members that offered a massive stimulus package to support the commercial sector. Around four-fifths of bank lending is directed at corporate clients, and trade finance is an important element of corporate finance in Russia, though it may compete internally within a bank for financing the same clients.
At the end of the day, Credit Bank of Moscow had no actual losses in respect of trade deals right through the period of severe stress in financial sectors worldwide.
With regard to finance customers in Russia, in the first quarter of 2011 there was no longer a problem with a lack of liquidity for good trade deals, and the tenors were back to what they were before the financial crisis. In fact, the crisis tended to make the state-owned banks more focused on corporate trade business, and this in turn created a more challenging market for trade banks to deliver the best trade solutions to customers, large and small – at the right price.
This market-oriented approach from the state banks is now a major challenge, but the Credit Bank of Moscow enjoys a challenge that results in improvements in the environment for its trade finance clients on whose efforts economic activity and development very much depend.
Rethinking tRade & Finance: icc global SuRvey 2011 Rethinking tRade & Finance: icc global SuRvey 2011 47
The Inter-American Development Bank (IDB)
Background and markets
The recent economic crisis reminded Latin America, the Caribbean (LAC) and the world at large of the importance of international trade flows, liquidity and financial sector expertise. When the financial markets crisis hit, the Inter-American Development Bank’s (IDB’s) Trade Finance Reactivation Programme (TFRP) ensured a fast response in the region. The TFRP recognizes the importance of multilateral development bank support to mitigate the adverse impact of volatility in international capital flows and complement other instruments in support of free trade and regional integration.
Recognizing the counter-cyclical role that international trade plays to promote the exchange of goods and services, create jobs, enhance national production and foster inclusive economies, the TFRP made a commitment to strengthen supply-side capacity and trade-related infrastructure in LAC. The three key components of the TFRP include (1) the Trade Finance Facilitation Programme (TFFP), which offers guarantees and loans to ensure consistent trade flows and integration; (2) trade funds, which provide export financing often to SMEs’ importer and exporter clients; and (3) trade finance technical assistance and training.
The region-wide exposure of the programme allows the IDB to monitor and react to trends in LAC. Data reflect that trade conditions and regional demand are on the upswing, as evidenced by increases in intra-regional trade, correspondent bank lines for issuing banks, dollar volume increases and the number of transactions supported by the IDB’s TFFP and trade funds.
Individual summary of activity (volumes & values 2010)
The IDB designs tailored instruments and products to address the following trade finance objectives: (1) to provide a stable, reliable source of financing for banks in the region; (2) to mitigate transaction and systemic risks for banks seeking trade deals, particularly for smaller countries and smaller banks; (3) to further regional integration by prioritizing South-South trade deals in order to reduce reliance on developed markets, address market
failures which prevent SMEs from accessing new markets, increase trade transaction volume and diversify small economies’ goods and services; and (4) build a network of issuing and confirming banks that reacts quickly to financing and technical needs, especially in times of market volatility.
The IDB’s Trade Finance Facilitation Programme (TFFP) is a highly efficient and fast-delivery vehicle that provides guarantees and loans allowing importers and exporters to reduce systemic and transaction risks, access new capital sources and strengthen competitiveness. The TFFP subsequently launched an A/B loan product designed specifically to target the liquidity shortage by directly funding clients’ trade-related activities, while guarantees enable the LAC network of issuing banks to access a broader number of international confirming banks. The programme issues guarantees in order to cover confirming banks’ trade finance risk and to provide trade finance loans to issuing banks in LAC so they can continue to finance export and import clients.
The TFFP has over USD 1.2 billion in approved credit lines and has issued guarantees for over USD 800 million in support of over 1,100 individual international trade transactions totalling over USD 1.2 billion. The TFFP has built a network of 72 issuing banks in 19 countries. Through its network of international confirming banks, the programme is now present in 54 countries worldwide, with 241 confirming banks belonging to 89 banking groups. Banks that were already confirming banks are now re-joining as B Lenders – furthering the virtuous cycle and maintaining a constant source of trade financing.
Second, the IDB’s trade funds seek to mobilize equity investors to offer short-term trade finance for medium-sized exporters through special-purpose trade vehicles. These innovative instruments provide access to finance to smaller clients who would other-wise face unaffordable or limited financing from conventional banking outlets.
In 2010 alone, trade funds in which the IDB financed over USD 914.38 million in trade activity, supporting over 1,400 transactions in 12 different countries with 70 different com panies. Since trade funds are especially attractive to SME importer and exporter clients, the majority of the companies financed included this critical market segment. Extensions to existing funds will further mobilize
Rethinking tRade & Finance: icc global SuRvey 2011 48
trade financing, including dedicated private equity in the region. The multiplier effect of this stimulates the production, movement and consumption of more goods and services across a gamut of countries and industries.
Finally, trade finance technical assistance and training programmes seek to further trade finance knowledge and capacity in the
region. To respond to the fact that the trade finance market is dominated by a relatively small number of big financial players, the IDB provided technical assistance focused on smaller financial institutions. The programme seeks to incorporate banks with relatively smaller asset sizes and trade finance portfolios into the TFFP programme. The IDB provided technical assistance, not only to the trade finance departments of these institutions, but also to their importer and exporter clients who may not be familiar with export or import finance procedures or ICC rules. The IDB also conducted credit analysis and monitored FIs’ compliance with TFFP requirements.
In a second programme, the IDB engages issuing banks and their SME clients in advanced trade finance training in order to further effectiveness and inclusiveness. Training held in 2007 focused on supply- and demand-side barriers, knowledge-sharing and developing competitive advantages. Thanks to donor funding and participating trade finance institution employ ees, as well as SME clients, trade finance training outperformed expectations. With an initial goal of training ten issuing banks and SME clients representing around 150-200 people, as of February 2010 a total of 22 banks, 500 bank staff and 300 SME clients had been trained in seven countries. To complement and maintain continuous support, an e-learning platform is being developed, which will allow the IDB to expand outreach exponentially, especially to SME end-beneficiaries, and focus on sustainable trade. This module includes trade of organic and fair trade products.
Default or claims experience
To date, there have been no defaults and no pay-outs under the guarantees issued.
Regulatory impact on scale and scope of business activity
Internal processes are constantly evolving to respond to the dynamic and short-term nature of trade finance. For example, evolving “Know Your Client” (KYC) procedures and Basel II regulatory adherence have a negative impact on big banks’ business appetite to explore smaller, lesser-known client relationships. Liquidity, market diversification and regulation risks are examples of systemic risks that are detrimental to LAC financial systems, especially in smaller economies.
Figure 46 Amount of TFFP transactions supported in USD MM since 2005 (aggregate)
Figure 45 Number of TFFP transactions supported since 2005
2005
Number of inter-regional transactions
Number of intra-regional transactions 300
250
200
150
100
50
0
37
33
2006
72
2007
165
2008
286
2009
283
2010
301
61
11
132
33
224
62
216
67
238
63
4
2005
Amount of inter-regional transactions
Amount of intra-regional transactions 1200
1100
1000
900
800
700
600
500
400
300
200
100
0
24.93
33
2006
121.23
2007
292.73
2008
567.22
2009
792.80
2010
1104.56
61
21.97
99.26
132
246.53
46.20
224
473.48
93.74
216
150.24
642.56
229.43
875.13
238
3.30 21.63
2005
Number of inter-regional transactions
Number of intra-regional transactions 300
250
200
150
100
50
0
37
33
2006
72
2007
165
2008
286
2009
283
2010
301
61
11
132
33
224
62
216
67
238
63
4
2005
Amount of inter-regional transactions
Amount of intra-regional transactions 1200
1100
1000
900
800
700
600
500
400
300
200
100
0
24.93
33
2006
121.23
2007
292.73
2008
567.22
2009
792.80
2010
1104.56
61
21.97
99.26
132
246.53
46.20
224
473.48
93.74
216
150.24
642.56
229.43
875.13
238
3.30 21.63
Rethinking tRade & Finance: icc global SuRvey 2011 Rethinking tRade & Finance: icc global SuRvey 2011 49
Summary of developmental impact
As the regional demand for trade finance expands, the IDB’s focus on trade finance guarantees and loans, trade funds and technical assistance will extend its outreach to LAC’s traditionally under-served and support tangible developmental impacts.
One example of this was SME lending growth to emerging exporters and importers involved in trade finance activity. Through a market-friendly approach, the IDB recognized the demands of small- and medium-sized banks, which traditionally work with smaller importers and exporters, and adapted their products and services to respond to their needs. These banks are targeted, given their difficulty accessing international markets, coupled with their critical role in financing SMEs, stimulating employment, reducing poverty, deepening intra-regional trade and fostering a robust and inclusionary real sector – especially important counter-cyclical forces during economic downturns. Within the TFFP’s network of issuing banks, 73% of these count on SME lending as their main business focus. In 2010, of the 13 issuing banks approved, 100% are dedicated to the SME market.
Second, the IDB’s development approach targets smaller, under-served countries in LAC. In 2010, the IDB approved new TFFP issuing banks in the Dominican Republic, Jamaica, Belize, Suriname, Nicaragua, Honduras, Guatemala, Costa Rica, El Salvador, Bolivia and Paraguay.
Third is the emergence of intra-regional transactions – an outcome which emerged from network support to confirming and issuing banks through financing, technical assistance and relationship-building. By fostering intra-regional trade, the IDB is able to ensure a stable source of trade finance and in traditionally larger volumes which, in turn, furthers business alliances, generates jobs and contributes to real sector growth in LAC.
About 10% of the trade guarantees issued thus far support intra-regional trade. For example, the IDB supported the import of Argentine hydroelectric turbines to Paraguay, the export of Brazilian turbo generators to Peru and the import of Argentine automobiles to Honduras. In addition, the TFFP provided Banco de Comercio Exterior de Colombia (BANCOLDEX) with USD 4.1 million in coverage to support several transactions with Ecuador’s Banco de Guayaquil, S.A. for exportation of heavy commercial vehicles.
Fourth, the TFFP is an effective mechanism for transferring liquidity from highly liquid LAC countries to those where liquidity is still constrained, strengthening regional as well as global integration. This trend has been seen in several recent transactions financed by TFFP-approved confirming banks in Panama to issuing banks in Paraguay, Argentina, Brazil and Guatemala. Similarly, confirming banks in Uruguay are financing transactions in other LAC countries, especially Brazil and Paraguay. Following the example of the Panamanian and Uruguayans, branches and subsidiaries of LAC banks in the US with strong levels of liquidity have worked with TFFP’s issuing banks to provide needed trade financing.
Fifth, the TFFP fosters long-term relationships with issuing banks, which is critical for efficiency and agility. While it requires time and dedication upfront to manage the short-term and dynamic nature of trade finance transactions, the TFFP’s implementation stressed the importance of maintaining close relationships with clients. As a result, it has facilitated additional transactions with the same clients, which is especially important when exploring areas of high social impact such as housing, SME and education financing. Leveraging TFFP client relationships, the IDB supports a network of issuing banks by seeking additional financing for their projects and clients that are well-aligned with IDB’s core business areas. In the last two years, 19 projects and USD 520 million in IDB funding have been approved to finance, through financial institutions, high social impact activities such as green building construction, clean and renewable energy, affordable housing, trade and SMEs.
To conclude, the IDB requires that all trans-actions provide clear and recognizable social, environmental and financial benefits for the target beneficiaries, specifically FIs and the SME importer and exporter clients. The IDB adds value by employing a holistic approach. It discovered that by combining its original trade finance loans and guarantees with training, technical assistance and enhanced networks, it could more successfully increase capacity, expertise, access and economic growth in LAC.
Outlook for the future
The IDB is looking for innovative solutions for the future. As one example, in a recently signed partnership, the IDB and Standard
Rethinking tRade & Finance: icc global SuRvey 2011 50
IDB case study
Milto BardiniExecutive Vice President and Investor Relations Director Banco Industrial e Comercial S.A. – BICBANCO
BICBANCO is specialized in offering corporate credit to the Middle Market segment in Brazil – companies with yearly revenues between R$ 50 million and R$ 500 million. With over 70 years of experience, it is one of the most traditional Brazilian banks. Today it is the fifth largest private domestic capital bank in Brazil.
The Brazilian economy remained strong throughout most of 2008 and showed solid growth in all industries. Brazilian GDP that year was projected to be as much as 6% p.a., driven by a rise in credit, investments, consumption, employment and income. From September 2008 onward, however, the deepening crisis impacted still healthy economies, such as Brazil’s. As a result, the country’s economic growth rate began to slow in the fourth quarter of 2008. The sudden change in trends led to a drop in financial liquidity due to systemic risk aversion. The credit crunch worsened throughout the last quarter of the year and further sharpened the downturn in production.
Brazilian authorities introduced a number of mitigating measures starting in September 2008. These included changes in reserve requirement rules, foreign currency auctions and a reduction in taxes (IPI) for new cars and individuals’ income taxes.
Those measures, together with the sound Brazilian economy and financial system, were essential for Brazil to overcome the effects of the crisis in one year. Brazil’s GDP evolved from +5.2% in 2008 to 0.6% in 2009 to + 7.5% in 2010.
The crisis at Bicbanco (from 4Q08 to 1Q09) had the following impacts: a decrease in credit operations, a reduction in deposits, higher rates of liquidity and additional provisions to counter the downturn. After one critical semester, the Bank started to recover and had no need to assign portfolios nor to raise emergency funds.
The fourth quarter of 2009 was a positive turning point, reflected in different market signals: a recovery in demand for credit, much of it for investment purposes; a vigorous supply of time deposits; a pressure on spreads, stemming from fiercer competition that reduced the risks related to margins that had contracted during the crisis; and an improved quality of risks, supported by an expansion of the credit supply.
Bicbanco´s 2009 results were affected more significantly by the inertia of the past than by the thrust of the credit portfolio.
The 2010 post-crisis period saw a steady rise in the loan and time deposit portfolios – a slower pace of growth in the loan portfolio, a drop in the average volumes of free cash flow and stable deposit costs. Trade finance also entered a recovery cycle.
The Bank continues to implement the funding maturity extension program, with issuances of senior debt in international capital markets and medium-term loans backed by multilaterals such as the IDB. These efforts are aimed at producing positive long-term results and require the Bank to bear the burden that such a forward-looking strategy may create.
Foreign trade finance operations are strategically important for the Bank, since they expand its product offerings, ensure loyalty from clients in foreign trade and disperse loan portfolio risks. In this activity, the Bank counts on the support of the IDB. At the end of 2010, the Bank’s trade finance operations totalled R$ 2,258.9 million, or 17.1% of the total loan portfolio.
Rethinking tRade & Finance: icc global SuRvey 2011 Rethinking tRade & Finance: icc global SuRvey 2011 51
Chartered Bank (SCB), a recognized leader in trade finance, disbursed the first co-loan of the Latin American Trade Co-lending Partnership (TCLP). The USD 10 million, 360-day trade finance loan to Banco Industrial e Comercial S.A. (BICBANCO) will facilitate the flow of consumer goods from Brazil to Germany. The goal is that 2011 will include the disbursement of similar trade finance loans under the partnership, as well as the creation of new alliances with leading financial institutions and development organizations in Asia, Europe and the US. A case in point is the recent Memorandum of Understanding signed by IDB and the Export-Import Bank of China during the China-LAC Business Summit in Chengdu, China.
As LAC financial markets continue their recovery, expanding the IDB’s capacity to provide stable and consistent flows of trade finance and market-friendly products and services will remain the priority. Given the IDB’s strategic position as a multilateral development bank with strong client relationships and financial instrument expertise, it will continue to develop innovative and sustainable ways to reduce risks and expand opportunities for LAC FIs and their clients. Through trade finance guarantees, loans, funds and capacity-building, the IDB will strive to achieve further integration, job creation and poverty reduction in the years ahead.
See IDB case study, page 50
The International Finance Corporation (IFC)
Background and markets
In fiscal year 2010 (FY10)3, IFC continued to play the counter-cyclical role that was called into prominence to address the dire conditions witnessed in 2008 at the onset of the financial crisis. At the time, IFC adopted a two-pronged approach to support trade: an increase in the existing Global Trade Finance Programme (GTFP) and the roll-out of a crisis-response programme that mobilized additional support for trade on a portfolio basis from development finance institutions and governments. The Global Trade Finance Programme (GTFP) showed significant growth during the period, in terms of both dollar volume and geographic coverage.
The programme offers full or partial guarantees on a per-transaction basis for confirming banks taking payment risk in emerging markets. The list of issuing banks covered under the programme now includes over 200 banks in 84 markets. In December 2010, GTFP reached the USD 10 billion milestone in terms of volume of guarantees issued since the start of operations. In mid-2009, the Global Trade Liquidity Pro-gramme (GTLP) launched as a crisis-response programme and mobilized funding from IFC, in addition to other development finance institutions and governments, to reach a wide segment of emerging market banks using a portfolio approach. The GTLP has mobilized a total of USD 4 billion and supported USD 11.2 billion in trade since inception of the programme.
The global nature of these two programmes allows IFC to have a broader view of trade conditions in emerging markets. GTFP data reflect the generally accepted view that trade conditions are improving, evidenced by increased dollar volumes and downward trends of pricing. Of note, however, is the difference in the recovery pace for various players in diverse emerging market economies. Smaller exporters/importers and smaller economies remained marginalized by the previous year’s contractions in available finance and the concomitant changes in bank strategies and the regulatory environment.
3 IFC’s fiscal year runs from July 1 to June 30. Fiscal year 2010 ended on June 30, 2010
Rethinking tRade & Finance: icc global SuRvey 2011 52
Individual summary of activity (volumes & values 2010)
The GTFP has been operational for more than five years, and throughout has demonstrated an exponential growth trend. In FY10, the pro gramme experienced a 44% growth over FY09 to reach a volume of USD 3.46 billion in guarantees issued. Interestingly, and reflecting smaller shipments, the number of guarantees grew even more rapidly during the same time period.
Regional highlights FY10
Latin America was the programme’s most dynamic region during FY10, representing 35% of dollar volume. The region also contributes significantly to the programme’s success in supporting sectors of strategic importance, such as commodity food flows and ethanol trade to promote energy efficiency. Sub-Saharan Africa represented 22% of the volume of guarantees in FY10, and the region had several of the year’s non-traditional South-South trades, such as cashew nuts from Cote d’Ivoire to Vietnam and grain from Thailand to Mali.
The Middle East and North Africa, primarily driven by demand from Pakistan, made up 16% of guarantee volume in FY10, but accounted for the largest number of guarantees issued during the year, some 38% of the total. The region also accounted for one-third of the programme’s support of SME transactions. In Asia, GTFP’s focus remained on smaller economies and underserved banks in the region, driven by Vietnam and Bangladesh. The highest growth region in terms of new banks entering the pro gramme and dollar volume of guarantee issuance was Europe and Central Asia, which added 12 banks and doubled the levels of the previous year.
Summary of developmental impact
While the programme has been growing at an accelerating pace, the GTFP maintains strategic focus on transactions that will fulfil the development mandate of IFC. In FY10, the programme kept pace with or exceeded its development impact indicators: more than one-third of the volume of guarantees supported flows between emerging markets; over half facilitated trade with the poorest developing markets (“IDA” countries as classified by the World Bank); and over 80% related to trades under USD 1 million, benefiting SME importers
and exporters. Of the USD 11.2 billion in trade financed by the GTLP, 80% supported SME financing and 31% was for IDA countries.
The GTFP also continued to promote know-ledge sharing and networking among trade professionals globally by providing trade advisory services and hosting global trade conferences. In FY10, among the 51 course offerings held in 43 countries, half were carried out in Africa.
Default or claims experience
To date, there have been no defaults and no pay-outs under the guarantees issued.
Regulatory impact on scale and scope of business activity
Communication with the banks in the pro-gramme and recent demand trends suggest that the need for risk mitigation is increasing and will continue to do so as the new Basel regulations are adopted. The guidelines are broadly viewed as increasing the cost of extending trade finance and, as such, hold serious implications for lower-income countries, smaller volume markets and SME clients generally. Of note is the significant increase in the number of full-coverage guarantees being requested under the GTFP – from 74% of guarantees issued in FY07 to 93% in FY10.
Outlook for the future
The current fiscal year has ushered in signi-fi cant changes to IFC’s product offerings. As of October 2010, the Corporation officially launched its Short-term Finance Department, which incorporates GTFP, GTLP and a platform for other short-term initiatives. The latter include warehouse receipts financing, emerging mar-kets supplier financing, distributor financing and structured trade commodity financing. These products are intended to address the gap in access to finance for SMEs and direct funding to strategic sectors such as agriculture.
In February 2011, a second GTFP operating centre was launched in Istanbul, Turkey to pro vide clients with maximum service and efficiency across the time zones internationally. The programme is poised to continue its upward trend in dollar volume terms – reaching an expected USD 4.2 billion by the end of fiscal year 2011.
See IFC case study, page 53
Rethinking tRade & Finance: icc global SuRvey 2011 Rethinking tRade & Finance: icc global SuRvey 2011 53
IFC case study
Bharatkumar JaniChief executive officer Prime Bank Limited Nairobi, Kenya
Prime Bank Limited, Nairobi, Kenya is a local Kenyan-African Bank established 19 years ago. With a strong customer base in corporate and trade finance, it has grown above the industry growth rate with a cumulative average growth rate (CAGR) in excess of 30%. Trade finance is a core component of this business development strategy.
The global slowdown did not have a severe impact in Kenya and, despite challenges, banks in Kenya reported good results. As one sign, recently remittances from the Kenyan diaspora have picked up. The uncertainties of early 2008 in the country due to the elections and, to some degree, turbulence in international markets led to knee-jerk reactions from some international banks, but these were retracted later in the year. In spite of the slump in international capital markets, Kenya demonstrated the inherent strength of its financial sector as well as liquidity of its domestic capital market by successfully floating two infrastructure bonds in 2009.
Kenya is a developing economy with liberalized foreign exchange policies. This contributes to the country’s flow of foreign exchange, investment and trade. The IFC GTFP is particularly important in the context of supporting trade finance for imports while, at the same time, exports are expanding.
Prime Bank Limited (PBL) entered into an agreement with the IFC in 2007, since trade credit lines and technical assistance are critical to the Bank’s economic expansion, as well as that of the country. Through GTFP, the Bank has managed to establish an ongoing working partnership with a number of major international banks, thereby broadening its access to credit lines and ensuring a continuous flow of trade credit into the market. This, in turn, has enhanced the Bank’s global reach and helped it gain familiarity in new markets. By demonstrating the Bank’s excellent trade track record, confirming banks now have considerable confidence in the Bank and have no hesitation accepting trade-related exposures for all products. Even though the Bank is comparatively small, it leverages its trade finance capacity to enhance its position in the corporate market and, with stability now returning to the trade finance markets globally, the Bank is seeing more competitive pricing. It is primed for trade finance expansion.
As the global markets stabilize, Kenya will also benefit from its strategic location, its communi cation with the rest of the world through the port of Mombasa and Nairobi airport and its well-developed financial and services sectors.
Kenya’s rise as the regional hub for East Africa is accelerating the diversification of its economy. Unlike many of its Sub-Saharan African neighbours, Kenya does not rely on resource extraction for economic growth. Instead, it produces and processes a range of agricultural, industrial and finished goods. Trade finance credit lines, trade finance technical assistance and international rules for trade finance implemented by ICC play an essential role part in Kenya’s trade expansion and development.
With an improving balance of trade, which is core to the economy, the Bank is optimistic concerning future trends in trade.
Rethinking tRade & Finance: icc global SuRvey 2011 54
The Asian Development Bank (ADB)
Background and markets
ADB’s TFP provides guarantees and loans in support of trade, typically within 24 hours. The TFP does not assume risk in PRC, India, Thailand or Malaysia, focusing instead on markets where the private sector capacity gap is largest. TFP’s most active markets in 2010 were Bangladesh, Pakistan, Viet Nam, Sri Lanka and Nepal. The TFP supported USD 2.8 billion in trade in 2010 and is poised for more growth both in existing markets and in new markets throughout Central Asia where the TFP continues to expand, including into Kazakhstan, Kyrgyzstan, Turkmenistan, and other countries.
Individual summary of activity (volumes & values 2010)
ADB’s TFP continued its exponential growth in 2010. It supported 783 trade transactions valued at USD 2.8 billion, USD 1.5 billion of which was co-financed by the private sector.
Given the large private sector gap for trade finance in several Asian markets, the ADB’s TFP anticipates increased volumes. To help manage continued growth, one of the TFP’s primary objectives in 2011 is to expand its distribution network with multilateral, bilateral and private sector partners.
Summary of developmental impact
ADB’s TFP supported 783 trade transactions in 2010, 386 of which were between two ADB developing member countries (South-South trade). Over 95% of the TFP’s 2010 portfolio was in ADB’s most underdeveloped markets, with the remainder mostly in Indonesia. In 2010, TFP-supported trade transactions from over 275 small- and medium-sized enterprises. Importantly, TFP provides the opportunity for international and regional banks to establish new relationships (hopefully accompanied by new credit lines) with banks in its developing member countries that would not otherwise develop. With these new relationships comes greater financial links to support trade, job creation and more prosperity in emerging Asia.
Default or claims experience
ADB’s TFP has had no defaults or claims since its inception.
Regulatory impact on scale and scope of business activity
It is difficult to quantify how much of the TFP’s activity is the result of a tough regulatory environment in trade finance. Most banks in the world have no limits or small limits for the more challenging Asian markets, and TFP has sought to fill this market gap. That said, there is little doubt that some banks, at least in part, use TFP because of the break it affords banks on their capital requirements.
Outlook for the future
Much media attention is focused on how Asia is steaming ahead to prosperity and, in the context of this exuberance, it is easy to forget that over 900 million Asians live on less than USD 1.25 a day. TFP focuses on these most challenging Asian markets. It anticipates continued growth as it seeks to expand partnerships and support for trade in the economies that need it the most, working with the private sector to fill market gaps. The programme is projecting that its support for trade in 2011 will be approximately USD 3.5 billion, up from 2010’s USD 2.8 billion.
See ADB case study, page 55
Rethinking tRade & Finance: icc global SuRvey 2011 Rethinking tRade & Finance: icc global SuRvey 2011 55
ADB case study
Ahmed ShaheenInternational Business Corporate Banking Eastern Bank Limited, Dhaka, Bangladesh
Eastern Bank Limited started banking operations on 16 August 1992 and, from its inception, has had a strong focus on trade and the use of technology to empower exporters and importers.
There has not been a financial crisis in Bangladesh. However, there have been challenges to economic development as a direct result of the global financial crisis. The careful monitoring of the banking sector by the Central Bank, “Bangladesh Bank”, has proven to be a wise approach in this situation for a large developing country with diverse needs.
With a population of more than 150 million, and where there is a food deficit, it is essential that protection of the economy, the banking sector, and in turn the people, is the highest priority. The policies of the Central Bank in not permitting trading in exotic or mortgage-backed securities, along with stringent but trade-facilitating exchange controls, has provided significant protection.
That said, while Bangladesh has not had a financial crisis it is clear that with such a large dependence on external trade, there had to be some negative demand-related consequences. This was especially felt in the value-added manufacturing sectors, especially in textiles, on which many families depend for employment. However, despite the global economic slowdown, the Bangladeshi economy grew by 5.7% in 2010, though exports grew by only 4.2% due to sluggish global demand for ready-made garments, which represent 77.1% of total exports.
In April 2010, Bangladesh obtained sovereign ratings for the first time. Moody’s rated the country Ba3 and S&P at BB-, both with a stable outlook. This ranks Bangladesh’s credit-worthiness ahead of Sri Lanka and Pakistan.
Using creative solutions and having access to the trade facilitation support programs of the ADB and the IFC meant the Bank could keep finance lines open through the financial crisis. When international banks cut credit lines, at times they did not understand the importance of trade credit lines or appreciate the positive track record of Bangladesh, which is now, more than ever, dependent on international trade.
However, this withdrawal from the market was a short-lived experience, and trade volumes are accelerating as companies buy in stock as well as invest in high-end production capacity. Investment in the country’s trade-related production sectors is now highly attractive due to Bangladesh’s push for competitiveness. In fact, the country stands to gain if the People’s Republic of China sheds some part of the ready-made garment market because of its rising labour costs. In addition, the government’s plans for enhancing the power and gas supply, as well as transportation facilities, will also take other costs and logistical challenges out of the system.
There are also positive indicators in terms of trade normalization. Access to liquidity is not a problem, and pricing for trade has moderated. The Bank expects this trend to continue in the absence of any further global shocks. A concern for Bangladesh and the world at large is the runaway increases in food costs. For example, from September 2009 to September 2010 international wheat prices increased by 51.0%.
Despite the challenges, Bangladesh was fortunate, as the government and the Central Bank reacted swiftly, positively and firmly to the financial crisis. The ICC national committee is very active in Bangladesh, and ICC rules and every letter of credit is issued subject to ICC rules on documentary credits.
Continued economic growth for Bangladesh is anticipated. The IMF and ADB project 6.3% real economic growth for the country in 2010-2011.
Rethinking tRade & Finance: icc global SuRvey 2011 56
Interview
Ghazi Ben AhmedTrade expert, African Development Bank (AfDB)
With the ICC’s strong focus on supporting trade with emerging markets to foster economic development, Vincent O’Brien is delighted to have had the opportunity to talk first-hand about the impact of the financial crisis on the African continent with Ghazi Ben Ahmed, the leading trade expert in the African Development Bank. Ghazi is in charge of the USD 1 billion Trade Finance Initiative of the Bank.
How would you describe the impact of the financial crisis on the African continent in general terms?
Africa has made steady progress in developing trade over the last decade, building the foundations for higher growth and poverty reduction. However, this previously optimistic environment has, to quite a degree, been undermined by factors outside of Africa’s control. The initial effects of the financial crisis were slow to materialize in Africa, but the Continent has been affected to some extent. Hopefully, Africa is rebounding much better than expected from the crisis. In fact, African economies have emerged from it, and economic expansion is expected to continue, albeit at a somewhat lower rate than before the slowdown. Growth reached 4.8% in 2010, up from 3% in 2009 and is likely to accelerate to more than 5% in 2011 and 2012. In the four years before the global crisis, Africa´s growth amounted on average to 6%.
Can you be more specific in terms of how Africa has been negatively impacted by the financial crisis?
Well, for example, the growth outlook in Africa has deteriorated drastically, and many African countries are facing widening current account and budget deficits. The crisis has reduced trade, which we all agree is the mainstay of recent economic growth in Africa. The estimated shortfall in export revenues was about USD 250 billion in 2009, whereas this figure has advanced to around USD 280 billion for the Continent as a whole in 2010. Oil exporters have suffered the largest losses.
The main explanation for this free fall in trade has been the simultaneous reduction in aggregate demand across all major world economies, compounded by some instances of increased tariffs and domestic subsidies, new non-tariff measures and more anti-dumping actions. The drying up of trade finance during this period has also been a contributing factor.
Furthermore, before the crisis we saw a surge of capital inflows into Africa. Now exports, as well as capital inflows including worker remittances and tourism receipts, has declined. The stocks of foreign reserves in some countries are still low, with certain countries down to only a few weeks of import cover. If the situation does not improve rapidly, it may severely jeopardize the capacity to import even basic items, such as food, medical supplies, and agricultural inputs. The poor are the worst affected.
Can you provide some insight into measures taken by governments in Africa to manage this challenging situation?
African governments have undertaken a variety of measures to minimize the impact of the crisis. These include: setting up special monitoring units, providing fiscal stimulus packages, revising budget expenditures, targeting assistance on key sectors, strengthening the regulation of the banking sector and financial markets, expansionary monetary policy and foreign exchange controls to protect the exchange rate.
Ghazi Ben Ahmed Trade expert, African Development Bank
Vincent O’Brien Chair, ICC Market Intelligence group
Rethinking tRade & Finance: icc global SuRvey 2011 Rethinking tRade & Finance: icc global SuRvey 2011 57
Would it be fair to assume that these negative impacts have resulted in the AfDB being approached to provide emergency assistance and, if so, how has the AfDB met this challenge?
Without any doubt, the financial crisis has led to an increase in the demand for AfDB’s funding for private sector operations. The AfDB has been asked to intervene in several projects, some of which already had AfDB involvement, and we have had to provide additional funding or to assist in restructuring.
Can you give me some specific examples of the severity of the crisis at country level?
It is now clear that the regional engines of growth were the first affected. As was to be expected, the large, financially developed and open economies were the first to be hit. This was the case for the financial markets in South Africa and Egypt. Across export sectors, the Algerian and Nigerian oil sectors, as well as in the mining industries of South Africa, saw sizeable reductions in demand.
In South Africa, the financial sector experienced a strong reduction in asset prices, increases in the cost of capital and a slowdown in lending. This has led to downturns in the retail and manufacturing sectors. Furthermore, the mining sector experienced a large fall in output and employment, driven by lower worldwide demand for commodities.
In Nigeria, investment, output and government revenues fell significantly due to the decline in the price for hydrocarbons (oil and gas). Oil and gas extraction account for 30% of the Nigerian economy’s GDP, over 90% of its exports and a large share of government revenues. The decline in foreign exchange reserves due to lower export revenues was exacerbated by falling remittance inflows.
It is also clear that as the regional engines of growth weakened, this had significant knock-on effects on smaller economies in the proximity through trade linkages and worker remittances. For example, remittance flows to the Democratic Republic of Congo (DRC) fell due to the slowdown in South Africa, further increasing the impact of the decline in mineral exports there.
We should also point out that pre-crisis success stories have not been spared either. The crisis has affected countries that had been experiencing several years of sustained growth thanks to improved economic fundamentals and prudent fiscal policies. For example, Botswana experienced a sharp decline in industrial production, exports and government revenues. It has shown itself to be acutely vulnerable to shocks due to its heavy dependence on diamond exports, which represent between 35 and 50% of government revenues.
Are there lessons to be learned from these experiences and negative consequences?
The financial crisis has highlighted how crucial trade finance is to international trade. The capacity to export and import is significantly affected by the availability and cost of financing as well as the availability of instruments to mitigate the risks associated with international trade transactions, especially in low-income countries.
The crisis has also underlined the problem of Africa’s undiversified exports, i.e. the continued dependence on primary commodities. This implies that growth in the medium term will have to largely depend on the recovery of global demand. Last year, import demand remained low in Africa, but as demand picks up, the problem of import financing will fully materialize and, if not addressed adequately, it may hamper economic growth.
Also highlighted is the lack of trade finance data in the region. There is a paucity of historical data documenting the trade experience in Africa, and the assessment of trade finance gaps and market needs is based mainly on regional overviews and inventory assessments. This lack of consistent, portable data may translate into overly conservative risk weightings for trade finance products. It is therefore essential to build timely insight into trade finance trends.
Rethinking tRade & Finance: icc global SuRvey 2011 58
Now that the market situation for trade finance has, by and large, been gradually improving, can we say that the situation is approaching normality?
The situation is characterized by both the regional context, with the high perceived risk and small scale of operations within Africa, and the global context, with the uncertain global recovery and recurrent looming threat of another crisis.
All the economists and major international banks agree that the situation of trade finance in Africa is still constrained, particularly in the financing of manufacturing imports and inputs. It is true that trade finance markets have continued to improve since the autumn of 2009. However, recovery patterns have been mixed across regions, with Asian markets leading the recovery. In this vein, participants in the trade finance experts meeting in Geneva on May 18, 2010, were unanimous in highlighting continuing constraints on trade finance in Africa, especially in low-income countries.
Even if global access to liquidity seems to be less problematic, the fact remains that dollar liquidity is quite a problem, and European banks are asking for a high liquidity premium in addition to a risk premium. I see that the problem of risk aversion remains, particularly for smaller players and low income countries. As a growing number of global banks have improved liquidity positions, they face increased risk aversion and lower lending appetites, particularly in emerging markets such as Africa, where small issuing banks have greater difficulty in getting bank confirmations.
In a nutshell, market requirements are shifting from purely seeking liquidity support to a mix of liquidity and the provision of guarantees. In this second area we expect to see greater demand as market recovery takes root.
The landscape has changed and so have international commercial banks. A number of prominent banks – which were previously big players in the market – have found themselves caught up with restructurings and have become much less visible than before the crisis, or have shifted their interest to the markets of Asia and Latin America.
Would it be fair say the outlook is now looking more optimistic in terms of trade finance volumes and values in Africa?
It is important to be optimistic but more important to be realistic. The outlook remains unusually uncertain. At a fundamental level, this reflects the disruptive combination of deleveraging, regulatory changes with Basel II and Basel III, the Eurozone budget deficit, a looming double-dip recession and other ongoing structural changes. The result is an extended period of economic vulnerability, during which the initial relief could mutate into a renewed slowdown. But even in the most optimistic scenario we can expect slow growth in advanced economies capped by poor credit availability and austerity in the public sector.
The AfDB has been credited with acting swiftly in providing support during the financial crisis and has won several international awards. What then, are the next steps for the Bank in the area of trade finance?
Programmes like the Global Trade Liquidity Programme (GTLP) and other emergency liquidity facilities have contributed to reverse the negative trend of the financial crisis. Although no statistics are available, regional commercial banks and international financial institutions report that the secondary market is stronger. The three international awards won by AfDB (Trade Finance Deal of the Year, Best DFI in Africa, Trade Finance Bank/House of the Year) are testimony to the Bank’s ability to deliver efficiently in a time of unprecedented crisis and a recognition of the role of the Bank and its visibility in the market, which has been an objective set at the highest level in the Bank.
As for the next steps in trade finance, we need to take into consideration that although the peak of the crisis for the trade finance market appears to have passed, the markets may take years to return to pre-crisis conditions. Many of the international banks that once played a key role in trade in developing markets are still facing serious challenges in their domestic markets that will take many years to overcome. As a result, there is a continuing need for institutions such as the African Development Bank and other IFIs to remain engaged in the trade finance markets. The Bank is therefore contemplating playing an active role in trade finance and short-term financing, including in providing funded and unfunded trade finance mechanisms.
Rethinking tRade & Finance: icc global SuRvey 2011 Rethinking tRade & Finance: icc global SuRvey 2011 59
Furthermore, the growing relationship between Africa and other emerging economies is creating new demand for partnerships. Several African commercial banks reported increasing demand for facilities with importers and exporters in emerging Asia. However, banks report that trade transactions are constrained by Asian banks’ unfamiliarity with the Continent and its financial institutions. Asian firms require letters of credit, and transactions can be slow and difficult. African commercial banks suggested that AfDB could facilitate trade transactions by working with its counterpart financial institutions in Asian markets, especially in India, China, Korea and Thailand.
Just to give you an idea about the importance of trade in the region, Africa’s total trade in goods with emerging countries (non-African developing countries) increased from USD 34 billion in 1995 to USD 283 billion (32.5% of total African trade) in 2008 just before the onset of the crisis. China alone represented USD 93 billion in 2008, and is expected to reach USD 100 billion in 2010. Trade with rich OECD countries increased from USD 138 billion to USD 588 billion over the same period. Intra-African trade also increase from USD 46 billion to USD 115 billion.
In fact, it may be quite a surprise to some members of the ICC Banking Commission that Africa’s South-South trade, including intra-African trade, actually surpassed that of the European Union for the first time in 2007, reflecting a marked increase in the importance of developing countries to Africa’s merchandise trade patterns. The EU is still Africa’s largest trade partner; however, its share of trade declined from around 55% in the mid-1980s to below 40% in 2008.
And finally, how would you summarize the importance of trade and trade finance to the African continent?
I believe that trade is key to Africa’s sustained economic growth and job creation. But for trade to work, it is essential that trade finance be available and affordable across the continent. Under the leadership of President Kaberuka, the African Development Bank has worked hard to stabilize trade flows and preserve growth across the Continent. In the aftermath of the financial crisis, we should put the emphasis on financing regional trade integration through the further development and integration of existing regional capacities, putting an emphasis on regional vertical integration to ensure a certain degree of specialization in countries within the region. This would allow trade in “specialized tasks” rather than finished products: parts and components produced in one location would be assembled in another.
President Kaberuka put it succinctly in his speech during his visit to Korea on September 16, 2010 when he said: “Our aim is to seize opportunities offered by trade and investment and reduce reliance on foreign aid.” Therefore, investing productively in infrastructure, enhancing trade facilitation and increasing access to trade finance are key elements for self-sustained growth in the African region, and the fastest way to take advantage of economic complementarities in bordering countries to increase investment, facilitate business reforms and consequently boost industry, growth and job creation.
Thank you for participating in the ICC Banking Commission Global Trade Finance Survey 2011 and for sharing your valuable insights f rom Africa as we face this challenging environment together.
The African Development Bank is pleased to work with the ICC in all efforts to advance international trade and development, and we look forward to further collaboration.
Rethinking tRade & Finance: icc global SuRvey 2011 60
Multilateral investment banks: Conclusion
The role played by development banks in supporting international trade and finance is accelerating at a greater pace than increases in trade volumes. The initial stance of providing risk coverage has now been supplemented by innovative solutions to provide liquidity and to fill market gaps as they arise.
It is interesting to note the important role played by the development banks in building trade supply chain networks between banks in emerging markets. The accelerated advance ment of South-South trade supported by the development banks’ programmes is an interesting phenomenon and one that we expect to increase.
With a significant emphasis on supporting SME trade in emerging markets, the positive development impact is evident. Furthermore, we can expect to see continued expansion of the development banks’ portfolios of trade finance supports as well as a greater proportion of trade deals being initiated by confirming banks as the impact of tighter global banking regulation is felt in the market.
Rethinking tRade & Finance: icc global SuRvey 2011 Rethinking tRade & Finance: icc global SuRvey 2011 61
Section 5 Business trends in export credit insurance
Insuring risk to sustain global trade
In 2010, members of the Berne Union – the International Union of Credit & Investment Insurers – insured close to USD 1.4 trillion worth of exports, providing significant support to international trade. This is a slightly higher amount compared to 2009 when it was just above USD 1.3 trillion.
2010 was the year with the second largest value of trade ever covered by Berne Union members, the peak year being 2008. With global trade recovering from its 2009 low, Berne Union members facilitated around 10% of global export flows in 2010.
The exports covered under Short Term Export Credit Insurance (ST) – insurance of trade transactions with a tenor of one year or below – increased by 6%, to USD 1.2 trillion (preliminary figure). Medium Long Term Export Credit Insurance (MLT) – insurance of trade transactions with a tenor of more than one year (typically 3-5 years, up to 10 years or even 15 years in exceptional cases) – reached USD 173 billion worth of insured trade, 9% less than the previous year.
Short-term capacity stable
After a reduction of ST business in 2009, 2010 was the year of stabilization for a strongly tested credit insurance industry. Insurance capacity provided by Berne Union members recovered, with the aggregate amount of credit limits extended to exporters standing at USD 840 billion at the end of 2010, somewhat half-way between the peak of 2008 and the lower amount at the end of 2009.
While credit limits for shipments to destination countries in the Americas and Asia increased by 20% in 2010, credit limits for the destination region Europe stayed at the same level as in 2009. This points to a vigorous recovery of trade flows to the Americas and to Asia, with trade to and within Europe lagging behind.
In early 2010, the stabilization of capacity continued to be supported by increased credit limits provided by public insurers. As in 2009,
Export Credit Agencies (ECAs) had been asked by their governments to take measures and help smooth the reduction of credit limits by private market insurers that had taken place during the crisis.
During the second half of 2010, credit limits extended by the private market increased again and stood at substantially higher levels compared to the earlier part of the year.
It appears that credit limits are used more actively by exporters who are clients of ECAs compared to exporters who are clients of private insurers. Indeed, while the share of ST credit limits provided by ECAs is 25% of the total amount in the Berne Union, the share of ST exports covered by these ECAs during 2010 was higher at approximately 40%, or close to USD 500 billion of the above-mentioned amount of USD 1.2 trillion.
Most of the ST exports covered by public insurers have been insured by ECAs from Asia. Asian ECAs grew their ST business by 47% in 2010 and now account for more than 30%, or USD 375 billion, of all ST business underwritten by Berne Union members, public and private.
ECAs in the European Union were very active during the crisis, helping thousands of European exporters, particularly SMEs, by providing them with ST insurance cover to be able to sell their goods abroad. Overall, their share of the ST business remains small, 3% of all ST exports covered, which is in line with their mandate to complement private insurance capacity.
Total ST claims paid by Berne Union members to insured exporters in 2010 amounted to USD 1.4 billion. This is a significant reduction of 40% compared with the USD 2.4 billion of claims paid in 2009, and possibly marks the return to a normal situation. While some year-end data is still being collected by the Berne Union, the resulting loss ratio – claims paid in relation to premium income – was estimated to be 44% in 2010. This would be half the loss ratio of 88% in 2009 and only slightly higher than in the pre-crisis years.
Rethinking tRade & Finance: icc global SuRvey 2011 62
As in 2009, the US and Western European countries (Italy, the UK, Spain and Germany) were among the top claims countries where buyer defaults occurred for which insurers had to pay claims. Claims paid by Berne Union members in 2010 due to defaults in these five countries amounted to USD 375 million or 27% of total claims. These countries are also among the largest exposure countries where Berne
Union members have covered transactions, totalling around 29% of Berne Union members’ total exposure.
A group of emerging countries (Russia, Ukraine, Brazil, Turkey and Mexico) showed claims volumes of a similar magnitude – more than USD 280 million or 20% of total claims – despite the exposure in these countries being much smaller at around 7% of total Berne Union exposure.
A majority of insurers in the Berne Union are of the opinion that the very high loss period experienced during the crisis is over. It remains to be seen whether loss ratios will stabilize at the pre-crisis level.
Medium long term on a continued high level
The Medium Long Term (MLT) statistics of the Berne Union capture insurance coverage provided by ECAs only. Throughout 2010, ECA insurance coverage continued to play a crucial role that was particularly apparent in late 2008 and early 2009 at a time when ECA coverage was a condition sine qua non for banks to extend financing to MLT transactions.
Starting from a relatively average level of USD 36 billion insured during the first quarter, new business showed constant increases in each quarter of 2010 to finally reach a total amount of USD 173 billion worth of new MLT transactions covered in 2010. This was down 9% compared to the all-time high of USD 191 billion in 2009, but still well above the figures of all preceding years. The high amount of cover provided by ECAs in 2010 reflected the sustained demand for this type of insurance coverage, against the backdrop of a less constrained financing situation compared to 2009.
Claims paid to customers in 2010 for defaults on MLT transactions fell by more than 40%, from USD 3.1 billion to USD 1.7 billion. While a precise estimate cannot be made at this stage, it is expected that 2010 will show a lower loss ratio in the region of those experienced in 2007 and 2008, between 30 and 40%.
Total MLT transactions under cover on the books of Berne Union ECAs at the end of 2010 amounted to USD 514 billion, the same high level as at the end of 2009.
In 2010, the support of ECAs again proved effective for helping banks to unlock liquidity and enable exporters to trade internationally.
Figure 48 Medium long term export credit insurance in USD million
Figure 47 Short term export credit insurance in USD million
0
50 000
100 000
150 000
200 000
250 000
2004 2005 2006 2007 2008 2009 2010 2011
0
500
1 000
1 500
2 000
2 500
3 000
3 500
0
200 000
400 000
600 000
800 000
1 000 000
1 200 000
1 400 000
2004
New business coveredClaims paid
2005 2006 2007 2008 2009 2010 2011
0
500
1 000
1 500
2 000
2 500
3 000
3 500
New business covered Claims paid
0
50 000
100 000
150 000
200 000
250 000
2004 2005 2006 2007 2008 2009 2010 2011
0
500
1 000
1 500
2 000
2 500
3 000
3 500
0
200 000
400 000
600 000
800 000
1 000 000
1 200 000
1 400 000
2004
New business coveredClaims paid
2005 2006 2007 2008 2009 2010 2011
0
500
1 000
1 500
2 000
2 500
3 000
3 500
New business covered Claims paid
Source: Berne Union
Source: Berne Union
Rethinking tRade & Finance: icc global SuRvey 2011 Rethinking tRade & Finance: icc global SuRvey 2011 63
Outlook
The year 2010 showed a surprisingly quick turnaround to a normal and hopefully stable situation in the credit insurance market. While the year had begun in the aftermath of the 2008/2009 events – and despite signs of improvement it was not clear at all whether the worst was over – the situation improved rapidly towards the middle of 2010.
Overall, the credit insurance industry showed resilience when faced with an unprecedented global crisis. The measures taken by private market insurers contributed to a quick and significant reduction of loss levels, and pre-pared the return to a commercially sustainable situation. The actions of ECAs to supplement private market capacity throughout the crisis helped reassure the market as well as credit insurance clients.
The crisis was a major test for credit insurance as a product, and the solidity of the industry was demonstrated: Insurers performed and paid out claims promptly. No insurer defaulted.
A side-effect was that awareness for credit insurance was heightened. Coupled with renewed growth of international trade, this led to strong demand for the product. With claims levels declining and pricing for credit insurance up, confidence has returned to the industry. While coverage might still be difficult to obtain for certain destinations and certain buyers, overall capacity seems to be back, in part due to new entrants who seized opportunities in a growing market.
On the regulatory side, credit insurers and their clients are carefully watching the developments regarding Basel III and Solvency II. Indeed, changes in capital and liquidity requirements might have a major impact on the ability of banks and credit insurers to support trade.
In an environment that presents attractive perspectives but remains challenging, Berne Union members, public and private credit insurers, continue to provide risk mitigation and to facilitate global trade flows.
Coverage of trade finance instruments
Most credit insurers provide insurance cover age to banks and cover trade finance instruments. In the ST field, this mainly relates to demand from confirming banks for coverage of the risk of issuing banks in risky markets.
A survey among Berne Union members with 26 respondents, public and private credit insurers, confirmed the low-risk nature of trade finance as demonstrated in their portfolios.
n 90% of respondents do cover ST trade finance instruments.
n 62% of respondents experienced much higher or higher demand for coverage of trade finance products in 2010 compared to 2009.
n 87% of respondents had a loss experience on trade finance instruments that was much lower or lower than on open account transactions (23 responses to this question).
n No insurer had a loss experience on trade finance instruments that was higher than on open account transactions.
n 69% of respondents indicated a loss ratio of 0% for trade finance instruments (16 responses to this question).
n Two insurers indicated a loss ratio of 0.1% for trade finance instruments.
n Three insurers indicated higher loss ratios, similar to their loss ratios on open account.
Note: Not all respondents answered all questions, as some insurers were not able to separate coverage for trade finance instruments from coverage of other transactions.
Rethinking tRade & Finance: icc global SuRvey 2011 64
Section 6 Impacts of the new regulatory regime
Background
On 12 September 2010, the Basel Committee for Banking Supervision (BCBS) endorsed the annex it had issued on 26 July. The annex specified further details for capital requirements, in particular target ratios and the transition periods during which banks must adapt to the new regulations. The measures were then endorsed at the November 2010 G-20 summit in Seoul. The BCBS has thus completed its policy-making work in respect of the basic capital and liquidity provisions, and it appears that Basel III is largely complete and the new regulatory requirements will be considered soon at the national level.
ICC has welcomed the strengthening the frame work of banking supervision. The recent crisis signalled the need to review the global financial regulatory framework to reinforce the banking sector’s ability to absorb economic shocks and to build a stronger, safer international financial structure. ICC has also consistently voiced strong public support for the stated goals of the BCBS to improve the resilience of the banking sector. Adequate and affordable trade finance is fundamental to economic recovery and growth. Most trade in developing countries is financed using traditional trade finance products such as letters of credit. In these countries, the shortage of available trade finance is critical, as it is for SMEs in developed countries, which often rely on smaller banks as their source of financing.
However, as ICC conveyed to the BCBS, some of the new regulatory measures will deter inter-national banks/financial institutions from doing business in some important ways. The most severe impacts are likely to be felt by SMEs in developing countries. The unintended effects of the regulatory reforms would defeat the G-20 goals of providing readily available short-term, trade-related funding at lower costs to businesses in these countries.
Banks’ awareness of the new regulatory regime
A number of respondents to the ICC Survey indicated that they were aware of the coming changes to the regulatory framework, but that they lacked sufficient information on how the new regulations will be implemented.
In the present Survey, 81% of respondents said their financial institution was aware that the new regulatory regime imposed new capital, liquidity and leverage requirements on all banking activities. When asked “Do you anticipate that the Basel III requirements will cause your bank to re-assess its trade finance strategy and products?”, 34% of respondents answered in the affirmative. An alarming 57% indicated they were lacking sufficient information on Basel III at this stage, reflecting an information gap between the industry and the policy makers.
A substantial majority of Survey respondents noted that the industry had concerns about the lack of clarity of some measures and the tendency for some national regulators to move ahead and prejudge outcomes. Not only were respondents uncertain as how to apply certain provisions of the capital, leverage and liquidity requirements, they were also concerned about signs that implementation in individual jurisdictions might diverge in a number of important respects. The concern that some jurisdictions might be tempted to “top-up” the Basel III minima was expressed by respondents, who feared the new regime would eventually impose requirements hard to achieve and result in excessive and unbalanced capital and liquidity demands.
Some financial institutions argued that the task of adapting to the new regulatory environment will be onerous. Banks are facing a significant challenge merely to achieve technical com-pliance with the new rules and ratios, let alone to reorient their institution for success with a modified business model, including revised governance rules, risk strategy management, IT processes and management information systems.
Rethinking tRade & Finance: icc global SuRvey 2011 Rethinking tRade & Finance: icc global SuRvey 2011 65
Unintended consequences of the new regulatory regime for trade finance
Respondents to the Survey were also con-cerned about the unintended conse quences that will arise from the new regulatory regime, which would indiscriminately put trade finance into the same risk class as high-risk financial instruments.
Many respondents asserted that the new regime did not take into account the adverse effects of the proposed changes on global trade and growth. Specifically, the augmentation of the leverage ratio will significantly curtail banks’ ability to provide affordable financing to businesses in developing and low-income countries and to SMEs in developed countries. Banks are now likely to be required to apply a CCF of 100% for any off-balance-sheet trade finance instruments such as commercial letters of credit, which are commonly used in developing and low-income countries to secure trade transactions.
For these and other reasons, some 35% of respondents indicated they expected the new regulatory regime to negatively or very negatively impact their trade finance business. One respondent stressed that “Increasing the CCF (Credit Conversion Factor) for trade finance instruments by a factor of five for the purposes of calculating the leverage ratio could disadvantage all trade finance-focused banks around the world – irrespective of the region. The Basel recommendations could result in deteriorating trade finance conditions for companies involved in import/export, especially but not only in emerging markets.”
Respondents to the Survey mentioned various unintended consequences of the regulations on global trade, in particular trade with developing countries. Africa, Latin America and some countries in Asia were perceived to be the areas that would be most impacted by Basel III. As noted by many respondents, any increase in fees charged to customers could have a major impact on the proposed treatment of trade finance obligations. Compliance costs would also go up along with capital costs, requiring trade finance to compete with non-trade activities for the allocation of capital.
Traders and producers in developing countries with weak institutions are generally more reliant on bank-intermediated trade finance than their peers in developed markets. In addition, the smaller the traders, the more inclined they are to use L/Cs. Without this financing, many SMEs, which engage in the vast majority of export trade, would not be able to finance their operations. With traditional instruments (e.g. L/Cs, collections and guarantees) representing between 20%-35% of global trade, or about USD 3-4.5 trillion – most of which involves a partner in developing countries – the impact of the new regime will be significant.
Figure 51 Perception of the impact of Basel III
Figure 49 Bank’s awareness of Basel III
Figure 50 Will Basel III cause your bank to reassess trade products?
Very negatively
9%
Negatively
26%
Neutrally
45%
Positively
17%
Very positively
3%
Yes 81%No 19%
Yes 34%No 9%Insufficient information to assess 57%
81%
57%
9%
34%
19%Yes 81%No 19%
Yes 34%No 9%Insufficient information to assess 57%
81%
57%
9%
34%
19%
Rethinking tRade & Finance: icc global SuRvey 2011 66
With regard to the new regulations, the key concerns expressed by Survey respondents can be summarized as follows:
1. Banks moving away from trade finance: There is a risk that small- to medium-sized banks will move away from the trade finance market, thereby significantly reducing market liquidity and the availability of trade finance. Respondents to the Survey questioned whether the tightening of the regulations was commensurate with the increased level of risk. Current regulatory capital under Basel II requires a multiple times higher pricing than economic capital. This would first impact small- and medium-sized enterprises, the engines of economic growth in poor countries. For large banks, with lower internal rates of return, trade finance may also be less attractive than riskier products, encouraging banks to allocate more capital to speculative leveraged instruments.
2. Unintended consequences of the timing of the implementation of the regulatory regime in different regions: There is still considerable uncertainty about the impact of Basel III, because of the role of regional regulators in deciding the local form of the rules. At this point, under the new regime, the movement of contingent liabilities onto balance sheets, financial institution counterparty risk weighting and the weighting of export credit agency exposure could conceivably vary by country. These differences could significantly impact the cost of capital, which would, in turn, raise the price trade finance providers need to charge their customers. This uncertainty over national implementation was already a problem with the Basel II rules, which have been implemented by many European banks, but which have yet to be implemented in the US or Asian banking sectors. Inconsistencies in the implementation of the regulatory regime can create competitive arbitrage opportunities for some financial institutions and may impact on the domiciling of banks.
3. Unintended consequences on the cost of trade: Those who remain in trade finance could raise their prices as a result of the more stringent regulatory requirements. There are already examples of what can happen when liquidity is reduced. During the crisis, some in developing and low-income countries faced a hike in letter of credit pricing from 0.2% to 6.5% per annum. According to estimates from one member
of the ICC Banking Commission, the new proposals could lead to an increase in trade finance pricing of between 15% and 37%. This, in turn, according to the bank, could lead to a reduction in trade finance volumes of 6% and a 0.5% reduction in global gross domestic product.
4. Unintended consequences on SMEs and banks in emerging markets: Again, as a result of a reduction in the supply of trade financing and an increase in pricing, the most severe effects would be felt by small- to medium-sized enterprises in the developing world, where trade financing is needed most to create jobs and alleviate poverty.
5. Unintended consequences on non-regulated sectors: Banks will be encouraged to move high-quality trade assets and contingents into non-bank sectors such as hedge funds. For instance, banks may likely decide to securitize their trade assets – pushing them into higher-risk, unregulated markets. This is clearly contrary to the purpose of Basel III, which is being implemented to prevent another financial crisis.
Regulatory treatment of trade finance as a low-risk form of finance
Expressing concern that overly stern regulatory treatment of trade finance might impede trade recovery, many respondents to the ICC Survey argued that trade finance deserves a more favourable and more strategic regulatory treatment, since it has historically maintained a low-risk profile in comparison with other financial instruments.
This primarily reflects the fixed, short-term maturity of trade finance products and the fact that exposures are liquidated by cash upon maturity. In addition, the transactional nature of trade financing allows banks to carefully manage exposures. ICC Survey respondents further pointed out that trade finance is safer than any other type of financing, due in no small part to the fact that its use is steeped in a set of clear rules set out by ICC.
Indeed, the resilience of trade finance has been demonstrated during the worst crisis since World War II and underscored that its transactional nature had allowed banks to carefully manage exposures. “Requiring banks to set aside 100% of capital for any off-balance-sheet trade finance instruments,
Rethinking tRade & Finance: icc global SuRvey 2011 Rethinking tRade & Finance: icc global SuRvey 2011 67
such as letters of credit, which is five times more than the 20% credit conversion ratio used for trade finance in Basel II, may not be wise”, argued a respondent. “Higher leverage ratios are indeed useful to target the use of off-balance-sheet vehicles like Special Investment Vehicles, which banks used to leverage up and invest in risky assets like collateralised debt obligations. However, the use of off-balance-sheet vehicles in trade finance is very different, and involves much less risk,” he added.
In the past, trade finance has been considered an extremely low-risk, routine operation. This perception – which is reflected in much of the specialist literature on the subject – has developed partly as a result of the anecdotal experience of practitioners over the past half century, but also on the basis of a theoretical understanding of the specific mechanics of trade financing. At its most basic, bank-intermediated trade finance provides structure, security and fluidity to the exchange of goods or services between a willing buyer and a willing seller. The underlying presence of two (or more) parties keen to do business sug gests that the completion rate on trade finance transactions should be extremely high. Moreover, in theoretical terms, the risk of a bank incurring a defaulted exposure is further reduced by, inter alia, the fixed, short-term maturity of trade finance products and the fact that exposures are usually liquidated by cash upon maturity.
In addition, the transactional nature of trade financing allows banks to carefully manage exposures. Unlike products such as term loans or overdrafts, which may be granted on a revolving or ongoing basis, trade financing is not automatically renewed or rolled over on maturity. Even in times of severe difficulty, companies will generally try to avoid defaulting on trade obligations, as continual access to trade finance is a lifeline for most firms. In a similar vein, it should also be noted that trade-related instruments are generally the last form of credit to be cut, and the first to be re-established, in debt-distressed economies.
ICC understands that there has been relatively little empirical evidence to support the argument that trade finance is low risk and thus should be subject to a favourable regulatory treatment. This lack of data has been particularly problematic given the concern that has been raised in recent years that the capital requirements for trade finance transactions under the Basel II framework do not reflect the low-risk profile of the activity.
Recognizing that new regulations are necessary to strengthen the banking sector, ICC provided regulators with the data and fact-based analysis to make a sound judgment. In 2010, ICC, in partnership with the Asian Development Bank (ADB), established a pilot trade credit default register to analyze trade finance performance data. ICC collected a full set of representative default data over a five-year timeframe, a period judged reasonable to reflect both the highs and lows of the recent credit cycle.
The core idea of the register was to demon-strate empirically that trade finance carries low risk compared with other forms of finance. The ICC-ADB Trade Finance Default Register – the first of its kind – currently contains data from trade transactions conducted around the world by nine leading international banks over a five-year period. During this initial stage, nine banks provided portfolio-level data comprising 5,223,357 transactions, with a total throughput between 2005 and 2009 of USD 2.5 trillion. ICC provided an analysis of the main features of this data relevant to the calculation of regulatory capital requirements for five trade finance product types: (i) import letters-of-credit (L/Cs) issued; (ii) export confirmed L/Cs; (iii) guarantees and standby L/Cs; (v) import loans; and (vi) export loans. The data in the ICC Register provided an initial, high-level indication of the risk-profile of trade financing.
In this connection, particularly notable features of the data (from a regulatory perspective) include:
1. The short tenor of trade transactions: The fixed, short-term maturity of trade finance products is confirmed by looking at the “churn” rate of transactions within the data set. The average tenor of all products within the data set is 115 days, with all of the off-balance sheet products covered by the Register (import L/Cs; export confirmed L/Cs; standby L/Cs and guarantees) exhibiting average tenors of less than 80 days.
2. Low default across all product types: The banks participating in the project reported only 1,140 defaults in the last five years using the full data set of 5,223,357 transactions. Reported default rates for off-balance sheet trade products are especially low, 110 defaults from a total of 2,392,257 trans actions. Using a standard calculation, we estimate that the average rate of default within each product type over the five years is: for import L/Cs, 0.058%; for export
Rethinking tRade & Finance: icc global SuRvey 2011 68
confirmed L/Cs, 0.282% (or 0.008%)1; for standbys and guarantees, 0.010%; for import loans, 0.124% (corporate risk) and 0.293% (bank risk); for export loans, 0.168% (corporate) and 0.023% (bank).
3. Relatively few defaults during the global economic downturn: Only 445 defaults were reported in 2008 and 2009 out of a total of over 2.8 million transactions written through this period. Indeed, the number of defaults reported on some products (e.g. import loans, guarantees and standby L/Cs) remained negligible, in spite of prevailing economic conditions and higher transaction volumes.
4. Good recovery rates for all product types: Looking at recoveries from written-off transactions, we observe from the data set an average recovery rate of 59.7% across all product types, with the highest recovery rate recorded on exposures to export loans (bank risk) 81.5%, and a low of 28.1% (export confirmed L/Cs). This latter figure may, however, be obscured by uncompleted recoveries as a result of ongoing bank restructurings in two jurisdictions.
5. Limited credit conversion from off- to on-balance sheet: Counterparty default – unlike, for instance, credit default swaps – does not in itself automatically crystallize the conversion of contingent trade products from off- to on-balance sheet. We observe from the data, documentary and (implied) performance contingencies inherent to trade products, which mitigate against potential defaulted on-balance sheet exposures. In the case of import L/Cs, for instance, that an average of 50% of document sets presented to banks to make drawings under import L/Cs contained discrepancies on first presentation. In these cases, there is no obligation of the bank to waive the documentary discrepancies and make payment, unless they provide reimbursement or the discrepancies are corrected within the L/C validity period. A significant proportion of L/Cs facilities also expire unutilized – this may occur, for instance, where an exporter chooses not to ship the goods stipulated in the L/C as a result of concerns about the credit-worthiness of its customer.
Given the overarching economic imperative of promoting international trade as an engine of global economic recovery, the data pooled in the ICC Register provided a basis for reviewing the risk mitigants inherent to trade instruments and the correlation with credit risk mitigants under the Basel framework.
ICC recognized that this data collection exercise is the first step in examining the risk profile of trade finance products, and that this process will most likely require further enhancement to meet regulatory requirements for data collection. In the second phase of the project, ICC is working to enhance and expand the data collected, thus creating a compelling base of information for the trade finance industry. In this context, it is ICC’s objective to ensure that the treatment of trade products is fully consistent with the Basel Committee’s macro-prudential objective to promote financial stability, as well as the current imperative to support international trade as an engine of economic growth.
Figure 52 Average rate of default on traditional trade products, 2005-2009 (in %)
Impo
rt
L/C
s
Exp
ort
Con
firm
ed L
/Cs
Sta
ndby
s an
d G
uara
ntee
s
Impo
rt L
oans
(C
orpo
rate
Ris
k)
Impo
rt L
oans
(B
ank
Ris
k)
Exp
ort L
oans
(C
orpo
rate
Ris
k)
Exp
ort L
oans
(B
ank
Ris
k)
0.3500
0.3000
0.2500
0.2000
0.1500
0.1000
0.0500
0.0000
0.0580
0.2820
0.0100
0.1240
0.2930
0.1680
0.0230
Rethinking tRade & Finance: icc global SuRvey 2011 Rethinking tRade & Finance: icc global SuRvey 2011 69
ICC Survey 2011 respondents pointed to key issues in the new regulatory regime
Leverage ratios
According to ICC members, the Basel III new regulatory regime affects letters of credit and structured finance in general, and leads to a potential five-fold augmentation of the CCF for import/export letters of credit. Under the current standardized approach of the Basel II framework, the most frequently used Credit Conversion Factors (“CCF”) for off-balance sheet trade products are:
n 20% for “trade-related contingencies”, i.e. contingent liabilities that arise from trade-related obligations underpinned by the movement of goods or the provision of services (e.g. L/Cs and shipping guarantees); and
n 50% for “transaction related contingencies”, guarantees that support certain performance obligations of a borrower, the calling of which are contingent on the overall performance (rather than financial position) of the borrower (e.g. performance guarantees).
These CCFs are used to adjust the risk-weighted asset calculation to reflect that not all of the off-balance sheet exposure will necessarily convert to on-balance sheet exposure. These values indicate that an off-balance sheet exposure for a contingent trade product will not necessarily crystallize in full into a credit exposure for the bank. The BCBS seemed to be inclined, however, to increase the CCF for all off-balance sheet exposures (including trade products) to 100% for the purposes of calculating a leverage ratio constraint. This proposal is based on the view that:
a) all off-balance sheet items are a significant source of leverage within the financial system; and
b) the failure to include off-balance sheet items in the measure of exposure creates an incentive to shift items off the balance sheet to avoid the leverage ratio constraint.
Many respondents to the Survey pointed out that this blanket approach to “off-balance sheet” items under the proposed leverage ratio is based on a fundamental misunderstanding of both the operational context and the mechanics of trade financing. Specifically:
1. it is difficult to maintain that trade-related exposures are a source of significant leverage, as the underlying transactions are driven by genuine economic activity, e.g. the sale of goods or services;
2. as trade transactions are originated at the request of a client, these types of facilities are unlikely to be established to avoid leverage constraints;
3. trade-related exposures are also unlikely to contribute to fluctuations in asset prices, as they are short-term in nature and liquidated by payment at maturity.
What is more, the conversion of contingent trade products from off- to on-balance sheet is not automatic – and, in almost all cases, is detached from an event of default – with drawdowns contingent on compliance with documentary requirements. This process contrasts with credit substitutes, including financial standby letters of credit and guarantees, which are often honoured when a com plying demand is made, only after a statement of breach is presented, i.e. with much less documentation and particularly third party documentation. Also, the default of the counterparty – unlike in credit default swaps – does not in itself automatically crystallize the conversion of a trade documentary credit and similar instruments from off- to on-balance sheet.
Therefore, ICC members were concerned with the proposals to assign a 100% CCF to unconditionally cancellable commitments, which would include commitments for trade-related and transaction-related contin-gen cies (as these are often offered on an unconditionally cancellable basis). As noted by many respondents to the Survey, increasing the CCF to 100% for trade- and transaction-related contingencies for the purposes of calculating a leverage ratio could adversely affect the provision of trade finance instruments, since banks may well be able to achieve higher yields with non-trade products.
What is more, the conversion of off-balance sheet trade exposures is not driven by counter-party default, but rather is performance-related (e.g. performance guarantees), or dependent on documentary requirements (e.g. L/Cs). With regard to the latter, for example, a bank has no obligation to make payment to an exporter under an import L/C unless a range of documentation is submitted in compliance with the requirements of the instrument. In this connection, if the bank observes discrepancies
Rethinking tRade & Finance: icc global SuRvey 2011 70
in the documents, but is not at that time com fort able with the creditworthiness of the applicant, it has no obligation to waive the documentary discrepancies and make payment.
Respondents also pointed to a potential dis crepancy in application of the leverage require ments. For instance, a 100% leverage ratio may apply to unconditionally cancellable commitments, direct credit substitutes, accep tances, standby letters of credit, trade letters of credit, failed transactions and unsettled securities. However, for conditionally cancellable commitments, such as off-balance sheet credit card commitments, the leverage ratio would only be 10%. While L/Cs are indeed unconditionally commitments to pay, the current loss default rate on them is much lower than any credit card commitment.
Consequently, where the leverage ratio becomes the “binding constraint”, banks may choose to increase the cost of providing trade products; or only selectively offer these products to customers. Adding a 100% lever-age ratio to L/Cs, which are primarily used by developing countries – and for which greater security in the financing of the trade transaction is asked– may put trade at a disadvantage relative to potentially more risky forms of assets. This means that raising the requirement to the 100% level would defeat the principle of appropriate risk weighting. SMEs which are clients around the world of small- and medium-sized banks, are more reliant on L/Cs than large enterprises, and these banks tend to have a proportionally higher share of L/Cs than large banks engaged in supply chain finance. In other words, companies and countries which are at the margin (or at the onset) of world trade flows (or at the beginning of their trade integration) will suffer proportionally more from the 100% leverage tax than the larger banks.
The maturity floor
In addition to the problem posed by the new leverage ratio, ICC members asserted that there should be reconsideration of the Basel rules in respect of the maturity floor applied to trade assets under the advanced model. Whilst trade financing is usually short-term in nature, based on between 0 to 180 days maturity, the Basel II framework applies a one-year maturity floor for all lending facilities. Since capital requirements (naturally) increase with maturity length, the capital costs of trade financing are artificially inflated as a result.
All regulators have the (national) discretion to waive this floor (so far only three regulatory agencies in the world have been inclined to waive – Germany, the UK and Hong Kong). The ICC Register clearly confirmed that the average L/C has a maturity close to 90 days (a standard of payment in short-term international trade). Consequently, obliging financial institutions to back a self-liquidating asset for a full year is a considerable waste of capital resources at a time when these are scarce.
Liquidity issues
ICC respondents to the Survey were also in favour of including trade instruments below 30 days and correspondent banking deposits as a stable source of funding. Experience has shown that these balances are stable funding sources and, due to their transactional nature, can take considerable time to move, usually 30 to 45 days in a compressed timeline, and between 12 and 14 weeks on a business-as-usual basis.
Recommendations
The Basel II charter has significantly increased the capital intensity of trade finance lending, hence constraining the ability of banks to lend short-term trade credit. The 2011 Survey results indicated that these increases in capital requirements may have particularly adverse consequences on trade finance for SMEs and counterparties in developing economies.
Increasing the CCF to 100% for trade-related contingencies for the purposes of calculating a leverage ratio could significantly disadvantage trade finance-focused banks. As such, ICC recommended that if a leverage ratio is to be adopted, off-balance sheet trade products should be allowed to retain the CCF values used by banks under the current “risk weighted assets” calculation of Basel II. This would point in the same direction as foreseen in the “additional option for impact assessment” in the consultative document, which would allow financial institutions to “apply a lower (positive) CCF for unconditionally cancellable commitments or Basel II standardized CCFs”.
ICC proposed to allow key risk attributes to be determined on the basis of industry benchmarking. As noted above, many banks have historically faced difficulties identifying and isolating sufficient data to produce validated estimates of risk attributes for trade lending. Today and into the future, the ICC Register
Rethinking tRade & Finance: icc global SuRvey 2011 Rethinking tRade & Finance: icc global SuRvey 2011 71
can provide evidenced-based information for this purpose. It is the ICC’s view that such an approach would be consistent with the G-20 agenda to promote trade finance, without compromising the overall objective of the Basel Committee proposals.
Respondents to the 2011 Survey argued that it is important to exempt trade finance products from the one-year maturity floor applied to lending facilities on a global basis. Within national discretion, Basel II allows for the exemption of this maturity floor for “short-term self-liquidating trade transactions”. This is because the contractual maturity of trade finance products is reflective of the time horizon over which banks are exposed to a credit risk. Such discretion has already been exercised by three national regulators. Our initial analysis suggests that removal of the maturity floor has the potential to cut capital requirements for trade finance obligations of 90 days maturity by around 20-30%.
As noted, making sure that banks can provide finance to support trade is particularly important to developing countries, which have typically found it harder to compete for available funds, but which are now key drivers of the global rebound and global economic rebalancing. Under the new regulatory regime, banks and traders in low-income and developing countries may be particularly hit because the need for security will impose on them the need to continue operating with L/Cs, and they will not have access to the more creative forms of trade finance. It is expected that low-income countries will be substantial traders tomorrow, and new regulatory provisions will put them at a disadvantage and impair their chances to integrate in the global economy.
These are issues that transcend even the important question of bank regulations. They directly impact the provision and pricing of trade finance to the global economy, and hence the sustainability of the global recovery.
Rethinking tRade & Finance: icc global SuRvey 2011 72
Section 7 The way forward and conclusion
In the aftermath of the global financial crisis, trade is on the path to recovery led by a strong rebound in developing countries. However, many developing countries continue to face considerable obstacles and challenges in tapping global markets and reaping the benefits associated with trade. Along with supply-side constraints, such as limited or weak trade-related infrastructure and institutions, as well as unfavourable business or investment climates, these countries have also been experienced heightened vulnerability to high food and energy costs and financial shocks.
The financial crisis has highlighted the impor tance of export-led growth. Liberalized trade is a significant engine for growth and poverty reduction and can aid developing countries achieve the UN’s Millennium Develop ment Goals. Evidence has demon strated that deve loping countries that are more integrated into the global trading system tend to experience sustained growth.
Thus, concerted efforts will be required to keep protectionist tendencies in check and recommit to building a stronger and more effective multilateral trading system. The first step in that commitment will be to conclude the Doha Round of trade negotiations. This should be accompanied by other measures that will support access to trade finance for low-income countries as well as small banks in countries at all levels of development.
For those developing countries showing increased resilience to the trade downturn, one factor to take into consideration is the growing importance of South-South trade, especially for those small developing countries with strong links to China. This confirms that China and the other BRICs can play a key stabilizing role due to their large internal markets. It is crucial that these emerging economies refrain from trade protectionist measures that harm developing countries’ exports, and promote regional integration and trade facilitation.
Liberalization of services trade remains an important goal to help countries diversify into services and reduce trade volatility. A World Bank research project is compiling survey data on actual or applied trade policies for services. Its first results, covering 32 developing and 24 OECD countries, suggest that, as of 2007/08, the most restrictive policies in services trade were in Asia and MENA. Though developing countries have liberalized a range of services sectors over the last decades, protection persists, especially in professional services and transport.
Rethinking tRade & Finance: icc global SuRvey 2011 Rethinking tRade & Finance: icc global SuRvey 2011 73
Concluding the Doha Development Agenda remains the best way forward to foster trade integration. The global financial crisis cemented the critical role provided by a multilateral rules-based trade system. The WTO’s role in monitoring and reporting trade measures during the crisis helped distinguish WTO-compatible policies from discriminatory ones, which was critical to ensuring the maintenance of a fair and transparent trading system. It also restrained governments from adopting more pervasive restrictions on trade to curtail the domestic impacts of the crisis.
Despite the recovery, high unemployment rates persist. While these rates remain elevated, governments should continue to make certain that the benefits of an open multilateral trading system are not compromised by short-run pressures to protect domestic markets. Keeping markets open will also be an important way to counter the effects of the withdrawal of expansionary fiscal and monetary policies. Now is the right time to reach an agreement on Doha.
Peter Sutherland and Jadish Bhagwati, commissioned by a group of developed and developing economies, made the case for the adoption of a deadline to complete the Doha talks before the end of 2011. They emphasized that prevailing conditions were opportune – first, they noted, higher commodity prices can dissipate resistance by farmers benefiting from subsidies; second, the weak recovery enhances the attraction of a potential stimulus of approximately USD 360 billion for global trade; and, third, that there was now a compelling need to address issues arising from new global trade dynamics.
Recent high-level government commitments from the G-20 Meeting and APEC Summit have given momentum to the Doha negotiations. The November 2010 G-20 Meeting in Seoul and the Asia-Pacific Economic Cooperation (APEC) Japan Summit renewed hopes for progress in the negotiations in the first half of 2011. Both the G-20 and APEC leaders saw a new window of opportunity in 2011 to intensify negotiations, and called for multilateral cooperation to pursue a comprehensive and balanced agreement.
Of equal importance is the necessity to develop the most appropriate regulatory regime for bank supervision. Over the past few months, ICC has expressed concerns that some of the new regulatory measures, particularly those in Basel III, may deter international financial institutions from doing business in some important ways. Increases in the leverage ratio for trade finance and new provisions concerning the maturity floor for trade assets could have severe negative impacts, particularly on SMEs in developing countries. The unintended effects of these reforms would defeat the G-20 goals of providing readily available short-term, trade-related funding at lower costs to businesses in these countries. It is crucial for professionals in trade finance and regulators to meet as often as possible in open and transparent discussions to share their experience in how to implement balanced regulatory measures.
A primary need is for more reliable market intelligence on trade finance. The ICC Banking Commission, a leading international forum for the banking industry, has been a leader, along with international development banks, in providing market intelligence to afford a clearer picture of conditions in the trade finance market. Plans are to refine and expand this intelligence to offer regulators more solid information before they formulate new regulations.
It is in the interest of all the parties – traders, governments, regulators and the banking community – that countries at all levels of development experience the benefits of a fair and open multilateral trading system.
Rethinking tRade & Finance: icc global SuRvey 2011 74
Rethinking tRade & Finance: icc global SuRvey 2011 Rethinking tRade & Finance: icc global SuRvey 2011 75
The ICC Banking Commission
The ICC Banking Commission is a leading global rule-making body for the banking industry, producing universally accepted rules and guidelines for international banking practice, notably letters of credit, demand guarantees and bank-to-bank reimbursement. ICC rules on documentary credits, UCP 600, are the most successful privately drafted rules for trade ever developed and are estimated to be the basis of trade transactions involving more than one trillion dollars a year. The Banking Commission is equally a worldwide forum of trade finance experts whose common aim is to facilitate international trade finance across the world. With over 500 members in 85 countries, many of them emerging, the Banking Commission is one of the largest ICC Commissions. ICC voluntary market-based approaches developed by the Banking Commission have often been praised for levelling the playing field in trade finance practices.
The Officers of the Banking Commission and its secretariat are:
Kah Chye TanChair, Global Head of Corporate Cash and Trade, Transaction Banking, Standard Chartered Bank, Singapore
Georges AffakiVice-Chair, Member of the Executive Committee and Global Head of Structured Finance, CIB Legal, BNP Paribas, France
Steven BeckBanking Commission Senior Advisor, Head of Trade Finance, Asian Development Bank
Gary CollyerBanking Commission Senior Technical Advisor, Founder Collyer Consulting, U.K.
Dan TaylorVice-Chair, Executive Director, TSS Global Market Infrastructures, JPMorgan
Alexander ZelenovVice-Chair, Director, Financial Institutions Department, Vnesheconombank, Russia
Yanling ZhangVice-Chair, Executive Vice President, Bank of China, China
Thierry SénéchalSenior Policy Manager, Banking Commission Secretariat, International Chamber of Commerce
The International Chamber of Commerce
ICC is the world business organization, a representative body that speaks with authority on behalf of enterprises from all sectors in every part of the world.
The fundamental mission of ICC is to promote open international trade and investment across frontiers and help business corporations meet the challenges and opportunities of globalization. Its conviction that trade is a powerful force for peace and prosperity dates from the organization’s origins early in the 20th century. The small group of far-sighted business leaders who founded ICC called themselves “the merchants of peace”.
ICC has three main activities: rule setting, arbitration, and policy. Because its member companies and associations are themselves engaged in international business, ICC has unrivalled authority in making rules that govern the conduct of business across borders. Although these rules are voluntary, they are observed in countless thousands of transactions every day and have become part of the fabric of international trade.
ICC also provides essential services, foremost among them the ICC International Court of Arbitration, the world’s leading arbitral institution. Another service is the World Chambers Federation, ICC’s worldwide network of chambers of commerce, fostering interaction and exchange of chamber best practice.
Business leaders and experts drawn from the ICC membership establish the business stance on broad issues of trade and investment policy as well as on vital technical and sectoral subjects. These include financial services, information technologies, telecommunications, marketing ethics, the environment, transportation, competition law and intellectual property, among others.
ICC enjoys a close working relationship with the United Nations and other intergovernmental organizations, including the World Trade Organization, the G20 and the G8.
ICC was founded in 1919. Today it groups hundreds of thousands of member companies and associations from over 120 countries. National committees work with their members to address the concerns of business in their countries and convey to their governments the business views formulated by ICC.
38 Cours Albert 1er, 75008 Paris, FranceTel: +33 (0)1 49 53 28 28Fax: +33 (0)1 49 53 28 59www.iccwbo.org