Abstract: We demonstrate projection of highly stabilized, aberration-corrected stimuli directly onto the retina by means of real-time retinal image motion signals in combination with high speed modulation of a scanning laser. In three subjects with good fixation stability, stimulus location accuracy averaged 0.26 arcminutes or approximately 1.3 microns, which is smaller than the cone-to-cone spacing at the fovea. We also demonstrate real-time correction for image distortions in adaptive optics scanning laser ophthalmoscope (AOSLO) with an intraframe accuracy of about 7 arcseconds.
OCIS codes: (170.0170) Medical optics and biotechnology; (170.4460) Ophthalmic optics
References and links
1. L. E. Arend and G. T. Timberlake, "What is psychophysically perfect image stabilization? Do perfectly stabilized images always disappear?," J. Opt. Soc. Am. A 3, 235-241 (1986).
2. M. Rucci and G. Desbordes, "Contributions of fixational eye movements to the discrimination of briefly presented stimuli," J. Vision 3, 852-864 (2003).
3. A. Roorda, F. Romero-Borja, W. J. Donnelly, H. Queener, T. J. Hebert, and M. C. W. Campbell, "Adaptive optics scanning laser ophthalmoscopy," Opt. Express 10, 405-412 (2002). http://www.opticsinfobase.org/abstract.cfm?URI=oe-10-9-405
4. S. Poonja, S. Patel, L. Henry, and A. Roorda, "Dynamic visual stimulus presentation in an adaptive optics scanning laser ophthalmoscope," J. Refract. Surg. 21, S575-S580 (2005).
5. M. Stetter, R. A. Sendtner, and G. T. Timberlake, "A novel method for measuring saccade profiles using the scanning laser ophthalmoscope," Vision Res. 36, 1987-1994 (1996).
6. C. R. Vogel, D. W. Arathorn, A. Roorda, and A. Parker, "Retinal motion estimation and image dewarping in adaptive optics scanning laser ophthalmoscopy," Opt. Express 14, 487-497 (2006). http://www.opticsinfobase.org/abstract.cfm?URI=oe-14-2-487
7. S. B. Stevenson and A. Roorda, "Correcting for miniature eye movements in high resolution scanning laser ophthalmoscopy" in Ophthalmic Technologies XI, F. Manns, P. Soderberg, and A. Ho, eds. (SPIE, Bellingham, WA 2005).
8. D. W. Arathorn, Map-Seeking Circuits in Visual Cognition (Stanford University Press, Stanford 2002). 9. H. B. Barlow, "Eye movements during fixation," J. Physiol 116, 290-306 (1952). 10. M. Eizenman, P. E. Hallet, and R. C. Frecker, "Power spectra for ocular drift and tremor," Vision Res. 25,
1635-1640 (1985). 11. S. Martinez-Conde, S. L. Macknik, and D. H. Hubel, "The role of fixational eye movements in visual
perception," Nat. Rev. Neurosci. 5, 229-240 (2004). 12. L. A. Riggs, J. C. Armington, and F. Ratliff, "Motions of the retinal image during fixation," J. Opt. Soc. Am.
44, 315-321 (1954). 13. T. N. Cornsweet, "Determination of the stimuli for involuntary drifts and saccadic eye movements," J. Opt.
Soc. Am. 46, 987-993 (1956). 14. G. Kumar, S. B. Stevenson, and A. Roorda, "Saccadic targeting variability revealed by high magnification
retinal imaging," J. Vision 6, 495 (2006). http://journalofvision.org/6/6/495/ 15. R. Engbert and R. Kliegl, "Microsaccades keep the eyes' balance during fixation," Psychol. Sci. 15, 431-436
(2004).
#85488 - $15.00 USD Received 23 Jul 2007; revised 28 Sep 2007; accepted 3 Oct 2007; published 4 Oct 2007
(C) 2007 OSA 17 October 2007 / Vol. 15, No. 21 / OPTICS EXPRESS 13731
16. D. W. Arathorn, "Computation in higher visual cortices: Map-seeking circuit theory and application to machine vision" in IEEE Advances in Image Pattern Recognition, (Institute of Electrical and Electronics Engineers, New York 2004).
17. D. W. Arathorn, "Memory-driven visual attention: an emergent behavior of map-seeking circuits" in Neurobiology of Attention, L. Itti, G. Rees, and J. Tsotsos, eds. (Elsevier, 2004).
18. D. W. Arathorn, "A cortically-plausible inverse problem solving method applied to recognizing static and kinematic 3D objects" in Advances in Neural Information Processing Systems, (MIT Press, 2005).
19. D. W. Arathorn, "Cortically plausible inverse problem method applied to complex perceptual and planning tasks" in Proc SPIE 62290E, (2006).
20. ANSI, American National Standard for the Safe Use of Lasers ANSI Z136.1-2000 (Laser Institute of America, Orlando 2000).
21. H. D. Crane and C. M. Steele, "Generation-V dual-Purkinje-image eyetracker," Appl. Opt. 24, 527-537 (1985).
22. L. A. Riggs and A. M. Schick, "Accuracy of retinal image stabilization achieved with a plane mirror on a tightly fitting contact lens," Vision Res. 8, 159-169 (1968).
23. H. Deubel and B. Bridgeman, "Fourth Purkinje image signals reveal eye-lens deviations and retinal image distortions during saccades," Vision Res. 35, 529-538 (1995).
24. M. Rucci, R. Iovin, M. Poletti, and F. Santini, "Miniature eye movements enhance fine spatial detail," Nature 447, 852-855 (2007).
25. R. H. Webb, G. W. Hughes, and O. Pomerantzeff, "Flying spot TV ophthalmoscope," Appl. Opt. 19, 2991-2997 (1980).
26. H. Hofer, B. Singer, and D. R. Williams, "Different sensations from cones with the same pigment," J. Vision 5, 444-454 (2005). http://journalofvision.org/5/5/5/
27. W. Makous, J. Carroll, J. I. Wolfing, J. Lin, N. Christie, and D. R. Williams, "Retinal microscotomas revealed with adaptive-optics microflashes," Invest Ophthalmol. Vis. Sci. 47, 4160-4167 (2006).
28. K. Grieve, P. Tiruveedhula, Y. Zhang, and A. Roorda, "Multi-wavelength imaging with the adaptive optics scanning laser ophthalmoscope," Opt. Express 14, 12230-12242 (2006) http://www.opticsinfobase.org/abstract.cfm?URI=oe-14-25-12230
29. C. A. Curcio, K. R. Sloan, R. E. Kalina, and A. E. Hendrickson, "Human photoreceptor topography," J. Comp. Neurol. 292, 497-523 (1990).
1. Introduction
Eye motion has been to a large extent an uncontrollable variable in human visual psychophysical experimentation and in important categories of mammalian visual neurophysiological experimentation. There have been efforts toward presenting stimuli stabilized with respect to the retina using displays positionally adjusted by the outputs of gaze trackers, but these are limited by the accuracy and response time of the tracker hardware and, despite reports of high accuracy and precision, many systems provide no direct measurement of the actual position of stimulus on the retina [1,2]. The development of the adaptive optics scanning laser ophthalmoscope (AOSLO) has allowed extremely high resolution, real-time imaging of living retina [3] as well as the ability to project microscopic stimuli directly onto the retina [4].
An AOSLO, like most scanning laser systems, acquires images over time by recording the scattered light from a focused spot on the retina as it scans in a raster pattern across a region of interest. Images are assembled in the frame grabber after synchronizing the recording of scattered light with scan position information, which is drawn from the scanning mirrors. Because the frame is constructed over time, ever-present eye movements generate unique distortions in each acquired frame [5]. High magnification imaging systems, like the AOSLO, are especially affected by these eye motions. However, contrary to any opinion that these distortions might be considered a limit, the image data stream from this instrument offers a unique advantage since it allows the motion of the eye to be computed to accuracies that are a small fraction of the diameter of a foveal cone [6,7]. Vogel et al (2006) reported the use of a new algorithm invented by one of the authors – MSC or map-seeking-circuit [8] – to compute eye motion vectors and to compensate the motion to produce stabilized video imagery in real-time. This is accomplished by computing the transformation between patches
#85488 - $15.00 USD Received 23 Jul 2007; revised 28 Sep 2007; accepted 3 Oct 2007; published 4 Oct 2007
(C) 2007 OSA 17 October 2007 / Vol. 15, No. 21 / OPTICS EXPRESS 13732
of successive scan frame which cover the same area of the retina, and using the parameters of this transformation to compute a dewarping correction. The speed of the MSC algorithm in computing these transformations allows dewarping and registration to be accomplished in real-time, using off-the-shelf PC hardware, following only milliseconds behind the acquisition of the raw image data.
This method has now been extended to predict the location of a selected cone with respect to the scanning raster several milliseconds ahead and to modulate a visible frequency stimulus laser to deliver a target pattern registered to the predicted location of the selected cone. In short, the computational technique in combination with the AOSLO instrument now enables visual stimuli to be projected on a freely moving retina (currently within certain limits of motion) to an accuracy of a fraction of the diameter of a foveal cone. Since the retina is being continuously imaged with IR illumination whether or not the visible stimulus is turned on, the as-delivered position of the stimulus can be directly observed and measured, so the residual error of prediction plus instrument error can be directly incorporated in experimental analysis. This capability opens the door to a wide array of new psychophysical and neurophysiological experimentation. In addition, it opens the door to clinical uses of the instrument which require accurate compensation of eye motion, such as micro-perimetry and laser surgery.
Eye movements: An eye in its natural state is never at rest with respect to its head or with respect to any target of observation. Even during fixation, when the observed object appears to be fixed in the field of view, the motion of the eye sweeps any projected point of the object across many cone diameters [6,9-12]. This motion is not smooth but includes components of various frequencies from a high frequency (50-100Hz) jitter of amplitude up to several cone diameters down to a drift with much larger amplitudes. In addition, micro-saccades occur during periods of fixation which have several purported roles, including restoration of the drifting image back to its preferred retinal location [13,14], or to counteract image fading due to receptor adaptation [11,15]. Between fixations there are large, fast movements with amplitudes of up to a dozen degrees known as saccades, by which the relatively small high resolution part of the retina can be directed to acquire high resolution imagery of important parts of the scene. The angular velocities of the micro-saccades (~100 deg/s) and saccades (up to 1000 deg/s) are of a similar magnitude to the slower vertical scanning velocity (30 deg/s for a 1 deg field at 30 frames per second) of the AOSLO raster scan. The highest velocities of a saccade are even a measurable fraction of velocity of the fast horizontal scanning velocity (1 deg scan in 0.04 microseconds = 40,000 deg/sec).
2. Methods
2.1 Stimulus location prediction
The computation of the predicted location of the targeted cone in the scanning raster is the major difference between the implementation to be described here and the implementation of the image stabilization and dewarping described in [6]. We will briefly summarize the latter method here, but readers are referred to the earlier publications for a mathematical understanding.
MSC is a general purpose algorithm for determining the transformation between two patterns and has been applied to a variety of machine vision and other problems [8,16-19]. The transformation-discovery problem that arises in the context of image sequences captured by AOSLO instruments are the dynamic shift of the retinal mosaic image with respect to the raster and the consequent relative distortions of frames captured at different intervals. To create video output sequences which appear stable, a reference frame must be chosen, and all translations and distortions of subsequent frames relative to that reference frame must be removed. To accomplish this, an accurate estimate of those two transformations is computed by applying MSC to determine where a sequence of patches of mosaic depicted in the current
#85488 - $15.00 USD Received 23 Jul 2007; revised 28 Sep 2007; accepted 3 Oct 2007; published 4 Oct 2007
(C) 2007 OSA 17 October 2007 / Vol. 15, No. 21 / OPTICS EXPRESS 13733
image frame appear in the retinal mosaic depicted in the reference frame. An interpolated path through that sequence of transformations is then used to compute the corrections to the current image frame which register it to the reference frame. The same computations are also used to compute the eye motion trajectory over a sequence of captured frames.
The computations just described are computed at frame rate (30 Hz) or better so that a stabilized, dewarped video stream can be presented on the instrument operator’s screen. Since a one-frame lag can be tolerated in monitoring, the computations can be made just after the arrival of the images in the frame buffer. For stimulus delivery, however, a one frame lag would mean that the stimulus would be delivered where the target cone was located 33 msec earlier, which could be several cone diameters away from where it is located at the time of stimulus delivery. Clearly this would be unacceptable. Consequently the location in the raster at which the stimulus is to be presented must be computed predictively, i.e. before the focused spot in the AOSLO scans over the desired point. If eye motions contained only smooth, inertial components good predictions of target location could be made long in advance. However, since eye motion contains a somewhat random oscillatory component of relevant amplitude in the order of 50 – 100Hz, these predictions must be made in 5 milliseconds or less. This is far more demanding than the stabilized display application both computationally and in the required performance of all elements of the computer system(s) involved.
We will now discuss in detail the strategy used to compute the predicted location of the target cone. We assume here that the reader will go to the other references for an understanding of the MSC algorithm and its application to the registration and dewarping application.
The process of stimulus delivery starts with the operator selecting, on the stabilized video display, one or more target cones. This selection may be done manually, by a mouse click on each of the target cones in the stabilized display, or automatically, by selecting an area in which a machine vision algorithm is applied to locate the n most salient cone sized objects. During stimulus delivery the software delivers the stimulus pattern to each of the selected targets, usually in a random, uniformly distributed sequence.
In the remainder of this discussion we will consider the situation where a single cone has been selected. This yields a set of coordinates in the original reference frame of the location of that target cone. The motion of the eye relative to the scanning raster is updated continuously by the method described above and in [6]. This can be used to compute an accurate location for the target cone in the patch of the frame which has just arrived but, since the eye can move significantly in the ensuing 33 msec, that location can only be used as an estimate for the target location in the raster within which the stimulus is to be delivered. That target location estimate must be corrected by the eye movements that occur in the time interval between the acquisition of the first estimate and when the stimulus is to be delivered in the next frame. Since the speed of the MSC algorithm on conventional computers is proportional to the range of transformations it must consider, narrowing that range as the time to delivery of the stimulus decreases allows us to minimize the interval between the last computation and the delivery of the stimulus. Therefore, we update the first estimation of the target location by two computations during the capture of the early arriving data comprising the frame in which the stimulus is to be delivered. The first adjustment to the target location is computed from a pre-critical patch of retinal image collected sufficiently above (earlier in time) the estimated target location to allow the full range of possible eye motions to be accommodated. The final estimated target location is then updated by a computation of target location from a critical patch of the retinal scan located just far enough above (earlier in time) the estimated target location, leaving the minimum time required for the software to arm the laser modulators in order to place the stimulus. If the calculation is fast enough, then the eye will have moved a minimal amount between the estimate and the actual placement of the stimulus.
#85488 - $15.00 USD Received 23 Jul 2007; revised 28 Sep 2007; accepted 3 Oct 2007; published 4 Oct 2007
(C) 2007 OSA 17 October 2007 / Vol. 15, No. 21 / OPTICS EXPRESS 13734
There is another reason for the use of two computations to update the target location estimate. Notice that, since the raster scan is downward, if the retinal mosaic is moving upward relative to the raster there will be less time to compute the target location than if the retinal mosaic is moving downward. Hence the location of critical patch must be adjusted by an estimate of eye velocity for the interval to target delivery. Due to the oscillatory and non-linear components of eye motion, this estimate of eye velocity also should be made as close as possible to the time of stimulus delivery. We use the pre-critical patch to make this velocity estimate. Since the pre-critical and critical patches are located higher in the same raster that the stimulus to be delivered, their dimensions and the time needed to compute the corrections limit how high in the raster the stimulus can be delivered. If an eye movement has shifted the target too far up in the raster, the corrected stimulus location cannot be computed in time and must be suppressed. Obviously, if eye movements have moved the target location outside the raster in any direction the delivery of the stimulus must also be suppressed.
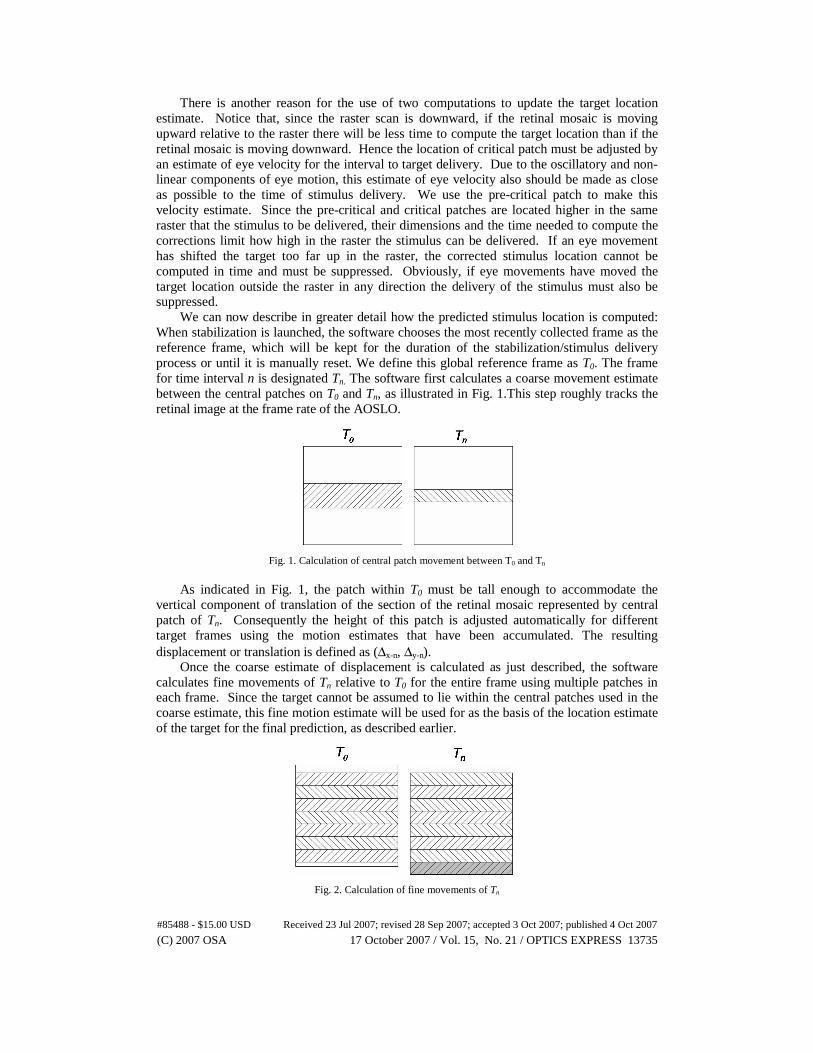
We can now describe in greater detail how the predicted stimulus location is computed: When stabilization is launched, the software chooses the most recently collected frame as the reference frame, which will be kept for the duration of the stabilization/stimulus delivery process or until it is manually reset. We define this global reference frame as T0. The frame for time interval n is designated Tn. The software first calculates a coarse movement estimate between the central patches on T0 and Tn, as illustrated in Fig. 1.This step roughly tracks the retinal image at the frame rate of the AOSLO.
Fig. 1. Calculation of central patch movement between T0 and Tn
As indicated in Fig. 1, the patch within T0 must be tall enough to accommodate the
vertical component of translation of the section of the retinal mosaic represented by central patch of Tn. Consequently the height of this patch is adjusted automatically for different target frames using the motion estimates that have been accumulated. The resulting displacement or translation is defined as (Δx-n, Δy-n).
Once the coarse estimate of displacement is calculated as just described, the software calculates fine movements of Tn relative to T0 for the entire frame using multiple patches in each frame. Since the target cannot be assumed to lie within the central patches used in the coarse estimate, this fine motion estimate will be used for as the basis of the location estimate of the target for the final prediction, as described earlier.
Fig. 2. Calculation of fine movements of Tn
#85488 - $15.00 USD Received 23 Jul 2007; revised 28 Sep 2007; accepted 3 Oct 2007; published 4 Oct 2007
(C) 2007 OSA 17 October 2007 / Vol. 15, No. 21 / OPTICS EXPRESS 13735
As illustrated in Fig. 2, Tn is divided into many patches (usually eight or more), and the software calculates movement of each patch relative to the corresponding patch in the reference frame T0. Because of global shift of Tn, the values (Δx-n, Δy-n) from the central patch movement calculation, described above, is used as an offset when the software calculates the fine movements. Displacements for patches in Tn that are mapped outside T0 cannot be calculated and are instead assigned directly from the neighboring patches. For example, in Fig. 2 the last patch (gray area) on Tn will not be calculated because there is no mapping information on T0.
As described in Vogel et al., 2006, the software also dewarps and stabilizes the target frame Tn based on these fine movements. The stabilized, dewarped image is used for display on the user interface and for later processing of the experimental data.
The fine estimate for the location of the target in frame Tn becomes the basis for the predictive target estimation as the raster data for the next frame starts arriving from the frame buffer. We now redefine the last full frame acquired as Tn-1 and the arriving data as Tn. The predicted target location (xn, yn) in the target frame Tn, is updated from the position (xn-1, yn-1) computed in frame Tn-1 based on the motion computed from the pre-critical patch in frame Tn as discussed earlier. This pre-critical motion estimate is used to compute the lead time t between the acquisition of the critical patch and delivery of the stimulus by adding the known latency of the computational and hardware delays. From this lead time, the latest safe location for the critical patch is determined so that it remains at least t milliseconds ahead of the target on the target frame. The critical patch is then acquired and used for a final update of the estimated target location. It takes <1.5 msec (dependent on CPU) for the MSC algorithm to compute the critical patch delta. This latency plus the hardware/OS latency to arm the laser modulator in order to place the stimulus on retina must be less than the assumed lead time t. Figure 3 illustrates the relationship between the frames and the various patches used to compute and refine the estimates of the predicted target location.
Fig. 3. Data used for computing predicted location of stimulus
2.2 Detection/correction of blinks and saccades
In the discussion so far we have ignored a number of practical details which are critical to proper operation of the stimulus delivery. Both blinks and saccades must be detected because they make the computations described above impossible due to either absence of image or insufficiency of overlap between the current and reference frames. When either event is detected, the software waits to reacquire lock until a frame which sufficiently overlaps the reference frame is next acquired. Detection of a blink or saccade is based on data from the target frame (Tn) and the previous frame (Tn-1). Due to timing issues in a real-time system, our
#85488 - $15.00 USD Received 23 Jul 2007; revised 28 Sep 2007; accepted 3 Oct 2007; published 4 Oct 2007
(C) 2007 OSA 17 October 2007 / Vol. 15, No. 21 / OPTICS EXPRESS 13736
software compares only the first half frames between frame Tn and Tn-1, as illustrated in Fig. 4.
Fig. 4. Determination of a Saccade/Blink
As illustrated in Fig. 4, the upper half of frames Tn-1 and Tn are divided into four equal-height patches. The software calculates relative movements (δix, δiy) and correlation (Cix, Ciy) patch by patch. The criteria below are then applied to determine saccade/blink. Whenever any of the following four conditions are met,
( ) ( )( ) ( )
max | | min | |
max | | min | |
ix ix sx
iy iy sy
ix cx
iy cy
R
R
C R
C R
δ δ
δ δ
− >
− >
<<
(1)
the target frame Tn is assumed to contain a blink or saccade event. (Note: subscripts i range from 1 to 4, Rsx, Rsy are X-, Y- thresholds of patch movements, and Rcx, Rcy are X-, Y- thresholds of patch correlation.)
2.3 Stimulus delivery
The stimulus was generated by modulating a laser (or lasers) during the raster scan with a high frequency fiber-based acousto-optic modulator, or AOM (Brimrose Corp, Baltimore MD). Laser modulation was synchronized with the scanning beam to ensure exact placement of the stimulus within the raster. Signals to drive the AOMs were generated by digital-to-analog waveform generators (board model # UF6021 Strategic Test Inc, Stockholm, Sweden). Analog waveforms, synchronous with the scanning beam, allowed us to place an image, line-by-line, directly onto the retina. Delivery of complex, gray-scale images are possible with this method [4] and because the same laser that projects the pattern is also used to record the image, the location of the stimulus can often be visualized directly on the retinal image and its exact location can be determined.
In order to meet the real-time requirements for stabilized stimulus delivery, we had to modulate the scanning laser on the retina on a just-in-time basis. Due to bandwidth and hardware limitations, we restricted our waveform sequences to a series of 16-line buffers, where a sequence of 32 such buffers would comprise a single AOSLO frame. Upon computation of the final estimate for the final target location, the stimulus would be written to the appropriate location in the appropriate buffer (or buffers) and placed in the waveform generator queue.
For the stabilized stimulus delivery system we implemented a system to modulate two scanning lasers synchronously, each with a different wavelength. This allowed us to run in several modes. In the typical operating mode, the infra-red laser was used to record the image and a second red laser was modulated to place a stimulus at the target location. The infrared power required to record an image (typically 120 microWatts over a 1.2 degree square field)
#85488 - $15.00 USD Received 23 Jul 2007; revised 28 Sep 2007; accepted 3 Oct 2007; published 4 Oct 2007
(C) 2007 OSA 17 October 2007 / Vol. 15, No. 21 / OPTICS EXPRESS 13737
was just visible to the subject with a luminance of about 2 cd/m2. The red laser power levels were easily controlled to generate luminances ranging from 0 to 100,000 cd/m2 but only the highest levels were sufficient to generate an image. This meant that the exact location of the red stimulus could not be determined directly from the image. To solve for this limitation, we turned off the IR laser in counter-phase with the red stimulus so the stimulus position appeared in the video in negative contrast. For the experiments reported here, the stimulus was a 9 X 9 pixel cross with bars that were 3 pixels wide, although any complex stimulus pattern could have been used. The presence of longitudinal and transverse chromatic aberration need to be taken into consideration when placing the visible light stimulus. Discussion of these issues are in section 4.3.
2.4 Data collection
The stabilization and stimulus delivery were tested on a single eye of two experienced observers and one naïve observer. Informed consent was obtained from the subjects after we explained the nature and possible complications of the experiment. Our protocol was approved by the University of California, Berkeley Committee for the Protection of Human Subjects. Imaging on human subjects was conducted according to the principles expressed in the Declaration of Helsinki. Each subject’s eye was dilated with tropicamide (1%) and phenylephrine (2.5%) to dilate the pupil and arrest accommodation. A bite bar was used to maintain stable alignment between the subject’s eye and the optical axis of the instrument. Videos were recorded of locations from 2 to 7 degrees from the foveal center and stable fixation was aided by having the subject look toward a small fixation spot that was visible to the imaged eye. Videos were recorded using 840 nm low-coherent light. The light levels used to record the image and project the stimulus never exceeded one tenth of the maximum permissible exposure levels as recommended by ANSI [20].
3. Results
3.1 Stabilized video
Stable videos of a reasonably good fixator can be recorded for long periods. Figure 5 is a video showing once such video sequence. The ability of the software to remove intraframe motion was quantified by measuring the motion of 28 different regions (48 x 48 pixel patches; 4 across x 7 high) of real-time stabilized movies using cross-correlation methods. If the movie was perfectly stabilized, then the motion of each section would be zero. If the motion was not perfectly stabilized, then some regions would move differently than others. The relative intraframe motion, computed as the standard deviation of the motion of the 28 sections over a 17 second movies, was 0.13 and 0.12 arcminutes for the horizontal and vertical directions respectively. This motion represents a fraction the spacing between the smallest cones in the retina.
It should be noted here that the precision of online stabilization is expected to be better than the precision of stabilized stimulus delivery (see next section), since in the former case there is no prediction involved.
#85488 - $15.00 USD Received 23 Jul 2007; revised 28 Sep 2007; accepted 3 Oct 2007; published 4 Oct 2007
(C) 2007 OSA 17 October 2007 / Vol. 15, No. 21 / OPTICS EXPRESS 13738
Fig. 5. (link to fig5_movie.avi 1.9 MB) Real-time stabilized video. The video has been shortened, compressed and resampled to 2/3 of the original dimension. Video size is 400 X 400 pixels. Scale is 280 pixels per degree. The image shows a normalized addition of all 1063 frames in the stabilized sequence. The high contrast of cones in the added set is a further demonstration of the quality of the stabilization for long image sequences.
3.2 Stabilized stimulus delivery
Figure 6 shows a video for a single subject C at a location ~6 deg from the foveal center. The IR laser was turned off to form the stimulus. The exact location of the stimulus with respect to the retina can be computed directly from each frame of the video sequence.
Fig. 6. (link to fig6_movie.avi 2.9 MB) Stabilized stimulus delivery for subject C. The video has been cropped to 365x365 pixels from the original 512X512 pixel. The stimulus is part of the video and appears as a black cross. A digital white cross was written onto the video at the exact location of the stimulus. Scale is 413 pixels per degree.
The delivery of the stimulus is based on predictive computations, so there is necessarily a
range of error between the computed location and the actual location of the target cone. Though there are other possible errors introduced by the instrument, the predictive error is by far the largest source. As discussed earlier, one advantage of AOSLO-delivered stimulus over other methods is that the continuous imaging of the retina allows direct measurement
#85488 - $15.00 USD Received 23 Jul 2007; revised 28 Sep 2007; accepted 3 Oct 2007; published 4 Oct 2007
(C) 2007 OSA 17 October 2007 / Vol. 15, No. 21 / OPTICS EXPRESS 13739
after the delivery of the stimulus of the accuracy of the prediction plus any other errors introduced by the system.
Because the writing of the stimulus disrupts the image of the target cone, we must use a reference point near, but displaced from the actual target location to measure the accuracy of the delivery of the stimulus. Figure 7 shows the predicted stimulus delivery location as a white cross superimposed on the actual delivered back-cross stimulus. A reference feature (usually a cone) near the target cone but far enough to not be overwritten by the stimulus is selected from the stabilized image. The reference feature acts as a surrogate for the target cone for the purposes of computing the distance of the stimulus coordinates to the actual location of the target cone. The current position in each frame of this reference feature is calculated using a centroid. The feature centroid is marked in Fig. 7 with a yellow cross.
Fig. 7. An example of selecting a reference spot nearby the target on raw video. In this video, the stimulus was a black cross. A white digital cross at the exact location of the stimulus was overlayed at the time the video was recorded. The yellow cross indicates the location of a reference point that was used to measure stimulus location accuracy.
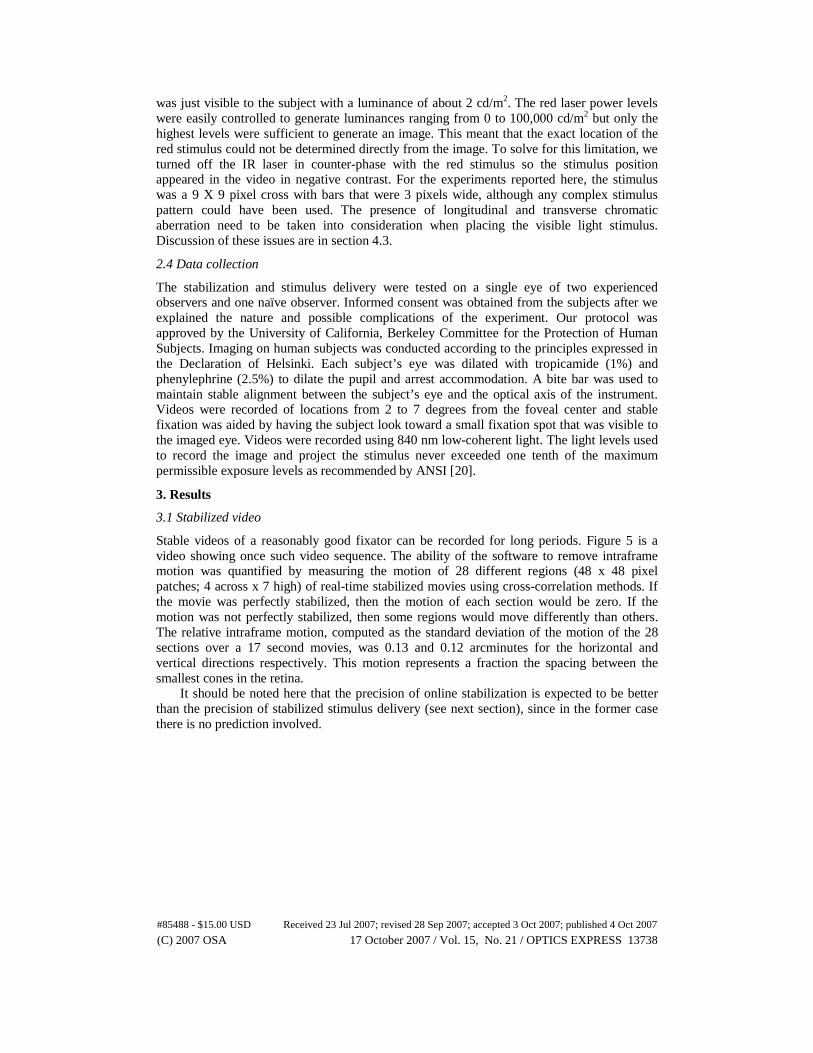
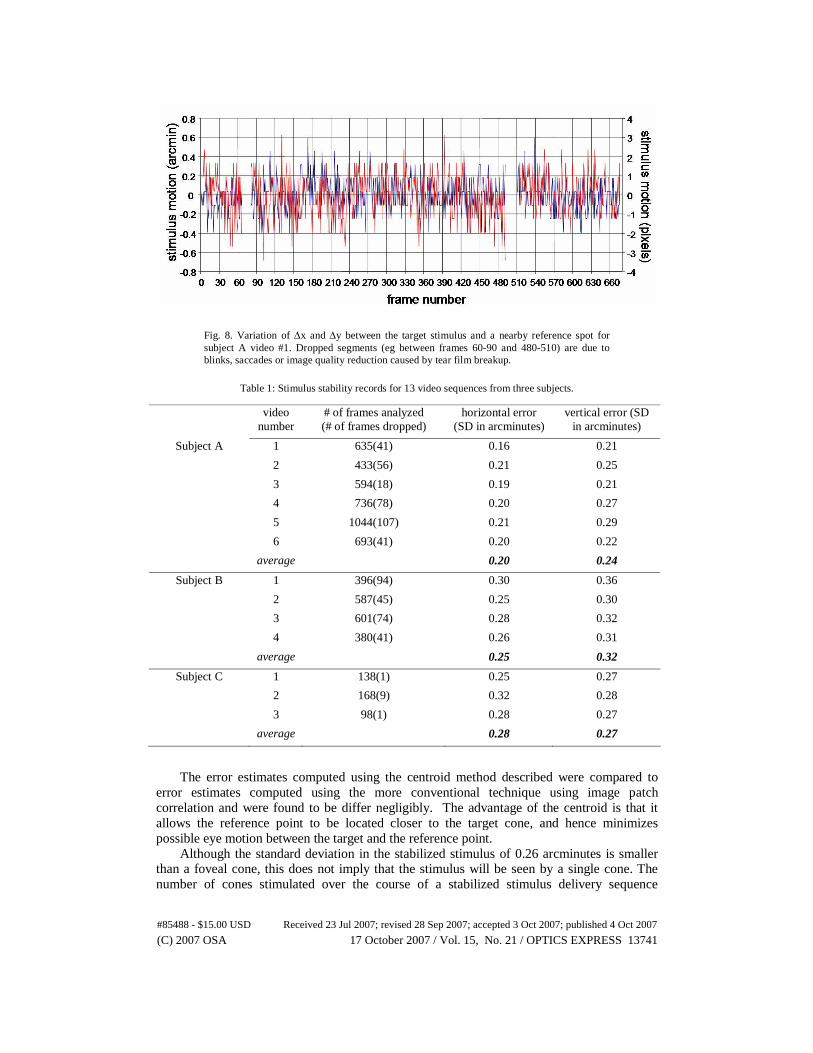
The stimulus location accuracy is computed as the distance variation between the two
crosses. When DC components in X and Y directions are filtered out, the AC components, defined as Δx and Δy, are illustrated in Fig. 8. The stimulus location accuracy for all analyzed sequences is shown on table 1. For subject A we also recorded the stimulus location accuracy when there was a one-frame delay, rather than a 6 msec delay. For a one-frame delay, the errors were 0.32 and 0.33 arcminutes for the horizontal and vertical stimulus locations, which are ~ 50% worse than for the shorter prediction time. In an eye with poorer fixation stability, this reduction in accuracy is expected to be even greater.
#85488 - $15.00 USD Received 23 Jul 2007; revised 28 Sep 2007; accepted 3 Oct 2007; published 4 Oct 2007
(C) 2007 OSA 17 October 2007 / Vol. 15, No. 21 / OPTICS EXPRESS 13740
Fig. 8. Variation of Δx and Δy between the target stimulus and a nearby reference spot for subject A video #1. Dropped segments (eg between frames 60-90 and 480-510) are due to blinks, saccades or image quality reduction caused by tear film breakup.
Table 1: Stimulus stability records for 13 video sequences from three subjects.
video number
# of frames analyzed (# of frames dropped)
horizontal error (SD in arcminutes)
vertical error (SD in arcminutes)
Subject A 1 635(41) 0.16 0.21
2 433(56) 0.21 0.25
3 594(18) 0.19 0.21
4 736(78) 0.20 0.27
5 1044(107) 0.21 0.29
6 693(41) 0.20 0.22
average 0.20 0.24
Subject B 1 396(94) 0.30 0.36
2 587(45) 0.25 0.30
3 601(74) 0.28 0.32
4 380(41) 0.26 0.31
average 0.25 0.32
Subject C 1 138(1) 0.25 0.27
2 168(9) 0.32 0.28
3 98(1) 0.28 0.27
average 0.28 0.27
The error estimates computed using the centroid method described were compared to
error estimates computed using the more conventional technique using image patch correlation and were found to be differ negligibly. The advantage of the centroid is that it allows the reference point to be located closer to the target cone, and hence minimizes possible eye motion between the target and the reference point.
Although the standard deviation in the stabilized stimulus of 0.26 arcminutes is smaller than a foveal cone, this does not imply that the stimulus will be seen by a single cone. The number of cones stimulated over the course of a stabilized stimulus delivery sequence
#85488 - $15.00 USD Received 23 Jul 2007; revised 28 Sep 2007; accepted 3 Oct 2007; published 4 Oct 2007
(C) 2007 OSA 17 October 2007 / Vol. 15, No. 21 / OPTICS EXPRESS 13741
depends on a number of factors such as wavelength and absolute power and its analysis is beyond the scope of this paper. However, to put our stimulus stabilization errors into context, Figure 9 shows a plot of the time averaged power distribution of the stabilized stimulus overlaying a typical cone mosaic at the fovea and at 1.8 degrees eccentric to the fovea. The time averaged power distributions were generated by convolving the diffraction-limited point spread function for 600 nm light through a 6 mm pupil with a Gaussian distribution (standard deviation of 0.26 arcminutes) representing the motion error. The power distribution of a static diffraction-limited point spread function is included on the figure for comparison. A 0.5 arcminute aperture (~ approximate cone aperture at the foveal) collects 70.4% of the diffraction-limited power distribution and 28.2% of the time averaged power distribution. A 1 arcminute aperture (~ approximate cone aperture at 1.8 degree eccentricity) collects 84.7% of the diffraction-limited power distribution and 71.6% of the time averaged power distributions.
Fig. 9. Normalized power distributions superimposed on a cone photoreceptor array. The small distributions are for a single diffraction limited spot of 600 nm light though a 6 mm pupil. The large distributions show a convolution of the diffraction-limited spot with the stabilized stimulus delivery error (standard deviation of 0.26 arcminutes). The upper plot shows those distributions with respect to a typical array of foveal cones and the lower plot show the same distributions with respect to cone array at 1.8 degrees eccentric to the fovea.
4. Discussion
4.1 Motion tracking
How does AOSLO’s ability to recover motion of the retinal image in real time compare with the best systems reported in the literature? The dual-Purkinje-image (dPi) eye tracker, which assesses eye movements based on the relative positions of Purkinje reflections I and IV, is typically accurate to 1 arcminute [21]. An ‘optical lever’ method, which records the deflections of a laser beam reflected off a plane mirror affixed to a contact lens, claim precision as good as 3 arcseconds [12]. AOSLO methods described here are accurate to about 7 arcseconds. While the optical lever method may provide more precise relative motion, the absolute location of the retinal image will shift whenever the contact lens moves [22].
It is important to note that the three methods described above all measure different aspects of eye motion. The ‘optical lever’ method records rotation of the eyeball, whereas the
#85488 - $15.00 USD Received 23 Jul 2007; revised 28 Sep 2007; accepted 3 Oct 2007; published 4 Oct 2007
(C) 2007 OSA 17 October 2007 / Vol. 15, No. 21 / OPTICS EXPRESS 13742
latter two are confounded in different ways by movements and wobble of the crystalline lens within the globe. The dPi method is subject to artifacts caused by accommodation and changes in lens tilt with respect to the cornea [23]. For the same reason, the image on the retina, as recorded by AOSLO methods, will experience prismatic shifts caused by lens tilt with respect to the cornea. Simultaneous eye motion recordings with AOSLO and dPi have revealed spikes in the eye motion trace following microsaccades. In the AOSLO, it was indeed a true overshoot of the retinal image but higher magnitude overshoots were seen in corresponding dual-Purkinje image eye traces [7].
4.2 Stabilized stimulus delivery
The videos of image stabilization provide unambiguous proof that we can stabilize a stimulus on the retina with an error that is less than a single cone. To our knowledge, this exceeds reported performance of any other reported stimulus stabilization system. Most recent dPi methods report stabilization precision of about 1 arcminute [24].
Systems which present a stabilized image using an innovative adaptation of the optical lever method, have reported stabilization precision as good as 0.38 arcminutes. This performance is comparable stabilization to the current method, but they are unable to provide unambiguous objective measures of performance, and the method suffers from contact lens drift over time [22].
A distinct feature of the AOSLO method, and SLO-based stimulus delivery methods in general [25], is that the recorded image containing the stimulus can be used to provide an unambiguous record of image stabilization, and can also be used to identify instances where the stimulus delivery has failed. Furthermore, the fact that the delivered stimulus is corrected by the adaptive optics system makes it possible to confine the stimulus to a single cone. Two unique advantages of our method of confining a stimulus to a single cone compared to previous reports [26,27] are that we can target a specific cone as well as maintain the stimulus on that cone over time.
4.3 Considerations for multiple wavelength operation
The precision of the stabilized stimulus placement is the same regardless of whether the imaging laser is modulated to place a negative-contrast stimulus on the retina, or if a second wavelength is used to place a visible, positive-contrast stimulus onto the retina. However, the accurate placement of the visible stimulus from a second laser at the target location will be affected by chromatic aberration in the eye. Chromatic aberration results in both lateral and longitudinal (focal length) changes as a function of wavelength. Its compensation requires the independent lateral and axial adjustments for each laser source be made and a detector for each source be used to ensure that the focused beam for each wavelength simultaneously land at the identical retinal location [28]. Axial adjustment is accomplished by adjusting the axial position of one source and its respective detector until both wavelengths generate images that are focused on the same plane (eg. photoreceptors). Following the axial correction, lateral correction can be made via appropriate placement of the beam along the achromatic axis of the eye, or by laterally adjusting the positions of one of the sources and its detector. These adjustments require that each light source have enough power to produce its own independent image. Following alignment, the visible light stimulus can be reduced (in increased) to levels that are appropriate for the particular task.
Careful compensation for chromatic aberration in the manner described above will ensure both precise and accurate placement of the visible light stimulus as specified. The final requirement, which can be ensured with proper head stabilization methods, is that the imaging beam remain at a fixed pupil location to prevent further shifts in transverse chromatic aberration.
#85488 - $15.00 USD Received 23 Jul 2007; revised 28 Sep 2007; accepted 3 Oct 2007; published 4 Oct 2007
(C) 2007 OSA 17 October 2007 / Vol. 15, No. 21 / OPTICS EXPRESS 13743
4.4 Limitations
Fixation stability: In order for stabilized stimulus delivery to work, the eye’s fixation must remain relatively stable. Over a typical AOSLO imaging field of 1 degree, most microsaccades that shift the image by over 0.5 degrees will cause real-time tracking to fail until the retina drifts back into position. If the eye drifts to the point where the imaged region does not correspond with the reference frame, the tracking will also fail. Given the wide variability in the fixation dynamics of normal eyes, there will be some eyes for which the system will not be effective. One solution to larger fixational eye movements would be to increase the field of view of the AOSLO image. The AOSLO field can be increased to 3 degrees, simply by changing the amplitude of the scanning mirrors. The downside of the increased field size is that the individual pixels projected into retinal space increase to about 0.35 arcminutes (~ 1.75 microns) which are too large to properly sample the smallest retinal features, such as foveal cones (~ 0.5 arcminutes separation) and will also compromise tracking performance. Nevertheless, at eccentricities of 1 degree and beyond, cones are twice the size of foveal cones [29] and so 3 degree image sizes may be acceptable for many applications. To account for overall drift of the image, we implemented a ‘reset button’ feature which replaces the reference frame with the currently viewed frame.
Image quality: The correlation-based tracking software requires high quality images, otherwise tracking will fail. AOSLO images are generally high contrast, owing to its confocality and adaptive optics correction. If the AO system fails, or if the eye’s aberrations levels or scattering are too high, then tracking and stabilized stimulus delivery performance will degrade or fail.
5. Conclusion
High resolution imaging, combined with raster scanning of the AOSLO, allows for high-frequency, high-accuracy eye tracking. Stimuli can be placed on the retina with localization errors on the order of 0.3 arcminutes or less, depending on the fixation stability of the subject. Performance is as good as the best stabilization systems reported, with the unique advantages that the stimuli are corrected with an adaptive optics system and that the exact location of these stimuli on the retina can be unambiguously determined.
Acknowledgments
This work is funded by National Institutes of Health Bioengineering Research Partnership Grant EY014375 and by the National Science Foundation Science and Technology Center for Adaptive Optics, managed by the University of California at Santa Cruz under cooperative agreement AST-9876783.
#85488 - $15.00 USD Received 23 Jul 2007; revised 28 Sep 2007; accepted 3 Oct 2007; published 4 Oct 2007
(C) 2007 OSA 17 October 2007 / Vol. 15, No. 21 / OPTICS EXPRESS 13744