44
International Pension Papers Retirement at Risk: The U.S. Pension System in Transition No. 3|2008
International Pension Papers
Retirement at Risk:The U.S. Pension System in Transition
No. 3|2008
Allianz Global Investors International Pension Papers No. 3|2008
2
ContentI. The Challenges of Aging – Old-age Provision in the U.S. . . . . . . . . . . . . . . . . . . . . . . . . . . . . . . . . . . . . . . . . . . . . . . . . . . . . . . 3
Executive Summary . . . . . . . . . . . . . . . . . . . . . . . . . . . . . . . . . . . . . . . . . . . . . . . . . . . . . . . . . . . . . . . . . . . . . . . . . . . . . . . . . . . . . . . . 3Demographic Challenges. . . . . . . . . . . . . . . . . . . . . . . . . . . . . . . . . . . . . . . . . . . . . . . . . . . . . . . . . . . . . . . . . . . . . . . . . . . . . . . . . . . 7Pension System Design. . . . . . . . . . . . . . . . . . . . . . . . . . . . . . . . . . . . . . . . . . . . . . . . . . . . . . . . . . . . . . . . . . . . . . . . . . . . . . . . . . . . . 8 Challenges for Social Security . . . . . . . . . . . . . . . . . . . . . . . . . . . . . . . . . . . . . . . . . . . . . . . . . . . . . . . . . . . . . . . . . . . . . . . . . . 8 Occupational pensions . . . . . . . . . . . . . . . . . . . . . . . . . . . . . . . . . . . . . . . . . . . . . . . . . . . . . . . . . . . . . . . . . . . . . . . . . . . . . . . 13 Private pensions . . . . . . . . . . . . . . . . . . . . . . . . . . . . . . . . . . . . . . . . . . . . . . . . . . . . . . . . . . . . . . . . . . . . . . . . . . . . . . . . . . . . . 17The Great Shift . . . . . . . . . . . . . . . . . . . . . . . . . . . . . . . . . . . . . . . . . . . . . . . . . . . . . . . . . . . . . . . . . . . . . . . . . . . . . . . . . . . . . . . . . . . 18 Quantifying the shift . . . . . . . . . . . . . . . . . . . . . . . . . . . . . . . . . . . . . . . . . . . . . . . . . . . . . . . . . . . . . . . . . . . . . . . . . . . . . . . . . 19 Five main risks . . . . . . . . . . . . . . . . . . . . . . . . . . . . . . . . . . . . . . . . . . . . . . . . . . . . . . . . . . . . . . . . . . . . . . . . . . . . . . . . . . . . . . . 21 Beyond auto-enrollment: Possible solutions . . . . . . . . . . . . . . . . . . . . . . . . . . . . . . . . . . . . . . . . . . . . . . . . . . . . . . . . . . . . 28
II. Perspectives – Pensions Assets Take on Weight . . . . . . . . . . . . . . . . . . . . . . . . . . . . . . . . . . . . . . . . . . . . . . . . . . . . . . . . . . . . 31
Financial Assets of U.S. Households . . . . . . . . . . . . . . . . . . . . . . . . . . . . . . . . . . . . . . . . . . . . . . . . . . . . . . . . . . . . . . . . . . . . . . . . . 31Future Pension Assets . . . . . . . . . . . . . . . . . . . . . . . . . . . . . . . . . . . . . . . . . . . . . . . . . . . . . . . . . . . . . . . . . . . . . . . . . . . . . . . . . . . . . 34 Growth perspectives . . . . . . . . . . . . . . . . . . . . . . . . . . . . . . . . . . . . . . . . . . . . . . . . . . . . . . . . . . . . . . . . . . . . . . . . . . . . . . . . . 34 Shift from DB to DC . . . . . . . . . . . . . . . . . . . . . . . . . . . . . . . . . . . . . . . . . . . . . . . . . . . . . . . . . . . . . . . . . . . . . . . . . . . . . . . . . . 35 Shift towards individual schemes . . . . . . . . . . . . . . . . . . . . . . . . . . . . . . . . . . . . . . . . . . . . . . . . . . . . . . . . . . . . . . . . . . . . . . 36 Strong annuity growth . . . . . . . . . . . . . . . . . . . . . . . . . . . . . . . . . . . . . . . . . . . . . . . . . . . . . . . . . . . . . . . . . . . . . . . . . . . . . . . 36 U.S. retirement market in 2020. . . . . . . . . . . . . . . . . . . . . . . . . . . . . . . . . . . . . . . . . . . . . . . . . . . . . . . . . . . . . . . . . . . . . . . . 37Bottom Line . . . . . . . . . . . . . . . . . . . . . . . . . . . . . . . . . . . . . . . . . . . . . . . . . . . . . . . . . . . . . . . . . . . . . . . . . . . . . . . . . . . . . . . . . . . . . . 41References . . . . . . . . . . . . . . . . . . . . . . . . . . . . . . . . . . . . . . . . . . . . . . . . . . . . . . . . . . . . . . . . . . . . . . . . . . . . . . . . . . . . . . . . . . . . . . . 42
Imprint . . . . . . . . . . . . . . . . . . . . . . . . . . . . . . . . . . . . . . . . . . . . . . . . . . . . . . . . . . . . . . . . . . . . . . . . . . . . . . . . . . . . . . . . . . . . . . . . . . 43

Allianz Global Investors International Pension Papers No. 3|2008
3
Executive Summary
The U.S. pension landscape is in a state of transition and, as a result, the popula-
tion will be exposed to evermore retirement risks. The role of Social Security is uncertain and employers are continuing to move away from guaranteeing pension benefits. As a result, there has been an evident shift from collective to individual responsibility.
The evident transition in the U.S. pension landscape can be identified by three trends:
I. Less generous Social Security benefits. Even though the situation is less severe com-pared to other industrialized countries, such as Japan or western Europe, demographic de-velopments are worsening Social Security’s prospects. The retiring baby-boomer gen-eration will impact Social Security finances, placing a burden on the system’s financial sustainability. Migration will keep the popu-lation growing, however at a decreasing rate.
II. A continuing shift from defined benefit to defined contribution pension plans, leaving employees holding more of the risks asso-ciated with capital markets and longevity.
Substantial legislative changes, namely the Employee Retirement Income Security Act of 1974 (ERISA) and the Pension Protection Act of 2006 (PPA), are primarily responsible for shifts in the occupational pension landscape. Their main goal was to regulate and provide more secure pension plans in order to pre-vent employees from losing their accumulat-ed pension rights. Though the original moti-
vation behind securing private pension plans is plausible, it has resulted in employers being on the lookout for less engaging op-portunities to cover occupational pensions.
III. A structural shift in company pension plans towards individual pension plans, such as Individual Retirements Accounts (IRAs).
This structural shift implies a different allo-cation of risks, with the individual now forced to work out his own pension strategy. Not only will individuals be responsible for mak-ing assumptions about their life expectancy, savings rate, capital market development and inflation, to name a few, they will also have to decide how to withdraw accumulat-ed assets prudently so that they are not at risk of running out of money later in retire-ment. What is more, with health-care costs rising at a faster pace than general inflation and wages, retirement nest eggs are being increasingly threatened.
A significant portion of the population ei-ther has no access to a pension plan and/or is not profiting from current tax incentives. And of the ones that have managed to put aside a nest egg for retirement, many pension balances are considered insufficient, particu-larly in view of rising health-care costs. In order to adequately finance a suitable standard of living over the course of retirement, the rule of thumb is to have 10 times the accumulated pension assets than pre-retirement annual income. Current average account balances, however, are worth only a fraction of that amount and so are far from sufficient.
The Challenges of Aging –Old-age Provision in the U.S.

Allianz Global Investors International Pension Papers No. 3|2008
4
Notwithstanding this, the United States has the largest and most developed funded pension market in the world. Tax-favored private pen-sion plans date back to the 19th century, mak-ing the United States one of the most mature markets in the world. Household financial assets have grown appreciably over the past decade, with total assets up by approximately 65% compared to 1997. Retirement assets today make up 40% of total financial assets and this percentage is expected to increase to 45% by 2020. The growth of total financial assets should remain dynamic, driven in particular by the growth in retirement assets.
In the second section of this study, we have included projections on the development of pension assets in the U.S. retirement market from now until 2020. We have also briefly out-lined current trends in the retirement market, giving projections for total second and third pillar assets and their main segments until 2020. We have based our projections on various scenarios, allowing for several uncertainties linked to a forecast of future developments. Based on these projections and varying as-sumptions in our scenario analysis, we expect
retirement assets to see strong growth. The pension market should grow between 3.0% and 5.8% a year, reaching somewhere between $25.5 trillion and $36 trillion by 2020. (see Figure 19, page 39) The drivers of this growth are almost entirely defined contrib ution plans and Individual Retire-ment Accounts. The importance of defined benefit plans will continue to decline.
Dwindling security Traditional defined benefit plans are consid-ered a relic of the booming 1950s and 1960s. Today, at least in the private sector, they have proved financially unsustainable for spon-soring employers as compared with defined contributions plans. The main drivers of this ongoing trend from defined benefit to defined contribution plans are financing issues and, in particular, structural changes to the com-position of industry. Decades ago, with a much larger portion of the economy belonging to unions, employee benefits could be used as a heavy bargaining tool. By 2007, however, only 13.3% of the workforce was represented by a union or similar group, such as an em-ployee association. Recent data from the
Figure 1 Percentage of elderly beneficiary income from Social Security benefits in 2007
< 50% of income37%
32%90-100% of income
31% 50-89% of income
Source: U.S. Social
Security Administration
2007: “Performance and
Accountability Report for
Fiscal Year 2007”
Figure 1 Percentage of elderly beneficiary income from Social Security benefits in 2007

Allianz Global Investors International Pension Papers No. 3|2008
5
U.S. Bureau of Labor Statistics shows that 85% of union workers have access to pension plans, compared to 59% of nonunion workers. Participation and take-up rates are also sig-nificantly higher among union workers.
This evident shift in the structure of pen-sion plans has had a considerable conse-quence on old-age provision. Accelerating dynamics have positioned employees in the uncomfortable role of retirement plan-ning venturers. However, it is questionable whether even employees with some mea-sure of financial education would have the financial savvy to make informed and crucial decisions – decisions previously taken by employers – based on the foreseeable capital market development, wage development, in-flation, etc. Studies show that financial illit-eracy is widespread among older Americans. Generally, only a small number actually un-derstand basic financial concepts like com-pound interest rates, the effects of inflation, and the benefits of investing in a diversified portfolio rather than in one single stock1.
With the decline in defined benefit plans, future retirees can no longer depend on re-ceiving a guaranteed income in old age.
The widening gapU.S. households are accumulating enormous pension wealth. But although it is very high, most figures do not reflect the uneven distri-bution of wealth among the population. With half of the U.S. workforce participating in no form of employer-sponsored pension plan whatsoever, the accumulated pension assets are only attributable to the other half of the workforce. This means that a considerable portion of the population, those without ad-ditional pension assets, will be largely de-pendent on Social Security benefits upon re-tirement. Currently, Social Security benefits account for at least 90% of every third elderly
beneficiary income (see Figure 1). Almost 40% of workers in the private sector have no access to employer-sponsored pension plans and so are not able to build up additional pension assets at their workplaces. While the PPA focused on increasing coverage rates, it did not emphasize access, which is at the heart of broader coverage.
Furthermore, low and middle income earners are not benefiting from tax incentives, which mainly target high income earners. In fact, workers in higher tax brackets actually contribute less after-tax income to qualified pension plans than workers in lower tax brackets. In other words, the higher the tax-able income, the more potential there is for tax savings.
The U.S. government introduced the Saver’s Credit, a non-refundable tax credit rather than a tax deduction, to address this issue. Again, people paying little or no income tax do not profit. In 2005, while more than 73 million tax filers had incomes low enough to make them eligible for the Saver’s Credit, over two-thirds failed to qualify for the credit be-cause they had no federal income tax liability.
With Social Security benefits not expected to increase over the long term and replace-ment rates low, supplementary pension cov-erage will play a decisive role in retirees being able to maintain the standard of living to which they have become accustomed. The Pension Protection Act of 2006 (PPA) intro-duced features, such as auto-enrollment, to boost participation rates in existing pension plans so that a larger portion of the workforce has a chance to build up private retirement wealth. However, it does not include features that promote the introduction of new pension plans. Nearly all retirement assets are accu-mulated within employment-related pension plans. Private individual accounts are rarely
Allianz Global Investors International Pension Papers No. 3|2008
6
exploited, and IRAs are mainly used as a tool to preserve tax advantages should a contrib-utor change jobs or enter retirement. Hence, occupational pension plans are playing the most important role in accumulating retire-ment assets.
If one of the goals of pension reform is to alleviate old age poverty and the consequent burden it places on future federal budgets, then any pension reform will have to focus on finding a way to ensure that population segments with the greatest need for sources of additional retirement income get more institutional support.
This study is organized into two sections. The first section describes the demographic situation in the United States and the orga-nization of its three pillar pension system, followed by a discussion on the problems arising from declining Social Security bene-fits and the evident shift in the occupational pension landscape, namely the shift from defined benefit to defined contribution pen-
sion plans. The second section gives a broad overview of the growth in U.S. household financial assets, which has been driven by efforts to build pension entitlements. The study concludes with projections on how pension assets in the United States could develop over the next decade.
3
2.5
2
1.5
1
0.5
3.5
4
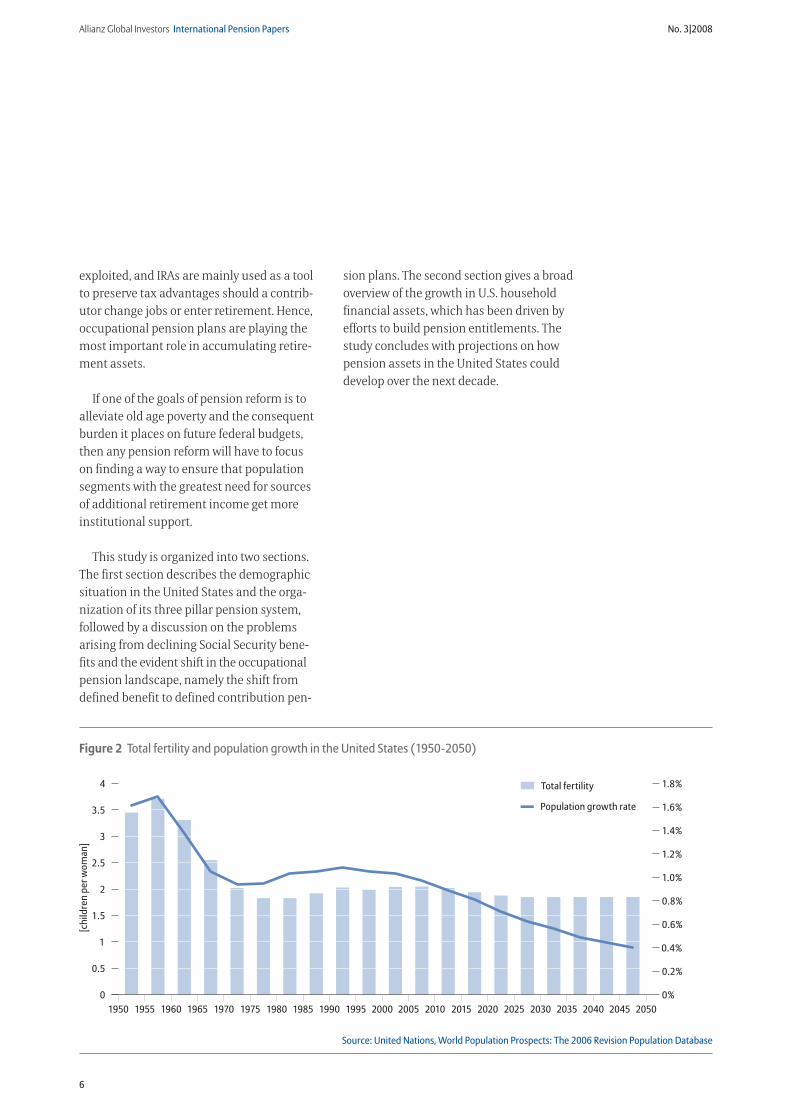
Figure 2 Total fertility and population growth in the United States (1950-2050)
1950 1955 1960 1965 1970 1975 1980 1985 1990 1995 2000 2005 2010 2015 2020 2025 2030 2035 2040 2045 2050
[chi
ldre
n pe
r wom
an]
0
1.2%
1.0%
0.8%
0.6%
0.4%
0.2%
1.4%
1.8%
1.6%
0%
Population growth rate
Total fertility
Source: United Nations, World Population Prospects: The 2006 Revision Population Database
Figure 2 Total fertility and population growth in the United States (1950-2050)
Allianz Global Investors International Pension Papers No. 3|2008
7
Pension reform in different parts of the world face distinctly different challenges,
with demography being a primary driver. Three broad groups have been identified.
The first group consists of emerging and developing countries that are either in the process of establishing formal pension sys-tems or have only done so recently*.
The second group is made up of western industrialized countries. Countries with well-established and mature pension systems, but which – due to the immense pressure from demographic change – are currently in the process of reforming their pension sys-tems towards building and strengthening funded pension. The old-age dependency ratio**, which is driven by decreasing fertility and increasing life expectancy, will worsen significantly over the next decades.
The third group consists of favorably situ-ated countries, with Australia, Canada and the United States ranking on top. Not only do their pension systems feature strong, funded pension pillars, but as traditional immigra-tion countries, they will be less affected by the coming demographic challenges. Posi-tive net immigration to the United States will keep the population growing, if at a decreas-ing rate (see Figure 2).
* For a detailed discus-
sion, see “Allianz Global
Investors, Asia-Pacific
Pensions 2007 – Systems
and Markets,” which
examines nine pension
systems and markets:
Australia, China, Hong
Kong, India, Japan,
Singapore, South Korea,
Taiwan and Thailand.
** Ratio of the number
of people over age 65
to the number of people
age 15 to 64.
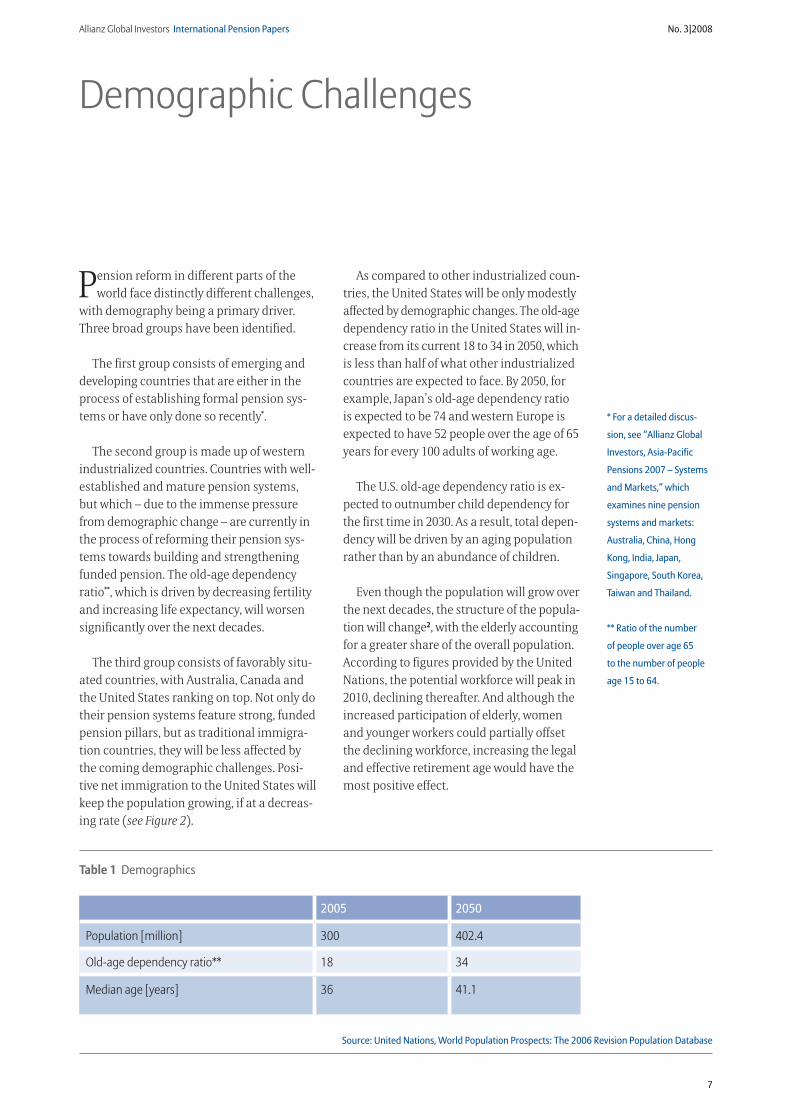
As compared to other industrialized coun-tries, the United States will be only modestly affected by demographic changes. The old-age dependency ratio in the United States will in-crease from its current 18 to 34 in 2050, which is less than half of what other industrialized countries are expected to face. By 2050, for example, Japan’s old-age dependency ratio is expected to be 74 and western Europe is expected to have 52 people over the age of 65 years for every 100 adults of working age.
The U.S. old-age dependency ratio is ex-pected to outnumber child dependency for the first time in 2030. As a result, total depen-dency will be driven by an aging population rather than by an abundance of children.
Even though the population will grow over the next decades, the structure of the popula-tion will change2, with the elderly accounting for a greater share of the overall population. According to figures provided by the United Nations, the potential workforce will peak in 2010, declining thereafter. And although the increased participation of elderly, women and younger workers could partially offset the declining workforce, increasing the legal and effective retirement age would have the most positive effect.
Demographic Challenges
2005 2050
Population [million] 300 402.4
Old-age dependency ratio** 18 34
Median age [years] 36 41.1
Source: United Nations, World Population Prospects: The 2006 Revision Population Database
Table 1 Demographics

Allianz Global Investors International Pension Papers No. 3|2008
8
The U.S. pension system is built on three pil-lars. The first pillar, Social Security, covers both employees in the private sector and the self-employed. State and local government employees are covered under state or local government pension plans, and/or Social Se-curity. Federal government employees hired prior to 1984 are covered under the Civil Ser-vice Retirement System, while those hired in 1984 or after are covered under Social Security.
Social Security is financed by employment taxes shared equally between employer and employee on a pay-as-you-go basis. Benefits are directly linked to earnings and are based on the 35 highest income years indexed to wage growth, which means that a worker’s lifetime earnings are expressed in terms of today’s wage levels. Social Security benefits replace a larger percentage of lower incomes than it does higher ones*.
On an average, the Social Security replace-ment rate is 38.5% of pre-retirement income.
* The primary insurance
amount is the sum of
three separate percentag-
es of portions of average
indexed monthly earn-
ings: (a) 90% of the first
$711 average indexed
monthly earnings plus
(b) 32% of the average
indexed monthly earn-
ings from $711 to $4,288
plus (c) 15% of average
indexed monthly earnings
over $4,288.
A progressive benefits formula assures re distribution among earnings groups. Whereas low-income earners with average career earnings of approximately $17,400 can expect to have approximately 54% of their pre-retirement earnings replaced, high-income earners with average career earnings of $86,000 can only expect to see 28% of their income replaced.
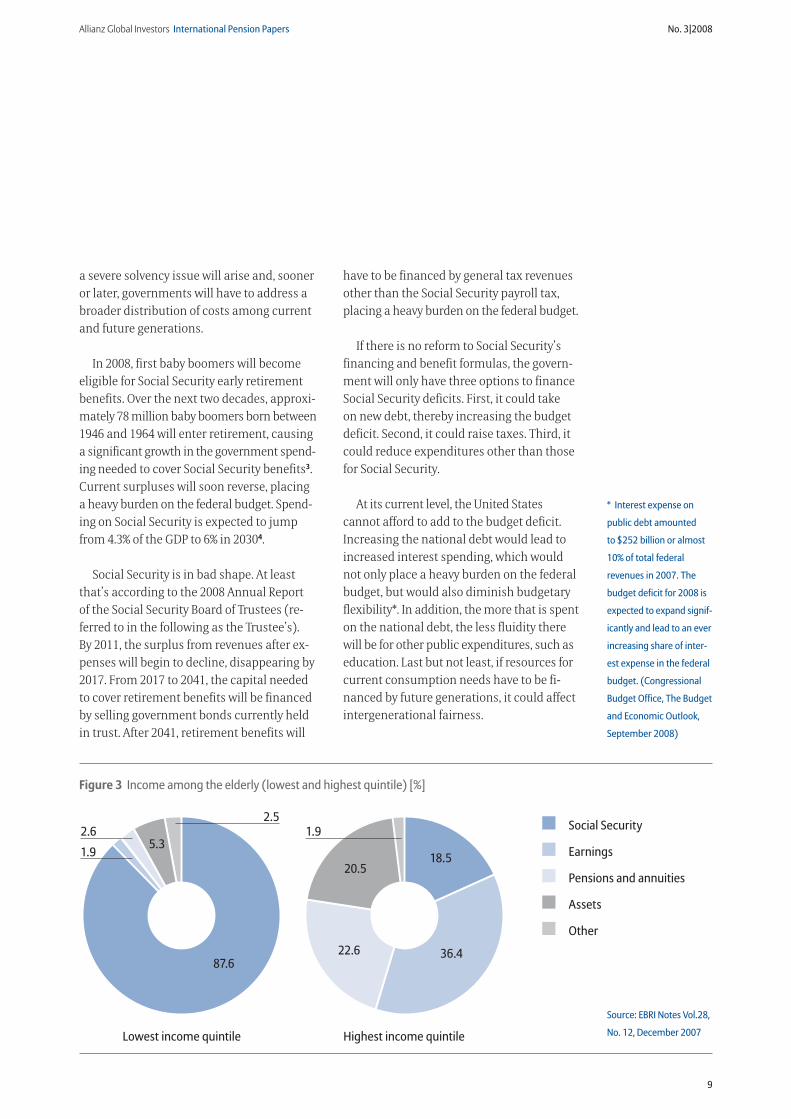
The distribution of old-age income varies considerably across income groups. Retirees in the lowest income quintile rely almost ex-clusively on Social Security, while the corre-sponding figure for the highest income quin-tile represents only 18.5% of their total income, with main contributions coming from gainful employment, pensions, annuities and assets. Pension benefits from private sources are vir-tually non-existent among low-income house-holds (see Figure 3).
With retiring baby boomers expected to deteriorate Social Security’s financing basis,
Pension System Design
Challenges for Social Security
Financing Pay-as-you-go
Social Security taxes [%] 12.4:employer 6.2employee 6.2
Contribution assessment limit [$] 102,000
Legal retirement age 66 This is scheduled to increase to 67 sometime between 2017 and 2022
Gross replacement ratio [%] 38.5
Table 2 First pillar statistics
Allianz Global Investors International Pension Papers No. 3|2008
9
a severe solvency issue will arise and, sooner or later, governments will have to address a broader distribution of costs among current and future generations.
In 2008, first baby boomers will become eligible for Social Security early retirement benefits. Over the next two decades, approxi-mately 78 million baby boomers born between 1946 and 1964 will enter retirement, causing a significant growth in the government spend-ing needed to cover Social Security benefits3. Current surpluses will soon reverse, placing a heavy burden on the federal budget. Spend-ing on Social Security is expected to jump from 4.3% of the GDP to 6% in 20304.
Social Security is in bad shape. At least that’s according to the 2008 Annual Report of the Social Security Board of Trustees (re-ferred to in the following as the Trustee’s). By 2011, the surplus from revenues after ex-penses will begin to decline, disappearing by 2017. From 2017 to 2041, the capital needed to cover retirement benefits will be financed by selling government bonds currently held in trust. After 2041, retirement benefits will
have to be financed by general tax revenues other than the Social Security payroll tax, placing a heavy burden on the federal budget.
If there is no reform to Social Security’s financing and benefit formulas, the govern-ment will only have three options to finance Social Security deficits. First, it could take on new debt, thereby increasing the budget deficit. Second, it could raise taxes. Third, it could reduce expenditures other than those for Social Security.
At its current level, the United States cannot afford to add to the budget deficit. Increasing the national debt would lead to increased interest spending, which would not only place a heavy burden on the federal budget, but would also diminish budgetary flexibility*. In addition, the more that is spent on the national debt, the less fluidity there will be for other public expenditures, such as education. Last but not least, if resources for current consumption needs have to be fi-nanced by future generations, it could affect intergenerational fairness.
* Interest expense on
public debt amounted
to $252 billion or almost
10% of total federal
revenues in 2007. The
budget deficit for 2008 is
expected to expand signif-
icantly and lead to an ever
increasing share of inter-
est expense in the federal
budget. (Congressional
Budget Office, The Budget
and Economic Outlook,
September 2008)
Social Security
Lowest income quintile Highest income quintile
Earnings
Pensions and annuities
Assets
Other
18.5
36.422.6
1.9
2.6
20.5
87.6
5.3
2.51.9
Source: EBRI Notes Vol.28,
No. 12, December 2007
Figure 3 Income among the elderly (lowest and highest quintile) [%]

Allianz Global Investors International Pension Papers No. 3|2008
10
Based on these scenarios, it would seem expedient to bring Social Security into actu-arial balance by either reducing benefits, in-creasing payroll taxes or a combination of the two. According to the Trustees, this could either be achieved by immediately increas-ing the payroll tax to 14.1%, or immediately reducing benefits by 12%. These figures, how-ever, only provide a perspective for the next
75 years. An actuarial balance for the indefi-nite future would require much greater ad-justments; either payroll taxes would have to increase to 15.6% or benefits would have to be reduced by 20%.
An aging population does not come with-out cost, even in a country only modestly af-fected by demographic changes.
Social Security Trust Fund
In recent years, public pension reserve funds that in part prefund pay-as-you-go financed public pension systems are gaining popularity in many OECD countries. In the 1980s, the U.S. government realized that the retiring baby-boomer generation (born between 1946 and 1964) would place a future financial burden on Social Security, and anticipated the fiscal challenges that would result from worsening demographics. The worker-per-beneficiary ratio will be significantly impacted when this cohort enters retirement and the number of contributors financing Social Security benefits is reduced. With 3.2 to 3.4 work-ers for every beneficiary, this ratio has been relatively stable over the last 35 years. However, over the next two decades, the large baby-boomer cohort will have almost completely retired, reducing this ratio to only 2.2 by 2030.
The Social Security tax was increased in 1983 following recommendations by the Greenspan Commission, which was formed to prevent Social Security from experiencing short-term financing crises. Since that time, cash-flow surpluses have been accumulating in the Social Security Trust Fund to meet future expenditures. These surpluses from revenues after expenses are expected to continue and accrue until 2017, afterwards expenditures will begin to exceed collected social security taxes. According to projections by the Trustees, reserves will be exhausted by 2041.
Figure 4
01983 1985 1987 1989 1991 1993 1995 1997 1999 2001 2003 2005 2007
1,500
1,000
500
2,000
2,500
Source: Social Security Administration
Figure 4 Social Security trust fund: assets under management [$ bn]
Allianz Global Investors International Pension Papers No. 3|2008
11
At the end of 2006, worldwide pension reserve fund assets totaled $4.1 trillion. Half of these can be attributed to the U.S. Social Security Trust Fund (see Figure 4), which is by far the largest pension reserve fund in the world5.
The Social Security Trust Funds were established as separate accounts in the United States Treasury to handle all financial operations of the Federal Old Age, Survivors and Disability Insurance (OASDI). Since it is included in the federal budget, Social Security is not an independent body as it is in other countries.
Surpluses are invested in non-marketable, interest-bearing government bonds exclusively issued to the trust funds. These bonds are not subject to market fluctuations and are redeemable at their face value at any time6.
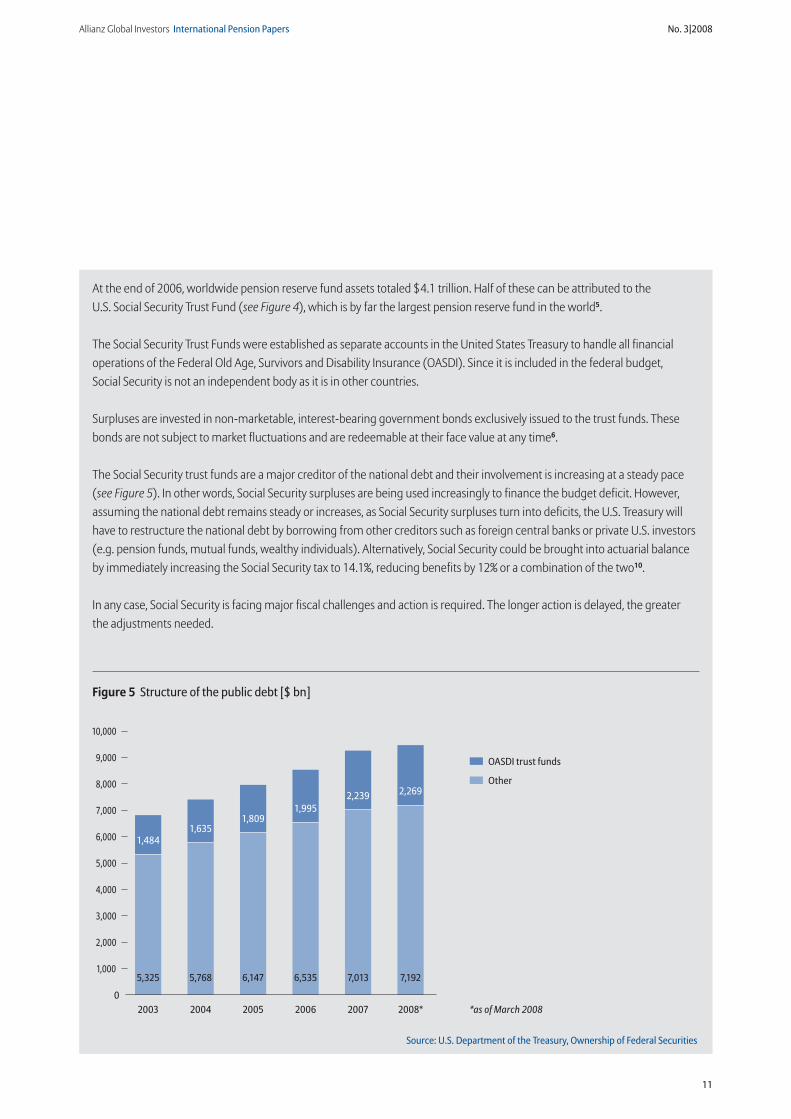
The Social Security trust funds are a major creditor of the national debt and their involvement is increasing at a steady pace (see Figure 5). In other words, Social Security surpluses are being used increasingly to finance the budget deficit. However, assuming the national debt remains steady or increases, as Social Security surpluses turn into deficits, the U.S. Treasury will have to restructure the national debt by borrowing from other creditors such as foreign central banks or private U.S. investors (e.g. pension funds, mutual funds, wealthy individuals). Alternatively, Social Security could be brought into actuarial balance by immediately increasing the Social Security tax to 14.1%, reducing benefits by 12% or a combination of the two10.
In any case, Social Security is facing major fiscal challenges and action is required. The longer action is delayed, the greater the adjustments needed.
Figure 5
0
1,484
20042003
1,635
2005
1,809
2006
1,995
2007
2,239
2008*
2,269
5,325 5,768 6,147 6,535 7,013 7,192
*as of March 2008
3,000
2,000
1,000
4,000
5,000
6,000
7,000
8,000
9,000
10,000
Other
OASDI trust funds
Source: U.S. Department of the Treasury, Ownership of Federal Securities
Figure 5 Structure of the public debt [$ bn]

Allianz Global Investors International Pension Papers No. 3|2008
12
Allianz Reform Pressure GaugeIn order to visualize the importance of pen-sion reform in a cross-national context, Allianz Dresdner Economic Research developed the Allianz Pension Reform Pressure Gauge. This indicator measures and illustrates the pres-sure on governments to reform their pension systems by consistently examining the vari-ous dimensions of pension systems, gauging the sustainability of pension systems and the resulting need for reform (see Figure 6).
How social pension systems will be able to overcome the challenges posed by aging populations varies considerably according to country. Australia is under the least pressure to reform its pension system as the system is comprehensive in nature and based on a strong funded and mandatory occupational pension pillar, namely the Superannuation Scheme. China, on the other hand, is in the most need of reform as the overall pension coverage is still poor. Japan has one of the fastest-aging populations in the world: Driven by a de-crease in the overall population, low fertility rates and a life expectancy that is among the highest in the world, Japan’s old-age depen-
dency ratio will worsen from its current 30 to 74 in 2050. These demographic develop-ments pose a major challenge to Japan’s pension system. And on continental Europe, generous pay-as-you-go financed state pen-sion systems coupled with unfavorable de-mographics are putting a strain on pension systems. To sustain their pension plans, these countries are putting real effort into strength-ening their funded occupational and private pension pillars, which will account for a larg-er share of future retirement income.
As the reform pressure gauge indicates, the United States is under moderate pressure to reform within an international context. The ratio between public pension expenditures and the GDP, its national debt, an increase in the legal retirement age and its strong fund-ed pension pillars are all factors in why the United States is relatively well-positioned in our index. Even so, second and third pillar pension coverage and the Social Security fi-nancing basis remain major concerns.
Figure 6 Allianz Reform Pressure Gauge
Australia
Sweden
United Kingdom
USA
Germany
France
Italy
Japan
China
0.00 2.00 4.00 8.006.00
Source: Allianz Dresdner
Economic Research
Figure 6 Allianz Reform Pressure Gauge [Scale from 1-10: 1 low reform pressure, 10 high reform pressure]
Technical note
The Allianz Pension
Reform Pressure Gauge
is based on a number of
individual indicators used
to recognize the need for
reform and gauge reform
progress. Indicators sug-
gesting a need for reform
include current and future
old-age dependency
ratios, size of the national
debt, replacement ratio,
public pension expendi-
tures and retirement age.
Indicators suggesting
successful reform include
increased retirement age,
the reduction of a previ-
ously high replacement
ratio, or a strengthening
of the funded system.
The lowest score indicates
the least pressure to
reform and vice versa.

Allianz Global Investors International Pension Papers No. 3|2008
13
Voluntary occupational pension plans form the second pillar of the U.S. pension system. With Social Security providing only very basic benefits, employer-sponsored pension plans are not only an important tool for retaining employees, they play a vital role in total compensation.
The Employee Retirement Income Security Act of 1974 (ERISA) defined minimum legal standards for most voluntarily established pension plans in the private industry so as to provide supplementary old-age protection. ERISA provides rules on reporting and disclo-sure, participation and vesting, funding, fi-duciary responsibility, administration and enforcement.
The Pension Protection Act of 2006 (PPA) introduced the most sweeping changes to oc-cupational pension plans since 1974. Though its key regulations are mostly geared towards changing the funding of defined benefit pen-sion plans, it is having a significant impact on the design and operation of defined con-tribution plans as well.
> Second pillar participation 61% of the workforce in private industry has access to work-based pension plans, howev-er only 51% actually participate. Defined con-tribution plans dominate the occupational pension landscape, covering 43% of the work-force. By contrast, only 20% of the private sector workforce is covered by defined benefit plans. All in all, however, 51% of the total work-force is participating in some type of pension plan (this figure is lower because some em-ployees participate in both types of plans).
> Types of plansThere is a wide variety of defined benefit (DB) and defined contribution (DC) pension plans
available, the latter being the most popular. DC plans dominate the private sector in terms of active participants, number of plans available and amount of assets under management8. In DC plans, each employee has an individual account into which he can make tax-deferred contributions.
The most popular DC plan is the 401(k), named after the relevant paragraph in the Internal Revenue Code. Soon after its intro-duction in 1981, the 401(k) enjoyed great popularity and, with a share of approximate-ly 70% of all DC assets, is the prevailing occu-pational pension plan today. The 401(k) is a tax-qualified deferred-compensation plan by which pre-tax contributions from employee bonuses, regular wages and salaries are in-vested into employer-offered investment op-tions. Regulation requires that the employer offer at least three investment options with differing risk and return profiles. Should an employee not select an option, investments are made into the employer’s default option.
Money purchase and profit-sharing plans are two more types of DC plans. In money purchase plans, employers make a defined fixed contribution. In profit-sharing plans, employer contributions are discretionary. Though usually linked to profitability, they are not limited to profits. Profit-sharing plans give employers greater flexibility in contrib-uting to employee pension accounts and have gained a larger portion of the market share over money purchase plans, which are decreasing in popularity. Employee contri-butions are not permitted under the profit-sharing plan unless the plan includes a 401(k) plan feature.
403(b) plans, 457 plans and the Federal Thrift Savings Plan are DC plans designed for
Occupational pensions
Allianz Global Investors International Pension Papers No. 3|2008
14
specific employee groups, i.e. employees of (a) universities, public schools and non-profit organizations, (b) state and local gov-ernments, and (c) the federal government.
Another DC plan is the SIMPLE IRA, which offers small employers an inexpensive alter-native in terms of maintenance and admin-istration costs to contribute to their own and their employees retirements accounts. This plan calls for employers to either contribute a fixed percentage of all eligible employees’ compensation or make matching contribu-tions. These plans do not have the same start-up and operation costs as conventional work-based retirement plans and contributions can be higher as compared to traditional IRAs. SIMPLE IRAs are restricted to employers who have no more than 100 employees; its assets are controlled solely by the employee. Trustees of SIMPLE IRAs are generally banks, insurance companies, mutual funds and other approved financial institutions.
Employer-sponsored IRAs play only a minor role in pension provision. According to estimates from the Investment Company Institute, total assets under management amounted to $286 billion in 2007.
Legally speaking, a defined benefit plan is any pension plan that is not a defined con-tribution plan, i.e. does not have individual accounts. The benefits provided by defined benefit plans are typically based on final or average-career earnings and are not depen-dent on asset returns. As compared to de-fined contribution schemes, employers are able to make larger contributions, thereby providing substantial benefits.
By its very definition, DB plans include such hybrids as Cash Balance and Pension Equity Plans (PEP). Hybrid retirement plans combine the features of defined benefit and defined
contribution plans. Promised benefits are based on a hypothetical account balance, with risk and rewards born by the employer.
> Rollovers Should an employee terminate or change employment, he is entitled to transfer his accumulated pension assets to another em ployer pension plan and IRA. In order to avoid penalties, this transfer must take place within 60 days. If not, assets are subject to a 10% early-distribution tax above the regu-lar income tax, which generally applies to pension benefits that accrued from pre-tax contributions.
> Tax treatment of contributions and benefitsPre-tax contributions to qualified DC pension plans are subject to certain limits. For 2008, the total maximum deferral, including employer and employee contributions, cannot exceed 100% compensation with a $46,000 maximum. The maximum employee salary deferral is restricted to $15,500 with a $5,000 catch-up contribution for people aged 50 and older. Any dividends and capital gains accrued in the ac-counts are tax deferred, subject to tax ation only upon withdrawal. In general, the EET* system applies to qualified pension plans.
Whereas tax-deferred employee contri-butions are vested immediately, depending on the configuration of the specific pension plan, voluntary employer contribution vestment is usually linked to a certain period of service.
Most 401(k) plans give retiring employees several options for distributing their account balances, for instance lump-sum payments or set installment payments over a fixed number of months. In addition, it is possible to defer distribution until a certain age. Federal law stipulates that retirement payments cannot be made before age 59.5, but no later than age 70.5, with payments based on the account
* EET refers to tax treat-
ment during accumulation
and decumulation and
applies to contributions,
capital gains & interest
and benefits: (E) tax
exempt, (T) taxed.

Allianz Global Investors International Pension Papers No. 3|2008
15
balance divided by the retiree’s remaining life-expectancy.
As of 2006, U.S. employees can opt to trans-fer part or all of their contributions to a 401(k)-type Roth account. Since Roth contributions are taken from net rather than pre-tax in come, they do not qualify as tax relief. However, as opposed to traditional 401(k) plans, invest-ment returns and benefits are tax-free. Bene-fits from Roth accounts are excluded from gross income and the TEE system applies. Another characteristic of traditional 401(k) plans that does not apply to Roth 401(k) plans is that retirees have complete freedom to de-cide when they want to withdraw accumulat-ed assets. Since traditional accounts impose specific age limits when assets can or have to be withdrawn, this constitutes a major depar-ture, particularly should assets be withdrawn.
Pension Protection Act 2006Signed into law in August 2006, the Pension Protection Act 2006 (PPA) is the most far-reaching pension legislation introduced in the U.S. since ERISA in 1974. The new provisions mainly enhance the protection of accrued pension rights for pension plan members.
New regulations introduced under PPA apply to both defined benefit and defined con-tribution plans. The most important regulations implemented concerning defined benefit plans are: new funding standards, rules governing the valuation of plan assets and liabilities with at-market rates, and special rules for at-risk plans. Pension plan sponsors now also face stricter funding rules. Full funding of pension promises was not previously required; howev-er, the new legislation made this compulsory, although a transition period of seven years was allowed.
In terms of defined contribution pension plans, the PPA cleared the way for automatic
enrollment into employer pension plans and improved disclosure standards. It also con-firmed higher contribution limits to IRAs and 401(k)s, which had been temporarily allowed since 2001. The PPA made the enhancements introduced by the Economic Growth and Tax Relief Reconciliation Act (EGTRRA), enacted in 2001, permanent.
Automatic enrollment already existed before the PPA came into force, however, adoption re-mained low as plan sponsors were potentially liable for investment losses incurred in default investment options. Employees were automat-ically enrolled in the default investment option if they did not actively choose an investment alternative. As participation in em ployer-sponsored retirement plans was seen as insuf-ficient, the PPA 2006 removed some of the bar-riers that previously prevented the application of automatic enrollment.
Under the legislation, a plan fiduciary will be exempted from liability for investment loss-es if he complies with the final regulations issued by the Department of Labor (DOL) at the end of 2007. According to these regula-tions, fiduciary protection requires that auto-matic enrollment contributions be invested in investment options that qualify as so-called Qualified Default Investment Alternatives (QDIA). QDIAs have to apply defined mecha-nisms for investing participant contributions.
Basically, the product’s asset mix must take certain characteristics, such as age and retirement age of an individual or a group, into account. Life-cycle funds, balanced funds and professionally managed accounts are examples that match these requirements. QDIAs must also be offered through variable annuity contracts or pooled investment funds. Furthermore, certain reporting requirements exist. Participants must be informed when they become eligible for pension plan partic-

Allianz Global Investors International Pension Papers No. 3|2008
16
Types of Individual Retirement Options (simplified)
Individual Retirement Account
Individual Retirement Annuity
Variable annuity Fixed annuity
Investment options Includes practically the whole spectrum of investment options. Actual selection depends on the IRA provider. A few restrictions apply to less liquid invest-ments, e.g. collectibles and antiques.
The contract owner choos-es from a pre-selected list of investment options.
No investment choice
Investment manager Account holder Contract owner Insurance company
Distribution method Either lump-sum payment or systematic withdrawal plan
Annuitization plan; discretionary and system-atic withdrawal plans
Annuitization plan
Risk guaranty None Optional Longevity
Return guaranty None Optional Minimum guaranteed interest
Source: Allianz Global Investors
Table 3 Simplified overview of individual retirement options
of contribution amounts. Pension plans that make use of such a schedule qualify as Qual-ified Automatic Contribution Arrangements (QACA), which provide certain advantages for the employer. Generally, employers have to perform non-discrimination tests in order to operate a qualified pension plan. The pur-pose of these tests is to ensure that highly compensated employees are not advantaged as opposed to other employees. Operating a QACA relieves plan sponsors from these tests.
The legislator dictates minimum contri-bution levels for QACAs. The initial employee contribution needs to start with at least 3% but not more than 10% of income and has to
ipation. In cases where no investment option was selected by the employee, the employer must provide notification ahead of time before investing automatic contributions in the QDIA. Pension plan members must also be provided with a notice on the investment performance and a description of the QDIA on an annual basis. The fiduciary must also inform the employee on a regular basis of the investment alternatives provided by the plan and his right to direct investments.
In addition, the employer may adopt a con-tribution schedule that applies a minimum set of automatic employee contribution lev-els and an annual increase in the percentage

Allianz Global Investors International Pension Papers No. 3|2008
17
In addition to work-based retirement plans, employees can deposit tax-advantaged retire-ment savings into an Individual Retirement Account (IRA); a wide range of IRA types are available (see Table 3). IRAs were introduced to offer people without access to workplace pension plans the possibility of accruing tax-favored pension savings. In terms of assets under management, these plans have devel-oped into the preferred pension vehicle. IRAs play an important role, accounting for slight-ly more than one quarter of all pension assets in the market. Their dominance, however, is not primarily from the collection of regular contributions; IRAs are widely used as a roll-over tool for depositing lump-sum payments from defined contribution plans distributed when a job has changed or upon retirement. A rollover is a tax-neutral procedure whereby accumulated pension assets are transferred from one retirement plan to another. IRAs have made it possible for a highly mobile workforce to pool assets into one vehicle instead of being subjected to a number of fractionary claims from several employer pension plans. Since an IRA is a trust or cus-todial account, its trustee must be a bank, federally insured credit union, savings and loan association, life insurance company, or another entity approved by the Internal Revenue Service.
> Tax treatment of contributions and benefitsThough U.S. law does not govern the total number of accounts a person may hold (multiple traditional accounts or a combi-
nation of traditional and Roth accounts are common), it does restrict total annual IRA contributions.
In 2008, the maximum permitted tax- favored contribution is 100% compensation restricted to $5,000, with a $1,000 catch-up contribution for persons aged 50 and over. These figures are reduced for employees who are also covered by an occupational pension plan. Should earnings exceed a specified amount, the tax advantages of IRA contribu-tions cease.
IRA assets may not be withdrawn before age 59.5 and minimum distributions must begin no later than age 70.5. Any withdrawal prior to age 59.5 is subject to a 10% penalty tax. If mandatory minimum distributions are not taken by age 70.5, a 50% tax is imposed on any accumulation on the amount that should have been withdrawn. The result of a survey shows that people tend to postpone making withdrawals from their IRAs until they are re-quired to do so by law9. IRA withdrawals are much less frequent in households under age 70. Distributions from traditional IRAs are taxed as ordinary income.
As with 401(k) plans, IRAs can be used for Roth contributions, with employees deciding whether they want to put part or all of their contributions into a Roth IRA. Since Roth con-tributions are taken from net rather than pre-tax income, they do not qualify as tax relief. Payments drawn, however, are tax free.
Private pensions
increase in the years that follow. The contri-bution rate is required to be increased to at least 6% in the 4th year. Under a QACA, the employer has to match employee contribu-tions up to 3.5% or make non-elective contri-
butions of 3% of pay for all eligible employees irrespective if the employee is contributing to the plan. In addition, the vesting period for employer contributions is only two years.
Allianz Global Investors International Pension Papers No. 3|2008
18
The retirement landscape is in transition. Employers are steadily pulling out of tra-
ditional defined benefit plans, which guaran-tee pension benefits either on a final pay or average career basis, in favor of more flexible, less costly pension solutions.
The growth of defined benefit plans peaked during the economic boom of the 1950s and 1960s. In 1974, as a response to major failures in corporate pension plans, the Employee Retirement Income Security Act (ERISA) became the first comprehensive piece of federal legislation to mandate the promotion of employee and beneficiary in-terests in employer-sponsored pension plans. The closing of the Studebaker automotive plant and associated loss of accrued pension rights of thousands of former workers is gen-erally regarded as the key event behind the move towards stricter regulation to prevent inadequate funding.
The Pension Protection Act (PPA) followed in 2006. Once again, high-profile pension ter-minations resulting from serious underfund-ing required further regulation*. The Pension Benefit Guarantee Corporation (PBGC), which is the federal corporation established in 1974 by ERISA to protect the pension benefits of employees in private-sector defined benefit plans, faced serious financing problems as a consequence of the terminated plans. By the end of fiscal-year 2004, total underfunding of the insured plans was estimated to be more than $450 billion on a termination basis (or rather pension liabilities if the plan was taken over immediately by PBGC)10. The PPA intro-duced new funding standards applicable to defined benefit plans aimed at governing the valuation of plan assets and liabilities with at-market rates and special rules for at-risk plans.
* United Airline was the
largest pension failure in
American history. Other
examples can mostly be
found among U.S. airlines
and steel companies
such as US Airways and
Bethlehem Steel.
The stock market downturn of 2002 saw asset prices and interest falling at historic proportions and sponsors of defined benefit pension plans saw a decline in their plans’ funding status. These developments had a lasting impact on the financial situation of many pension plans. The stricter funding and accounting principles introduced by the PPA further increased costs to employers, who would now have to fully fund their plans over a seven year period, and the new valua-tion standards for liabilities increased the volatility of employer contributions.
These developments have led to an accel-erated shift towards reducing the generosity of traditional defined benefit plans. Lessons learned from the momentous falling asset prices and interest rates have required pen-sion plan sponsors to better control and determine current and future pension costs and reduce the volatility of their liabilities. Pension plan sponsors today are continuing to freeze existing DB plans, at least for new employees, opting instead for hybrid or de-fined contribution pension solutions.
The decrease in guaranteed pension in-comes is evident and three trends have been identified. Firstly, Social Security benefits will clearly be less generous in the future than they are today. Secondly, since the shift from defined benefit towards defined contribution pension plans is not expected to reverse, em-ployees will carry most of the risks associat-ed with capital markets and longevity. And thirdly, there has been a structural shift from company pension plans towards individual pension plans such as IRAs. In terms of assets under management, IRAs held a 26% market share of total pension assets in 2007, outnum-bering defined contribution, public pension and defined benefit plans for the first time. They now form the front line of all available pension plans.
The Great Shift

Allianz Global Investors International Pension Papers No. 3|2008
19
The developments outlined above have had a decided impact on how risks are allocated. In DB plans, factors like life expectancy, sav-ings rates, capital market development and inflation were managed by employers, who were able to hedge these risks over a larger group. The shift towards hybrid and DC plans means individuals will now be forced to carry this responsibility.
The road to financially security for those golden years is now paved by two major risks arising from the shift from defined benefit to defined contribution plans.
The first hurdle is actually participating in an employment-related pension plan. As opposed to defined benefit plans, most defined contribution plans operate on a vol-untary basis. This voluntary participation is considered to be the main reason behind the low coverage of workplace pension plans. The PPA will tackle employee inertia by intro-ducing auto enrollment, however take-up remains to be seen as this legislation was only introduced in 2008.
According to a research report by Fidelity Investments, which analyzed the data of more than 10 million participants in Fidelity-administered pension plans, participation
rates rose significantly above average in auto-enrollment plans, especially among low-income earners and younger employees. The default deferral rate for more than half of these plans was only 3%11. These findings support the assumption that average contri-bution rates have a tendency to decrease if a default rate exists, even though much higher contribution rates would be necessary.
Auto-enrollment is likely to have a signifi-cant impact on retirement wealth by gener-ating additional retirement savings. Whether these assets will be sufficient to arrive at an adequate replacement will depend on a number of factors such as continuous par-ticipation and the proper diversification of assets.
The second hurdle to financial security is distributing pension wealth prudently. Securing an adequate standard of living in retirement will mean going a step beyond mere accumulation. The 401(k) plan has become the primary vehicle of retirement savings. Large pools of assets accumulated in 401(k) accounts only allow for lump-sum payments at the end of the working life. An-nuities are rarely offered as an alternative distribution method.
Recent research from Hewitt Associates12 further quantifies the shift from defined ben-efit to defined contribution pension plans and its consequences as previously described. Based on a representative sample of 72 large U.S. companies with 1.8 million employees, Hewitt studied the impact of pension plan types, participation, contribution rates, invest-ment returns and medical costs on expected replacement ratios.
Employees expecting to receive benefits from both defined benefit and defined contri-bution plans will likely have 106% of their pre-retirement income replaced by combined Social Security and workplace pension plans. All things being equal, employees participat-ing only in a defined contribution plan will see a replacement ratio of 77.6%. However, if these replacement ratios are contrasted with the actual income needed to keep pace with
Quantifying the shift

Allianz Global Investors International Pension Papers No. 3|2008
20
inflation, rising longevity and increased med-ical costs, the report’s authors point out that both plans fall short of an adequate retire-ment income, even in the best-case scenario of combined DB-DC coverage. They estimate that the average income gap for employees with “DC only” will be 33 percentage points higher than for those with access to both types of plans. What is more, the authors question the general belief that a replacement ratio of 70-90% of pre-retirement income would be sufficient. The study population showed that an average projected income replacement of 126% of final pay would be necessary to cover post-retirement inflation and increasing medical costs.
These findings demonstrate how even em-ployees with good coverage will have to lower their standard of living during retirement. The situation will be significantly worse for employees who don’t contribute to a work-
place or private pension plans and who opt for early retirement. Compared to an assumed adequate income, they are ex-pected to fall short by more than 104% of pre-retirement income.
The authors conclude that 401(k) plans have yet to fill the gap created by the loss of defined benefit pension plans, and draw a bleak outlook for future retirees.
There are two key factors that fundamen-tally contribute to achieving an adequate retirement income. The first and most im-portant is consistently putting savings into workplace or private pension plans over the entire course of the working life so as to take advantage of lower savings rates and to ex-ploit compound interest. The second key factor is choosing a sound investment. Diver-sification is key. A portfolio broadly consist-ing of employer stocks or over-conservative
Figure7
0
8
20012000
12
2002
15
2003
26
2004 2005
44
71
2006
113
2007
183
60
40
20
80
100
120
140
160
180
200
IRAs
Other
DC plans
Source: Investment Company Institute, The U.S. Retirement Market 2007, 2008
Figure 7 Life-cycle fund assets by investor type [$ bn]

Allianz Global Investors International Pension Papers No. 3|2008
21
investments is not considered to be an efficient risk-return approach. According to modern finance theory, optimal asset allo-cation takes into account certain individual characteristics such as age, life expectancy and target retirement date. In life-cycle funds, which are now an accepted default options for employer-sponsored retirement plans,
the asset allocation of the retirement port-folio can be tailored to suit individual needs.
Life-cycle funds have become increasingly popular over the last years and are expected to continue flourishing. 88% of life-cycle funds are held in employer-sponsored DC plans and IRAs (see Figure 7).
Since Social Security benefits in the United States are low, the individual is responsible for providing for his own old age. A wide range of tax-favored retirement products are avail-able and, compared internationally, contri-bution limits are considered to be above average. The U.S. pension market is the most developed worldwide and its product land-scape is very complex. Retirement planning usually involves consulting financial advi-sors who are either independent or tied to a specific firm. There has been an observable shift towards seeking independent advice13.
With total pension assets of $17.3 trillion at year-end 2007, it is clear that U.S. house-holds have accumulated immense pension wealth. However, despite the magnitude of these pension assets and maturity of the retirement market, adequate retirement in-come is exposed to risks throughout the life cycle. Risks range from insufficient asset ac-cumulation to pre-retirement misuse as a result of financial hardship, as well as risks from unsustainable retirement spending and distributions due to increased longevity and health-care costs aggravated by medical inflation.
> Coverage still not properly addressedSupplying employees with pension plans is considered the most critical aspect of secur-ing adequate retirement income. Or to put it
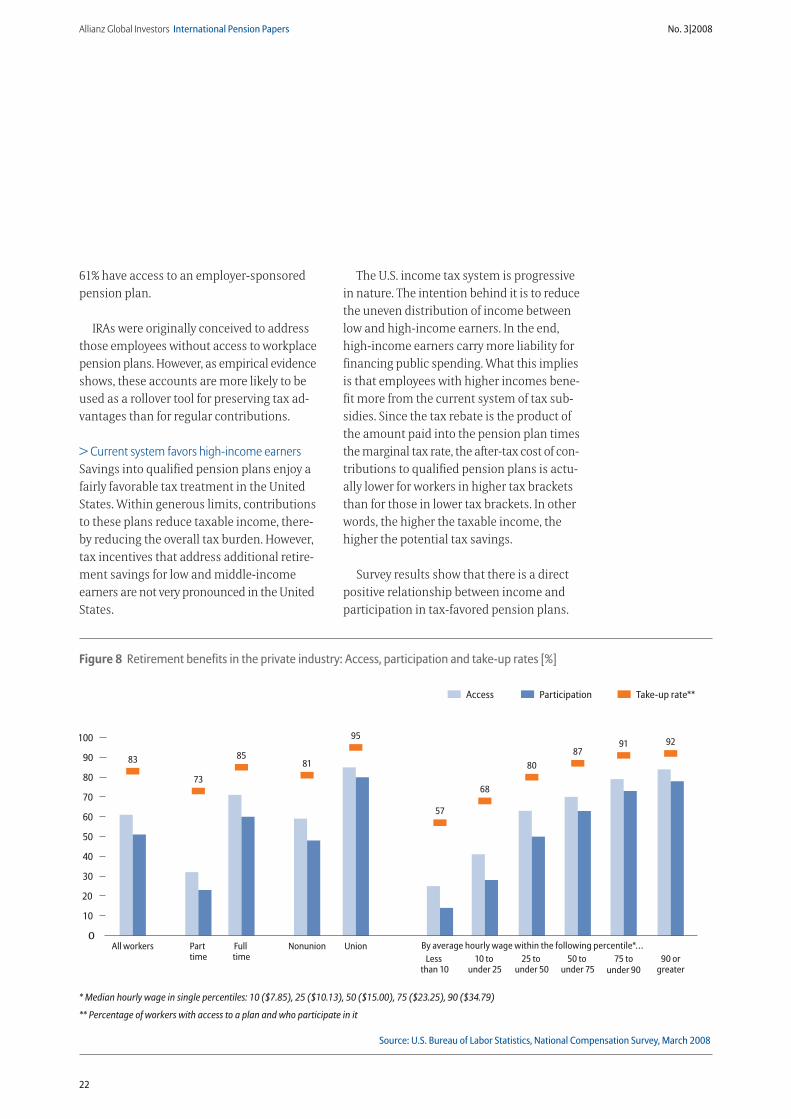
another way, the greatest source of risk is not having access to a pension plan at work, be it a defined benefit or a defined contribution plan. In fact, take-up rates are high when em-ployees have access to a pension plan in the workplace (see Figure 8). In private industry, 83% of employees with access to an occupa-tional pension plan actually participate. This figure becomes even higher when part-time employees are not considered. The take-up rate among full-time union employees is 95%, or almost complete coverage. In general, the higher the income, the higher are take-up rates, hence there is a positive correlation. What is surprising, however, is that the take-up rate of the lowest percentile of incomes earners, those with a median hourly wage of $7.85, is still at 57%.
Though the goal of the Pension Protection Act of 2006 is to increase coverage rates, it does not place much emphasis on the ques-tion of access, which is the foundation of broader coverage. Automatic enrollment is expected to boost participation in existing oc-cupational pension plans, but it does nothing to encourage the introduction of new pension plans. Enhancing occupational pension cover-age is limited by the total number of employ-ers currently providing pension plans, under-mining the very goal of enhancing employee pension coverage. After all, coverage cannot exceed 61% of the workforce so long as only
Five main risks
Allianz Global Investors International Pension Papers No. 3|2008
22
61% have access to an employer-sponsored pension plan.
IRAs were originally conceived to address those employees without access to workplace pension plans. However, as empirical evidence shows, these accounts are more likely to be used as a rollover tool for preserving tax ad-vantages than for regular contributions.
> Current system favors high-income earnersSavings into qualified pension plans enjoy a fairly favorable tax treatment in the United States. Within generous limits, contributions to these plans reduce taxable income, there-by reducing the overall tax burden. However, tax incentives that address additional retire-ment savings for low and middle-income earners are not very pronounced in the United States.
The U.S. income tax system is progressive in nature. The intention behind it is to reduce the uneven distribution of income between low and high-income earners. In the end, high-income earners carry more liability for financing public spending. What this implies is that employees with higher incomes bene-fit more from the current system of tax sub-sidies. Since the tax rebate is the product of the amount paid into the pension plan times the marginal tax rate, the after-tax cost of con-tributions to qualified pension plans is actu-ally lower for workers in higher tax brackets than for those in lower tax brackets. In other words, the higher the taxable income, the higher the potential tax savings.
Survey results show that there is a direct positive relationship between income and participation in tax-favored pension plans.
70
60
50
40
30
20
10
80
100
90
By average hourly wage within the following percentile*…
Participation Take-up rate**Access
All workers
83
Union
95
Nonunion
81
Part time
73
Full time
85
Less than 10
57
10 to under 25
68
25 to under 50
80
50 to under 75
87
75 tounder 90
91
90 orgreater
92
0
Source: U.S. Bureau of Labor Statistics, National Compensation Survey, March 2008
* Median hourly wage in single percentiles: 10 ($7.85), 25 ($10.13), 50 ($15.00), 75 ($23.25), 90 ($34.79)
** Percentage of workers with access to a plan and who participate in it
Figure 8 Retirement benefits in the private industry: Access, participation and take-up rates [%]
Allianz Global Investors International Pension Papers No. 3|2008
23
What is more, low-income workers are more likely to work for small firms, which are less likely to offer a pension plan at work14.
The system of tax subsidies described has not been very effective in increasing retirement savings among lower and middle-income pop-ulation groups. Tax incentives are not really suited to employees who are paying no or only marginal income tax, even though these very same low-income families are in greater need of retirement savings simply to finance their basic needs.
To address these problems, the U.S. gov-ernment established the Saver’s Credit as part of the Economic Growth and Tax Relief Reconciliation Act (EGTRRA) of 2001. The Saver’s Credit is a tax credit on savings paid into an IRA, 401(k) or other qualified retire-ment plan for individuals whose modified adjusted gross income does not exceed $26,500 per year. Pension contributions up to $2,000 are eligible, with the government matching 10% to 50% depending on the in- dividual’s adjusted gross income. However, the tax credit cannot be more than taxes owed. The Saver’s Credit is non-refundable, meaning that an employee will not receive a refund if he does not owe any taxes.
Again, a key drawback of the Saver’s Credit is that it is not applicable to anyone earning too little to take advantage of a tax credit. Even should a worker qualify for a tax credit, he would not be able to benefit from a Saver’s Credit unless he actually owes income tax. Though millions of U.S. employees are eligible for the Saver’s Credit in theory, the de facto reality is that most do not benefit due to the non-refund clause.
In 2007, tax expenditures attributable to the Saver’s Credit were estimated at $0.830 billion from a total of the almost $134 billion
connected to total retirement savings15. The need to address low-income families as a group is obvious by the sheer number of tax filers, namely more than 72 million, who re-ported incomes low enough to qualify for the 50% credit rate.
In conclusion, incentives to encourage low and middle-income earners to contrib-ute to retirement savings are not particularly pronounced in the United States even though additional retirement savings from this pop-ulation segment would actually increase over-all savings. Since high-income earners are more likely to shift existing assets from tax-able accounts to tax-favored retirement ac-counts, they cannot actually be seen as con-tributing to an increase in overall savings.
> Rising health-care costsWith health-care costs increasing faster than general inflation and wages, there is a danger of medical inflation eroding the financial basis of retirement and posing a threat to many retirees’ nest eggs.
Health-care expenditures in the United States amounted to $2.1 trillion in 2006 (16% of the GDP) and are estimated to skyrocket to $4.3 trillion (19.5% of the GDP) by 2017. According to these figures, the United States spent more on health than any other industri-alized country, both in per-capita terms and in relation to the GDP.
Employer spending on health benefits amounted to $624 billion in 2006 – the highest percentage increase of all benefits (see Figure 9). Whereas the percentage of total benefit spending assigned to retirement benefit costs has decreased slightly over the past years to around 46%, health-care spending is expected to take the lead position. Health care is current-ly a major topic of concern. With health bene-fits becoming ever more prized, the demand

Allianz Global Investors International Pension Papers No. 3|2008
24
for employer-sponsored health care is increas-ing over occupational pension coverage. If this trend continues, health care may eventually crowd out voluntary employer contributions to existing pension plans. According to the Em-ployee Benefits Research Institute (EBRI), only 15% of employees rank pension plans among their first or second benefit priority, while 80% rank health insurance is their top priority.
Should the U.S. government decide to man-date health-care coverage so that employees are required to enroll in a qualified health plan with no possibility of opting out, health bene-fits could soon be at the top of the employee benefits list, crowding out employer spending on employee retirement benefits. What is more, employers are increasingly backing away from subsidizing post-retirement medical coverage, which means that future retirees will have to use much more of their retirement income to pay for private health-care insurance premiums.
The structure of the current health-care system is very fragmented; a universal system does not exist. The system is made up of a mixture of private and public funding, with private out-of-the pocket payments account-ing for 14.6% of all personal health expendi-tures in 2006.
> Hardship withdrawalsAnother critical issue is that qualified retire-ment plans include an option for taking fi-nancial hardship distributions. Individual pension plans can define circumstances under which employees may withdraw money from their accounts. The Internal Revenue Service defines hardship as an immediate and heavy financial need of the employee, stating that the amount necessary must satisfy the finan-cial need. Certain medical expenses, costs re-lated to the purchase of a principal residence, payments necessary to prevent eviction from a principal residence, tuition and related edu-cational expenses, among others, are consid-ered immediate and heavy.
Figure 9 NEU
0
600
400
200
800
1,000
1,200
1,400
1,600
23.7
1960
65.6
1970
1,420.8
2006
44%
10%
12%
21%
13%
952.6
2000
42%
10%
12%
24%
12%
582.7
1990
36%
13%
16%
24%
11%
273.7
1980
36%13%
16%24%
11%
Public Pension Plans
Privat Pension Plans:DB, DC combined
Health
Other*
OASDI
Source: EBRI Databook on Employee Benefits, 2007
Figure 9 Employer outlays for health, retirement and other benefits [$ bn]
*Includes unemployment insurance, group life insurance and workers compensation

Allianz Global Investors International Pension Papers No. 3|2008
25
These distributions are included in gross income and are not repaid to the plan, re-ducing pension account balances in one fell swoop. In the face of the current subprime mortgage crisis, a large number of home-owners or mortgage owners may feel com-pelled to make precisely this move, which would have negative consequences on retire-ment income adequacy.
> Distributing pension wealthThe sustainable spending of accrued pension assets is at least as important as asset accu-mulation in securing an adequate retirement income. However, the differing needs among income and wealth groups may cause decu-mulation strategies to vary significantly (see Figure 10).
Retirees in the lowest income quintile are heavily dependent on Social Security, with only slightly more than 10% of their income coming from other sources. On the other hand, more affluent households draw the bulk of their income from earnings, pensions, annu-ities and asset income, making them less de-
pendent on Social Security16. There is a pro-nounced difference in decumulation strate-gies according to income status. Whereas low and middle-income households require pro-tection against longevity and are in more need of protecting themselves financially, affluent households demand decumulation strategies that are more focused on liquidity and bequest motives.
With the shift from DB to DC, and its ac-companying shift away from guaranteed pension income, financial service providers will be increasingly required to factor in that shift by offering outcome-oriented retirement solutions that replicate defined benefit char-acteristics. Retirement planning requires making decisions based on various factors that may overstretch the capabilities of most individuals. Customized financial products could restore some of the security previously built into employer-sponsored defined bene-fit plans.
Retirees in the United States are confronted by the multiple payout options being offered
Source: Allianz Global Investors
Figure 10 Demand for decumulation products are dependent on the retiree’s income and financial situation
Less affluent / low income earners
High net worth / high income individuals
Affluent individuals / middle class
Incr
easin
g lo
ngev
ity p
rote
ctio
n
Incr
easin
g liq
uidi
ty n
eed
Increasing income and wealth
Allianz Global Investors International Pension Papers No. 3|2008
26
by their qualified retirement plans. The shift from defined benefit to defined contribution plans connotes a shift from a guaranteed life-long income stream to lump-sum payments, which is the prevailing distribution method for 401(k) plans. The retiree generally has three options for turning a lump-sum payment in to a regular income stream: Retirees can with-draw their assets on a discretionary basis, use tools commonly offered by financial compa-nies to create an individual withdrawal plan based on a defined set of parameters, or buy an annuity.
Traditional annuities, either immediate or deferred, cover the longevity risk of the indi-vidual, thereby eliminating the risk of running out of money over the course of retirement. Annuity performance can either be guaran-teed or market-related. Within this broad classification, there are a great variety of rid-ers available for adjusting the product to suit individual and specific needs. Such riders in-clude guaranteed minimum death benefits to heirs, guaranteed minimum living benefits and long-term care protection. In their pur-est form, variable annuities pose a particular risk of endangering underlying assets with-
out protecting the principal. An optional guaranteed minimum living benefit can ei-ther guarantee a certain amount of income benefit (GMIB), withdrawal amount (GMAB) or minimum withdrawal benefit (GMWB). All these options are at the expense of in-vestment performance.
Annuities have become very popular over the last years, accounting for 10% of the total retirement market*. Over the next two de-cades, the retiring baby-boomer generation will drive annuity growth. As retirement in-come planning continues to target this large cohort, product innovations supporting an-nuitization and guaranteeing benefits will directly target baby-boomers concerned about maintaining an adequate standard of living17. Annuities are particularly popular among middle and low-income families, with two-thirds of non-qualified annuity holders having moderate household incomes below $75,00018.
By and large, the shift from defined bene fit to defined contribution means individuals will have to come up with their own assumptions about consumption patterns during retirement,
* This figure does not
include annuities held by
IRAs and qualified pen-
sion plans, which means
that their market share
may be higher.
Baby boomers are less prepared
Over the next two decades, around 78 million baby boomers will enter retirement19. As a whole, they are the wealthiest co- hort ever in U.S. history, despite low savings and heavy debt. This cohort profited exceptionally from capital gains on financial assets and real estate as a source of wealth accumulation. From 1985 to 2005, almost 70% of the increase in household net worth could be attributed to capital gains20.
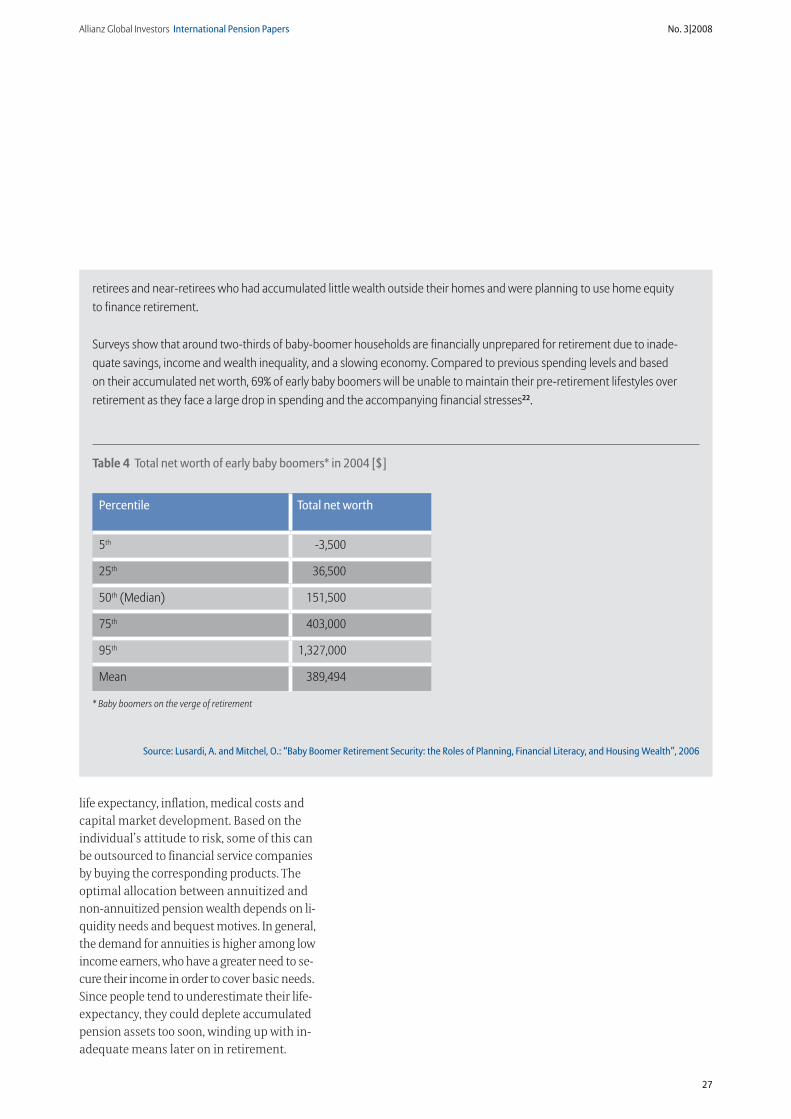
The distribution of net worth among this cohort, however, is fairly skewed with the third quartile having more than ten times the net worth of the lowest quartile (see Table 4). This is even more pronounced among socio-economic groups; white baby boomers have a median net worth of $200,000, which is seven times larger than a black baby boomer’s and three times larg-er than a Hispanic baby boomer’s net worth. What is more, a substantial portion of the net worth of lower wealth quartiles is tied up in home equity, which makes these baby boomers more vulnerable to housing value shocks21. The bursting of the U.S. housing bubble in 2006-2007 brought with it substantial wealth losses and had a particularly negative impact on those
Allianz Global Investors International Pension Papers No. 3|2008
27
life expectancy, inflation, medical costs and capital market development. Based on the individual’s attitude to risk, some of this can be outsourced to financial service companies by buying the corresponding products. The optimal allocation between annuitized and non-annuitized pension wealth depends on li-quidity needs and bequest motives. In general, the demand for annuities is higher among low income earners, who have a greater need to se-cure their income in order to cover basic needs. Since people tend to underestimate their life-expectancy, they could deplete accumulated pension assets too soon, winding up with in-adequate means later on in retirement.
retirees and near-retirees who had accumulated little wealth outside their homes and were planning to use home equity to finance retirement.
Surveys show that around two-thirds of baby-boomer households are financially unprepared for retirement due to inade-quate savings, income and wealth inequality, and a slowing economy. Compared to previous spending levels and based on their accumulated net worth, 69% of early baby boomers will be unable to maintain their pre-retirement lifestyles over retirement as they face a large drop in spending and the accompanying financial stresses22.
Percentile Total net worth
5th -3,500
25th 36,500
50th (Median) 151,500
75th 403,000
95th 1,327,000
Mean 389,494
* Baby boomers on the verge of retirement
Source: Lusardi, A. and Mitchel, O.: “Baby Boomer Retirement Security: the Roles of Planning, Financial Literacy, and Housing Wealth”, 2006
Table 4 Total net worth of early baby boomers* in 2004 [$]
Allianz Global Investors International Pension Papers No. 3|2008
28
America’s future retirees are confronted with a shaky outlook. A major portion of the pop-ulation either has no access to pension plans and/or is not profiting from tax incentives provided by current legislation. Among those that have managed to accumulate a retire-ment nest egg, a considerable number of their pension account balances are considered too low to be classified as sufficient, particularly when faced with rising health costs. Accu-mulated pension assets in the order of ten times pre-retirement annual income is gen-erally regarded as being adequate for financ-ing a satisfactory standard of living during retirement. Average account balances, how-ever, are worth only a fraction of that and so are greatly insufficient. According to the OECD, average pension wealth in the United States is less than six times the average earnings and only two-thirds of the OECD average23. Even today, a significant number of people who have already reached legal retirement age cannot afford to retire and so continue working. Almost a quarter of persons aged 65 to 74 are still in the workforce24.
The distribution of old-age income varies considerably across income groups. Retirees in the lowest income quintile rely almost ex-clusively on Social Security benefits, and pen-sion benefits from private sources are virtual-ly non-existent. As income increases, income from gainful employment, pensions, annui-ties and assets take on greater significance.
With a view to its long-term fiscal imbal-ances, it is very likely that Social Security will have to be adjusted by either reducing bene-fits, further increasing the legal retirement age, increasing contribution rates, or a com-bination thereof. Since increasing contribu-tion rates would directly increase labor costs, employers might be tempted to cut jobs. In-
creased unemployment, however, would have a negative impact on the growth of the U.S. economy, which is heavily dependent on domestic demand. As long as the actual re-tirement age is unaffected, any increase in the legal retirement age would have the same result as cutting benefits. In other words, whichever scenario is taken, retirees will like-ly have to lower their standard of living, with those largely dependent on Social Security feeling the greatest impact. According to the Center for Retirement Research at Boston Col-lege, 53% of the bottom third of income groups will not be able to maintain their standard of living in retirement.
Old-age poverty in future retirees is a great concern. The most recent U.S. pension reform is aimed at increasing participation in employer-sponsored pension plans through facilitating the set up of auto-enrollment and its adoption by employers expected to pick up. Though the Pension Protection Act of 2006 was acclaimed for its provisions to enhance participation in existing DC plans, it does not address several important aspects: in order to arrive at higher coverage rates, the number of employers offering pension plan access needs to be higher; low and middle-income earners lack the institutional support for additional retirement savings; and individuals need guidance on how to come up with a sustainable spending stra-tegy. Future pension reform will have to go beyond auto-enrollment.
> Incentive systemThe current system of tax subsidies does not favor low and middle-income earners. A Saver’s Credit that provides for direct government-matching contributions would likely encourage additional pension savings among this group. Future pension reform
Beyond auto-enrollment: Possible solutions

Allianz Global Investors International Pension Papers No. 3|2008
29
will have to focus on ensuring that those parts of the population with the greatest need for additional sources of income during retire-ment experience greater institutional support.
It will also be important to raise awareness of retirement planning, preferably at younger ages, and give guidance on how to make de-cisions. The current average contribution rate is only 3% of income, which is considered too low. The longer a savings decision is delayed, the greater the contribution rate has to be. Many employees have never made a serious calculation of what is actually needed for re-tirement, nor have they addressed the ques-tion of how to reach any goal.
> Asset preservationWhat is more, accumulated pension wealth needs to be safeguarded against misuse (i.e. assets are used for purposes other than re-tirement) so that individuals are prevented from easily cashing in their pension savings or borrowing against them to finance current needs. The question of using up pension as-sets too quickly could be addressed by pro-viding guidance on how to prudently spend lump-sum pension wealth. With the shift from DB to DC, individuals will have to learn to manage retirement assets themselves.
Government support could come in the form of encouraging people to annuitize using relevant tax incentives. As research shows, forced annuitization is less appropri-ate. In theory, individuals faced with forced annuitization would have a greater loss of utility in regards to the loss of flexibility and in the presence of a strong bequest motive25.
> Mandatory DCOne of the crucial deficits of the Pension Protection Act is that, in general, it did not strengthen employer incentives for setting up pension plans. Within the private sector,
almost 40% of all employees have no access to pension plans at work. However, according to current figures from the Bureau of Labor Statistics, whenever a pension plan is in place, take-up rates are high. Clearly, the critical issue here is employer supply and not em-ployee inertia. These findings apply to low-income earners as well.
A regulatory framework that ensures ac-cess to pension plans at work would likely contribute to higher coverage rates, especial-ly among small enterprises where coverage is very low. Employer-sponsored IRAs such as Simplified Employee Pensions and SIMPLE IRAs are good options for small businesses, as they do not have the same start up and ad-ministrative costs of a 401(k) plan. Although their popularity is increasing, they only ac-count for roughly 8% of the total IRA market.
The second and third pillars of the pension system are based on voluntary participation. However, cross-country comparisons show that when pension participation is voluntary, coverage rates rarely exceed half the work-force. Countries that involve greater compul-sion tend to have higher coverage rates. For instance, in countries like Switzerland, occu-pational pension coverage is mandated by law while, in the Netherlands, the prevalence of unions makes occupational pension as good as mandatory. With rates of 80% to 90% of the workforce, both countries have achieved almost full coverage.
Auto-enrollment introduced by the latest pension reform could be interpreted as an attempt to test quasi-mandatory DC plans. It is a paternalistic approach aimed at increas-ing occupational pension coverage. However, if coverage rates do not develop as is expected, several steps could be considered. For instance, the government could mandate and enforce an employee’s right to access in an employer-

Allianz Global Investors International Pension Papers No. 3|2008
30
sponsored pension plan. The current U.S. political climate makes a move towards in-creased compulsion easily conceivable: Barack Obama’s plan to strengthen retirement se-curity would force any employer who doesn’t currently have a pension plan in place to auto-enroll using a low-cost, direct-deposit IRA. Minimum employer contributions or man-datory matching contributions are other steps that could be implemented to increase the retirement security of future retirees.
Whatever path is taken, private pension provision will further grow in importance for future retirees. Already today, over $17.3 tril-lion have been accumulated in tax-favored retirement savings and we expect the growth in these products to continue.

Allianz Global Investors International Pension Papers No. 3|2008
31
Financial Assets of U.S. Households
In 2007, the gross financial assets held by U.S. households amounted to $45.3 trillion,
or 328% of the GDP. Over a ten year period, assets expanded by 65% (see Figure 11), despite the fact that, according to the U.S. Bureau of Economic Analysis, personal sav-ings have been well below 1% of disposable income over the last three years.
Compared internationally, the financial as-sets of U.S. private household have far exceed-ed those of western European and Japanese households, both in absolute as well as rela-tive terms. Within the EU15, financial assets held by private household totaled $36 trillion, or 218% of the GDP. In Japan, personal assets amounted to $14 trillion, or 310% of the GDP, which is about one-third of the U.S. figure.
Even though total assets were higher in the United States, growth dynamics were different. In Europe, for example, financial assets actu-ally grew by almost 74% as compared to 1997; however, the savings rate in many EU countries was well above that of the United States. Japan, on the other hand, achieved only a modest in-crease of less than 16% due to their low-risk and hence low-yield portfolios (see Figure 11). Weak economic growth, extremely low yield offerings and crises in neighboring regions prevented Japan from substantially building-up assets, de-spite the stock market bubble of the late 1990s.
The growth of financial assets was predom-inantly driven by performance (70%) in the U.S. In contrast, in Japan and Europe new inflows accounted for the lion’s share of financial
II. Perspectives – Pensions Assets Take on Weight
180
160
140
120
200
Figure 11
1997 1998 1999 2000 2001 2002 2003 2004 2005 2006 2007100
Europe (former EU excluding Luxembourg and Ireland)
USA
Japan
Sources: Central banks, Statistical offices, Allianz Dresdner Economic Research own calculations
Figure 11 Growth of household financial assets [1997=100]

Allianz Global Investors International Pension Papers No. 3|2008
33
both the United States and Europe saw some revival in bank products. Professionalization of investment also advanced further as indi-rect investment in funds, insurance products and pension funds steadily expanded their share of household portfolios.
The importance of retirement assets is re-flected by their steadily increasing share of total financial assets. Within the last decade, the share of retirement assets has increased by 5 percentage points, making up 40% in 2007 (see Figure 13).
OutlookIn the coming years, the build-up of financial assets is likely to remain dynamic, with growth driven by efforts to build up pension entitle-ments. Further shifts in the portfolio structure are expected as first baby boomers begin re-structuring their assets to generate a largely secure, regular flow of income for retirement. This can already been seen by the booming demand for annuities, which, in their various configurations, meet these requirements.
Our projection focuses first and foremost on the long-term structural shifts in the fi-nancial portfolio of private households, and projections are based on the potential growth trend in the economy. As for the shorter term, we have assumed there will be a slowdown in the U.S. economy and only a hesitant re-covery on the stock markets in 2009/2010, whose mid-2008 levels were already 15% down from what they were at the end of 2007 level. As of 2010, we have assumed an equity per-formance of 7% p.a. over the projection peri-od. This increase will also have an impact on holdings in pension and investment funds as a large chunk is invested in equities.
Based on these assumptions, U.S. assets are expected to grow to just over $75 trillion by 2020 (4% p.a.). Investment in funds will see the strongest growth, continuing the trend in institutionalizing private investment. Though the share of insurance and pension funds will remain broadly stable, IRA assets will grow strongly, helping to further increase the share of pension assets to 45% by 2020.
Figure 13
1995 1997 1999 2001 2003 2005 2006 2007 2010e 2020e 2030e
60
40
20
80
100
0
Mutual funds
Shares/quoted/unquoted
Bonds
Bank deposits
IRA
Insurance/pension funds
Other assets
14
10
35
64
29
12
9
37
65
29
11
7
38
75
29
15
7
33
85
31
15
9
30
85
32
15
9
28
8
6
32
15
9
28
9
6
31
16
9
26
9
7
31
18
9
21
10
7
31
16
9
26
9
7
31
16
8
22
12
7
31
Sources: U.S. Federal Reserve, Flow of funds Statistics, Allianz Dresdner Economic Research own calculation
Figure 13 Structure of total financial assets of U.S. private households in 2007 [%]

Allianz Global Investors International Pension Papers No. 3|2008
32
asset growth (70%) and only 30% stemmed from performance.
The period under review is characterized by three different phases: (I) the stock market boom of the 1990s, which led to a substantial build-up of assets; (II) the stock market slide from 2000 to 2002, which blew a particularly large hole in U.S. assets; and (III) the 2003 turn-around caused by a pickup in the economy and a growing optimism in capital markets. There has been a subsequent recovery in pri-vate financial asset formation since 2003.
Asset formation in Europe has been running in more or less parallel to the United States. However, continental Europe’s more conser-vative investment approach has spared Europe from losing wealth on the scale seen in the United States. Though hefty increases since 2003 brought European assets back to new heights, performance-driven growth could have been higher if a larger portion had been invested in higher yield assets. And it took Japan until 2004 to outstrip their 1999 figures.
The fairly disparate performance stems largely from differing household investment styles in the respective regions. Compared to the Europeans and Japanese, U.S. households are more willing to expose themselves to risk. While a good 40% of U.S. portfolios is invest-ed in equity and investment assets and only 15% is invested in bank products, bank share in Europe is almost two times higher – in Japan, it is three times higher (see Figure 12).
In 1999, the equity and investment share in financial assets in the United States peaked at almost 50%. However, this level has not been re-attained since the stock market slide that took place at the beginning of millennium. Direct investment in corporate stakes has been hit the hardest and has failed to recapture the attraction it held in 1999. In fact, U.S. house-holds on a whole have been reducing their exposure to equities. As in many European countries, the increase in overall figures stems from valuation changes over the course of the positive stock market performance up to 2007. Supported by the desire for safe investments,
Figure 12
Europe* USA *former EU, excluding Luxembourg and IrelandJapan
60
40
20
80
100
0
Insurance
Shares/funds
Bonds
Bank deposits
other
29.9
6.0
26.2
34.4
3.5
16.3
8.8
40.6
30.9
3.5
50.5
9.5
10.4
25.3
4.4
Sources: Central banks, Statistical offices, Allianz Dresdner Economic Research own calculations
Figure 12 Structure of financial assets of private households in 2007 [%]
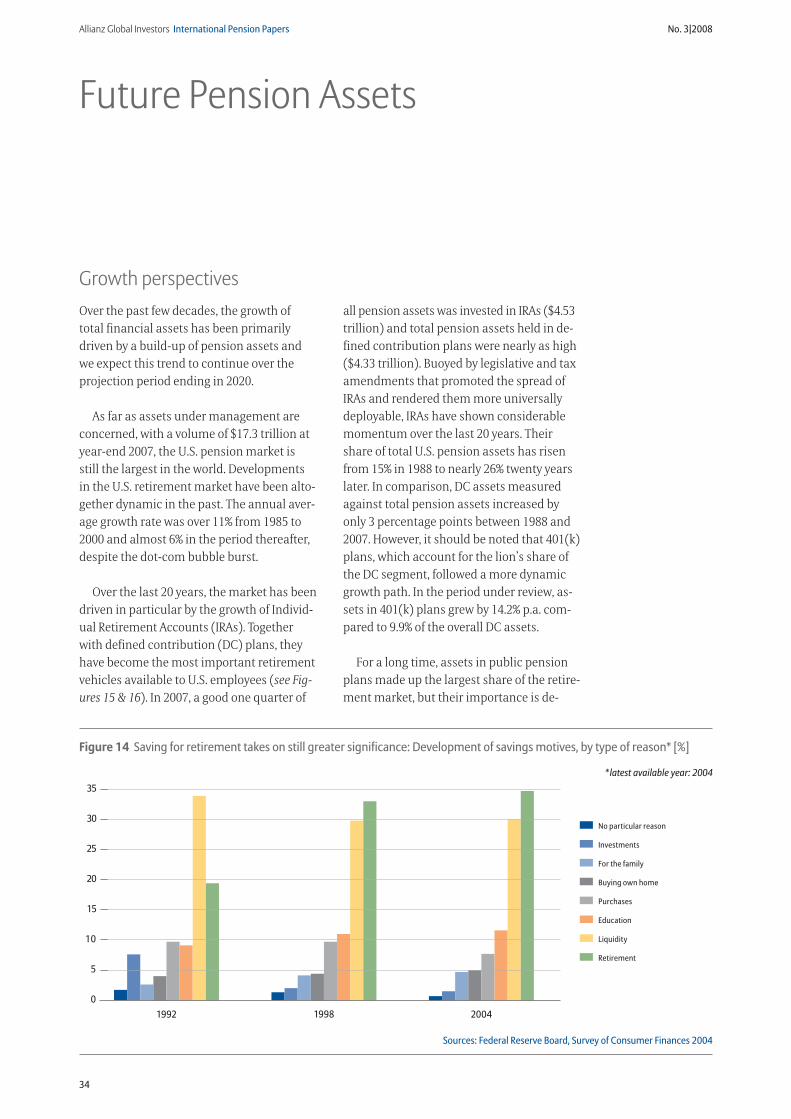
Allianz Global Investors International Pension Papers No. 3|2008
34
Figure 14
1992 1998 2004
Buying own home
For the family
Investments
No particular reason
Purchases
Retirement
Education
Liquidity
0
25
30
20
15
10
5
35
Sources: Federal Reserve Board, Survey of Consumer Finances 2004
*latest available year: 2004
Figure 14 Saving for retirement takes on still greater significance: Development of savings motives, by type of reason* [%]
Over the past few decades, the growth of total financial assets has been primarily driven by a build-up of pension assets and we expect this trend to continue over the projection period ending in 2020.
As far as assets under management are concerned, with a volume of $17.3 trillion at year-end 2007, the U.S. pension market is still the largest in the world. Developments in the U.S. retirement market have been alto-gether dynamic in the past. The annual aver-age growth rate was over 11% from 1985 to 2000 and almost 6% in the period thereafter, despite the dot-com bubble burst.
Over the last 20 years, the market has been driven in particular by the growth of Individ-ual Retirement Accounts (IRAs). Together with defined contribution (DC) plans, they have become the most important retirement vehicles available to U.S. employees (see Fig-ures 15 & 16). In 2007, a good one quarter of
all pension assets was invested in IRAs ($4.53 trillion) and total pension assets held in de-fined contribution plans were nearly as high ($4.33 trillion). Buoyed by legislative and tax amendments that promoted the spread of IRAs and rendered them more universally deployable, IRAs have shown considerable momentum over the last 20 years. Their share of total U.S. pension assets has risen from 15% in 1988 to nearly 26% twenty years later. In comparison, DC assets measured against total pension assets increased by only 3 percentage points between 1988 and 2007. However, it should be noted that 401(k) plans, which account for the lion’s share of the DC segment, followed a more dynamic growth path. In the period under review, as-sets in 401(k) plans grew by 14.2% p.a. com-pared to 9.9% of the overall DC assets.
For a long time, assets in public pension plans made up the largest share of the retire-ment market, but their importance is de-
Future Pension Assets
Growth perspectives
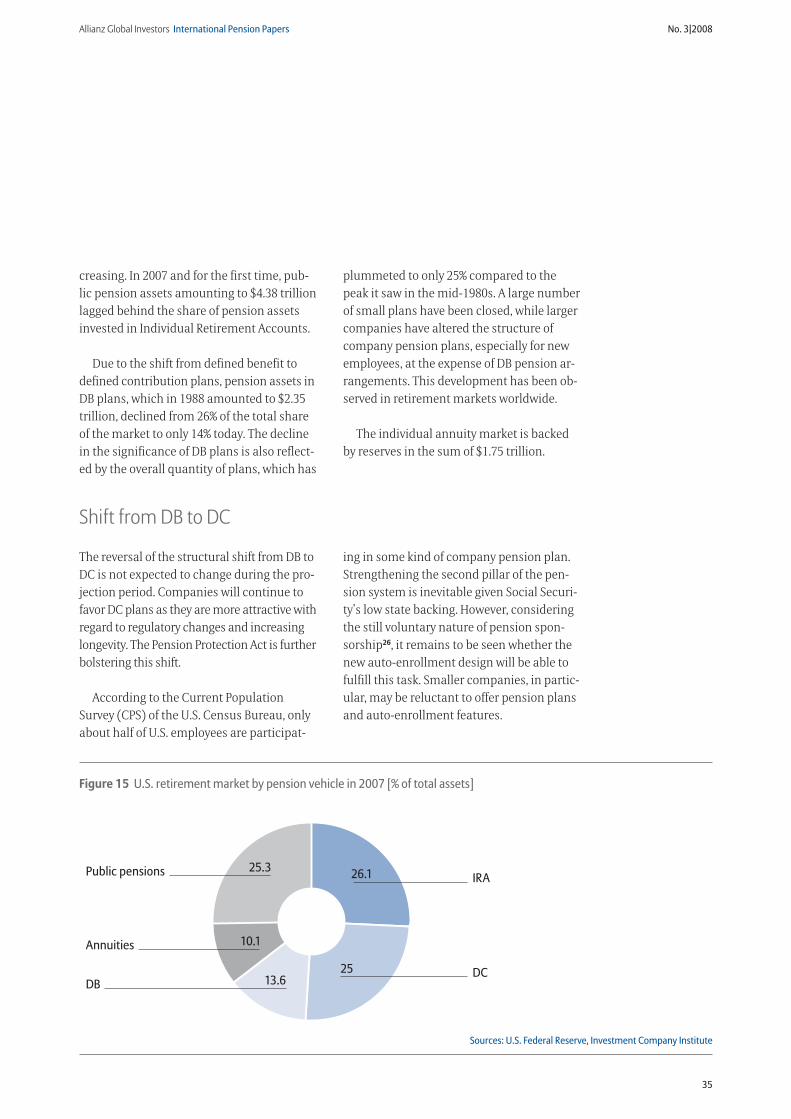
Allianz Global Investors International Pension Papers No. 3|2008
35
creasing. In 2007 and for the first time, pub-lic pension assets amounting to $4.38 trillion lagged behind the share of pension assets invested in Individual Retirement Accounts.
Due to the shift from defined benefit to defined contribution plans, pension assets in DB plans, which in 1988 amounted to $2.35 trillion, declined from 26% of the total share of the market to only 14% today. The decline in the significance of DB plans is also reflect-ed by the overall quantity of plans, which has
plummeted to only 25% compared to the peak it saw in the mid-1980s. A large number of small plans have been closed, while larger companies have altered the structure of company pension plans, especially for new employees, at the expense of DB pension ar-rangements. This development has been ob-served in retirement markets worldwide.
The individual annuity market is backed by reserves in the sum of $1.75 trillion.
Figure 15 U.S. retirement market by pension vehicle in 2007 [% of total assets]Figure 15
25.3Public pensions
10.1Annuities
13.6DB
IRA26.1
DC25
Sources: U.S. Federal Reserve, Investment Company Institute
The reversal of the structural shift from DB to DC is not expected to change during the pro-jection period. Companies will continue to favor DC plans as they are more attractive with regard to regulatory changes and increasing longevity. The Pension Protection Act is further bolstering this shift.
According to the Current Population Survey (CPS) of the U.S. Census Bureau, only about half of U.S. employees are participat-
ing in some kind of company pension plan. Strengthening the second pillar of the pen-sion system is inevitable given Social Securi-ty’s low state backing. However, considering the still voluntary nature of pension spon-sorship26, it remains to be seen whether the new auto-enrollment design will be able to fulfill this task. Smaller companies, in partic-ular, may be reluctant to offer pension plans and auto-enrollment features.
Shift from DB to DC

Allianz Global Investors International Pension Papers No. 3|2008
36
Figure 16 U.S. retirement market: Historic trends [% of total assets]
20
15
10
5
30
25
Figure 16
1988 20072006200520042003200220012000199919981997199619951994199319921991199019890
IRA
Public Pensions
DC DB
Annuities
Sources: U.S. Federal Reserve, Investment Company Institute
We expect growth in the IRA segment to re-main strong up to 2020. We also believe there will be a continued structural shift away from company pension towards individual pension plans, which can also be employer-sponsored. However, the special nature of inflows into these plans makes it difficult to project a trend for this product group. Capital growth in IRAs is generated by three sources: Contributions, performance and rollovers from other plans.
Contributions actually play a very minor role here. According to the Employee Benefit Research Institute (EBRI), only a small number of employees or households are actually mak-ing regular contributions. In 2005, for instance, only 6.2% of 21 to 64-year-old employees con-
tributed regularly, and only 27% of IRA con-tributors invested the $4,000 maximum. The share of employees aged 50 and older who took advantage of the additional catch-up feature remained very low; around one-third of eligi-ble employees. The bulk of asset inflows into IRAs actually stemmed from employee pension rollovers as a result of changing jobs, being laid off or entering retirement.
In other words, IRA savings are not usually a result of regular employee contributions. In 2002, inflows from rollovers into traditional IRAs amounted to $204.4 billion (EBRI), or al-most five times higher than regular employee contributions, which in 2002 were only $42.3 billion.
Shift towards individual schemes
Our projection is based on the fact that early baby boomers are rapidly approaching re-tirement age and are beginning to make the
appropriate financial arrangements. Since partial or full annuitization of accumulated wealth is one way to generate regular retire-
Strong annuity growth
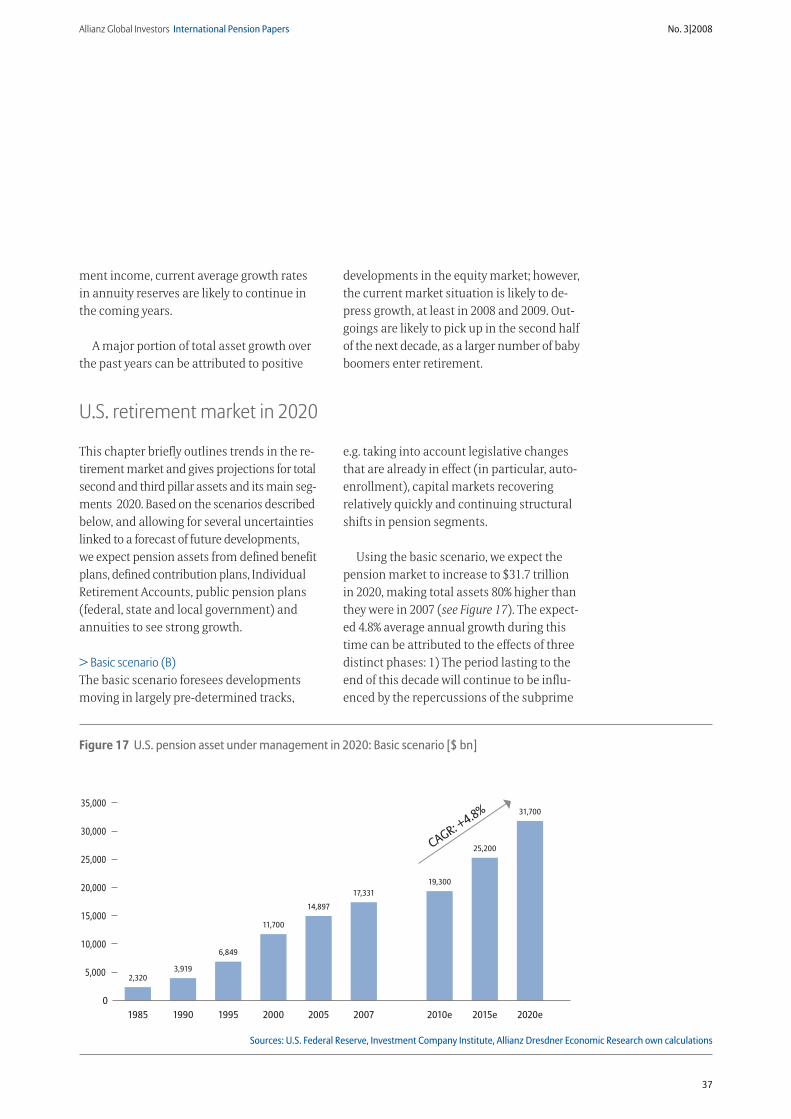
Allianz Global Investors International Pension Papers No. 3|2008
37
ment income, current average growth rates in annuity reserves are likely to continue in the coming years.
A major portion of total asset growth over the past years can be attributed to positive
developments in the equity market; however, the current market situation is likely to de-press growth, at least in 2008 and 2009. Out-goings are likely to pick up in the second half of the next decade, as a larger number of baby boomers enter retirement.
This chapter briefly outlines trends in the re-tirement market and gives projections for total second and th ird pillar assets and its main seg-ments 2020. Based on the scenarios described below, and allowing for several un certainties linked to a forecast of future developments, we expect pension assets from defined benefit plans, defined contribution plans, Individual Retirement Accounts, public pension plans (federal, state and local government) and annuities to see strong growth.
> Basic scenario (B)The basic scenario foresees developments moving in largely pre-determined tracks,
e.g. taking into account legislative changes that are already in effect (in particular, auto-enrollment), capital markets recovering relatively quickly and continuing structural shifts in pension segments.
Using the basic scenario, we expect the pension market to increase to $31.7 trillion in 2020, making total assets 80% higher than they were in 2007 (see Figure 17). The expect-ed 4.8% average annual growth during this time can be attributed to the effects of three distinct phases: 1) The period lasting to the end of this decade will continue to be influ-enced by the repercussions of the subprime
U.S. retirement market in 2020
Figure 17
25,000
15,000
5,000
35,000
20,000
10,000
30,000
1985
2,320
1990
3,919
1995
6,849
2000
11,700
2005
14,897
2007
17,331
2010e
19,300
2015e
25,200
2020e
31,700
0
CAGR: +4.8%
Sources: U.S. Federal Reserve, Investment Company Institute, Allianz Dresdner Economic Research own calculations
Figure 17 U.S. pension asset under management in 2020: Basic scenario [$ bn]
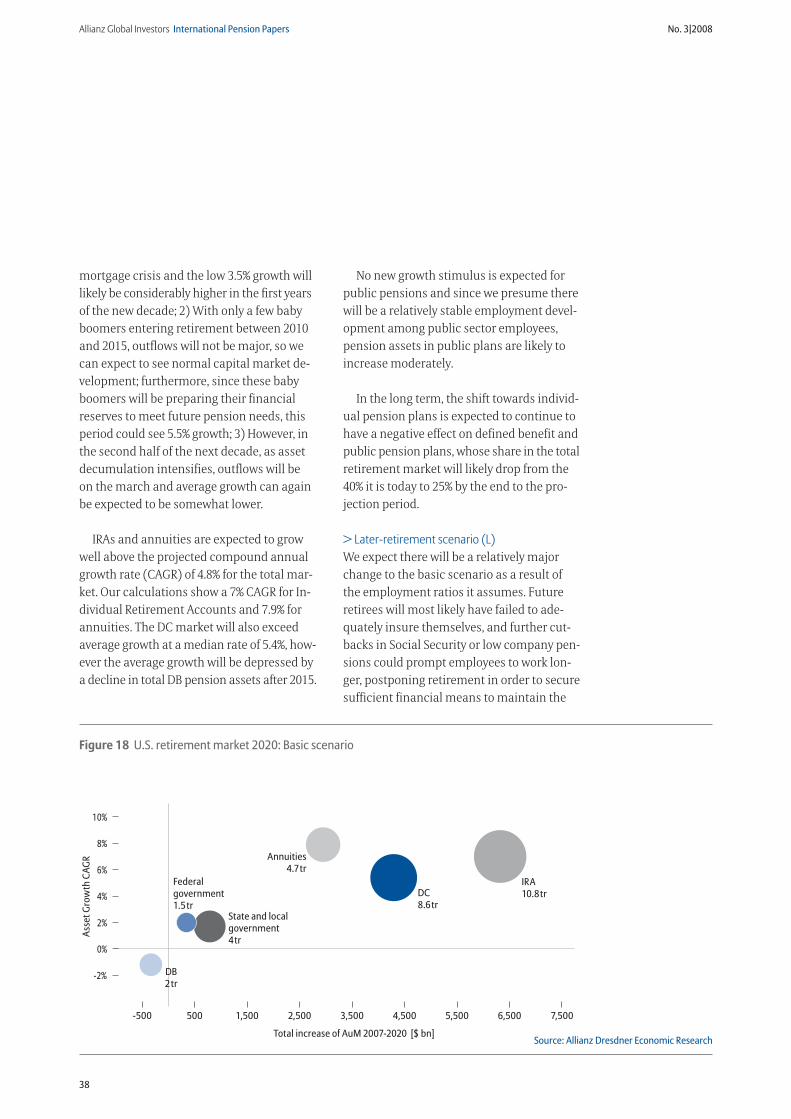
Allianz Global Investors International Pension Papers No. 3|2008
38
mortgage crisis and the low 3.5% growth will likely be considerably higher in the first years of the new decade; 2) With only a few baby boomers entering retirement between 2010 and 2015, outflows will not be major, so we can expect to see normal capital market de-velopment; furthermore, since these baby boomers will be preparing their financial reserves to meet future pension needs, this period could see 5.5% growth; 3) However, in the second half of the next decade, as asset decumulation intensifies, outflows will be on the march and average growth can again be expected to be somewhat lower.
IRAs and annuities are expected to grow well above the projected compound annual growth rate (CAGR) of 4.8% for the total mar-ket. Our calculations show a 7% CAGR for In-dividual Retirement Accounts and 7.9% for annuities. The DC market will also exceed average growth at a median rate of 5.4%, how-ever the average growth will be depressed by a decline in total DB pension assets after 2015.
No new growth stimulus is expected for public pensions and since we presume there will be a relatively stable employment devel-opment among public sector employees, pension assets in public plans are likely to increase moderately.
In the long term, the shift towards individ-ual pension plans is expected to continue to have a negative effect on defined benefit and public pension plans, whose share in the total retirement market will likely drop from the 40% it is today to 25% by the end to the pro-jection period.
> Later-retirement scenario (L)We expect there will be a relatively major change to the basic scenario as a result of the employment ratios it assumes. Future retirees will most likely have failed to ade-quately insure themselves, and further cut-backs in Social Security or low company pen-sions could prompt employees to work lon-ger, postponing retirement in order to secure sufficient financial means to maintain the
Figure 18
6%
2%
-2%
10%
4%
0%
8%
-500 500 1,500 2,500 3,500
Asse
t Gro
wth
CAG
R
Total increase of AuM 2007-2020 [$ bn]
4,500 5,500 6,500 7,500
DB2tr
State and localgovernment4tr
Annuities4.7tr
IRA10.8trDC
8.6tr
Federalgovernment1.5tr
Source: Allianz Dresdner Economic Research
Figure 18 U.S. retirement market 2020: Basic scenario
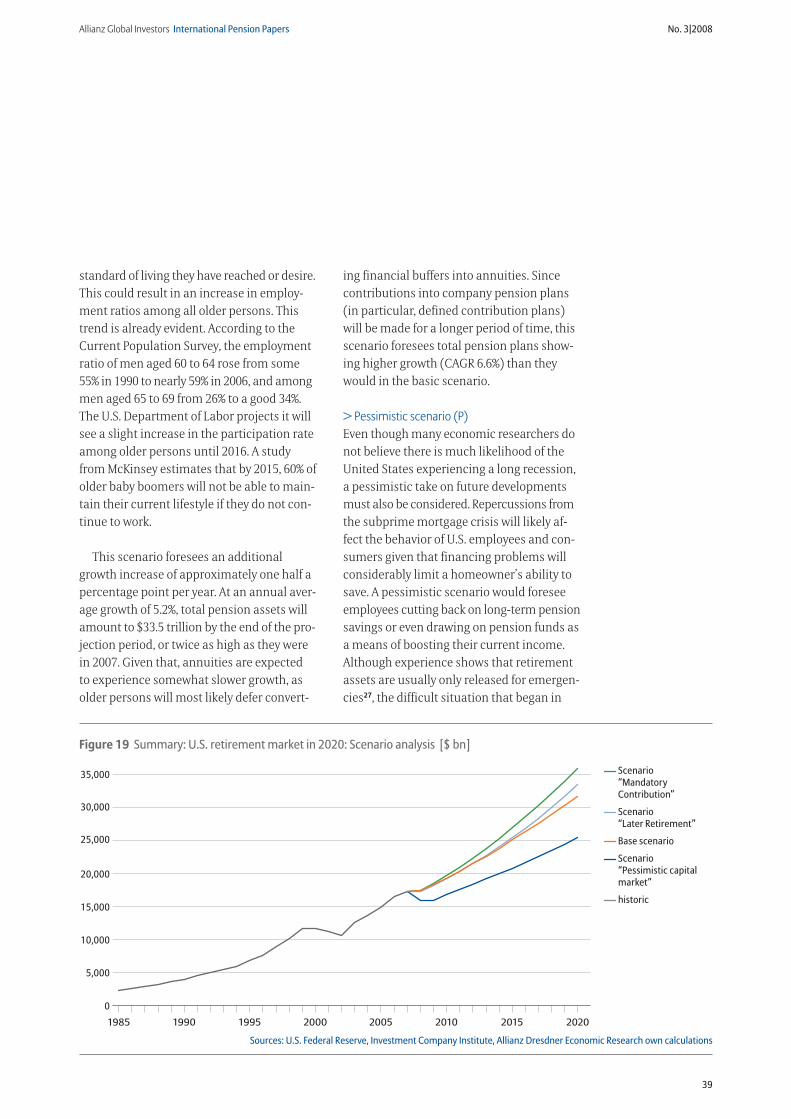
Allianz Global Investors International Pension Papers No. 3|2008
39
standard of living they have reached or desire. This could result in an increase in employ-ment ratios among all older persons. This trend is already evident. According to the Current Population Survey, the employment ratio of men aged 60 to 64 rose from some 55% in 1990 to nearly 59% in 2006, and among men aged 65 to 69 from 26% to a good 34%. The U.S. Department of Labor projects it will see a slight increase in the participation rate among older persons until 2016. A study from McKinsey estimates that by 2015, 60% of older baby boomers will not be able to main-tain their current lifestyle if they do not con-tinue to work.
This scenario foresees an additional growth increase of approximately one half a percentage point per year. At an annual aver-age growth of 5.2%, total pension assets will amount to $33.5 trillion by the end of the pro-jection period, or twice as high as they were in 2007. Given that, annuities are expected to experience somewhat slower growth, as older persons will most likely defer convert-
ing financial buffers into annuities. Since contributions into company pension plans (in particular, defined contribution plans) will be made for a longer period of time, this scenario foresees total pension plans show-ing higher growth (CAGR 6.6%) than they would in the basic scenario.
> Pessimistic scenario (P)Even though many economic researchers do not believe there is much likelihood of the United States experiencing a long recession, a pessimistic take on future developments must also be considered. Repercussions from the subprime mortgage crisis will likely af-fect the behavior of U.S. employees and con-sumers given that financing problems will considerably limit a homeowner’s ability to save. A pessimistic scenario would foresee employees cutting back on long-term pension savings or even drawing on pension funds as a means of boosting their current income. Although experience shows that retirement assets are usually only released for emergen-cies27, the difficult situation that began in
20,000
15,000
10,000
5,000
30,000
25,000
35,000
Figure 19
1985 20202015201020052000199519900
historic
Scenario “Pessimistic capital market”
Base scenario
Scenario “Later Retirement”
Scenario “Mandatory Contribution”
Sources: U.S. Federal Reserve, Investment Company Institute, Allianz Dresdner Economic Research own calculations
Figure 19 Summary: U.S. retirement market in 2020: Scenario analysis [$ bn]

Allianz Global Investors International Pension Papers No. 3|2008
40
mid-2007 and is still prevailing in mid-2008 could prompt a large number of homeown-ers or mortgage owners to make precisely this move. It should also be noted that it is possible to withdraw pension savings with-out being penalized in order to finance the acquisition of a principal residence.
The pessimistic scenario foresees IRAs, DC plans and annuities being negatively impact-ed by the unfavorable economic climate and financial difficulties of employees. The impli-cation to public pensions, which are not as variable, is likely to be less serious. This also applies to DB plans even though they are gen-erating almost no new business. Assuming a marked slowdown and restraint on the capi-tal markets in 2008/2009 and normalization thereafter, as suggested in the basic scenario, annual growth rates can be expected to be one and a half percentage points lower dur-ing the projection period. With an expected growth rate of 3.0% p.a., total pension assets will rise to $25.5 trillion by 2020.
> Mandatory-occupational-pensions scenario (M)Coverage rates in and contribution rates to second pillar pension plans are considered to be too low to finance an adequate standard of living during retirement. An EBRI study shows that even after the PPA enactment, con-tribution rates remained at a level considered too low to generate adequate retirement in-come28. Empirical studies29 show that a con-
tribution rate of 15% to 18% would be neces-sary to reach a replacement rate of at least 60% to 65% of pre-retirement income. Current-ly observed contribution rates are far from these numbers.
As a modification of Scenario B, we also calculated what the asset growth in the retire-ment market would be if the government in-troduced a compulsory occupational system. The introduction of quasi-mandatory occu-pational pensions is currently discussed in Barack Obama’s plan to strengthen retirement security, which maps out the introduction of automatic workplace pensions. Employers who don’t already offer an employee pension plan would be required to automatically en-roll their employees into a direct-deposit IRA.
We have simulated a scenario that assumes combined employer and employee contribu-tion rates in the amount of 15% and a marked increase in the coverage rate. A scenario of this kind would generate considerable impe-tus for the market. As a result of the increase in the contribution rate, total pension assets would grow a good one percentage point more than the basic scenario. Defined contribution plans would profit most and assets in these plans would increase by 3 percentage points a year compared to the basic scenario. Total pension assets could reach $36 trillion by 2020.
Chapter two was written by Dr. Renate Finke, Allianz Dresdner Economic Research.
Technical note
The key assumptions underlying our projections are described hereafter. Population figures are taken from the U.S. Census
Bureau; it is assumed that the share of the population aged 18 to 64 will decline from 2011. Scenario L, which assumes a
higher participation rate among older people, foresees the working population continuing to increase during the projection
period. Retirement market segments follow definitions used by the Investment Company Institute; latest figures are taken
from the U.S. Federal Reserve’s “Flow of Funds Accounts,” the American Council of Life Insurers and the Department of Labor;
segments have been adopted accordingly. Assets in 403(b) and 457 plans for public sector employees are included in the
figure for defined contribution plans. Assumptions have been made on the return on assets, contributions, outflows and par-
ticipation in the different types of pension plans and differ according to the individual scenarios.

Allianz Global Investors International Pension Papers No. 3|2008
41
The U.S. pension market holds a lot of promise. Based on several scenarios,
total pension assets are expected to develop at a CAGR of 3.0% to 5.8%, growing between 50% and 100% by 2020 as compared to their volume in 2007. Pension asset levels are ex-pected to be between $25.5 trillion and $36 trillion in 2020.
Current economic conditions may impact long-term pension savings by tempting people to draw-down pension assets to alleviate fi-nancial hardships such as mortgage financing problems. The pessimistic scenario foresees lower growth rates since their primary drivers, namely defined contribution plans and IRAs, will be adversely affected.
In comparing the need for supplementary pension coverage to actual access and partic-ipation rates, one alternative to bucking the retirement insecurity looming on the horizon is to put greater compulsion on current vol-untary systems. If so, pension assets under management would be boosted to two times the current level.
Both scenarios foresee a large accumula-tion of pension wealth in the coming decade. With the shift from defined benefit to defined contribution and the related shift in individ-ual responsibility, attention will have to be given to much more than just asset accumu-lation. The focus will have to shift from pure accumulation products to pension products spanning the entire life cycle. The key chal-lenge is the integrated management of the different risks associated with long-term investments, such as market risk, inflation, longevity and health risks.
The strong current position and the ex-pected robust growth of pension assets held in IRAs implies a structural shift from com-pany pension plans towards individual pen-sion plans, which in turn means a shift from highly standardized to more differentiated product offerings that allow for a greater adjustment to suit individual needs.
Bottom Line

Allianz Global Investors International Pension Papers No. 3|2008
42
References
1 Lussardi, A. and Mitchell, O., 2005: DNB Working Paper on “Financial Literacy and Planning: Implications for Retirement Wellbeing.”
2 UN Population Prospects.
3 United States General Accounting Office, 2002: “Aging Baby Boom increase Demand and Burden on Federal and States Budgets.”
4 Board of Trustees of the OASDI Trust Funds, 2008: Annual Report.
5 OECD, 2008: “Governance and Investment of Public Pension Reserve Funds in Selected OECD Countries.”
6 U.S. Department of the Treasury, March 2008: “Social Security Trust Funds and the Federal Budget.”
7 Board of Trustees of the OASDI Trust Funds, 2008: Annual Report.
8 Investment Company Institute, 2006: “401(k) Plans: A 25-Year Retrospective.”
9 U.S. Federal Reserve Board, 2004: Survey of Consumer Finances.
10 Congressional Budget Office, 2005: “The Risk Exposure of the Pension Benefit Guaranty Corporation.”
11 Fidelity Investments, 2008: “Building Futures, Volume VIII.”
12 Hewitt Associates, 2008: “Total Retirement Income at Large Companies: The Real Deal.”
13 Cerulli: “Global Markets 2008.”
14 U.S. Bureau of Labor Statistics, March 2008: National Compensation Survey.
15 U.S. Office of Management and Budget, “Analytical Perspective, Fiscal Year 2007.“
16 EBRI, 2007: Notes, Vol. 28, No. 12.
17 NAVA: “2008 Annuity Fact Book.”
18 The Gallup Organization and Mathew Greenwald & Associates, 2005: The Committee of Annuity Insurers, Survey of Owners of Non-Qualified Annuity Contracts.
19 Estimated number of Baby Boomers according to the U.S. Census Bureau.
20 McKinsey, 2008: “Talkin’ ‘bout My Generation: The Economic Impact of Aging US Baby Boomers.”
21 Lusardi, A. and Mitchell, O., 2006: “Baby Boomer Retirement Security: the Role of Planning, Financial Literacy, and Housing Wealth.”
22 McKinsey, 2008: “Talkin’ ‘bout My Generation: The Economic Impact of Aging US Baby Boomers.”
23 OECD, 2007: “Pensions at a Glance.”
24 U.S. Census Bureau, 2006: American Community Survey, Employment Status.
25 Horneff, W., Maurer, R. and Stamos, M., 2008: “Optimal Gradual Annuitization: Quantifying the Costs of Switching to Annuities” in The Journal of Risk and Insurance, Vol. 75, No.4, 1019-1038.
26 VanDerhei, J. and Copeland, C., June 2008: “The Impact of PPA on Retirement Savings for 401 (k) Participants,” EBRI Issue Brief, No. 318. See the discussion and modeling of the effect of automatic enrollment.
27 Holden, S. and Reid, B., 25 January 2008: “The Role of Individual Retirement Accounts in US Retire-ment Planning,” Pension Research Council Working Paper 2007.
28 EBRI Policy Forum, July 2008: “Defined Contribution Plans in a Post-PPA Environment,” EBRI Notes, Vol.29, No.7.
29 Mercer, S., October 2007: “Defined contribution plans: the challenge of achieving benefit adequacy.”

Allianz Global Investors International Pension Papers No. 3|2008
43
Imprint
Publisher: Allianz Global Investors AG, International Pensions, Seidlstr. 24-24a, 80335 Munich, Germany | [email protected]
http://www.allianzglobalinvestors.com | Author: Isabel Bodlak, Pensions Analyst, Allianz Global Investors AG, [email protected]
Contributors: Dr. Renate Finke, Allianz Dresdner Economic Research; Dr. Martin Gasche, Allianz Dresdner Economic Research | Final editing: Marilee Williams
Layout: volk:art51 GmbH, Munich | Printing: repromüller, Übersee | Closing Date: September 30, 2008
The entire content of this publication is protected by copyright with all rights reserved to Allianz Global Investors AG. Any copying, modifying, distributing
or other use of the content for any purpose without the prior written consent of Allianz Global Investors AG is prohibited. The information contained in this
publication has been carefully verified by the time of release, however Allianz Global Investors AG does not warrant the accuracy, reliability or completeness
of any information contained in this publication. Neither Allianz Global Investors AG nor its employees and deputies will take legal responsibility for any
errors or omissions therein.
This publication is intended for general information purposes only. None of the information should be interpreted as a solicitation, offer or recommendation
of any kind. Certain of the statements contained herein may be statements of future expectations and involve known and unknown risks and uncertainties,
which may cause actual results, performance or events to differ materially from those expressed or implied in such statements.

www.allianzglobalinvestors.com
Allianz Global Investors AGInternational PensionsSeidlstr. 24-24a80335 Munich, Germany


