RETIREMENT BY DESIGN UNIFORM RETIREMENT SYSTEM FOR JUSTICES AND JUDGES Comprehensive Annual Financial Report for the Fiscal Year Ended June 30, 2010 A Component Unit of the State of Oklahoma
Transcript
RETIREMENT BY DESIGN
U N I F O R M R E T I R E M E N T S Y S T E M F O R J U S T I C E S A N D J U D G E S
Comprehensive Annual Financial Report for
the Fiscal Year Ended June 30, 2010
A Component Unit of the State of Oklahoma
Uniform Retirement System for Justices and Judges
P.O. Box 53007
Oklahoma City, Oklahoma 73152-3007
1.800.733.9008
UN
IFO
RM
RE
TIR
EM
EN
T S
YS
TE
M F
OR
JU
ST
ICE
S A
ND
JU
DG
ES
Comprehensive Annual Financial R
eport for the Fiscal Year Ended June 30, 2010R
ETIREM
ENT BY DESIGN
Coleman Theatre Miami, OklahomaOn the cover:
Opened in April 1929, the “Coleman Theatre Beautiful” was designed and built by the noted Boller Brothers firm that built more than 100 classic theatres in the U.S. Funded by local mining magnate, George L. Coleman, Sr., the Spanish mission style of the exterior is beautifully complemented by the elegant Louis XV interior design featuring silk damask panels, stained glass, gold leaf trim, decorative plaster moldings and railings, and a carved mahogany staircase. This vaudeville theatre and silent movie palace hosted the likes of Bob Hope, Bing Crosby and Dean Martin.
In 1989, the Coleman family donated the theatre to the city of Miami. The community has embraced preserving the original grandeur of this building – whether that is the city providing free utilities, or the in-kind donations of labor and fund raising by the people of Miami. Those efforts are ongoing and have culminated in restoring the chandelier and returning the “Mighty Wurlitzer” pipe organ to its original state and location within the theatre.
The Coleman Theatre was placed on the National Register of Historical Places in 1983.
This edition of the Comprehensive Annual Financial Report for the Uniform Retirement System for Justices and Judges (URSJJ) pays tribute to several of Oklahoma’s architectural masterpieces. Similar to the creation of these magnificent structures, successful retirement planning requires imagination, focus, and – most importantly – a sound design.
The traditional definition of retirement continues to change. We are living longer and have higher expectations for an enjoyable and extended retirement. Preparation for a rewarding life after work is more than merely a matter of dollars and cents. We should strive for a retirement plan that takes into consideration our health and lifestyle in addition to our financial concerns. Successful planning focuses on the life we are retiring to, not just the career we are retiring from.
URSJJ is committed to helping our members throughout their careers in public service to become better prepared for retirement. One of the ways we are doing this is the introduction of two new retirement planning seminars – Controlling Your Financial Future and Retirement Income Management. These two new programs are being developed to build upon the success of our Pre-Retirement Seminar and designed to provide valuable personal financial planning tools at every stage of life leading up to and beyond retirement.
Retirement is a journey, not a destination. The financial pressures of life require timely consideration and action. Procrastination is the greatest obstacle to being prepared for retirement. URSJJ will continue to be there for our members with timely educational programs, informative publications, and a courteous, professional staff to serve them as they design the retirement that celebrates their service to the citizens of Oklahoma.
All photographs provided by Hugh Scott Photography
RETIREMENT BY DESIGN U N I F O R M R E T I R E M E N T S Y S T E M F O R J U S T I C E S A N D J U D G E S
This report was prepared by the staff of the Uniform Retirement System for Justices and Judges.
This publication, printed by University Printing Services, is issued by the Oklahoma Public Employees Retirement System as authorized by its Executive Director. Seven hundred fifty copies have been prepared
and distributed at a cost of $4,020.50. An electronic version of this publication has been deposited with the Publications Clearinghouse of the Oklahoma Department of Libraries.
UNIFORM RETIREMENT SYSTEM FOR JUSTICES AND JUDGES
UNIFORM RETIREMENT SYSTEM FOR JUSTICES AND JUDGES
2010 Comprehensive Annual Financial Report
Table of Contents Introductory Section 1 Letter of Transmittal 5 Chairman’s Letter 6 Board of Trustees 7 Organizational Structure 7 Advisors and Consultants 8 2010 Legislation 9 Certificate of Achievement for Excellence in
Financial Reporting Financial Section 11 Independent Auditors’ Report 12 Management’s Discussion and Analysis Financial Statements: 20 Statements of Plan Net Assets 21 Statements of Changes in Plan Net Assets 22 Notes to Financial Statements Required Supplementary Information: 36 Schedule of Funding Progress - Schedule 1 36 Schedule of Employer Contributions - Schedule 1 Supplementary Information: 37 Schedule of Investment Expenses - Schedule 2 38 Schedule of Administrative Expenses - Schedule 3 39 Schedule of Professional/Consultant Fees -
Schedule 4 Investment Section 41 Investment Consultant’s Report 44 Chief Investment Officer’s Report 49 Largest Holdings 49 Schedule of Stock Brokerage Commissions Paid 50 Investment Portfolio by Type and Manager 51 Asset Comparison
Actuarial Section 53 2010 Certification of Actuarial Valuation 55 Summary of Results 56 Analysis of Financial Experience 57 Solvency Test 58 Schedule of Active Member Valuation Data 58 Schedule of Retirants, Disabled Retirants and
Beneficiaries Added to and Removed from Rolls 59 Summary of System Provisions 61 Summary of Actuarial Assumptions and Methods Statistical Section 63 Statistical Section: Narrative Explanation 64 Schedule of Changes in Net Assets 65 Schedule of Revenue by Source 65 Schedule of Expenses by Type 66 Schedule of Benefit Payments and Refunds by Type 66 Funded Ratio Chart 67 Rate of Return by Type of Investment 68 Schedule of Retired Members by Type of Benefit 69 Schedule of Average Benefit Payments 70 Principal Employer 70 Demographics Chart 71 Member Statistics 72 Distribution of Retirees and Beneficiaries 73 Summary of Active Members Addendum 75 2010 Certification of Actuarial Results Under
Prescribed Assumptions 77 Summary of Valuation Results Under Prescribed
Assumptions
UNIFORM RETIREMENT SYSTEM FOR JUSTICES AND JUDGES
INTRODUCTORY SECTIONPhilbrook Museum of Art Tulsa, Oklahoma
Built in 1927, Philbrook Villa was designed by Edward Buehler Delk and served as the
residence for Oklahoma oil pioneer Waite Phillips, and his wife Genevieve. The structure is
a lavish example of baroque architecture with hand-painted ceilings, murals and wrought-
iron grill work. Equally as impressive are the 23 acres of formal gardens designed by
Herbert Hare and inspired by Villa Lante, an Italian country estate north of Rome and
designed by Giacomo Barozzi da Vignola in 1566.
In 1938, Phillips donated the Philbrook to the city of Tulsa for art and cultural purposes
to open the city’s fi rst museum of art. In 1987 the Philbrook Art Center was renamed the
Philbrook Museum of Art. It has overcome fi nancial hardship in the 1980s and experienced
a rebirth in the 1990s. In 2009, the museum was reaccredited by the American Association
of Museums.
The Philbrook was added to the National Register of Historic Places in 1978.
Philbrook Museum of Art Tulsa, Oklahoma
2010 COMPREHENSIVE ANNUAL FINANCIAL REPORT 1
UNIFORM RETIREMENT SYSTEM FOR JUSTICES AND JUDGES
Letter of Transmittal Uniform Retirement System for Justices and Judges P.O. Box 53007 Oklahoma City, Oklahoma 73152-30077
800.733.7008 toll-free 405.848.5946 fax
November 30, 2010
To the Board of Trustees of the Oklahoma Public Employees Retirement System and Members of the Uniform Retirement System for Justices and Judges:
State law requires that, after July 1 and before December 1 of each year, the Uniform Retirement System for Justices and Judges (URSJJ) publish an annual report that covers the operation of URSJJ during the past fiscal year, including income, disbursements and the financial condition at the end of the fiscal year. This report is published, in part, to fulfill that requirement for the fiscal year ended June 30, 2010. State law also requires that URSJJ provide certain information regarding the financial and actuarial condition of URSJJ using certain prescribed assumptions as an addendum to the annual report. The Addendum section of this report is provided to fulfill that requirement.
Management assumes full responsibility for the completeness and reliability of the information contained in this report, based upon a comprehensive framework of internal control that it has established for this purpose. Because the cost of internal control should not exceed anticipated benefits, the objective is to provide reasonable, rather than absolute, assurance that the financial statements are free of any material misstatements.
Cole & Reed, P.C., Certified Public Accountants, has issued an unqualified opinion on the Uniform Retirement System for Justices and Judges’ statements of plan net assets as of June 30, 2010 and 2009, and the related statements of changes in plan net assets for the years then ended. The independent auditor’s report is located at the front of the financial section of this report.
Management’s discussion and analysis (MD&A) immediately follows the independent auditor’s report and provides a narrative introduction, overview, and analysis of the basic financial statements. MD&A complements this letter of transmittal and should be read in conjunction with it.
Profile of the Plan
URSJJ is a single-employer public employee retirement plan, which is a defined benefit pension plan, covering all Justices and Judges of the Oklahoma Supreme Court, Court of Criminal Appeals, Workers’ Compensation Court, Court of Appeals, and District Courts. URSJJ is administered by the Oklahoma Public Employees Retirement System (OPERS) and its Board of Trustees (the Board). The employee and employer contribution rates are established by the Oklahoma Legislature after recommendation by the Board based on an actuarial calculation which is performed to determine the adequacy of such contribution rates.
2 2010 COMPREHENSIVE ANNUAL FINANCIAL REPORT
UNIFORM RETIREMENT SYSTEM FOR JUSTICES AND JUDGES
Letter of Transmittal (continued)
Members qualify for full retirement benefits at their normal retirement age, defined as: (1) when the sum of the member’s age and years of credited service equals 80 or (2) at age 65 with 8 years of judicial service or (3) at age 60 with 10 years of judicial service. Benefits are determined at 4% of the member’s average salary, as defined, multiplied by the number of years of service, not to exceed 100% of the member’s average monthly salary received as a justice or judge for the highest 36 months of compensation. Justices and judges retiring after September 1, 2005, may elect a maximum benefit with no survivor option or one of two actuarially reduced retirement benefits that provide for a lifetime benefit to be paid to the member’s joint annuitant after the member’s death. The original surviving spouse benefit for married judges who were members prior to September 1, 2005, continues to be available. Effective September 1, 2005, all justices and judges pay a uniform contribution rate of 8%.
The Board consists of thirteen appointed members, some by position and some by association. Those serving through position are a member of the Corporation Commission as selected by the Commission, a member of the Tax Commission as selected by the Tax Commission, the Administrator of the Office of Personnel Management or designee, the State Insurance Commissioner or designee, and the Director of State Finance or designee. Of the remaining members, three are appointed by the Governor, one is appointed by the Supreme Court, two are appointed by the Speaker of the House of Representatives and two are appointed by the President Pro Tempore of the Senate. Qualifications for certain of these appointees include a balance of individuals having experience in investment management, pension management, public fund management, the banking profession or a licensed attorney or a licensed accountant.
Each year, OPERS, along with other state agencies, is required to file a budget work program with the Office of State Finance. Administrative overhead expenses of URSJJ, including personnel and other supporting services costs, are paid for by OPERS and allocated to URSJJ based on an estimate of the cost of services provided. The allocated costs are charged to URSJJ and paid with funds provided through operations of URSJJ. The OPERS budget work program, which includes the costs related to URSJJ, is approved by the Board and includes a description of all funds available for expenditure and shows spending by major program category. URSJJ receives no state appropriations and is funded through employee and employer contributions and investment earnings.
Additionally in each even-numbered year, OPERS, along with other state agencies, must file a strategic plan covering five fiscal years beginning with the next odd-numbered fiscal year. The strategic plan includes a mission statement, the core values and behaviors inherent to operations, and a summary of goals and objectives to be achieved through specific projects outlined for the five-year period. The mission of the OPERS Board and staff is to provide and promote accountable and financially sound retirement programs for Oklahoma’s public servants, and the core values and behaviors inherent to agency operations are honesty and integrity, accountability, quality, customer service, teamwork, and workforce development. The summary of goals and objectives outlined in the strategic plan are
Provide prompt and comprehensive customer service Manage the assets of the Plans in a fiscally responsible manner Inform and educate all members to help them identify and meet their retirement goals Maintain a competent and well-trained workforce Achieve and maintain well-funded status to assist the State in paying retirement benefit obligations, and secure
changes in plan design that make the plan easier to understand or more equitable without an undue increase in the retirement system’s liabilities.
Investments
The standard for URSJJ in making investments is to exercise the care, skill, prudence, and diligence under the circumstances then prevailing that a prudent person acting in a like capacity and familiar with such matters would use in the conduct of an
2010 COMPREHENSIVE ANNUAL FINANCIAL REPORT 3
UNIFORM RETIREMENT SYSTEM FOR JUSTICES AND JUDGES
Letter of Transmittal (continued)
enterprise of a like character and unless under the circumstances it is clearly prudent not to do so. Funds of URSJJ are invested solely in the interest of the membership and their beneficiaries, and defraying reasonable expenses of administering URSJJ. The Board has established an investment policy and guidelines that identify asset allocation as the key determinant of return and diversification, both by and within asset classes, as the primary risk control element. Passive fund portfolios are considered to be suitable investment strategies, especially in highly efficient markets.
The Board engages outside investment managers to manage the various investment allocations of URSJJ. At fiscal year end, the investment portfolio of URSJJ was actively managed by three fixed income managers and passively managed by another investment manger with holdings in fixed income index, domestic equity index and international equity index funds.
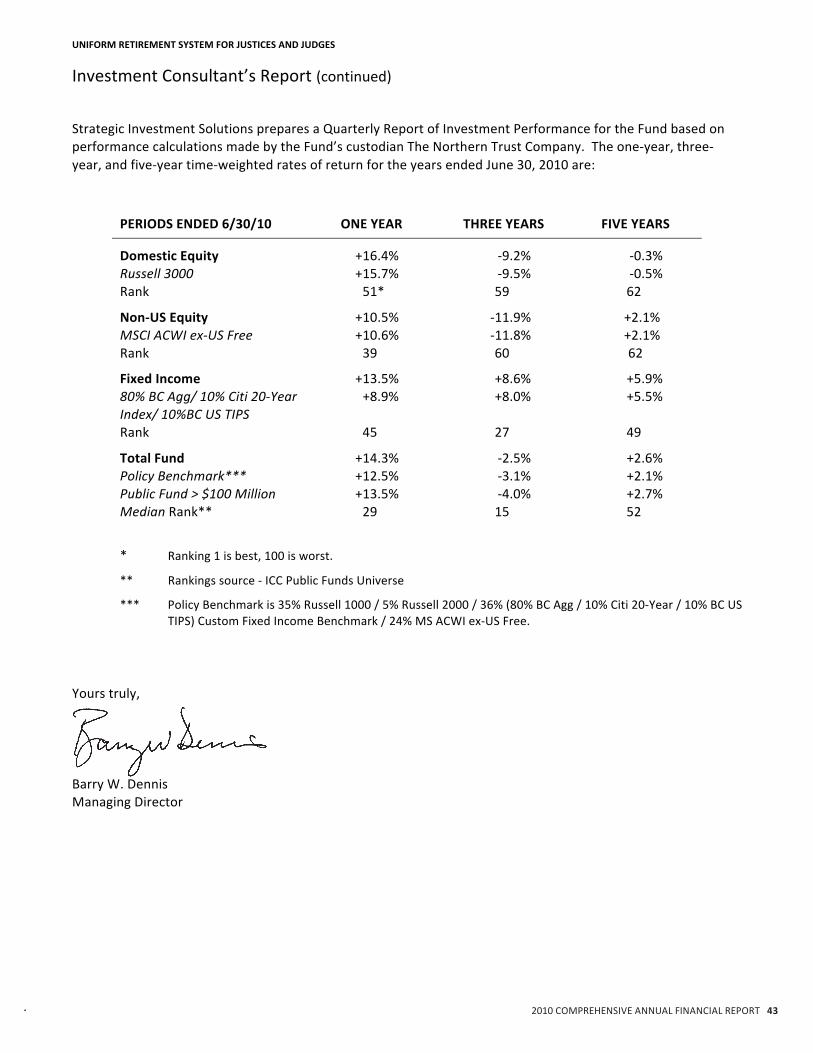
Included in the Investment Section of this report are a summary of the Investment Portfolio by Type and Manager and a comparison of the above amounts to the target allocations, as shown in the Asset Comparison chart. For fiscal year 2010, investments provided a 14.3 percent rate of return. The annualized rate of return for URSJJ was negative 2.5 percent over the last three years and 2.6 percent over the last five years.
Funding
A pension fund is well funded when it has enough money in reserve to meet all expected future obligations to participants. It must also have a revenue source sufficient to keep up with future obligations. The funding objective for URSJJ is to meet long-term benefit promises through contributions that remain approximately level as a percent of member payroll. The greater the level of funding, the larger the ratio of assets accumulated to the actuarial accrued liability and the greater the level of investment potential. The advantage of a well-funded plan is that the participants can look at assets that are committed to the payment of benefits. The actuarial accrued liability and actuarial value of assets as of July 1, 2010 amounted to $282.8 million and $230.0 million, respectively.
The URSJJ funded ratio has been steadily declining for the past eight years, falling below 100 percent for the first time at June 30, 2007 and declining further to 81.3 percent at June 30, 2010. It was 148.2 percent at June 30, 2002. In part this decline is due to an employer contribution rate decrease in January 2001 and the lifting of the salary cap for benefit calculation for the past seven years. Changes have been made to address the decline of the funding ratio. Effective July 1, 2005 the employer rate was increased 1.0 percent annually for two years, and at July 1, 2007 it was increased 1.5 percent annually up to 22.0 percent for fiscal years ending 2019 and thereafter. However, based on a projection model prepared by the URSJJ actuary, the scheduled increases in the statutory contribution rate are not expected to be sufficient to reach the actuarial contribution rate before the end of the amortization period of the unfunded actuarial accrued liability, even if all the actuarial assumptions are met in future years. In 2006 the Legislature provided a statutory requirement that retirement bills be analyzed for actuarial fiscal impact and contain adequate funding sources sufficient to pay the cost of the change. In the session ended May 2009 the Legislature designated $6.0 million in the Supreme Court’s Management Information System Fund to pay employer contributions to the Plan in fiscal year 2010. A detailed discussion of funding is provided in the Actuarial Section of this report.
Funded Ratio
70%80%90%
100%110%120%130%140%150%160%
2001 2002 2003 2004 2005 2006 2007 2008 2009 2010
4 2010 COMPREHENSIVE ANNUAL FINANCIAL REPORT
UNIFORM RETIREMENT SYSTEM FOR JUSTICES AND JUDGES
Letter of Transmittal (continued)
Awards and Acknowledgements
The Government Finance Officers Association (GFOA) awarded a Certificate of Achievement for Excellence in Financial Reporting to the Uniform Retirement System for Justices and Judges for its comprehensive annual financial report (CAFR) for the fiscal year ended June 30, 2009. This was the twelfth year URSJJ has received this prestigious award. In order to be awarded a Certificate of Achievement, a government unit must publish an easily readable and efficiently organized comprehensive annual financial report that satisfies both generally accepted accounting principles and applicable legal requirements.
A Certificate of Achievement is valid for a period of one year only. We believe our current report continues to conform to the Certificate of Achievement program requirements, and we are submitting it to GFOA to determine its eligibility for another certificate.
The preparation of this report would not have been possible without the efficient and dedicated service of the entire staff of OPERS. We wish to express our appreciation to all staff members who assisted and contributed to the preparation of this report. Credit also must be given to the Board of Trustees for their unfailing support for maintaining the highest standards of professionalism in the financial management of the Uniform Retirement System for Justices and Judges.
Respectfully submitted,
Tom Spencer Susan Reed Executive Director Chief Financial Officer and Director of Finance
2010 COMPREHENSIVE ANNUAL FINANCIAL REPORT 5
UNIFORM RETIREMENT SYSTEM FOR JUSTICES AND JUDGES
Chairman’s Letter Uniform Retirement System for Justices and Judges P.O. Box 53007 Oklahoma City, Oklahoma 73152-30077
800.733.7008 toll-free 405.848.5946 fax
November 30, 2010
Dear Members:
On behalf of the Board of Trustees, I am pleased to present the Comprehensive Annual Financial Report for the Uniform Retirement System for Justices and Judges (URSJJ) for the fiscal year ending June 30, 2010.
This report is designed to provide a detailed look at the financial, investment and actuarial aspects of the System, which continues to be a strong retirement system.
You are encouraged to carefully review this report, as it contains a wealth of information about your retirement system. If you have questions or comments, please feel free to contact us. We can be reached at PO Box 53007, Oklahoma City, Oklahoma 73152-3007. Our telephone number is 405-858-6737 (or toll-free 1-800-733-9008).
I also want to thank the staff for their diligent work in preparing this report and their commitment to continually improve the administrative operations necessary to operate your retirement system.
Sincerely,
Don Kilpatrick Chairman
6 2010 COMPREHENSIVE ANNUAL FINANCIAL REPORT
Board of Trustees
Don KilpatrickChairman
Appointee of the PresidentPro Tempore of the Senate
Steve ParisVice Chairman
Appointee of the Governor
Frank Stone Designee of the State
Insurance Commissioner, Kim Holland
DeWayne McAnallyAppointee of the Governor
Brian MaddyAppointee of the PresidentPro Tempore of the Senate
Jeff CloudMember of Corporation
CommissionSelected by Commission
Michael ClingmanDirector of State Finance
Michael D. EvansAppointee of the Supreme Court
Richard HauglandAppointee of the
Speaker of the House of Representatives
Oscar B. Jackson, Jr.Administrator
Office of Personnel ManagementEx Officio
Jerry JohnsonMember Oklahoma
Tax CommissionSelected by Commission
Dawn CashAppointee of the Speaker
of the House of Representatives
Jonathan Barry FormanAppointee of the Governor
2010 COMPREHENSIVE ANNUAL FINANCIAL REPORT 7
Organizational Structure
Back Row: Ray Pool, Linda Webb, Tom Spencer, Joe Fox, and Susan Reed. Front row: Brad Tillberg, Kathy McCraw, Garry McCoy, Rebecca Catlett and Patrick Lane.
Advisors and Consultants*Master Custodian
The Northern Trust CompanyChicago, Illinois
*The Schedules of Investment Expenses and Professional/Consultant Fees in the Financial Section provide more information regarding advisors and consultants.
Board Of Trustees
Advisors &Consultants
Tom SpencerEXECUTIVE DIRECTOR
Joseph A. FoxGENERAL COUNSEL
Kathy McCrawASSISTANT CFO
FinancialServices
ADMINISTRATOR
MemberServices
Ray PoolADMINISTRATOR
Patrick LaneDIRECTOR
& Customer Contact
Susan ReedDIRECTOR
OF FINANCEAND CFO
Linda WebbDIRECTOR OF
MEMBER SERVICES
Garry McCoyDIRECTOR OF
INFORMATION TECHNOLOGY
Brad TillbergCHIEF INVESTMENT
OFFICER
Investment ConsultantStrategic Investment Solutions, Inc.
San Francisco, California
Actuarial ConsultantMilliman, Inc.
Omaha, Nebraska
Independent AuditorsCole & Reed, P.C.
Oklahoma City, Oklahoma
Internal AuditorsFinley & Cook PLLC
Shawnee, Oklahoma
8 2010 COMPREHENSIVE ANNUAL FINANCIAL REPORT
UNIFORM RETIREMENT SYSTEM FOR JUSTICES AND JUDGES
2010 Legislation
Senate Bill 1889 Revocation of Board’s Authority to Adjust Contribution Rates
The Board’s authority to establish and adjust the employer contribution rate annually was revoked effective July 1, 2010. Under prior law, the Board was authorized to adjust the employer contribution rate to prevent a funded ratio below the target of “at or near” ninety percent.
2010 COMPREHENSIVE ANNUAL FINANCIAL REPORT 9
UNIFORM RETIREMENT SYSTEM FOR JUSTICES AND JUDGES
10 2010 COMPREHENSIVE ANNUAL FINANCIAL REPORT
This page intenti onally left blank.
UNIFORM RETIREMENT SYSTEM FOR JUSTICES AND JUDGES
FINANCIAL SECTIONFirst National Center Oklahoma City, Oklahoma
Designed by Weary and Alford Company of Chicago and opened in 1931, the “First National
Bank Building” was the fourth tallest building west of the Mississippi River standing at 33
storeys and 446 feet tall upon completion. A testament to the upward mobility of construction
in America, First National is currently the sixth tallest building in the state of Oklahoma.
The Neoclassical, Art Deco design of the interior and exterior has a notable resemblance
to the Empire State Building incorporating polished aluminum, granite, glass and marble.
Unique features of the building include: murals depicting the history of Oklahoma in the
corners of the bank lobby; designed cast-aluminum nudes, foliage and birds; and, the
distinctive night lighting of the upper storeys.
A 14-storey office building was completed in September 1957 on the east side of the tower,
and an adjoining 14-storey annex was added, creating what is now known as the First
National Center complex.
First National Center Oklahoma City, Oklahoma
2010 COMPREHENSIVE ANNUAL FINANCIAL REPORT 11
Independent Auditors’ Report
Board of TrusteesUniform Retirement System for Justices and Judges:
We have audited the accompanying statements of plan net assets of the Uniform Retirement System for Justices andJudges (the Plan), a component unit of the state of Oklahoma, as of June 30, 2010 and 2009, and the related statements ofchanges in plan net assets for the years then ended. These financial statements are the responsibility of the Plan’smanagement. Our responsibility is to express an opinion on these financial statements based on our audits.
We conducted our audits in accordance with auditing standards generally accepted in the United States of America and thestandards applicable to financial audits contained in Government Auditing Standards, issued by the Comptroller General ofthe United States of America. Those standards require that we plan and perform the audit to obtain reasonable assuranceabout whether the financial statements are free of material misstatement. An audit includes examining, on a test basis,evidence supporting the amounts and disclosures in the financial statements. An audit also includes assessing theaccounting principles used and significant estimates made by management, as well as evaluating the overall financialstatement presentation. We believe that our audits provide a reasonable basis for our opinion.
In our opinion, the financial statements referred to above present fairly, in all material respects, the net assets of the Planat June 30, 2010 and 2009, and the changes in its net assets for the years then ended, in conformity with accountingprinciples generally accepted in the United States of America.
Management’s Discussion and Analysis and the schedules of funding progress and employers’ contributions in schedule 1are not a required part of the basic financial statements but are supplementary information required by accountingprinciples generally accepted in the United States of America. We have applied certain limited procedures, which consistedprincipally of inquiries of management regarding the methods of measurement and presentation of the requiredsupplementary information. However, we did not audit the information and express no opinion on it.
Our audits were made for the purpose of forming an opinion on the basic financial statements taken as a whole. TheIntroductory Section, the Investment Section, the Actuarial Section, the Statistical Section, the Addendum and schedules 2through 4 are presented for purposes of additional analysis and are not a required part of the basic financial statements.The supplementary information in schedules 2 through 4 has been subjected to the auditing procedures applied in theaudits of the basic financial statements and, in our opinion, is fairly stated in all material respects in relation to the basicfinancial statements taken as a whole. The Introductory Section, the Investment Section, the Actuarial Section, theStatistical Section and the Addendum have not been subjected to the auditing procedures applied in the audits of the basicfinancial statements and, accordingly, we express no opinion on them.
Oklahoma City, OklahomaOctober 21, 2010
UNIFORM RETIREMENT SYSTEM FOR JUSTICES AND JUDGESAdministered by the Oklahoma Public Employees Retirement System
12 2010 COMPREHENSIVE ANNUAL FINANCIAL REPORT
UNIFORM RETIREMENT SYSTEM FOR JUSTICES AND JUDGESAdministered by the Oklahoma Public Employees Retirement System
Management’s Discussion and AnalysisAs management of the Uniform Retirement System for Justices and Judges (the Plan) we offer readers of the Plan’s financialstatements this narrative overview and analysis of the financial activities of the Plan for the fiscal years ended June 30, 2010and 2009.
Financial Highlights
The net assets held in trust for pension benefits totaled approximately $211.2 million at June 30, 2010 compared to$184.6 million at June 30, 2009 and $225.9 million at June 30, 2008. The net assets are available for payment ofmonthly retirement benefits and other qualified distributions to the Plan’s participants. The increase of $26.6 millionand decrease of $41.3 million of the respective years have resulted primarily from the changes in the fair value of thePlan’s investments due to volatile equity markets.At June 30, 2010 the total number of members participating in the Plan was 493 compared to 487 at June 30, 2009 and483 at June 30, 2008. The total number of retirees was 210 and 200 at June 30, 2010 and 2009 showing a 5.0% and2.6% increase for each respective year. At June 30, 2008 the total number of retirees was 195.At June 30, 2010 the actuarial value of assets was $230.0 million, and the actuarial accrued liability was $52.8 millionproducing a funded ratio of 81.3% compared to 84.8% at June 30, 2009. The key items responsible for the change in thefunded status were a liability loss of $0.6 million which resulted in an actuarial accrued liability that was higher thanexpected and the effect ($2.1 million) of contributions of less than the actuarial rate. These were offset by a return onactuarial value of assets of 4.0%. The funded ratio at June 30, 2008 was 96.4%.
Overview of the Financial Statements
The Plan is a single employer, public employee retirement plan, which is a defined benefit pension plan. The Plan covers allJustices and Judges of the Oklahoma Supreme Court, Court of Criminal Appeals, Workers’ Compensation Court, Court ofAppeals, and District Courts. Benefits are determined at 4% of the average monthly compensation received as a justice orjudge based on the highest thirty six months of compensation multiplied by the number of years of credited service, not toexceed 100% of the retiree’s average monthly salary received as a justice and judge for the highest thirty six months ofcompensation. Normal retirement ages under the Plan are 60 with 10 years of judicial service, 65 with 8 years of judicialservice or when the sum of the member’s age and years of credited service equals or exceeds 80 (Rule of 80). Membersbecome eligible to vest fully upon termination of employment after attaining eight years of service as a justice or judge orthe members’ contributions may be withdrawn upon termination of employment.
The Plan’s financial statements are comprised of a Statement of Plan Net Assets, a Statement of Changes in Plan Net Assets,and Notes to Financial Statements. Also included is certain required supplementary and supplementary information.
The Plan is a component unit of the state of Oklahoma (the State) and is administered by the Oklahoma Public EmployeesRetirement System, a component unit of the State, which together with the Plan and other similar funds comprise thefiduciary pension trust funds of the State.
The statement of plan net assets presents information on the Plan’s assets and liabilities and the resulting net assets held intrust for pension benefits. This statement reflects the Plan’s investments, at fair value, along with cash and cash equivalents,receivables and other assets and liabilities.
The statement of changes in plan net assets presents information showing how the Plan’s net assets held in trust forpension benefits changed during the years ended June 30, 2010 and 2009. It reflects contributions by members andparticipating employers along with deductions for retirement benefits, refunds and withdrawals, and administrative
2010 COMPREHENSIVE ANNUAL FINANCIAL REPORT 13
UNIFORM RETIREMENT SYSTEM FOR JUSTICES AND JUDGESAdministered by the Oklahoma Public Employees Retirement System
Management’s Discussion and Analysis (continued)
expenses. Investment income during the period is also presented showing income from investing and securities lendingactivities.
The notes to financial statements provide additional information that is essential to a full understanding of the dataprovided in the financial statements.
The required supplementary information presents a schedule of funding progress and a schedule of employer contributions.Schedules of certain expenses and fees paid are presented as supplementary information.
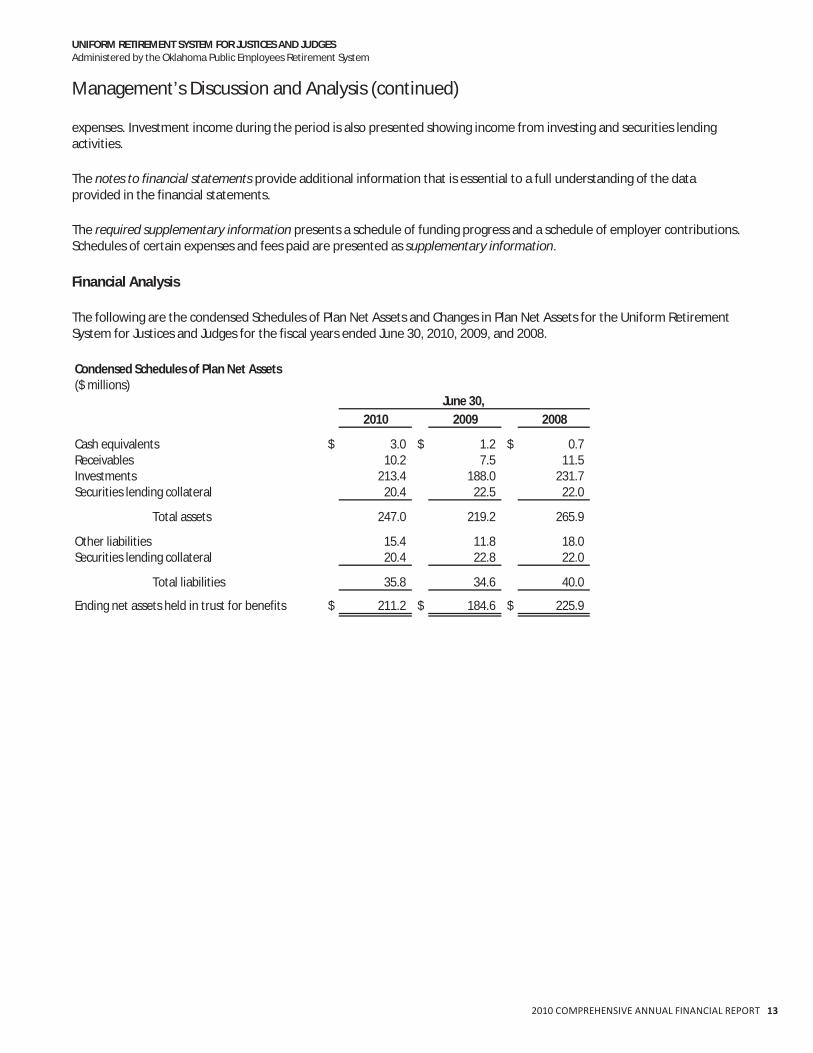
Financial Analysis
The following are the condensed Schedules of Plan Net Assets and Changes in Plan Net Assets for the Uniform RetirementSystem for Justices and Judges for the fiscal years ended June 30, 2010, 2009, and 2008.
Condensed Schedules of Plan Net Assets($ millions)
Other liabilities 15.4 11.8 18.0Securities lending collateral 20.4 22.8 22.0
Total liabilities 35.8 34.6 40.0
Ending net assets held in trust for benefits $ 211.2 $ 184.6 $ 225.9
14 2010 COMPREHENSIVE ANNUAL FINANCIAL REPORT
UNIFORM RETIREMENT SYSTEM FOR JUSTICES AND JUDGESAdministered by the Oklahoma Public Employees Retirement System
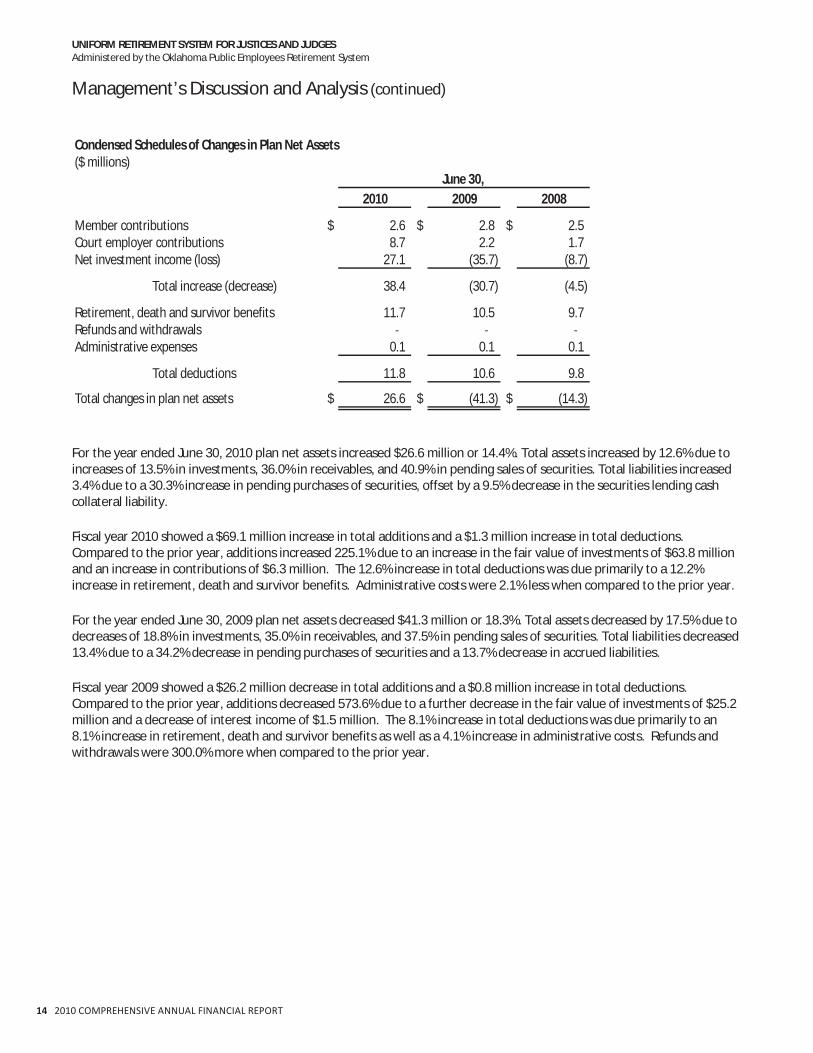
Management’s Discussion and Analysis (continued)
Condensed Schedules of Changes in Plan Net Assets($ millions)
June 30,2010 2009 2008
Member contributions $ 2.6 $ 2.8 $ 2.5Court employer contributions 8.7 2.2 1.7Net investment income (loss) 27.1 (35.7) (8.7)
Total increase (decrease) 38.4 (30.7) (4.5)
Retirement, death and survivor benefits 11.7 10.5 9.7Refunds and withdrawalsAdministrative expenses 0.1 0.1 0.1
Total deductions 11.8 10.6 9.8
Total changes in plan net assets $ 26.6 $ (41.3) $ (14.3)
For the year ended June 30, 2010 plan net assets increased $26.6 million or 14.4%. Total assets increased by 12.6% due toincreases of 13.5% in investments, 36.0% in receivables, and 40.9% in pending sales of securities. Total liabilities increased3.4% due to a 30.3% increase in pending purchases of securities, offset by a 9.5% decrease in the securities lending cashcollateral liability.
Fiscal year 2010 showed a $69.1 million increase in total additions and a $1.3 million increase in total deductions.Compared to the prior year, additions increased 225.1% due to an increase in the fair value of investments of $63.8 millionand an increase in contributions of $6.3 million. The 12.6% increase in total deductions was due primarily to a 12.2%increase in retirement, death and survivor benefits. Administrative costs were 2.1% less when compared to the prior year.
For the year ended June 30, 2009 plan net assets decreased $41.3 million or 18.3%. Total assets decreased by 17.5% due todecreases of 18.8% in investments, 35.0% in receivables, and 37.5% in pending sales of securities. Total liabilities decreased13.4% due to a 34.2% decrease in pending purchases of securities and a 13.7% decrease in accrued liabilities.
Fiscal year 2009 showed a $26.2 million decrease in total additions and a $0.8 million increase in total deductions.Compared to the prior year, additions decreased 573.6% due to a further decrease in the fair value of investments of $25.2million and a decrease of interest income of $1.5 million. The 8.1% increase in total deductions was due primarily to an8.1% increase in retirement, death and survivor benefits as well as a 4.1% increase in administrative costs. Refunds andwithdrawals were 300.0% more when compared to the prior year.
2010 COMPREHENSIVE ANNUAL FINANCIAL REPORT 15
UNIFORM RETIREMENT SYSTEM FOR JUSTICES AND JUDGESAdministered by the Oklahoma Public Employees Retirement System
Management’s Discussion and Analysis (continued)
Additions to Plan Net Assets
For the year ended June 30, 2010, additions to plan assets increased $69.1 million or 225.1% from the prior year. Theappreciation in the fair value of investments of $63.8 million is reflective of the rise in all markets for the year. Interestincome decreased $1.0 million or 26.7% as a result of falling interest rates, and securities lending income increased $182.0million or 121.9% due only to the elimination of the securities lending collateral deficiency incurred in the prior year.Contributions increased $6.3 million or 125.2% because of an increase in the employer contribution rate from7.0% to 8.5%,and a $6.0 million appropriation by the State Legislature designated as employer contributions.
Additions to Plan Net AssetsComparative Data for Fiscal Years Ended June 30, 2010, 2009, and 2008(in $000's)
$(50,000)
$(40,000)
$(30,000)
$(20,000)
$(10,000)
$
$10,000
$20,000
$30,000
Member contributions $2,599 $2,775 $2,486
Court employer contributions 8,704 2,244 1,689
Net appreciation (depreciation) 24,391 (39,397) (14,167)
Interest, dividends, and otherinvestment income
2,832 3,901 5,399
Investment expenses (139) (96) (129)
Securities lending income (loss) 33 (149) 161
2010 2009 2008
For the year ended June 30, 2009, additions to plan assets decreased $26.2 million or 573.6% from the prior year. Thedepreciation in the fair value of investments of an additional $25.2 million to the depreciation of $14.2 million in FY2008 isreflective of the decline in the U.S. and non U.S. equity markets. Interest income decreased $1.5 million or 28.0% as a resultof falling interest rates, and securities lending income decreased $0.3 million or 192.7% due to a securities lending collateraldeficiency of $0.3 million in fiscal 2009. Contributions increased $0.8 million or 20.2% because of an increased salary basefor calculation and an increase in the employer contribution rate from 5.5% to 7.0%.
16 2010 COMPREHENSIVE ANNUAL FINANCIAL REPORT
UNIFORM RETIREMENT SYSTEM FOR JUSTICES AND JUDGESAdministered by the Oklahoma Public Employees Retirement System
Management’s Discussion and Analysis (continued)
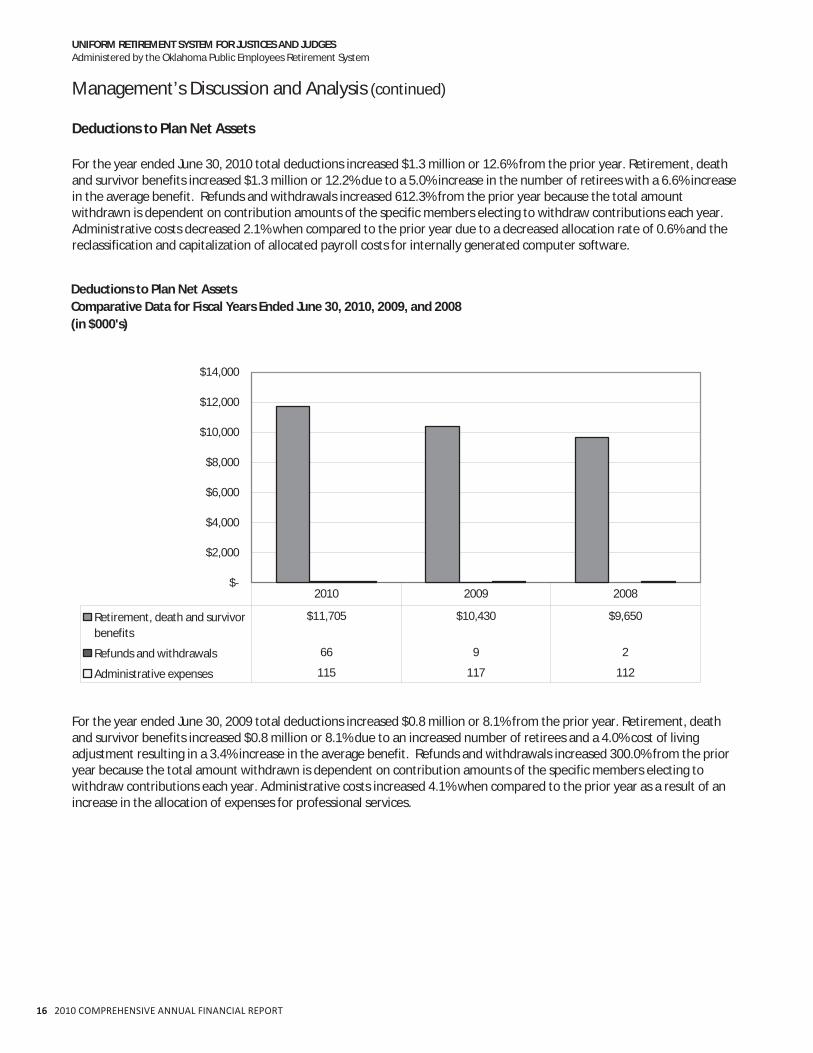
Deductions to Plan Net Assets
For the year ended June 30, 2010 total deductions increased $1.3 million or 12.6% from the prior year. Retirement, deathand survivor benefits increased $1.3 million or 12.2% due to a 5.0% increase in the number of retirees with a 6.6% increasein the average benefit. Refunds and withdrawals increased 612.3% from the prior year because the total amountwithdrawn is dependent on contribution amounts of the specific members electing to withdraw contributions each year.Administrative costs decreased 2.1% when compared to the prior year due to a decreased allocation rate of 0.6% and thereclassification and capitalization of allocated payroll costs for internally generated computer software.
Deductions to Plan Net AssetsComparative Data for Fiscal Years Ended June 30, 2010, 2009, and 2008(in $000's)
$
$2,000
$4,000
$6,000
$8,000
$10,000
$12,000
$14,000
Retirement, death and survivorbenefits
$11,705 $10,430 $9,650
Refunds and withdrawals 66 9 2
Administrative expenses 115 117 112
2010 2009 2008
For the year ended June 30, 2009 total deductions increased $0.8 million or 8.1% from the prior year. Retirement, deathand survivor benefits increased $0.8 million or 8.1% due to an increased number of retirees and a 4.0% cost of livingadjustment resulting in a 3.4% increase in the average benefit. Refunds and withdrawals increased 300.0% from the prioryear because the total amount withdrawn is dependent on contribution amounts of the specific members electing towithdraw contributions each year. Administrative costs increased 4.1% when compared to the prior year as a result of anincrease in the allocation of expenses for professional services.
2010 COMPREHENSIVE ANNUAL FINANCIAL REPORT 17
UNIFORM RETIREMENT SYSTEM FOR JUSTICES AND JUDGESAdministered by the Oklahoma Public Employees Retirement System
Management’s Discussion and Analysis (continued)
Investments
The investment portfolio is reported in the chart below by the asset class of the investment managers’ portfolios whichincludes the cash equivalents in those portfolios. A summary of the Plan’s cash equivalents and investments for fiscal yearsended June 30, 2010, 2009, and 2008 is as follows:
Cash Equivalents and Investments($ millions) June 30,
Cash equivalents on deposit with State 0.1 0.1 0.1Securities lending collateral 20.4 22.5 22.0
Total cash equivalentsand investments $ 236.8 $ 211.8 $ 254.4
The increase in the Plan’s managed investments is reflective of the increase in all markets for the year. The Plan’s overallreturn for the year ended June 30, 2010 was 14.3%. A 13.5% return for the fixed income component exceeded the markettrend for the asset class. Equity index funds correlated closely with market trends with U.S. and international equitiesshowing returns of 16.4% and 10.5% respectively. Fixed income holdings were increased by $6.0 million during the yeardue to reallocations of $3.5 million from the international equity index fund and $2.5 million from the domestic equityindex funds. Another $1.9 million of U.S. equity index funds and $4.8 million of fixed income were used to supplement thecash requirements of monthly retiree benefit payments. The change in securities lending collateral is dependent on thesecurities loaned by the Plan’s master custodian at year end.
At June 30, 2010 the distribution of the Plan’s investments including accrued income and pending trades was as follows:
2010
Other0.2%
Fixed Income38.1%
U.S. Equities39.5%
InternationalEquities22.2%
18 2010 COMPREHENSIVE ANNUAL FINANCIAL REPORT
UNIFORM RETIREMENT SYSTEM FOR JUSTICES AND JUDGESAdministered by the Oklahoma Public Employees Retirement System
Management’s Discussion and Analysis (continued)
For the year ended June 30, 2009 the reduction in the Plan’s managed investments is reflective of the decline in the equitymarkets. The Plan’s overall return was a negative 15.7%. A 3.8% return for the fixed income component fell short of themarket trend for the asset class. Equity index funds correlated closely with market trends with U.S. and internationalequities showing negative returns of 26.4% and 31.0% respectively. Fixed income holdings were reduced approximately$13.5 million as $8.5 million was reallocated to the domestic equity index fund and $5.0 million to the international equityindex fund. Another $5.4 million was used during the year to supplement the cash requirements of monthly retiree benefitpayments. The change in securities lending collateral is dependent on the securities loaned by the Plan’s master custodianat year end. In FY2009 the asset value was reduced by the securities lending collateral deficiency.
At June 30, 2009 the distribution of the Plan’s investments including accrued income and pending trades and excluding thesecurities lending collateral deficiency was as follows:
2009
U.S. Equities40.1%
InternationalEquities22.4%
Other0.3%
Fixed Income37.2%
Economic Factors
Funding
A measure of the adequacy of a pension’s funding status is when it has enough money in reserve to meet all expectedfuture obligations to participants. The funded ratios of the Plan at June 30 for the current and preceding two years were asfollows:
2010 2009 200881.3% 84.8% 96.4%
Plan Amendment
A Plan provision change was enacted by the State Legislature during the session ended in May 2010. The Board’s authorityto adjust the employer contribution rate annually was revoked effective July 1, 2010.
2010 COMPREHENSIVE ANNUAL FINANCIAL REPORT 19
UNIFORM RETIREMENT SYSTEM FOR JUSTICES AND JUDGESAdministered by the Oklahoma Public Employees Retirement System
Management’s Discussion and Analysis (continued)
Other
Other than changes in the fair value of Plan assets as may be impacted by the equity and bond markets and changes in thePlan provisions that may have an effect on the actuarial liability, no other matters are known by management to have asignificant impact on the operations or financial position of the Plan.
Requests for Information
This financial report is designed to provide a general overview of the Plan’s finances for all those with an interest. Questionsconcerning any of the information provided in this report or requests for additional financial information should beaddressed to the Financial Reporting Division, OPERS, P.O. Box 53007, Oklahoma City, Oklahoma 73152 3007.
20 2010 COMPREHENSIVE ANNUAL FINANCIAL REPORT
UNIFORM RETIREMENT SYSTEM FOR JUSTICES AND JUDGESAdministered by the Oklahoma Public Employees Retirement System
Statements of Plan Net AssetsJune 30, 2010 and 2009
Net assets held in trust for pension benefits $ 211,180,555 $ 184,646,816
See accompanying notes to financial statements.
2010 COMPREHENSIVE ANNUAL FINANCIAL REPORT 21
UNIFORM RETIREMENT SYSTEM FOR JUSTICES AND JUDGESAdministered by the Oklahoma Public Employees Retirement System
Statements of Changes in Plan Net AssetsJune 30, 2010 and 2009
Additions: 2010 2009
Contributions:
Members $ 2,599,341 $ 2,774,837
Participating court employers 8,704,232 2,243,701
Total contributions 11,303,573 5,018,538
Investment income (loss):
From investing activities:
Net appreciation (depreciation) in fair value of investments 24,390,695 (39,396,611)
Interest 2,832,603 3,862,007
Dividends — 5,208
Other — 34,594
Total investment income (loss) 27,223,298 (35,494,802)
Less – Investment expenses (139,481) (95,588)
Income (loss) from investing activities 27,083,817 (35,590,390)
From securities lending activities:
Securities lending income 75,763 327,823
Securities lending collateral unrealized loss — (286,903)
Borrower rebates (35,605) (162,471)
Management fees (7,493) (27,747)
Income (loss) from securities lending activities 32,665 (149,298)
Net investment income (loss) 27,116,482 (35,739,688)
Total increase (decrease) 38,420,055 (30,721,150)
Deductions:
Retirement, death and survivor benefits 11,705,265 10,430,301
Refunds and withdrawals 66,389 9,321
Administrative expenses 114,662 117,081
Total deductions 11,886,316 10,556,703
Net increase (decrease) 26,533,739 (41,277,853)
Net assets held in trust for pension benefits:
Beginning of year 184,646,816 225,924,669
End of year $ 211,180,555 $ 184,646,816
See accompanying notes to financial statements.
22 2010 COMPREHENSIVE ANNUAL FINANCIAL REPORT
UNIFORM RETIREMENT SYSTEM FOR JUSTICES AND JUDGESAdministered by the Oklahoma Public Employees Retirement System
Notes to Financial StatementsJune 30, 2010 and 2009
(1) Summary of Significant Accounting Policies
The following are the significant accounting policies followed by the Uniform Retirement System for Justices andJudges (the Plan).
(a) Basis of Accounting
The financial statements are prepared using the economic resources measurement focus and the accrual basisof accounting under which expenses are recorded when the liability is incurred, revenues are recorded in theaccounting period in which they are earned and become measurable, and investment purchases and sales arerecorded as of their trade dates. Member and employer contributions are established by statute as apercentage of salaries and are recognized when due, pursuant to formal commitments, as well as statutory orcontractual requirements. Benefits and refunds are recognized when due and payable in accordance with theterms of the Plan.
The Plan, together with other similar fiduciary – pension trust funds of the state of Oklahoma (the State), is acomponent unit of the State. The Plan is administered by the Oklahoma Public Employees Retirement System(OPERS). As set forth in Title 20 of the Oklahoma Statutes, at Section 1108, a portion of the administrativeoverhead expenses, including personnel and other supporting services costs, which are paid for by a separateretirement fund also administered by OPERS, are allocated to the Plan. The allocation is based on OPERS’estimate of the cost of services provided to the Plan by the separate fund. Allocated costs are charged to thePlan and paid with funds provided through operations of the Plan.
(b) Investments
The Plan is authorized to invest in eligible investments as approved by the Board of Trustees of OPERS (theBoard) as set forth in its investment policy.
Plan investments are reported at fair value. Short term investments include bills and notes and commercialpaper, valued at fair value.
Domestic debt and equity securities are reported at fair value, as determined by the Plan’s custodial agent,generally based on pricing services or prices quoted by independent brokers. The fair value of the pro ratashare of units owned by the Plan in index and commingled trust funds is determined by the respective fundtrustees based on quoted sales prices of the underlying securities.
Net investment income (loss) includes net appreciation (depreciation) in the fair value of investments, interestincome, securities lending income and expenses, dividend income, and investment expenses, which includesinvestment management and custodial fees and all other significant investment related costs.
The Plan’s investment policy provides for investments in combinations of stocks, bonds, fixed incomesecurities and other investment securities, along with investments in commingled trust and index funds.Investment securities and investment securities underlying the trust and index fund investments are exposedto various risks, such as interest rate and credit risks. Due to the risks associated with certain investment
2010 COMPREHENSIVE ANNUAL FINANCIAL REPORT 23
UNIFORM RETIREMENT SYSTEM FOR JUSTICES AND JUDGESAdministered by the Oklahoma Public Employees Retirement System
Notes to Financial Statements (continued)
securities, it is at least reasonably possible that changes in the values of investment securities may occur in thenear term and those changes could materially affect the amounts reported in the statements of plan netassets.
(c) Use of Estimates
The preparation of the Plan’s financial statements, in conformity with U.S. generally accepted accountingprinciples, requires the Plan administrator to make significant estimates and assumptions that affect thereported amounts of net assets held in trust for pension benefits at the date of the financial statements andthe actuarial information included in Note (5) Funded Status and Actuarial Information and the requiredsupplementary information (RSI) as of the benefit information date, the changes in plan net assets during thereporting period and, when applicable, the disclosures of contingent assets and liabilities at the date of thefinancial statements. Actual results could differ from those estimates.
(d) Risk and Uncertainties
Contributions to the Plan and the actuarial information included in the RSI are reported based on certainassumptions pertaining to interest rates, inflation rates and employee compensation and demographics. Dueto the changing nature of these assumptions, it is at least reasonably possible that changes in theseassumptions may occur in the near term and, due to the uncertainties inherent in setting assumptions, thatthe effect of such changes could be material to the financial statements.
(e) Changes in Accounting Principles
The Plan adopted the provisions of Governmental Accounting Standards Board (GASB) Statements No. 51,Accounting and Financial Reporting for Intangible Assets (Statement No. 51) in 2010. Statement No. 51establishes accounting and financial reporting requirements for intangible assets including easements, waterrights, timber rights, patents, trademarks, and computer software. The adoption of Statement 51 did nothave a material impact on the Plan’s financial statements.
The Plan adopted the provisions of Governmental Accounting Standards Board (GASB) Statements No. 53,Accounting and Financial Reporting for Derivative Instruments (Statement No. 53) in 2010. Statement No. 53establishes accounting and financial reporting requirements for derivative instruments entered into by stateand local governments. The adoption of Statement 53 had an impact on the presentation of the notes to thefinancial statements but no impact on net assets.
(2) Plan Descriptions and Contribution Information
The following brief description of the Plan is provided for general information purposes only. Participants shouldrefer to Title 20 of the Oklahoma Statutes, Sections 1101 through 1111, for more complete information.
(a) General
The Plan is a single employer public employee retirement plan, which is a defined benefit pension plancovering all justices and judges of the Oklahoma Supreme Court, Court of Criminal Appeals, Workers’Compensation Court, Court of Appeals, and District Courts. The supervisory authority for the management andoperation of the Plan is the Board, which acts as a fiduciary for investment of the funds and the application ofPlan interpretation.
24 2010 COMPREHENSIVE ANNUAL FINANCIAL REPORT
UNIFORM RETIREMENT SYSTEM FOR JUSTICES AND JUDGESAdministered by the Oklahoma Public Employees Retirement System
Notes to Financial Statements (continued)
At June 30 the Plan’s membership consisted of
2010 2009
Retirees and beneficiaries currently receiving benefits 210 200Terminated vested participants 12 13Active participants 271 274
Total 493 487
(b) Benefits
Benefits are determined at 4% of the members average monthly compensation for covered active service overthe highest thirty six months of compensation as a justice or judge times the total years of service in the Plannot to exceed 100% of the retiree’s average monthly salary received as a justice or judge for the highest thirtysix months of compensation.
Normal retirement ages under the Plan are as follows:
When the sum of at least 8 years of credited years and age equals or exceeds 80 (Rule of 80)Age 65 with 8 years of judicial serviceAge 60 with 10 years of judicial service
Members are eligible to vest fully upon termination of judicial service after accumulating eight years of judicialservice or the members’ contributions may be withdrawn at the time such member ceases to be a justice orjudge of a court within the Plan. Disability retirement benefits are available for members who have attainedage 55 and have 15 years of continuous judicial service and are determined to be disabled by the Court of theJudiciary. The benefits are calculated in the same manner as the normal retirement benefit. The Court of theJudiciary may override these requirements if it is determined that any judge or justice is no longer capable ofperforming regular duties.
Upon the death of an active member, the Plan will pay to the designated beneficiary the active member’saccumulated employee contributions. However, if the deceased member contributed to survivor benefits, aneligible spouse of the member may choose to vest the member’s service (8 years required) until the spouse iseligible to receive monthly survivor benefits as defined by the Plan.
Upon the death of a retired member, the Plan will pay a $5,000 death benefit to the member’s beneficiary orestate of the member if there is no living beneficiary. The death benefit will be paid in addition to any excessemployee contributions or survivor benefits due to the estate or beneficiary. Death benefits paid for the yearsended June 30, 2010 and 2009 totaled approximately $40,000 and $25,000, respectively.
Surviving spouse benefits are paid to a member’s spouse provided the member makes the requiredcontributions and the spouse qualifies under the Plan provisions. These payments are made monthly over theremaining life of the spouse. If the member has ten years of service and the death is determined by theWorkers’ Compensation Court to be employment related, the benefit is payable immediately to the spouse.Members must have eight years of credited service before their spouses are eligible for normal survivorbenefits. The benefit payment is equal to 50% up to 65% of the normal retirement benefit if certaincontributions and other criteria are met. Effective September 1, 2005 survivor benefits are also available tothe retiree’s designated joint annuitant according to the option elected by the member. The first option givesthe member a reduced lifetime annuity with 50% of the amount paid to the member’s survivor at the
2010 COMPREHENSIVE ANNUAL FINANCIAL REPORT 25
UNIFORM RETIREMENT SYSTEM FOR JUSTICES AND JUDGESAdministered by the Oklahoma Public Employees Retirement System
Notes to Financial Statements (continued)
member’s death. The second option pays the member an even further reduced annuity with the same amountpaid to the survivor after the member’s death.
(c) Contributions
The contribution requirements of the Plan are an established rate determined by the Oklahoma Legislatureand are based on a comparison to an actuarial calculation which is performed to determine the adequacy ofthe contribution rate.
The contribution rate of all justices and judges is 8% of a member’s monthly salary. The member may elect amaximum benefit with no survivor option or one of two types of actuarially reduced retirement benefits thatprovide for a lifetime benefit to be paid to the member’s joint annuitant after the members’ death. Thiselection is available for any judge or justice without regard to marital status. Prior to September 2005 thebasic member contributions were 5% of a member’s monthly salary. Each member of the Plan who wasmarried provided for spousal survivor benefits and contributed at the rate of 8% unless the member’s spouseagreed to waive spousal benefits. Participating court employers are required to contribute monthly apercentage of the gross salaries of the active members of the Plan. The percentages established by theOklahoma Legislature for the years ended June 30, 2010 and 2009 were 8.5% and 7.0%, respectively, ofmember payroll. In addition, funds in the amount of $6,000,000 were designated by the State Legislature topay employer contributions to the Plan in fiscal year 2010 .
Effective for the fiscal year ended June 30, 2011 the employer contribution rate will increase to 10.0% ofpayroll and will increase 1.5% annually up to 22% for fiscal years ending June 30, 2019 and thereafter.
Prior to July 2009 the Board was authorized to adjust the contribution rate to prevent a funded ratio of thePlan of less than 100%. Effective July 1, 2009 the statutory responsibility of the Board was modified to adjustthe employer contribution rate to prevent a funded ratio below the target of “at or near” ninety percent. InMay 2010 legislation was enacted to remove the authority of the Board to adjust the employer contributionrate.
(3) Cash Equivalents
Cash equivalents represent short term investment funds held by the Office of the State Treasurer (State Treasurer)and the Plan’s custodial agent.
At June 30 cash equivalents were
2010 2009Cash equivalents
State Treasurer 64,464$ 77,905$
Custodial agent 2,969,753 1,165,002
Total cash equivalents 3,034,217$ 1,242,907$
Cash is deposited to OK INVEST, an internal investment pool of the State Treasurer with holdings limited toobligations of the U.S. Government, its agencies and instrumentalities, agency senior debt and mortgage backedpass through securities, tri party repurchase agreements, money market mutual funds, collateralized certificates ofdeposit, commercial paper, obligations of state and local governments and State of Israel Bonds. Participants are
26 2010 COMPREHENSIVE ANNUAL FINANCIAL REPORT
UNIFORM RETIREMENT SYSTEM FOR JUSTICES AND JUDGESAdministered by the Oklahoma Public Employees Retirement System
Notes to Financial Statements (continued)
limited to qualifying agencies and funds within the State’s reporting entity, and each participant maintains aninterest in the underlying investments of OK INVEST and shares the risk of loss on the funds in proportion to therespective investment in the funds. The custodial agent cash equivalents consist of temporary investments incommingled trust funds of the Plan’s custodial agent. The funds are composed of high grade money marketinstruments with short maturities. Each participant in the funds shares the risk of loss on the funds in proportion tothe respective investment in the funds.
Deposits are exposed to custodial credit risk if they are not covered by depository insurance and the deposits areuncollateralized, collateralized with securities held by the pledging financial institution, or collateralized withsecurities held by the pledging financial institution’s trust department or agency but not in the depositorgovernment’s name. At June 30, 2010 and 2009 the cash equivalents in OK INVEST and the Plan’s custodial agentcash equivalents were not exposed to custodial credit risk because their existence cannot be evidenced by securitiesthat exist in physical or book entry form.
At June 30, 2010, as a result of outstanding checks, the Plan’s carrying amount in OK INVEST totaled $64,464, and thebank balances totaled $211,946. At June 30, 2009, as a result of outstanding checks, the Plan’s carrying amount in OKINVEST totaled $77,905 and the bank balances totaled $188,264. At June 30, 2010 and 2009 the carrying amounts ofthe Plan’s custodial agent cash equivalents were the same as the bank balances, $2,969,753 and $1,165,002,respectively.
(4) Investments
(a) General
The OPERS Statement of Investment Policy states that the Board believes that Plan assets should be managedin a fashion that reflects the Plan’s unique liabilities and funding resources, incorporating accepted investmenttheory and reliable empirical evidence. Specifically, the Board has adopted the following principles:
Asset allocation is the key determinant of return and, therefore, commitments to asset allocationtargets will be maintained through a disciplined rebalancing program.Diversification, both by and within asset classes, is the primary risk control element.Passive fund portfolios are suitable investment strategies, especially in highly efficient markets. Theseindex funds which are externally managed by professional investment management firms selectedthrough due diligence of the Board are deemed to be actively managed accounts within the meaningof Section 909.1(D) of Title 74 of the Oklahoma Statutes.
At June 30, 2010 and 2009 the asset allocation guidelines established by policy were U.S. equities – 40%,international equities – 24%, and domestic fixed income – 36%. The guidelines also establish minimum andmaximum percentages for each asset class allocation, and when allocations move outside these limits,portfolios are rebalanced.
2010 COMPREHENSIVE ANNUAL FINANCIAL REPORT 27
UNIFORM RETIREMENT SYSTEM FOR JUSTICES AND JUDGESAdministered by the Oklahoma Public Employees Retirement System
Notes to Financial Statements (continued)
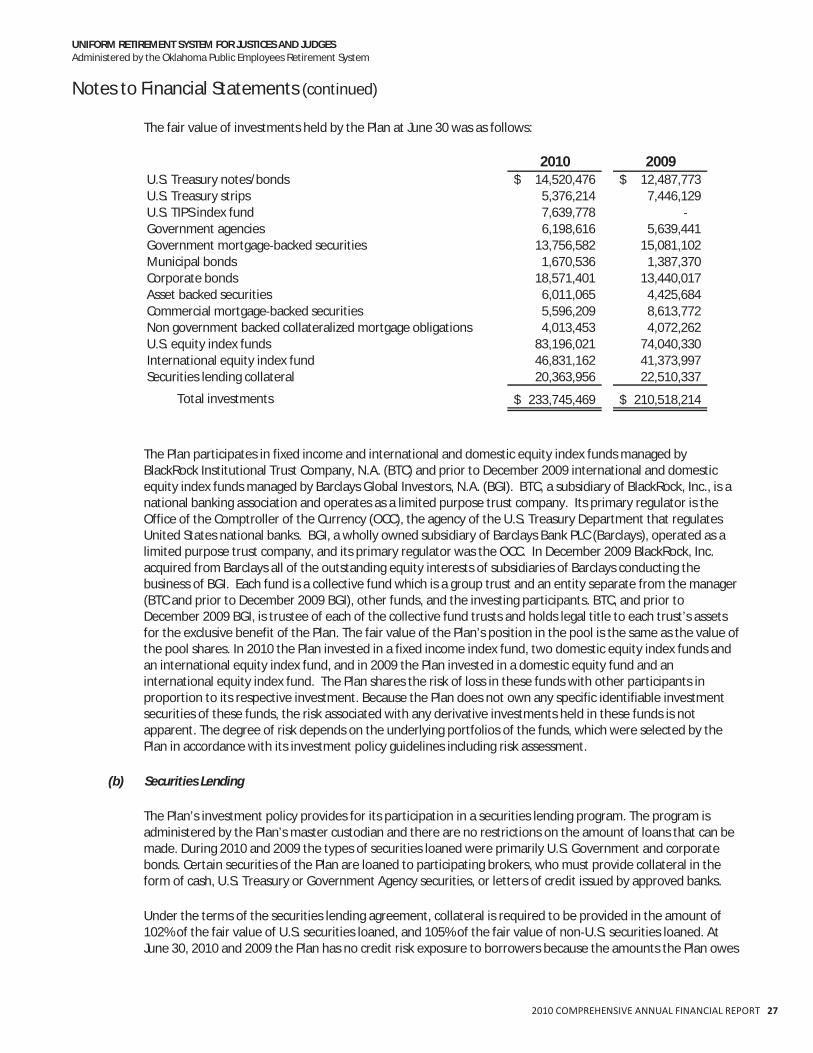
The fair value of investments held by the Plan at June 30 was as follows:
2010 2009U.S. Treasury notes/bonds 14,520,476$ 12,487,773$U.S. Treasury strips 5,376,214 7,446,129U.S. TIPS index fund 7,639,778Government agencies 6,198,616 5,639,441Government mortgage backed securities 13,756,582 15,081,102Municipal bonds 1,670,536 1,387,370Corporate bonds 18,571,401 13,440,017Asset backed securities 6,011,065 4,425,684Commercial mortgage backed securities 5,596,209 8,613,772Non government backed collateralized mortgage obligations 4,013,453 4,072,262U.S. equity index funds 83,196,021 74,040,330International equity index fund 46,831,162 41,373,997Securities lending collateral 20,363,956 22,510,337
Total investments 233,745,469$ 210,518,214$
The Plan participates in fixed income and international and domestic equity index funds managed byBlackRock Institutional Trust Company, N.A. (BTC) and prior to December 2009 international and domesticequity index funds managed by Barclays Global Investors, N.A. (BGI). BTC, a subsidiary of BlackRock, Inc., is anational banking association and operates as a limited purpose trust company. Its primary regulator is theOffice of the Comptroller of the Currency (OCC), the agency of the U.S. Treasury Department that regulatesUnited States national banks. BGI, a wholly owned subsidiary of Barclays Bank PLC (Barclays), operated as alimited purpose trust company, and its primary regulator was the OCC. In December 2009 BlackRock, Inc.acquired from Barclays all of the outstanding equity interests of subsidiaries of Barclays conducting thebusiness of BGI. Each fund is a collective fund which is a group trust and an entity separate from the manager(BTC and prior to December 2009 BGI), other funds, and the investing participants. BTC, and prior toDecember 2009 BGI, is trustee of each of the collective fund trusts and holds legal title to each trust’s assetsfor the exclusive benefit of the Plan. The fair value of the Plan’s position in the pool is the same as the value ofthe pool shares. In 2010 the Plan invested in a fixed income index fund, two domestic equity index funds andan international equity index fund, and in 2009 the Plan invested in a domestic equity fund and aninternational equity index fund. The Plan shares the risk of loss in these funds with other participants inproportion to its respective investment. Because the Plan does not own any specific identifiable investmentsecurities of these funds, the risk associated with any derivative investments held in these funds is notapparent. The degree of risk depends on the underlying portfolios of the funds, which were selected by thePlan in accordance with its investment policy guidelines including risk assessment.
(b) Securities Lending
The Plan’s investment policy provides for its participation in a securities lending program. The program isadministered by the Plan’s master custodian and there are no restrictions on the amount of loans that can bemade. During 2010 and 2009 the types of securities loaned were primarily U.S. Government and corporatebonds. Certain securities of the Plan are loaned to participating brokers, who must provide collateral in theform of cash, U.S. Treasury or Government Agency securities, or letters of credit issued by approved banks.
Under the terms of the securities lending agreement, collateral is required to be provided in the amount of102% of the fair value of U.S. securities loaned, and 105% of the fair value of non U.S. securities loaned. AtJune 30, 2010 and 2009 the Plan has no credit risk exposure to borrowers because the amounts the Plan owes
28 2010 COMPREHENSIVE ANNUAL FINANCIAL REPORT
UNIFORM RETIREMENT SYSTEM FOR JUSTICES AND JUDGESAdministered by the Oklahoma Public Employees Retirement System
Notes to Financial Statements (continued)
the borrowers exceed the amounts the borrowers owe the Plan. The securities on loan at June 30, 2010 and2009 were $19,773,155 and $22,106,533, respectively, and the collateral received for those securities on loanwas $20,363,956 and $22,797,241, respectively. The master custodian provides for full indemnification to thePlan for any losses that might occur in the program due to the failure of a broker to return a security that wasborrowed (and if the collateral is inadequate to replace the securities lent) or failure to pay the Plan forincome of the securities while on loan. The Plan cannot pledge or sell collateral securities unless the borrowerdefaults. The loan premium paid by the borrower of the securities is apportioned between the Plan and itscustodial agent in accordance with the securities lending agreement. All securities loans can be terminated ondemand by either the lender or the borrower.
The securities lending agreement provides that cash collateral be invested in the custodial agent’s short terminvestment pool and sets forth credit quality standards, acceptable investments, diversification standards, andmaturity and liquidity constraints for the investment fund. The Plan’s investment guidelines do not require amatching of investment maturities with loan maturities, but do establish minimum levels of liquidity and otherinvestment restrictions designed to minimize the interest rate risk associated with not matching the maturitiesof the investments with the loans. At June 30, 2010 and 2009 the cash collateral investments had an averageweighted maturity of 24 and 15 days, respectively, and the relationship between the maturities of thecustodial agent’s investment pool and the Plan’s loans is affected by the maturities of the securities loansmade by other entities that use the agent’s pool, which the Plan cannot determine. The Plan’s non cashcollateral is represented by its allocated share of a pool administered by the agent for the Plan and other poolparticipants.
In September 2008 when the market experienced a significant decline and there was a general lack of liquidityin the credit market, certain assets held in the custodial agent’s short term investment cash collateral poolwere deemed to be impaired. The custodial agent re valued many securities held by the securities lendingcash collateral pool resulting in a mark down of the assets and causing the value of the pool to fall below thecommitments owed to the borrowers. The amount of the collateral deficiency was calculated based on thedifference between book value and vended prices (rather than liquidation) at the time, and a liability wasassigned to the Plan based on the Plan’s ratable ownership of the pool. If the Plan should elect to withdrawfrom the securities lending program, the liability would be realized. The impaired assets have beensegregated from the collateral pool into a liquidation account which is valued daily. The Plan owns interest inthe liquidation account rather than having a direct ownership in the impaired securities. At June 30, 2009 thePlan’s liability was $286,903 which approximates the liability initially recorded. The deficiency is reported as asecurities lending collateral unrealized loss on the Statements of Changes in Plan Net Assets and a reduction tothe asset value of securities lending collateral reported on the Statements of Plan Net Assets. In November2009 the custodial agent determined the improving conditions in the economic and financial markets justifiedreducing the Plan’s liability (excluding realized losses and related settlement costs) by approximately seventyseven percent, and in March 2010 the remaining collateral deficiency was reversed, eliminating the liability.
(c) Credit Risk
Credit risk is the risk that an issuer or other counterparty to an investment will not fulfill its obligations.
The Plan’s investment guidelines provide for the domestic fixed income managers to follow one of threeinvestment styles and specify quality guidelines for each.
The Core manager will invest in a broadly diversified portfolio with characteristics similar to a broad fixedincome market index such as the Barclays Capital Aggregate Bond Index. The total portfolio minimum qualityshould be A as rated by Standard and Poor’s Corporation (S&P). The portfolio should be made up ofinvestment grade securities only, with a minimum quality rating for any issue of BBB (S&P) or its equivalent
2010 COMPREHENSIVE ANNUAL FINANCIAL REPORT 29
UNIFORM RETIREMENT SYSTEM FOR JUSTICES AND JUDGESAdministered by the Oklahoma Public Employees Retirement System
Notes to Financial Statements (continued)
rating by at least one Nationally Recognized Statistical Rating Organization (NASRO). In the event that a creditrating is downgraded below this minimum, the investment manager shall immediately notify OPERS staff andprovide an evaluation and recommended course of action.
The Core plus manager will invest in a broadly diversified portfolio with characteristics similar to the Coremanager and will add a “plus” of limited exposure to high yield. The total portfolio minimum quality should beA as rated by S&P. No more than 20% of the portfolio shall be in non investment grade issues. The minimumquality rating for any issue is B (S&P) or its equivalent rating by at least one NASRO and no more than 5% of aportfolio shall be invested in issues rated below BB (S&P) or its equivalent rating by at least one NASRO. In theevent that a credit rating is downgraded below this minimum, the investment manager shall immediatelynotify OPERS staff and provide an evaluation and recommended course of action.
The Interest Rate Anticipator manager follows a style that seeks to correctly forecast the long term trend ininterest rates and adjust the portfolio duration accordingly. The total portfolio minimum quality should be A asrated by S&P, and the portfolio should be made up of investment grade securities only.
At June 30, 2010 the domestic fixed income portfolio consisted of a core fixed income portfolio, a core plusfixed income portfolio, and, a rate anticipator portfolio, including a U.S. TIPS index fund. All components metthe stated policy restrictions except the core fixed income portfolio which held $1,462,476 of the portfolio inissues rated below BBB and the core plus fixed income portfolio which held $146,724 of the portfolio in issuesrated below B. The Plan’s investment managers have advised retention of the securities after having assessedtheir risk/reward profiles. At June 30, 2009 the domestic fixed income portfolio consisted of a core fixedincome portfolio, a core plus fixed income portfolio and a rate anticipator portfolio. All components met thestated policy restrictions except the core fixed income portfolio which held $368,620 of the portfolio in issuesrated below BBB and the core plus fixed income portfolio which held $54,600 of the portfolio in issues ratedbelow B. The Plan’s investment managers have advised retention of the securities after having assessed theirrisk/reward profiles.
Investments issued by or explicitly guaranteed by the U.S. Government are not considered to have credit risk.At June 30, 2010 the Plan held 26.4% of fixed income investments that were not considered to have credit riskand 9.2% in a U.S. TIPS index fund made up of explicitly guaranteed U.S. Treasury Inflation ProtectedSecurities. At June 30, 2009 the Plan held 28.7% of fixed income investments that were not considered tohave credit risk.
30 2010 COMPREHENSIVE ANNUAL FINANCIAL REPORT
UNIFORM RETIREMENT SYSTEM FOR JUSTICES AND JUDGESAdministered by the Oklahoma Public Employees Retirement System
Notes to Financial Statements (continued)
The Plan’s exposure to credit risk at June 30, 2010 is presented below, in thousands, by investment categoryas rated by S&P or Moody’s Investor Service.
Not Ratedor
Rating NotAAA/Aaa AA/Aa A/A BBB/Baa BB/Ba B/B CCC/Caa Available Total
Percent of total fixedincome portfolio 20.6% 5.9% 11.4% 6.9% 1.9% 1.4% 0.6% 15.7% 64.4%
The Plan’s exposure to credit risk at June 30, 2009 is presented below, in thousands, by investment categoryas rated by S&P or Moody’s Investor Service.
Not Ratedor
Rating NotAAA/Aaa AA/Aa A/A BBB/Baa BB/Ba B/B CCC/Caa Available Total
UNIFORM RETIREMENT SYSTEM FOR JUSTICES AND JUDGESAdministered by the Oklahoma Public Employees Retirement System
Notes to Financial Statements (continued)
(d) Interest Rate Risk
Interest rate risk is the risk that changes in interest rates will adversely affect the fair value of an investment ora deposit. Duration is a measure of a debt investment’s exposure to fair value changes arising from changinginterest rates based upon the present value of cash flows, weighted for those cash flows as a percentage ofthe investment’s full price. Effective duration estimates the sensitivity of a bond’s price to interest ratechanges and makes assumptions regarding the most likely timing and amounts of variable cash flows arisingfrom investments such as callable bonds, collateralized mortgage obligations, and other mortgage backedsecurities.
The Plan does not have a formal investment policy on interest rate risk. Interest rate risk is controlled throughdiversification of portfolio management styles.
At June 30 the Plan’s exposure to interest rate risk as measured by effective duration is listed below byinvestment category.
EffectiveFair Fair duration
Value Value in years
U.S. Treasury notes/bonds $ 14,520,476 9.6 $ 12,487,773 12.7U.S. Treasury strips 5,376,214 23.0 7,446,129 24.6U.S. TIPS index fund 7,639,778 3.5Government agencies 6,198,616 3.4 5,639,441 4.4Government mortgage
Some investments’ sensitivity to changing interest rates may derive from prepayment options embedded in aninvestment. Asset backed securities, mortgage backed securities, and collateralized mortgage obligations arepass through securities that represent pooled debt obligations repackaged as securities that pass income andprincipal from debtors through the intermediary to investors.
Asset backed securities are bonds or notes backed by loan paper or accounts receivable originated by banks,credit card companies, or other providers of credit and often enhanced by a bank letter of credit or byinsurance coverage provided by an institution other than the issuer. At June 30, 2010 and 2009 the Plan held$6,011,065 and $4,425,684, respectively, in asset backed securities.
Mortgage backed securities are securities backed by mortgages issued by public and private institutions. AtJune 30, 2010 and 2009 the Plan held $13,756,582 and $15,081,102, respectively, in government mortgagebacked securities issued by the Federal Home Loan Mortgage Corporation (FHLMC), Government National
32 2010 COMPREHENSIVE ANNUAL FINANCIAL REPORT
UNIFORM RETIREMENT SYSTEM FOR JUSTICES AND JUDGESAdministered by the Oklahoma Public Employees Retirement System
Notes to Financial Statements (continued)
Mortgage Association (GNMA), and Federal National Mortgage Association (FNMA) as well as $5,596,209 and$8,613,772, respectively, in commercial mortgage backed securities.
Collateralized mortgage obligations (CMOs) are mortgage backed bonds that allocate mortgage cash flows(interest and principal) into different maturity classes, called tranches. This is accomplished by dedicatingmortgage cash flows to specific tranches and paying each tranch off, in turn by prespecified rules. In return fora lower yield, CMOs provide investors with increased security about the life of their investment compared topurchasing a pass through mortgage backed security. If mortgage rates drop (rise) sharply, prepayment rateswill increase (decrease), and CMO tranches may be repaid before (after) the expected maturity. At June 30,2010 and 2009 the Plan held $4,013,453 and $4,072,262, respectively, in non government backed CMOs.
The exposure to interest rate risk of the underlying investments of the Plan’s cash equivalents at June 30 is asfollows:
Derivative instruments are financial arrangements used to manage specific risks or to increase (or decrease)exposure to certain parts of financial markets. Governments enter into derivative instruments with otherparties, frequently private sector financial firms. The fair values and cash flows of derivative instruments arederived from or determined by other data. Governments may receive and make payments based on priceswithout actually entering into the related financial transactions.
The Plan holds forward contracts on mortgage backed securities classified as “to be announced” (TBA)securities. TBAs are tools used in the effective and efficient portfolio management of the Plan’s fixed incomeportfolio. TBAs are authorized for issuance and sold before the securities are ready for delivery by thegovernmental issuing entity with little or no initial investment. The Plan holds TBAs for the purpose ofobtaining exposure to the government mortgage backed securities market and ultimately obtaining income orprofit. Therefore, for accounting and reporting purposes, these derivative instruments are consideredinvestment derivative instruments.
The notional amount and fair value balance of derivative instruments outstanding at June 30, 2010 and thechange in fair value of such derivative instruments for the year then ended as reported in the 2010 financialstatements are as follows:
UNIFORM RETIREMENT SYSTEM FOR JUSTICES AND JUDGESAdministered by the Oklahoma Public Employees Retirement System
Notes to Financial Statements (continued)
The fair values of the forward contracts are provided to the Plan’s master custodian by a private vendor. TheTBA market is very liquid, and the vendor obtains quotes through live data feeds from various vendors withaccess to TBA market makers. For securities settling in the current month the vendor provides unadjustedquoted prices from an active market. For future settlements, a roll is added to current prices with the resultdiscounted to the next settlement date based on Securities Industry and Financial Markets Associationsmarket information.
As TBAs are used to influence the Plan’s exposure to the agency mortgage backed market, the investment inTBAs is subject to the same risk factors that impact the agency mortgage backed market. These risks includesystematic factors that affect the pricing of agency mortgage backed securities, like interest rate risk asdetailed in the section entitled Investments, Interest Rate Risk. In addition, the Plan is exposed tocounterparty risk, or the potential for financial loss due to the failure of a counter party to satisfy itsobligations from the TBA market. Another risk associated with the TBA market is delivery risk, or the risk thatthe pools that are delivered to the Plan perform materially worse than the “average pool” used to price theTBA contract.
At June 30, 2010 the Plan’s TBA exposure to interest rate risk as measured by effective duration was 4.7 years.
(5) Funded Status and Actuarial Information
(a) Funded Status and Funding Progress
The funded status of the Plan as of June 30 is as follows:
Actuarial value of assets (a) $ 230,010,299 $ 221,576,179Actuarial accrued liability (AAL) (b) $ 282,765,405 $ 261,396,022Total unfunded actuarial accrued
liability (UAAL) (b a) $ 52,755,106 $ 39,819,843Funded ratio (a/b) 81.3 % 84.8 %Covered payroll $ 35,023,262 $ 33,579,668UAAL as a percentage of covered payroll 150.6 % 118.6 %
20092010
The schedules of funding progress, presented as RSI following the notes to the financial statements, presentmultiyear trend information about whether the actuarial values of plan assets are increasing or decreasingover time relative to the AALs for benefits.
(b) Actuarial Methods and Assumptions
The information presented in the RSI was determined as part of the actuarial valuations at the datesindicated. Additional information as of the latest actuarial valuation, June 30, 2010 is as follows:
Funding Method
The funding method is entry age normal (based on a level percentage of covered payrolls). Under thismethod, the accrued liability and the present value of future normal costs are determined by summingthe individual entry age results for each participant. The normal cost is then determined in aggregate byspreading the present value of future normal costs as a level percentage of expected future coveredpayrolls. Entry age is defined as the first day service is credited under the Plan.
34 2010 COMPREHENSIVE ANNUAL FINANCIAL REPORT
UNIFORM RETIREMENT SYSTEM FOR JUSTICES AND JUDGESAdministered by the Oklahoma Public Employees Retirement System
Notes to Financial Statements (continued)
Experience gains and losses, i.e., decreases or increases in accrued liabilities attributable to deviations inexperience from the actuarial assumptions adjust the UAAL.
Asset Valuation Method
An expected actuarial value is determined equal to the prior year’s actuarial value of assets plus cashflows (excluding realized and unrealized gains and losses) for the year ended on the valuation date andassuming the valuation investment return. Prior year’s unrecognized gains and losses are added to thisamount to develop expected actuarial value. The expected actuarial value is then compared to the marketvalue of the assets at the valuation date, and 20% of any gain (loss) for the last five years is added to theexpected actuarial value. The gain (loss) is amortized over five years with the actuarial value of the assetsbeing constrained to a range of 80% to 120% of the market value at the valuation date.
Amortization
The funding policy amortizes the UAAL on a level percent of payroll method over a 20 year closed period.At June 30, 2010 there are 17 years remaining to the amortization period. Prior to July 1, 2007 thefunding policy amortized the UAAL on the level dollar method, and the amortization period was 40 yearsfrom July 1, 1987.
Assumptions
Significant actuarial assumptions employed by the actuary for funding purposes as of June 30, 2010 and2009 are as follows:
Salary increases – 5.5% per yearPost retirement benefit increases – 2% per yearInvestment return – 7.5% per annumAssumed inflation rate – 3.0%Payroll growth – 4.25% per yearMortality Rates – RP 2000 Combined Active/Retired Healthy Mortality Table projected to 2010,set back one year.
(6) Federal Income Tax Status
Pursuant to a determination by the Internal Revenue Service, the Plan is qualified under the Internal Revenue Codeof 1986, as amended, and therefore, is exempt from federal income taxes. The latest determination letter is datedMay 22, 2000 and was a favorable determination for the Uniform Retirement System for Justices and Judges. ThePlan has been amended since receiving the determination letter; however, the Plan administrator believes that thePlan is designed and is currently being operated in substantial compliance with the applicable requirements of theInternal Revenue Code and retains its status as a qualified plan.
2010 COMPREHENSIVE ANNUAL FINANCIAL REPORT 35
UNIFORM RETIREMENT SYSTEM FOR JUSTICES AND JUDGESAdministered by the Oklahoma Public Employees Retirement System
Notes to Financial Statements (continued)
(7) Plan Amendment
The State Legislature enacted one significant plan provision during the session ended in May 2010.
Revocation of Board’s Authorization to Adjust Contribution Rate
The Board’s authority to establish and adjust the employer contribution rate annually was revoked effectiveJuly 1, 2010.
(8) New Pronouncement
On June 24, 2010 GASB issued Statement No. 59 Financial Instruments Omnibus (GASB 59) which updates andimproves existing standards regarding financial reporting of certain financial instruments and external investmentpools. GASB 59 is effective for financial statements prepared by state and local governments for periods beginningafter June 15, 2010.
36 2010 COMPREHENSIVE ANNUAL FINANCIAL REPORT
UNIFORM RETIREMENT SYSTEM FOR JUSTICES AND JUDGESAdministered by the Oklahoma Public Employees Retirement System
UNIFORM RETIREMENT SYSTEM FOR JUSTICES AND JUDGESAdministered by the Oklahoma Public Employees Retirement System
Supplementary InformationSchedule of Administrative ExpensesYears Ended June 30, 2010 and 2009Schedule 3
2010 2009
Professional / Consultant services $ 8,554 $ 8,739
Allocated administrative expenses (see note below) 106,108 108,342
$ 114,662 $ 117,081
Note to Schedule of Administrative Expenses:
A portion of the administrative overhead expenses, including personnel and other
supporting services costs, which are paid for by a separate retirement fund also
administered by OPERS, are allocated to the Plan. The allocation is based on
OPERS’ estimate of the cost of services provided to the Plan by the separate fund.
Allocated costs are charged to the Plan and paid with funds provided through
operations of the Plan.
See accompanying independent auditors’ report.
2010 COMPREHENSIVE ANNUAL FINANCIAL REPORT 39
UNIFORM RETIREMENT SYSTEM FOR JUSTICES AND JUDGESAdministered by the Oklahoma Public Employees Retirement System
Supplementary InformationSchedule of Professional/Consultant FeesYears Ended June 30, 2010 and 2009Schedule 4
2010 2009
Professional/Consultant Service
Milliman, Inc. Actuarial $ 3,020 $ 3,918
Cole & Reed, PC External Auditor 1,712 1,811
Finley & Cook, PLLC Internal Auditor 2,196 968
Performance MeasurementCEM Benchmarking, Inc. Consulting 778 783
EFL Associates, Inc. Executive Search 737 325
Board GovernanceEnnis Knupp & Associates, Inc. Consulting — 179
Fox Lawson & Associates Compensation Consulting — 643
Glass Lewis & Co. Proxy Services 111 112
$ 8,554 $ 8,739
See accompanying independent auditors’ report.
40 2010 COMPREHENSIVE ANNUAL FINANCIAL REPORT
This page intenti onally left blank.
UNIFORM RETIREMENT SYSTEM FOR JUSTICES AND JUDGES
INVESTMENT SECTIONAdams Hotel Tulsa, Oklahoma
Completed in 1928, the “Mincks Hotel” was the vision of Isaiah S. Mincks attempting to
capitalize on the 1927 International Petroleum Exposition. Mincks and his associates put
their personal fortunes on the line to create this unique structure within Tulsa’s Business
District. Alfred C. “Frenchy” Fabry designed and built the 13-storey hotel, complete with
basement and penthouse, blending many different styles, including elements of Gothic, Art
Deco, Baroque and Italian renaissance for a truly eclectic piece.
The unique masonry exterior features a veneer of glazed terra cotta showcasing gargoyle
heads, fl oral stars, columns and decorative crests. The luxuries of the interior include
marble fl ooring for the lobby, ceramic tile-outlined elevator shafts, private baths and running
ice water in each of the original 171 rooms. The early success of the hotel fell victim to the
Great Depression and Mincks lost control of the hotel in 1935. The new owners renamed
it the Adams, and for three decades following WWII, the hotel struggled through several
preservation efforts.
The Adams is an enduring structure of Tulsa’s downtown and was placed on the National
Register in 1978.
Adams Hotel Tulsa, Oklahoma
2010 COMPREHENSIVE ANNUAL FINANCIAL REPORT 41
.
42 2010 COMPREHENSIVE ANNUAL FINANCIAL REPORT
.
2010 COMPREHENSIVE ANNUAL FINANCIAL REPORT 43
.
44 2010 COMPREHENSIVE ANNUAL FINANCIAL REPORT
UNIFORM RETIREMENT SYSTEM FOR JUSTICES AND JUDGES
Chief Investment Officer’s Report Uniform Retirement System for Justices and Judges P.O. Box 53007 Oklahoma City, Oklahoma 73152-30077
800.733.7008 toll-free 405.848.5946 fax
Dear Members:
I would like to take a moment to express my gratitude to the Board and Staff of OPERS for giving me the opportunity to serve as the Chief Investment Officer. I look forward to continuing the System’s long history of prudent, sensible, and disciplined investment management. This year’s letter, which covers the period from July 1, 2009 to June 30, 2010, will follow the format with which you are familiar. First, I will discuss the general economic environment and the performance of various markets throughout the fiscal year. Next, I will move the discussion to focus on the Fund by reviewing the investment performance and the asset allocation. After that, I will offer an investment outlook and discuss recent events at the Fund. Lastly, this report would not be complete without restating the Fund’s investment philosophy and guiding principles, because both are important to the investment decision-making process.
Economic Environment
The longest and deepest recession since the Great Depression officially ended in June 2009, but the U.S. economy has only seen incremental improvement. There was a dramatic rebound in U.S. economic activity in the six months ending December 31, 2009, as businesses filled inventory levels that were left depleted by the prior four quarters absence of economic growth. Notably, real GDP growth was 5.0% for the quarter ending December 31, 2009. However, economic momentum began to stall three months later, as businesses held off on spending and the trade deficit widened. Despite the strong growth in the last part of calendar year 2009, the economy was unable to muster enough momentum to improve unemployment statistics, which remained at a stubbornly high 9.5% for June 2010. Inflation remained subdued such that market sentiment shifted from a concern for a disinflationary environment to worries about the potential for an outright deflationary environment.
Capital Markets
U.S. Stock Market The chart on the following page shows the performance of the Russell 3000 Index for the fiscal year. The Russell 3000 Index is one of the broadest equity indices available, and is a good proxy for the equity market as a whole. The equity market rebounded strongly over the last fiscal year, recovering from the market collapse in 2008, which was driven by the global recession and financial panic in the U.S. and Europe.
2010 COMPREHENSIVE ANNUAL FINANCIAL REPORT 45
UNIFORM RETIREMENT SYSTEM FOR JUSTICES AND JUDGES
Chief Investment Officer’s Report (continued)
Change in the Russell 3000 Index during the fiscal year ended June 30, 2010 Value at 6/30/09 2335.85 Value at 6/30/10 2703.08
2200
2400
2600
2800
3000
3200
3400
Jun-09
Jul-0
9
Aug-09
Sep-09
Oct-09
Nov-09
Dec-09
Jan-10
Feb-10
Mar-10
Apr-10
May-10
Jun-10
Source: Frank Russell Company
The Russell 3000 Index ended the fiscal year up 15.72% for the period. However, in May and June of 2010, market sentiment soured on sovereign credit concerns in Europe, uncertainty from the impact of U.S. financial services regulatory reform, and fresh economic apprehension as the market feared a “double dip” recession due to a slowdown in economic activity. For the twelve months ending June 30, 2010, the riskiest parts of the market experienced the largest returns, as small capitalization stocks outperformed large capitalization stocks. The Russell 2000 Value Index (a small capitalization value-tilted index) was up more than 25% during the same twelve month period.
Interest Rates Over much of the fiscal year, yields on the 10-year Treasury Bond climbed from very low levels at the beginning of the period. However, yields fell dramatically in the last two months of the year, as sovereign credit concerns in Europe caused a flight to quality. Also, the lack of any inflationary pressure and a further slowdown in economic activity in the U.S. caused yields to remain low. The 10-year Treasury ended the fiscal year yielding less than 3%.
U.S. Treasury Yield Curve
0.00
1.00
2.00
3.00
4.00
1 mo3 m
o1 yr 3 yr 5 yr
10 yr30 yr
%
6/30/2010 6/30/2009
Source: U.S. Treasury
46 2010 COMPREHENSIVE ANNUAL FINANCIAL REPORT
UNIFORM RETIREMENT SYSTEM FOR JUSTICES AND JUDGES
Chief Investment Officer’s Report (continued)
The chart on the previous page shows the term structure of interest rates in the U.S. As shown, rates fell across the yield curve for the fiscal year. Again, sovereign credit risk concerns (associated with the Eurozone countries of Greece, Italy, Spain, Ireland, and Portugal) increased demand for safe Treasury securities which drove down yields on those instruments. In addition, the outlook for economic growth in the U.S. became uncertain as economic reports grew increasingly less robust through the course of the year. Inflation remained tame such that the fear of a deflationary environment increased for market participants.
Investment Returns Through June 30, 2010 U.S. Equity Style 1 Year 3 Years 5 Years Russell 3000 Broad U.S. Equity 15.72% -9.47% -0.48% S&P 500 Large Cap Equity 14.43% -9.81% -0.79% Russell 1000 Large Cap Equity 15.23% -9.54% -0.56% Russell 1000 Growth Large Cap Growth 13.62% -6.91% 0.38% Russell 1000 Value Large Cap Value 16.92% -12.32% -1.64% Russell 2000 Small Cap Equity 21.48% -8.60% 0.37% Russell 2000 Growth Small Cap Growth 17.96% -7.54% 1.14% Russell 2000 Value Small Cap Value 25.07% -9.85% -0.51% Uniform Retirement System for Justices and Judges Broad U.S. Equity 16.45% -9.16% -0.26% U.S. Fixed Income Style 1 Year 3 Years 5 Years ML 3-Month T-Bill Cash 0.16% 1.57% 2.77% Barclay U.S. Aggregate Core Bonds 9.50% 7.55% 5.54% ML U.S. Gov't/Credit Core Bonds 9.84% 7.26% 5.22% ML High Yield Master II High Yield Bonds 27.53% 6.39% 7.10% Uniform Retirement System for Justices and Judges Domestic Fixed Income 13.49% 8.58% 5.94% Non-U.S. Equity Style 1 Year 3 Years 5 Years MSCI ACWI Ex-US Broad Non-U.S. Equity 10.87% -10.28% 3.84% MSCI EAFE Developed Non-U.S. Equity 6.38% -12.94% 1.35% MSCI Emerging Market Emerging Non-U.S. Equity 23.48% -2.22% 13.07% Uniform Retirement System for Justices and Judges Non-U.S. Equity 11.05% -11.71% 2.17% Uniform Retirement System for Justices and Judges Total Fund 14.27% -2.48% 2.61% Source: SIS, Northern Trust
Investment Performance
Risk Was Rewarded The total URSJJ Fund produced very strong results for fiscal 2010, returning 14.27% for the period. The Fund outperformed the policy benchmark portfolio by more than 1.5% for the period. In addition, the result compares favorably to the investment loss of 15.74% experienced in fiscal year 2009.
The Fund benefited from very strong absolute returns from all asset classes in which it invested. The biggest positive driver of returns for the year was the Fund’s domestic equity allocation. Overall, the U.S. equity portfolio returned 16.45%. Next, the U.S. fixed income portfolio contributed strongly, with a return of over 13% for the period. Lastly, while non-U.S. equity underperformed the domestic stock and bond portfolios, it still generated a return of over 11% for the period.
U.S. Equity The Fund utilizes entirely passive investment management within the domestic equity portfolio structure. Passive management is an efficient and cost effective way to manage the assets, while maintaining broad exposure to the asset
2010 COMPREHENSIVE ANNUAL FINANCIAL REPORT 47
UNIFORM RETIREMENT SYSTEM FOR JUSTICES AND JUDGES
Chief Investment Officer’s Report (continued)
class. The Fund’s small capitalization mandate, while a comparatively small proportion of the Fund, exhibited exceptional performance for the period.
Fixed Income Bonds were the second best performing asset class for the period. Not only was the absolute return of the asset class unexpectedly high, the managers were able to generate sizable excess returns versus their respective benchmarks. The managers in the fixed income portfolio emphasize different strategies within their respective mandates. The Fund’s manager that emphasizes interest rate strategies benefited from the decline in rates, especially in longer-dated government holdings. The Fund’s other two fixed income managers generated strong returns as well. The Fund’s most aggressive fixed income mandate performed the best, as the modest holdings in lesser quality corporate bonds produced equity-like returns. The Fund’s core fixed income manager also performed admirably, by emphasizing non-government sectors of the bond market.
Non-U.S. Equity The non-U.S. Equity portfolio contributed a meaningful return to the overall Fund. The index performance would have been better for the year if not for the impact of currency movements on the portfolio. The U.S. dollar strengthened in the flight to quality in May and June 2010, which reduced U.S. dollar investor returns. Like the U.S. Equity portfolio, this mandate is managed in a passive style.
Asset Allocation
Diversification Reduces Volatility Diversification continues to be the most effective defense against the risks associated with any one individual security or asset class. Risks are controlled by allocating the Fund’s assets across various asset classes and sectors within asset classes. The asset allocation of the Fund is shown below.
Asset Class Min 6/30/2010 Target Max Cash 0.0% 0.2% 0.0% 0.0% Domestic Fixed Income 31.9% 38.1% 36.0% 40.1% U.S. Equity 37.3% 39.5% 40.0% 42.7% Non-U.S. Equity 21.0% 22.2% 24.0% 27.0% Total Fund 100% 100%
Outlook and Recent Events
Outlook Even the most astute market observers are notoriously bad at market prognostication (which is a strong argument in favor of maintaining a diversified portfolio). But, the market does give us some clues as to what we may expect going forward. Unfortunately, the outlook is uncertain at best, and not abundantly fruitful at worst. One of the largest concerns facing the staff at OPERS is generating and maintaining investment results that match or exceed our actuarial assumed rate of return of 7.5%. Despite the eye-popping returns URSJJ experienced in fiscal 2010, we believe this will be a challenging task going forward.
Fixed Income Yields are quite low in the fixed income markets, where URSJJ maintains a sizable investment. Over a long period of time, the total return of the bond market tends to resemble the yield of years’ past. Over short periods, interest rate movements may have a profound impact on the capital gains (or losses) experienced by bond investors. The 9.5% index return of fiscal 2010 was garnered from a combination of yield and capital gains (as rates declined and credit spreads compressed). Our expectation for the total return of the U.S. fixed income markets going forward would more closely reflect the current yield, which is around 3%. This return would be reduced further if rates were to rise precipitously throughout the next year.
48 2010 COMPREHENSIVE ANNUAL FINANCIAL REPORT
UNIFORM RETIREMENT SYSTEM FOR JUSTICES AND JUDGES
Chief Investment Officer’s Report (continued)
Equity The equity markets are particularly difficult to predict with any type of precision. Over short periods of time, market sentiment and technical factors (buying and selling) can have, and have had, a profound impact on returns experienced by investors. Over long periods of time, returns from the equity markets can be attributable to two main sources: dividends on stocks and the growth rate of corporate earnings. Generally, the growth rate of earnings depends on the economic environment. The U.S. economy has recovered from the severe recession that began in December 2007, but that recovery remains in a very fragile state. Consumer spending, which comprises more than two-thirds of the U.S. economy, is still facing the headwinds of high unemployment, declines in household wealth from feeble stock and housing markets of the past several years, and an increase in the rate of savings by consumers. However, corporate profitability has been strong, and companies are in a much better position to weather economic storms than they had been in the past. Sustainability of the economic momentum will be key going forward to continued strong corporate profitability.
Recent Events There were no significant changes to the asset allocation during the year. However, within the fixed income asset class, URSJJ hired an additional mandate and reallocated some assets within the asset class to fine-tune some of the risk exposures. In February of 2010, URSJJ hired and funded a U.S. Treasury Inflation Protected Securities (TIPS) mandate. These types of government securities protect investors from rising interest rate environments that are caused by unanticipated increases in the rate of inflation. TIPS presented an attractive opportunity to partially protect the fixed income allocation from rising interest rates due to rising inflation, without changing the credit profile of the overall bond portfolio. At the same time, URSJJ increased the fixed income allocation to its core plus fixed income manager, to take advantage of non-government opportunities in the bond market. Both of these actions also helped to improve manager diversity in the bond portfolio.
In September of 2009, URSJJ replaced the international exposure in the non-U.S. equity portfolio with the MSCI All Country World ex-U.S. index (ACWI ex-US). The ACWI ex-US index is comprised of developed countries in North America, Europe and Asia, and emerging countries across the globe. There was no change in the philosophical management of the portfolio, as the counties in the international markets index comprise a majority of countries within the ACWI ex-U.S. index.
Investment Philosophy and Guiding Principals
The investment philosophy and the principals that guide the stewardship of the Fund have remained consistent and are listed below.
A pension fund has the longest of investment horizons and therefore rightly focuses on factors that impact long-term results.
Asset allocation is the key factor determining long-term results. Disciplined rebalancing toward the desired asset allocation maintains diversification and controls risk. Diversification within and across asset classes is the most effective tool for controlling risk. Passive investment management is commonly the most effective approach in efficient markets; active investment
management can be successful in inefficient markets.
For a complete discussion of the investment portfolio and policies thereof, please see the Statement of Investment Policy. A copy of the policy is posted on the OPERS website, www.opers.ok.gov. If you have any questions about this report or the management of investments, please contact me. Thank you.
Regards,
Brad Tillberg, CFA Chief Investment Officer
2010 COMPREHENSIVE ANNUAL FINANCIAL REPORT 49
UNIFORM RETIREMENT SYSTEM FOR JUSTICES AND JUDGES
Largest Holdings
The Plan’s ten largest fixed income holdings at June 30, 2010, are described in the following schedule. The Plan invests in various index and commingled funds which are separately presented.
Ten Largest Fixed Income Holdings (By Fair Value):
Security Par Fair Value
U.S. Treasury Bonds 4.75% due 2-15-2037 $ 2,325,000 $ 2,669,391
U.S. Treasury Bonds Principal Strips due 11-15-2027 5,100,000 2,575,332
U.S. Treasury Bonds Principal Strips due 5-15-2039 7,500,000 2,303,250
U.S. Treasury Notes 2.375% due 2-28-2015 2,081,000 2,144,741
U.S. Treasury Notes 1.875% due 6-30-2015 1,855,000 1,862,101
U.S. Treasury Bonds 5.25% due 2-15-2029 1,500,000 1,805,157
FNMA 30 Year Single Family Mortgage 5% 1,700,000 1,792,172
FNMA 30 Year Single Family Mortgage 4.5% 1,700,000 1,755,515
U.S. Treasury Bonds 4.375% due 5-15-2040 1,505,000 1,627,748
GNMA 30 Year Single Family Mortgage 4.5% 1,135,000 1,182,173
Investments in Funds (By Fair Value):
Fund Units Fair Value
BlackRock Russell 1000 Index Fund 1,061,788 $ 70,037,025
BlackRock ACWI ex-U.S. Index Fund 2,916,110 46,831,162
BlackRock Russell 2000 Index Fund 722,190 13,158,996
BlackRock U.S. TIPS Index Fund 435,284 7,639,778
A complete list of portfolio holdings is available upon request from the URSJJ Investment Accounting and Financial Reporting Department.
Schedule of Stock Brokerage Commissions Paid Year Ended June 30, 2010
None
50 2010 COMPREHENSIVE ANNUAL FINANCIAL REPORT
UNIFORM RETIREMENT SYSTEM FOR JUSTICES AND JUDGES
Investment Portfolio by Type and Manager
At June 30, 2010, the investment portfolio of URSJJ was allocated by type and style as follows:
Investment Type and Manager Style Fair Value*
Percent of Total Fair Value
(000’s) Fixed Income: Hoisington Investment Management Interest Rate Anticipation $ 10,221 4.7% BlackRock Institutional Trust Company Index Fund – U.S. TIPS 7,640 3.5% Blackrock Financial Management, Inc. Enhanced Index 43,817 20.2% Metropolitan West Asset Management Full Range Core + 24,160 11.2% Total Fixed Income 85,838 39.6% U.S. Equities: BlackRock Institutional Trust Company Index Fund – Russell 1000 70,037 32.4% BlackRock Institutional Trust Company Index Fund – Russell 2000 13,159 6.1% Total U.S. Equities 83,196 38.5% International Equities: BlackRock Institutional Trust Company Index Fund – ACWI ex-U.S. 46,831 21.7% Short-term Investment Funds Operating Cash 486 0.2% Total Managed Investments 216,351 100.0% Securities Lending Collateral 20,364 Cash Equivalents on Deposit with State 64 Total Investments and Cash Equivalents $ 236,779 Statement of Plan Net Assets Cash Equivalents $ 3,034 Investments 233,745 Total Investments and Cash Equivalents $ 236,779
* Manager fair values include their respective cash equivalents.
2010 COMPREHENSIVE ANNUAL FINANCIAL REPORT 51
UNIFORM RETIREMENT SYSTEM FOR JUSTICES AND JUDGES
Asset Comparison
A comparison of the actual investment distribution at June 30, 2010 and 2009, based on the net investment manager holdings, including accrued income, payables and receivables, and the securities lending collateral deficiency (in 2009), compared to the target allocation for each year is as follows:
Target Policy MixAsset Mix
2010
Target Policy MixAsset Mix
2009
Fixed Income38.1%
Cash0.2%
22.2%
39.5%
Fixed Income36.0%
24.0%
40.0%
Fixed Income37.2%
Cash0.1%
22.5%
40.2%
Fixed Income36.0%
24.0%
40.0%
52 2010 COMPREHENSIVE ANNUAL FINANCIAL REPORT
This page intenti onally left blank.
UNIFORM RETIREMENT SYSTEM FOR JUSTICES AND JUDGES
ACTUARIAL SECTIONBoston Avenue United Methodist Church Tulsa, Oklahoma
Rev. E.B. Chenoweth arrived in Tulsa with his family in 1893 to organize the Methodist
Episcopal Church, South in the years following the Civil War. The crowning achievement of
his congregation’s 117-year history has been the completion of the Boston Avenue United
Methodist Church in 1929 and other subsequent additions in the years following.
There is some discussion on who is more responsible for the design of the current church.
Somewhere between an initial sketch provided by Adah Robinson, a University of Tulsa art
instructor who was approached by a church building committee member for a direction on
the design, and the ultimate building designs provided by famed architect, Bruce Goff, lay
the creative impetus for this magnifi cent structure.
The ecclesiastical Art Deco design of the church incorporates many different building
materials including Indiana limestone, Minnesota granite, metal, glass, and terra cotta. A
225-foot tower is fl anked on either side by a semicircular auditorium and wing of classrooms
paying homage to the great Gothic cathedrals of history. The exterior is also adorned with
terra cotta sculptures by Robert Garrison, including the equestrian Circuit Riders above the
entryway depicting the Early Methodist traveling clergymen. Space prohibits detailing here
the many exquisite architectural elements of the church. Suffice it to say, it is a must-see.
The Boston Avenue United Methodist Church was placed on the National Register of
Historic Places in 1978 and was designated a National Historic Landmark in 1999.
Boston Avenue United Methodist Church Tulsa, Oklahoma
2010 COMPREHENSIVE ANNUAL FINANCIAL REPORT 53
UNIFORM RETIREMENT SYSTEM FOR JUSTICES AND JUDGES
November 3, 2010
Board of Trustees Oklahoma Public Employees Retirement System 5801 N. Broadway Extension, Suite 400 P.O. Box 53007 Oklahoma City, OK 73152-3007
Members of the Board:
We have completed an actuarial valuation of the Oklahoma Uniform Retirement System for Justices and Judges as of July 1, 2010 for the purpose of determining the actuarial contribution rate and calculating and analyzing key financial measurements. Actuarial valuations are performed annually. This valuation reflects the benefit provisions and contribution rates in effect as of July 1, 2010.
In preparing the valuation, we, as the actuary, relied on the data provided by the System. As part of our work, we performed a limited review of the data for consistency and reasonableness and did not find material defects in the data.
All of the information and supporting schedules in the Actuarial Section have been provided by Cavanaugh Macdonald Consulting, LLC. We also prepared the Schedule of Funding Progress and Schedule of Employer Contributions shown in the financial section of the Comprehensive Annual Financial Report. All historical information that references a valuation date prior to July 1, 2010 was prepared by the prior actuarial firm.
The assumptions recommended by the actuary and adopted by the Board are, in the aggregate, reasonably related to the experience under the System and to reasonable expectations of anticipated experience under the System and meet the parameters for the disclosures under GASB 25 and 27.
Future actuarial results may differ significantly from the current results presented in this report due to such factors as the following: plan experience differing from that anticipated by the economic or demographic assumptions; changes in economic or demographic assumptions; increases or decreases expected as part of the natural operation of the methodology used for these measurements (such as the end of an amortization period
Cavanaugh Macdonald CC OO NN SS UU LL TT II NN GG ,, LL LL CC The experience and dedication you deserve
Cavanaugh Macdonald 3550 Busbee Pkwy, Suite 250
Kennesaw, GA 30144
Phone (678) 388-1700 Fax (678) 388-1730
www.CavMacConsulting.com
54 2010 COMPREHENSIVE ANNUAL FINANCIAL REPORT
UNIFORM RETIREMENT SYSTEM FOR JUSTICES AND JUDGES
or additional cost or contribution requirements based on the plan’s funded status); and changes in plan provisions or applicable law. Since the potential impact of such factors is outside the scope of a normal annual actuarial valuation, an analysis of the range of results is not presented herein.
In addition to the valuation results, 20 Okla. Stat, Section 1108(D) requires disclosure of the valuation results under prescribed assumptions. This information is provided elsewhere in the System’s Annual Report.
This is to certify that the independent consulting actuaries, Alisa Bennett and Patrice Beckham, are Members of the American Academy of Actuaries and meet the qualification standards of the American Academy of Actuaries to render the actuarial opinion contained herein. They have experience in performing valuations for public retirement systems. The valuation was prepared in accordance with principles of practice prescribed by the Actuarial Standards Board. The actuarial calculations were performed by qualified actuaries in accordance with accepted actuarial procedures, based on the current provisions of the retirement system and on actuarial assumptions that are internally consistent and reasonably based on the actual experience of the System.
Respectfully submitted,
Alisa Bennett, FSA, EA, FCA, MAAA Patrice Beckham, FSA, EA, MAAA Principal and Senior Actuary Consulting Actuary
2010 COMPREHENSIVE ANNUAL FINANCIAL REPORT 55
UNIFORM RETIREMENT SYSTEM FOR JUSTICES AND JUDGES
Summary of Results 7/1/2010 7/1/2009 % Valuation Valuation Change 1. PARTICIPANT DATA Number of: Active Members 271 274 (1.1)
Retired and Disabled Members and Beneficiaries 210 200 5.0
Inactive Members 12 13 (7.7)
Total members 493 487 1.2
Projected Annual Salaries of Active Members $ 35,023,262 $ 33,579,668 4.3 Annual Retirement Payments for Retired Members $ 11,801,981 $ 10,545,466 11.9 and Beneficiaries 2. ASSETS AND LIABILITIES Total Actuarial Accrued Liability $ 282,765,405 $ 261,396,022 8.2
Market Value of Assets $ 211,180,555 $ 184,646,816 14.4
Actuarial Value of Assets $ 230,010,299 $ 221,576,179 3.8
Less Statutory State Employer contribution Rate 10.00% 8.50%
Contribution Shortfall 25.74% 23.61%
56 2010 COMPREHENSIVE ANNUAL FINANCIAL REPORT
UNIFORM RETIREMENT SYSTEM FOR JUSTICES AND JUDGES
Analysis of Financial Experience Gains & Losses in Actuarial Accrued Liability During the Year Ended June 30, 2010 Resulting from Differences Between Assumed Experience & Actual Experience
Type of Activity (Gain) or Loss for
Year End 2010 1. Age & Service Retirements. If members retire at older ages or with
higher benefits than assumed, there is a gain. If they retire at younger ages or have higher average pays, a loss occurs.
$ (1,040,000)
2. Death Benefits. If survivor claims are less than assumed, there is a gain. If more claims, there is a loss.
(30,000)
3. Withdrawal from Employment. If more liabilities are released by
withdrawals than assumed, there is a gain. If smaller releases, a loss. 310,000
4. Pay Increases. If there are smaller pay increase than assumed, there is a
gain. If greater increases, a loss. 130,000
5. New Entrants. All new entrants to the System create a loss. 40,000 6. Other. Miscellaneous gains and losses resulting from data adjustments,
employee transfers, valuation methods, etc. 1,190,000
7. (Gain) or Loss During Year From Financial Experience. 7,500,000 8. Composite (Gain) or Loss During Year. $ 8,100,000
2010 COMPREHENSIVE ANNUAL FINANCIAL REPORT 57
UNIFORM RETIREMENT SYSTEM FOR JUSTICES AND JUDGES
Solvency Test The Judges funding objective is to be able to pay long-term benefit promises through contributions that remain approximately level from year to year as a percent of salaries earned by members. In this way, members and employers in each year pay their fair share for retirement service accrued in that year by System members. If the retirement system follows level contribution rate financing principles, the system will pay all promised benefits when due – the ultimate test of financial soundness. A short-term solvency test is one means of checking the funding progress. In a short-term solvency test, the retirement System’s present valuation assets are compared with: 1) active member contributions on deposit, 2) the liabilities for future benefits to persons who have retired and the liabilities for terminated employees with vested benefits, and 3) the liabilities for service already rendered by active members. In a system that has been following the discipline of level contribution rate financing, the liabilities for member contributions on deposit (liability 1), the liabilities for future benefits to present retirees and the liabilities for future benefits for terminated employees (liability 2) will be fully covered by present assets, except in rare circumstances. In addition, the liabilities for service already rendered by members (liability 3) will be partially covered by the remainder of present assets. Generally, if the system has been using level contribution rate financing, the funded portion of liability 3 will increase over time; however, a decrease generally occurs in those years when substantial benefit improvements are granted by the Legislature. It is unusual for liability 3 to be fully funded. The funded ratio of the System based on total actuarial accrued liabilities (1 + 2 + 3) provides an indication of how well the System is funded. The schedule below illustrates the progress of funding the actuarial accrued liabilities.
Actuarial Accrued Liabilities1 and Valuation Assets
Portion of Actuarial Accrued Liabilities Covered by Reported Assets
Employees Included: All Justices and Judges of the Supreme Court, Court of Criminal Appeals, Workers Compensation Court, Courts of Appeals or District Court who serve in the State of Oklahoma participate in the Uniform Retirement System for Justices and Judges.
System Contributions: The contributions are received from the employer agencies based on a
percentage of salary of covered members. Effective for the fiscal year ending June 30, 2006, employer contributions increased to 3.0% of the member’s salary and will increase annually up to 22.0% of member payroll for fiscal years ending June 30, 2019, and thereafter.
Member Contributions: Before September 1, 2005, basic member contributions equal 5% of salary,
while married members could have elected an 8% contribution rate in order to provide survivor coverage. After September 1, 2005, the member contribution rate for all members is 8% of salary.
Final Average Salary: The average monthly salary received during the highest three years of
active service as a Justice or Judge in a court of record. Retirement Date: A member who completes eight years of service and attains age 65, or
completes ten years of service and attains age 60, or whose sum of years of service and age equals or exceeds 80, may begin receiving retirement benefits at his request.
Normal Retirement Benefit: General formula is 4% of average monthly salary multiplied by service, up
to a maximum benefit of 100% of final average salary. Disability Benefit: After fifteen years of service and age 55, provided the member is ordered
to retire by reason of disability is eligible for disability retirement benefits. This benefit, payable for life, is calculated in the same manner as a normal retirement benefit but cannot exceed 100% of final average salary.
Survivor Benefit: The spouse of a deceased active member who had met normal or vested
retirement provisions may elect a spouse’s benefit. The spouse’s benefit is the benefit that would have been paid if the member had retired and elected the joint and 100% survivor option (Option B), or a 50% unreduced benefit for certain married participants making 8% of pay contributions prior to September 1, 2005. If the member has ten years of service and the death is determined to be employment related, this benefit is payable immediately to the spouse. In order to be eligible for this survivor coverage, members must be married to their spouse for three years preceding death and they must be married 90 days prior to the member’s
60 2010 COMPREHENSIVE ANNUAL FINANCIAL REPORT
UNIFORM RETIREMENT SYSTEM FOR JUSTICES AND JUDGES
Summary of System Provisions (continued)
termination of employment as a Justice or Judge. Effective October 1, 2004, the benefit for surviving spouses may be higher than 50% of the member’s benefit, up to 65% for certain members who made additional voluntary survivor benefit contributions of 3% of salary prior to July 1, 1999, and who die or retire after July 1, 1999.
Optional Forms of Retirement Benefits: The normal form of benefit for a single member is a single life monthly
annuity with a guaranteed refund of the contribution accumulation. The normal form for a married member is a 50% joint and survivor annuity benefit. Optional forms of payment with actuarial reduction (if applicable) are available to all members retiring under the normal retirement or vested retirement provisions. After September 1, 2005, the options providing post-retirement death benefits are:
Option A -- Joint and 50% survivor annuity with a return to the unreduced amount if the joint annuitant dies.
Option B -- Joint and 100% survivor annuity with a return to the unreduced amount if the joint annuitant dies.
For married members, spousal consent is required for any option other
than Option A. Participant Death Benefit: $5,000 lump sum. Supplemental Medical Insurance Premium: The System contributes the lesser of $105 per month or the Medicare
Supplement Premium to the Oklahoma State and Education Employee’s Group Health Insurance Program for members receiving retirement benefits.
2010 COMPREHENSIVE ANNUAL FINANCIAL REPORT 61
UNIFORM RETIREMENT SYSTEM FOR JUSTICES AND JUDGES
Summary of Actuarial Assumptions and Methods
1. The investment return rate used in the valuation was 7.50 percent per year, net of investment expenses, compounded annually. This rate of return is not the assumed real rate of return. The real rate of return is the rate of return in excess of the inflation rate. Considering other financial assumptions, the 7.50 percent investment return rate translates to an assumed real rate of return of 4.50 percent.
2. The RP-2000 Mortality Table projected to 2010 using Scale AA for males and females with a one-year age
setback is used for preretirement and postretirement mortality. 3. The probability of withdrawal from service is 2% for all years of service. The individual pay increase
assumption is 5.5% per year. 4. The probabilities of retirement are shown in Schedule 1. 5. Benefits are assumed to increase two percent each year due to future ad hoc cost-of-living increases. 6. The individual entry-age normal actuarial cost method of valuation was used in determining actuarial
accrued liability and normal cost. Actuarial gains and losses reduce or increase the unfunded actuarial accrued liability and are amortized over the remaining amortization period (18 years as of July 1, 2009), as a level percent of pay method.
7. The actuarial value of assets is based on a five-year moving average of expected actuarial values and market
values. A preliminary expected value is determined equal to the prior year’s actuarial value of assets plus net cash flow for the year ending on the valuation date, assuming the valuation investment return. The expected actuarial asset value is equal to the preliminary expected actuarial value plus the unrecognized investment gains and losses as of the beginning of the previous fiscal year. Twenty percent (20%) of the gain/loss as measured by the difference between the expected actuarial value and the market value at the valuation date is added to the preliminary expected actuarial value plus twenty percent (20%) of the unrecognized gains or losses for the four preceding fiscal years. The final result is constrained to a value no less than 80% and no more than 120% of the market value at the valuation date.
8. The actuarial assumptions and methods used in the valuation were adopted by the Board based upon the
recommendations of the actuary. The assumptions and methods used for the July 1, 2009 valuation were adopted by the Board based on System experience through June 30, 2007.
62 2010 COMPREHENSIVE ANNUAL FINANCIAL REPORT
UNIFORM RETIREMENT SYSTEM FOR JUSTICES AND JUDGES
Summary of Actuarial Assumptions and Methods (continued)
Schedule 1 Percent of Eligible Active Members Retiring Within Next Year
Retirement Ages
Percent
Retirement Ages
Percent
Below 62 10% 69 30%
62 25% 70 20%
63 25% 71 10%
64 25% 72 10%
65 25% 73 10%
66 10% 74 10%
67 10% 75 100%
68 30%
STATISTICAL SECTIONSkirvin Hotel Oklahoma City, Oklahoma
The vision of William “Bill” Skirvin to open the biggest and most luxurious hotel in
Oklahoma City was realized on September 26, 1911, with the opening of the Skirvin Hotel.
Original plans and subsequent additions to the hotel were designed by noted architect and
Skirvin’s close personal friend, Solomon A. Layton.
The hotel was originally conceived to be a U-shaped, six storey design. Apparently,
Layton lobbied his friend to bring the structure up to 10 fl oors and Skirvin agreed. The two
men attended to every detail of the hotel’s ornate design. However, it was their shared
vision of the hotel’s self-sufficiency that was truly ahead of its time, including building an
electric plant, digging wells for water supply, and providing the building’s own gas pipeline.
The beauty of the Flemish bond-patterned, red brick exterior and limestone façade was
superbly complemented by the luxury of the interior. Among the features of the original
interior were the English Gothic styling of the lobby, a ballroom that seated 500, private
baths, velvet carpets and hardwood furnishings of each private room, which were also
connected with telephone service.
The Skirvin family sold the properties of the hotel upon the death Bill Skirvin in 1944.
Through various owners and trying economic times, the Skirvin has survived difficult odds
and stands as a symbol of elegance in Oklahoma City. The hotel received a $55 million
remodel and reopened in 2007, and is included on the National Register of Historic Places.
Skirvin Hotel Oklahoma City, Oklahoma
2010 COMPREHENSIVE ANNUAL FINANCIAL REPORT 63
UNIFORM RETIREMENT SYSTEM FOR JUSTICES AND JUDGES
The Statistical Section provides additional historical perspective, context, and detail to assist the reader in using the information in the financial statements, notes to financial statements and required supplementary information to understand and assess the economic condition of the Uniform Retirement System for Justices and Judges (URSJJ). Financial trend information is intended to assist users in understanding and assessing the changes in the financial position over time. Schedules presenting financial trend information are Schedule of Changes in Net Assets, Schedule of Revenue by Source, Schedule of Expenses by Type, Schedule of Benefit Payments and Refunds by Type, and Funded Ratio Chart. Revenue capacity information is intended to assist users in understanding and assessing the factors affecting the ability of URSJJ to generate own-source revenue, specifically investment income. The schedule presenting revenue capacity information is the Rate of Return by Type of Investment. Operating information is intended to provide contextual information about the operations and resources of URSJJ to assist readers in using financial statement information to understand and assess the economic condition. Schedules and charts presenting operating information are Schedule of Retired Members by Type of Benefit, Schedule of Average Benefit Payments, Principal Employer, Demographics Chart, Member Statistics*, Distribution of Retirees and Beneficiaries*, Summary of Active Members*. Schedules and information are derived from URSJJ internal sources unless otherwise noted. *Schedules and data are provided by actuarial consultant Cavanaugh MacDonald Consulting, LLC.
64 2010 COMPREHENSIVE ANNUAL FINANCIAL REPORT
UNIFORM RETIREMENT SYSTEM FOR JUSTICES AND JUDGES
Schedule of Changes in Net Assets
Year Total Ending Changes in June 30, Additions Deductions Net Assets
Effective January 1, 2001, the employer contribution rate was lowered from 15.27% to 2.0%. The rate was raised to 3.0% effective July 1, 2005, 4.0% effective July 1, 2006, 5.5% effective July 1, 2007, 7.0% effective July 1, 2008, and 8.5% effective July 1, 2009. In May 2009 the State Legislature designated $6.0 million as employer contributions effective July 1, 2009.
Schedule of Benefit Payments and Refunds by Type The following schedule provides information as to the type of benefit expenses incurred by the Plan as reflected in the “Benefit Payment” and “Refunds” columns of the Schedule of Changes in Net Assets and the Schedule of Expenses by Type included elsewhere in this Statistical Section. Benefits Year Ending Age and Beneficiary Refunds and
**Type of Retirement Type 1 - Normal retirement for age and service: Eligible at (1) when the sum of the member’s age plus
years of service equals or exceeds 80 points and has judicial service of at least 8 years, or (2) age 65 with 8 years of judicial service, or (3) age 60 with 10 years of judicial service
Type 2 - Survivor payment: Normal Type 3 - Disability: Available for members who have attained age 55 and have 15 years of credited
service and are determined to be disabled by the Court of the Judiciary Type 4 - Survivor payment: Disability retirement #Option Selected Option 1 - Single-life annuity: The maximum benefit is paid for the member’s lifetime. Option 2 - 50% to 65% Survivor Annuity: Paid to surviving spouse for his or her lifetime if certain
contributions were paid by the justice or judge while actively participating and if other criteria are met.
Option 3 - Option A – ½ Joint and Survivor Annuity: The member will receive a reduced retirement benefit for life and ½ of the reduced retirement benefit will be paid to the surviving joint annuitant for their lifetime. This option became available September 1, 2005.
Option 4 - Option B – 100% Joint and Survivor Annuity: A reduced benefit is paid to the member for life and the same benefit is paid to a surviving joint annuitant for their lifetime. This option became available September 1, 2005.
Deferred Members At June 30, 2010, there are 12 former members with deferred future benefits.
2010 COMPREHENSIVE ANNUAL FINANCIAL REPORT 69
UNIFORM RETIREMENT SYSTEM FOR JUSTICES AND JUDGES
Schedule of Average Benefit Payments Retirement Effective Dates Years of Credited Service July 1, 2000 to June 30, 2010 0 to 5
6 to 10 11 to 15 16 to 20 21 to 25 26 to 30 31+
Period 7/1/00 to 6/30/01 Average Monthly Benefit $ - $ 2,048 $ 3,188 $ 4,106 $ - $ - $ - Average Final Average Salary $ - $ 4,816 $ 4,887 $ 6,255 $ - $ - $ - Number of Active Retirees - 1 2 3 - - - Period 7/1/01 to 6/30/02 Average Monthly Benefit $ - $ - $ 1,711 $ 4,772 $ 6,066 $ - $ - Average Final Average Salary $ - $ - $ 5,356 $ 7,384 $ 7,704 $ - $ - Number of Active Retirees - - 2 2 1 - - Period 7/1/02 to 6/30/03 Average Monthly Benefit $ - $ - $ 3,460 $ 5,015 $ 5,586 $ 6,255 $ 6,446 Average Final Average Salary $ - $ - $ 5,643 $ 6,680 $ 6,845 $ 7,670 $ 7,905 Number of Active Retirees - - 3 10 6 2 1 Period 7/1/03 to 6/30/04 Average Monthly Benefit $ - $ 1,787 $ 1,437 $ 5,436 $ - $ 7,108 $ - Average Final Average Salary $ - $ 4,132 $ 4,744 $ 7,360 $ - $ 9,065 $ - Number of Active Retirees - 1 1 3 - 1 - Period 7/1/04 to 6/30/05 Average Monthly Benefit $ - $ 3,469 $ 3,763 $ 6,473 $ 7,459 $ 8,054 $ 9,440 Average Final Average Salary $ - $ 8,017 $ 7,534 $ 8,078 $ 7,559 $ 7,446 $ 8,728 Number of Active Retirees - 1 2 2 3 2 4 Period 7/1/05 to 6/30/06 Average Monthly Benefit $ - $ 2,529 $ 3,869 $ 4,597 $ 7,344 $ - $ 8,686 Average Final Average Salary $ - $ 6,755 $ 8,372 $ 6,423 $ 7,995 $ - $ 8,352 Number of Active Retirees - 1 1 2 4 - 1 Period 7/1/06 to 6/30/07 Average Monthly Benefit $ - $ 1,509 $ 3,591 $ 5,374 $ 7,470 $ 8,423 $ 8,151 Average Final Average Salary $ - $ 4,369 $ 7,936 $ 7,872 $ 7,580 $ 8,213 $ 7,838 Number of Active Retirees - 2 5 3 4 4 1 Period 7/1/07 to 6/30/08 Average Monthly Benefit $ - $ 2,918 $ 4,376 $ 4,968 $ 7,610 $ - $ 9,827 Average Final Average Salary $ - $ 7,296 $ 8,523 $ 8,015 $ 7,610 $ - $ 9,827 Number of Active Retirees - 1 2 2 1 - 1 Period 7/1/08 to 6/30/09 Average Monthly Benefit $ - $ - $ 4,248 $ 5,813 $ 8,822 $ - $ - Average Final Average Salary $ - $ - $ 8,579 $ 8,920 $ 9,016 $ - $ - Number of Active Retirees - - 4 2 5 - - Period 7/1/09 to 6/30/10 Average Monthly Benefit $ - $ - $ 3,522 $ 6,916 $ 9,197 $ 10,077 $ - Average Final Average Salary $ - $ - $ 6,845 $ 9,504 $ 9,459 $ 10,076 $ - Number of Active Retirees - - 4 3 8 2 -
70 2010 COMPREHENSIVE ANNUAL FINANCIAL REPORT
UNIFORM RETIREMENT SYSTEM FOR JUSTICES AND JUDGES
Principal Employer The Uniform Retirement System of Justices and Judges is a single-employer public employee retirement plan. The Plan covers Justices and Judges who sit on the Supreme Court of Oklahoma, the Oklahoma Court of Criminal Appeals, the Oklahoma Courts of Civil Appeals, the Oklahoma District Courts, and the Oklahoma Workers’ Compensation Court. The Plan also covers the Administrative Director of the Courts. Year Covered Ending Employees June 30, of the State
The passion and imagination of brothers Cass A. Mayo and John D. Mayo culminated in the
creation of the Mayo Hotel, opened in 1925. The brothers enlisted the services of architect
George Winkler in the design of their vision for a fi rst-class hotel in downtown Tulsa.
The Mayo played host to President John F. Kennedy as well as some of the most notable
fi gures of the last century from Hollywood and professional sports. The hotel became a
popular gathering place for Tulsa’s elite and also served as home for oilman, J. Paul Getty.
Winkler, inspired by Louis Sullivan’s Wainwright Building in St. Louis, designed a two-storey
base of Doric columns supporting fourteen fl oors. False terra cotta balconies provide the
illusion of vertical columns of windows along with a two-storey cap of stone and dentiled
cornice. The Mayo’s 600 original rooms were equipped with such modern conveniences
as ceiling fans and running ice water – a fi rst for buildings in the city and an oasis from the
summer heat.
The hotel was abandoned for 20 years after a failed renovation attempt in the 1980s.
Thankfully, the Mayo has been resurrected under new ownership in 2001 and has returned
to its previous splendor. The Mayo Hotel was added to the National Register of Historic
Places in 1980.
Mayo Hotel Tulsa, Oklahoma
2010 COMPREHENSIVE ANNUAL FINANCIAL REPORT 75
UNIFORM RETIREMENT SYSTEM FOR JUSTICES AND JUDGES
November 3, 2010 Board of Trustees Oklahoma Public Employees Retirement System 5801 N. Broadway Extension, Suite 400 P.O. Box 53007 Oklahoma City, OK 73152-3007
Re: Certification of 2010 Actuarial Results Under Prescribed Assumptions Dear Members of the Board: We have prepared an actuarial valuation of the Oklahoma Uniform Retirement System for Justices and Judges as of July 1, 2010 for the fiscal year ending June 30, 2011 using the prescribed assumptions and methods specified in 20 Okla. Stat, Section 1108(D). The results of the valuation reflect the benefit provisions in effect on July 1, 2010. Determinations for purposes other than meeting this requirement may be significantly different than the results shown here. The results in this Section have been prepared for the sole purpose of meeting the statutory reporting requirement, based on the following prescribed assumptions: Interest rate: 7.50%
COLA assumption: 2.00%
Mortality: RP-2000 Mortality Table for Employees, Healthy Retirees and Disabled Retirees with Mortality Projected Forward from 2000 using Scale AA.
Amortization period: 30 years, open period
Sources of all contributions and revenues, including dedicated tax free revenue and federal monies. All other assumptions, methodologies, and System provisions used are consistent with those used in the July 1, 2010 valuation. These assumptions, methodologies and provisions are described elsewhere in this document. In preparing the valuation, we, as the actuary, relied on the data provided by the System. As part of our work, we performed a limited review of the data for consistency and reasonableness and did not find material defects in the data. Since the valuation results are dependent on the integrity of the data supplied, the results can be expected to differ if the underlying data is incomplete, or missing. It should be noted that if any data or other information is inaccurate or incomplete, our calculations may need to be revised.
Cavanaugh Macdonald CC OO NN SS UU LL TT II NN GG ,, LL LL CC The experience and dedication you deserve
Cavanaugh Macdonald 3550 Busbee Pkwy, Suite 250
Kennesaw, GA 30144
Phone (678) 388-1700 Fax (678) 388-1730
www.CavMacConsulting.com
76 2010 COMPREHENSIVE ANNUAL FINANCIAL REPORT
UNIFORM RETIREMENT SYSTEM FOR JUSTICES AND JUDGES
Certification of 2010 Actuarial Results Under Prescribed Assumptions (continued)
The results shown here are not consistent with those in the July 1, 2010, valuation of the System. The July 1, 2010 valuation results were determined in accordance with generally accepted actuarial principles and practices that are consistent with the Actuarial Standards of Practice promulgated by the Actuarial Standards Board and the applicable Guides to Professional Conduct, amplifying opinion and supporting recommendations of the American Academy of Actuaries. The results shown in this section are not based on the assumptions and methodologies adopted by the Board of Trustees. The undersigned credentialed actuaries meet the Qualification Standards of the American Academy of Actuaries to render the actuarial opinion contained in this report. Respectfully submitted,
Alisa Bennett, FSA, EA, FCA, MAAA Patrice Beckham, FSA, EA, MAAA Principal and Senior Actuary Consulting Actuary
2010 COMPREHENSIVE ANNUAL FINANCIAL REPORT 77
UNIFORM RETIREMENT SYSTEM FOR JUSTICES AND JUDGES
Summary of Valuation Results Under Prescribed Assumptions
9. Previous year’s actual contribution a. Member $ 2,599,341 b. Employer 8,704,232 c. Total $ 11,303,573
Summary of Costs Actuarial Valuation as
of July 1, 2010
Required employer contribution for current year $ 11,133,994 Actual employer contributions received in prior year 8,704,232
Funded Status Actuarial accrued liability $ 277,111,001 Actuarial value of assets 230,010,299 Unfunded actuarial accrued liability 47,100,702 Funded Ratio 83.0%
Market Value of Assets and Additional Liabilities Market value of assets $ 211,180,555 Present value of projected future System benefits 360,152,979
78 2010 COMPREHENSIVE ANNUAL FINANCIAL REPORT
This page intenti onally left blank.
UNIFORM RETIREMENT SYSTEM FOR JUSTICES AND JUDGES
2010 COMPREHENSIVE ANNUAL FINANCIAL REPORT 79
UNIFORM RETIREMENT SYSTEM FOR JUSTICES AND JUDGES
NOTES
80 2010 COMPREHENSIVE ANNUAL FINANCIAL REPORT
UNIFORM RETIREMENT SYSTEM FOR JUSTICES AND JUDGES
NOTES
RETIREMENT BY DESIGN
U N I F O R M R E T I R E M E N T S Y S T E M F O R J U S T I C E S A N D J U D G E S