18
Retirement Plan Leakage—Cause For Concern And Action Prepared by Consulting Retirement Presentation to ERIC

Retirement Plan Leakage—Cause For Concern And Action
Prepared by ConsultingRetirement
Presentation to ERIC

2.1
2.6
4.1
2.2
11.0
4.9
15.9
8.8
Private Resources
Shortfall Private Needs
Social Security
Total Needs
Full-Career Contributors at age 65
State of Retirement: Many Employees are on a Rocky Road
15.9 times pay at age 65 translates to 85% income replacement ratio
Nearly 30% of employees are “on track” for adequate retirement
Methodology assumes no pre-retirement distributions
Defined Contribution Plan—Employee Portion
Defined Contribution Plan—Employer Portion
Defined Benefit Plan
Shortfall
Private Needs
Social Security
Total Needs
Source: Aon Hewitt study The Real Deal—2012 Retirement Income Adequacy at Large Companies
Consulting | RetirementERIC Presentation.ppt/331 K1 62008 04/2013 1
DC Employee
DC Employer
DB

2
Retirement Plan Leakage: The Pothole on the Road to Retirement
Source: Hello Wallet study The Retirement Breach in Defined Contribution Plans
Consulting | RetirementERIC Presentation.ppt/331 K1 62008 04/2013
Retirement SavingsHardship
Withdrawals
Loans
Cashouts
Over 25%of DC participants use savings for non-retirement
purposes

3
Retirement Plan Leakage: The Pothole on the Road to Retirement
Source: Hello Wallet study The Retirement Breach in Defined Contribution Plans
Consulting | RetirementERIC Presentation.ppt/331 K1 62008 04/2013
Retirement Savings
Employers contribute $118
billion every year
Employees contribute $175
billion every year
$70 billion removed for non-retirement purposes

4
DC Leakage: Hardship Withdrawals
Consulting | RetirementERIC Presentation.ppt/331 K1 62008 04/2013
Sources: Aon Hewitt study 2011 Trends and Experience in 401(k) Plans, Aon Hewitt study 2013 Universe Benchmarks
93%
Plans Allowing
2%
Participants Using
$5,160Average Hardship
Withdrawal:

Sample Impact of Hardship Withdrawals on Retirement Income
5
Assumptions: Individual earning $50,000 starts saving at age 30 and has total contributions to the plan (employee and employer) equal to 13% of pay. Pay grows at 3% per year and investments earn 7% per year.
Consulting | RetirementERIC Presentation.ppt/331 K1 62008 04/2013
The hardship withdrawal scenario assumes the individual takes one $5,000 withdrawal at age 40 and ceases making contributions for 1 year thereafter.
The total impact reduces the age 65 account by nearly 0.5x pay.

6
DC Leakage: Loans
Consulting | RetirementERIC Presentation.ppt/331 K1 62008 04/2013
94%
Plans Allowing
27%
Participants Using
$8,074Average Loan Outstanding:
21%Percent of Balance:
Sources: Aon Hewitt study 2011 Trends and Experience in 401(k) Plans, Aon Hewitt study 2013 Universe Benchmarks, Aon Hewitt and Ariel Investments study 401(k) Plans in Living Color,
Encourages plan participation 69% of participants default when terminating
81% of participants continue contributions Minorities are more likely to default
Advantages Disadvantages
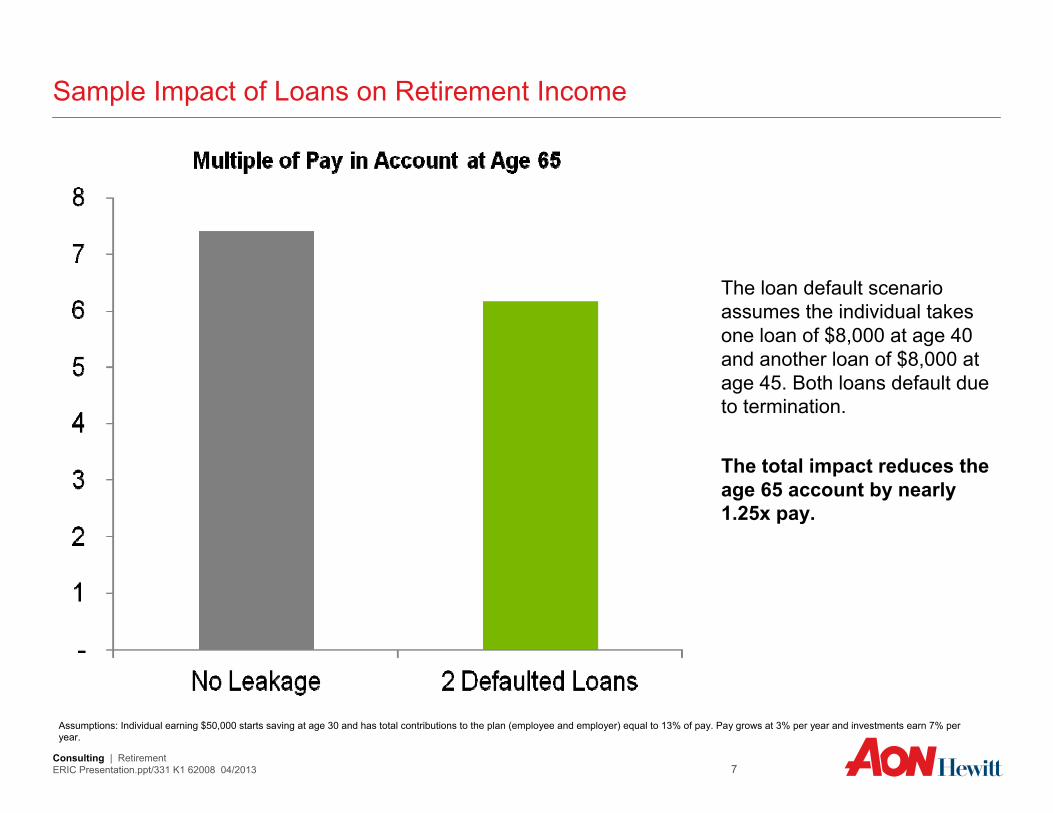
Sample Impact of Loans on Retirement Income
7
The loan default scenario assumes the individual takes one loan of $8,000 at age 40 and another loan of $8,000 at age 45. Both loans default due to termination.
The total impact reduces the age 65 account by nearly 1.25x pay.
Consulting | RetirementERIC Presentation.ppt/331 K1 62008 04/2013
Assumptions: Individual earning $50,000 starts saving at age 30 and has total contributions to the plan (employee and employer) equal to 13% of pay. Pay grows at 3% per year and investments earn 7% per year.

8
DC Leakage: Cashouts
Source: Aon Hewitt 2013 Universe Benchmarks
Consulting | RetirementERIC Presentation.ppt/331 K1 62008 04/2013
43%
Cash Distributions from DC PlansPost Termination Behavior from DC Plan Participants

9
DC Leakage: GAO Rollover Report
Finding: Inefficient post-termination processes and IRA marketing pressures participants into often unsuitable IRAs
Recommendation: DOL and IRS should encourage disclosures and activities that promote plan-to-plan rollover
Consulting | RetirementERIC Presentation.ppt/331 K1 62008 04/2013

10
Retirement Security Threat: Post-Termination Options
Consulting | RetirementERIC Presentation.ppt/331 K1 62008 04/2013
Within Employer System
Rollover to
IRA
TakeCash
Distribution
Fidu
ciar
y P
rote
ctio
n &
E
arm
arki
ng fo
r Ret
irem
ent
Ease, Fees, & Investment Choices

Sample Impact of Cashouts on Retirement Income
11
The cashout scenario assumes the participant takes a cash distribution of the retirement assets and does not earmark the money for retirement purposes. The cashouts occur at age 42, 50, and 57.
The total impact reduces the age 65 account by over 6x pay to only 1.25x pay.
Consulting | RetirementERIC Presentation.ppt/331 K1 62008 04/2013
Assumptions: Individual earning $50,000 starts saving at age 30 and has total contributions to the plan (employee and employer) equal to 13% of pay. Pay grows at 3% per year and investments earn 7% per year.

12
DB Leakage: Lump Sum Windows
• Average lump sum election rate of 55%
• Lump sum election rate is 45% when calculated on a dollar-weighted basis
• 2013: 39% of sponsors very or somewhat likely to add or liberalize a lump sum window
Source: Aon Hewitt study of 30 lump sum windows in 2012, see “Pension Settlements Through Terminated Vested Lump-Sum Windows”for additional information and Aon Hewitt Hot Topics in Retirement 2013
Consulting | RetirementERIC Presentation.ppt/331 K1 62008 04/2013

13
DB Leakage: Lump Sum Windows
Participants with lower account balances are more likely to take a lump sumYounger participants, who generally have lower balances, are more likely to take lump sums
Consulting | RetirementERIC Presentation.ppt/331 K1 62008 04/2013
Source: Aon Hewitt study of 30 lump sum windows in 2012, see “Pension Settlements Through Terminated Vested Lump-Sum Windows”for additional information

14
Females had a 2% higher election rate than males.
Plans that permanently added the feature had lower election rates (≈20%)
Ideal election period was 45-60 days. Anything less had lower election
percentage.
14
DB Leakage: Impact of Different Variables on Lump Sum Election Percentages
Had Significant Impact
Size of Lump Sum Amount
As the lump sum increased, the election percentage decreased.
Length of Window
Companies who made calls had 62% election vs. 45% election without calls
Permanence
Follow-up Calls
Non-Union participants had a 1% higher election rate than union participants.
After excluding automatic cash-outs, all ages had similar election percentages.
Had Little Impact
Gender
Age
Salaried participants had 1% higher election rate than hourly participants.
Union Status
Pay Structure
Consulting | RetirementERIC Presentation.ppt/331 K1 62008 04/2013
Source: Aon Hewitt study of 30 lump sum windows in 2012, see “Pension Settlements Through Terminated Vested Lump-Sum Windows”for additional information

Limit the dollars available for loans and withdrawals
Modify the availability of loans and withdrawals
Increase the penalty for removing money from the tax-preferred system
Add waiting periods before a second loan or withdrawal can be taken
Support easier loan repayment following termination
Aon Hewitt’s Thoughts on Reducing Leakage
15Consulting | RetirementERIC Presentation.ppt/331 K1 62008 04/2013

Encourage lifetime income
Allow DB sponsors to eliminate lump sum option
Educate to promote financial literacy
Promote the employer system
Simplify the rollover process
Aon Hewitt’s Thoughts on Reducing Leakage
16Consulting | RetirementERIC Presentation.ppt/331 K1 62008 04/2013

17
Let’s Hear From You
Consulting | RetirementERIC Presentation.ppt/331 K1 62008 04/2013
2. Is the form of leakage a concern?– Stay in the employer plan or roll over to a
new employer plan?– Roll over to an IRA?– Purchase an annuity?
3. Should DB and DC plans be treated the same from a public policy perspective?
4. Should this issue be addressed during the current tax/budget discussions in 2013?
1. How much of a concern is leakage to plan sponsors?


