30
Retirement Planning and Income Protection Building and implementing your retirement plan

Retirement Planning and Income ProtectionBuilding and implementing your retirement plan

Contents
Key Risks02 Retirement is different today03 Improper asset allocation04 The impact of inflation05 Market volatility07 Rising health care costs08 Outliving your savings
Saving for Retirement10 Begin saving for
retirement early11 Personal and workplace investments13 Income protection and saving
for retirement
Transitioning to Retirement16 Essential and discretionary
expense coverage17 Diverse sources of income18 Guaranteed sources of income
Living in Retirement20 Social Security benefits21 Required minimum distributions22 Income protection and living
in retirement24 Creating a retirement cash flow
Your Next Steps26 Put your strategies to work
RETIREMENT PLANNING AND INCOME PROTECTION 1
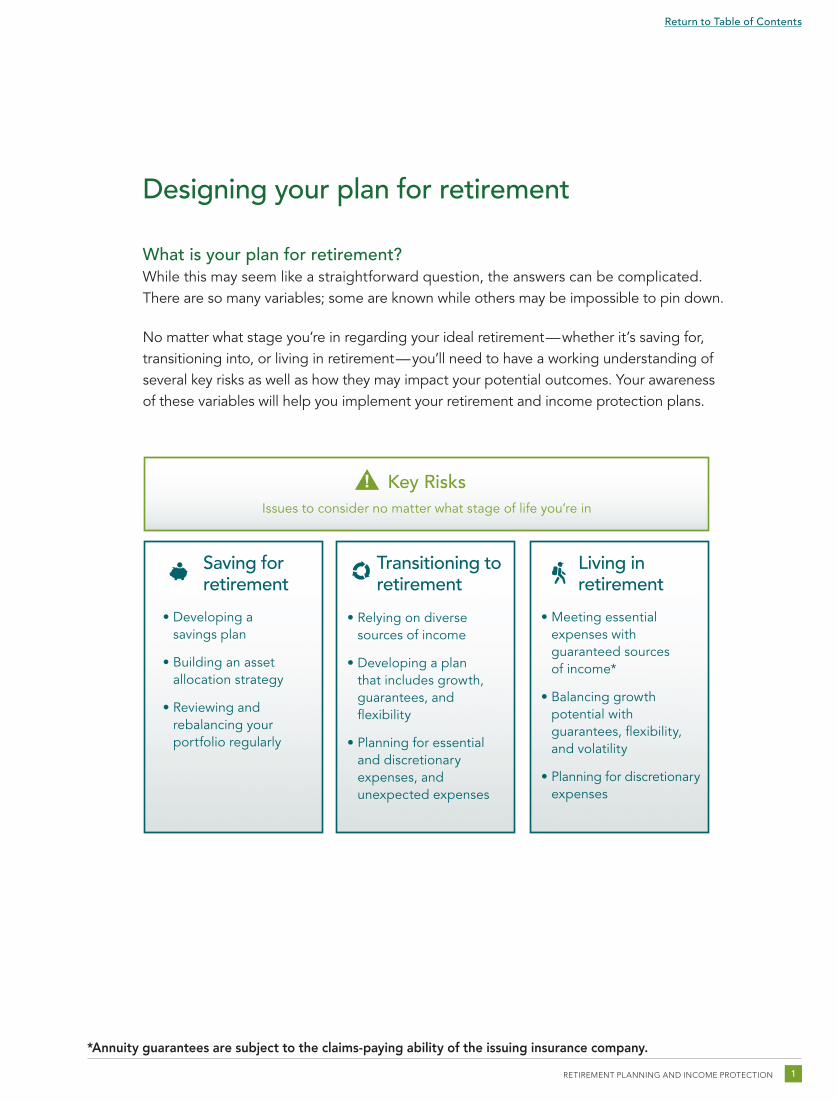
Designing your plan for retirement
What is your plan for retirement? While this may seem like a straightforward question, the answers can be complicated. There are so many variables; some are known while others may be impossible to pin down.
No matter what stage you’re in regarding your ideal retirement — whether it’s saving for, transitioning into, or living in retirement — you’ll need to have a working understanding of several key risks as well as how they may impact your potential outcomes. Your awareness of these variables will help you implement your retirement and income protection plans.
Key RisksIssues to consider no matter what stage of life you’re in
• Developing a savings plan
• Building an asset allocation strategy
• Reviewing and rebalancing your portfolio regularly
Transitioning to retirement
Saving for retirement
Living in retirement
• Meeting essential expenses with guaranteed sources of income*
• Balancing growth potential with guarantees, flexibility, and volatility
• Planning for discretionary expenses
• Relying on diverse sources of income
• Developing a plan that includes growth, guarantees, and flexibility
• Planning for essential and discretionary expenses, and unexpected expenses
*Annuity guarantees are subject to the claims-paying ability of the issuing insurance company.
Return to Table of Contents
RETIREMENT PLANNING AND INCOME PROTECTION2
KEY RISKS
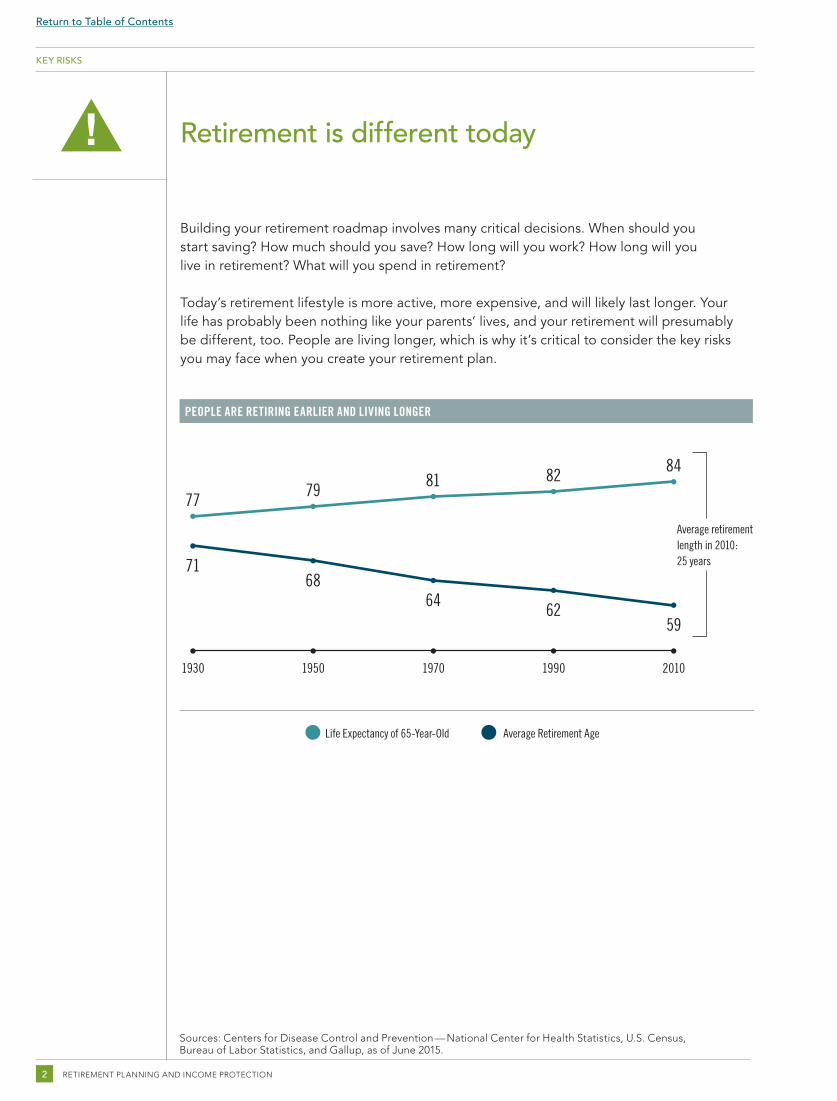
Retirement is different today
Building your retirement roadmap involves many critical decisions. When should you start saving? How much should you save? How long will you work? How long will you live in retirement? What will you spend in retirement?
Today’s retirement lifestyle is more active, more expensive, and will likely last longer. Your life has probably been nothing like your parents’ lives, and your retirement will presumably be different, too. People are living longer, which is why it’s critical to consider the key risks you may face when you create your retirement plan.
Sources: Centers for Disease Control and Prevention — National Center for Health Statistics, U.S. Census, Bureau of Labor Statistics, and Gallup, as of June 2015.
Life Expectancy of 65-Year-Old Average Retirement Age
PEOPLE ARE RETIRING EARLIER AND LIVING LONGER
1930 1950 1970 1990 2010
77 79 81 82 84
596264
6871
Average retirement length in 2010: 25 years
Return to Table of Contents
KEY RISKS 3
KEY RISKS
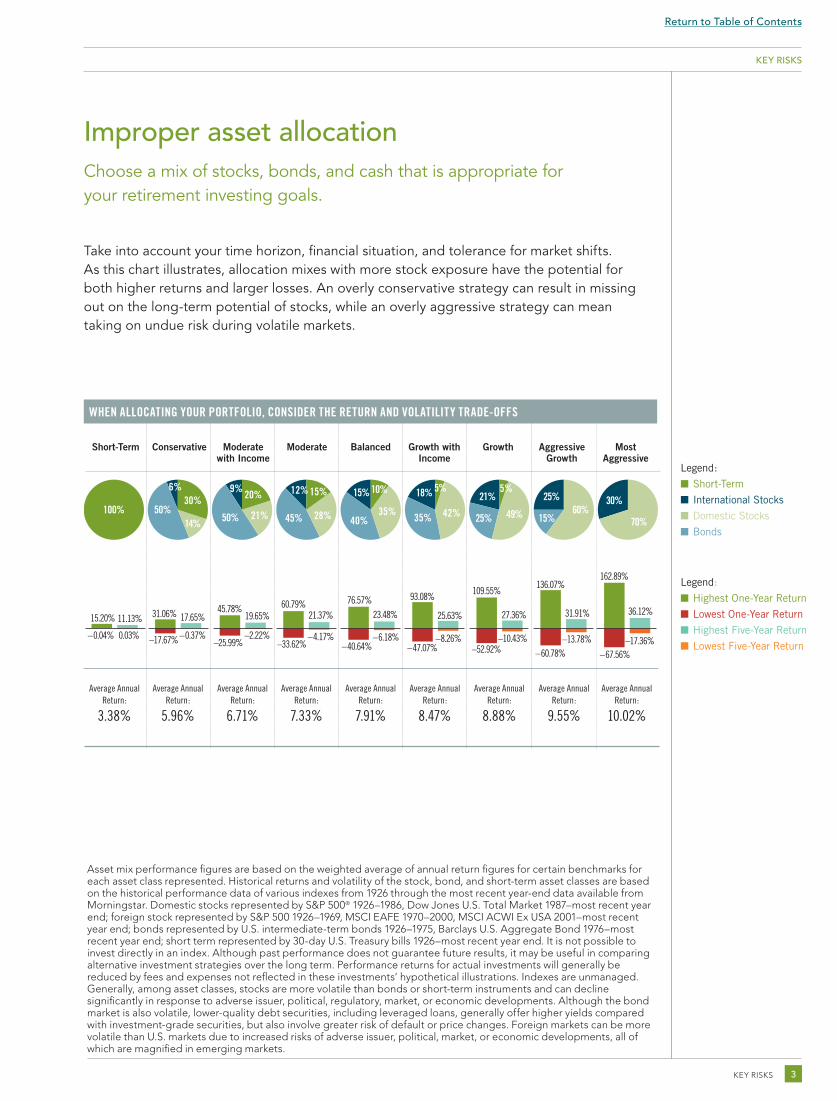
Asset mix performance figures are based on the weighted average of annual return figures for certain benchmarks for each asset class represented. Historical returns and volatility of the stock, bond, and short-term asset classes are based on the historical performance data of various indexes from 1926 through the most recent year-end data available from Morningstar. Domestic stocks represented by S&P 500® 1926–1986, Dow Jones U.S. Total Market 1987–most recent year end; foreign stock represented by S&P 500 1926–1969, MSCI EAFE 1970–2000, MSCI ACWI Ex USA 2001–most recent year end; bonds represented by U.S. intermediate-term bonds 1926–1975, Barclays U.S. Aggregate Bond 1976–most recent year end; short term represented by 30-day U.S. Treasury bills 1926–most recent year end. It is not possible to invest directly in an index. Although past performance does not guarantee future results, it may be useful in comparing alternative investment strategies over the long term. Performance returns for actual investments will generally be reduced by fees and expenses not reflected in these investments’ hypothetical illustrations. Indexes are unmanaged. Generally, among asset classes, stocks are more volatile than bonds or short-term instruments and can decline significantly in response to adverse issuer, political, regulatory, market, or economic developments. Although the bond market is also volatile, lower-quality debt securities, including leveraged loans, generally offer higher yields compared with investment-grade securities, but also involve greater risk of default or price changes. Foreign markets can be more volatile than U.S. markets due to increased risks of adverse issuer, political, market, or economic developments, all of which are magnified in emerging markets.
Short TermAggressive
GrowthMost
AggressiveConservative Balanced Growth
76.57%23.48%
–6.18%–40.64%
31.06% 17.65%
–0.37%–17.67%
15.20% 11.13%
0.03%–0.04%
162.89%
36.12%
–17.36%–67.56%
136.07%
31.91%
–13.78%–60.78%
109.55%
27.36%
–10.43%–52.92%
100%30%
14%50%
6% 10%
35%40%
15% 5%
49%25%
21%
70%
30%60%
15%
25%
50%
20%
21%
9%
45%
12% 15% 28%
5%18%
35% 42%
93.08%
25.63%
–8.26%–47.07%
45.78%19.65%
–2.22%–25.99%
60.79%21.37%
–4.17%–33.62%
WHEN ALLOCATING YOUR PORTFOLIO, CONSIDER THE RETURN AND VOLATILITY TRADE-OFFS
Short-Term Conservative Moderate with Income
Moderate Balanced Growth with Income
Growth Aggressive Growth
Most Aggressive
Average Annual Return:
3.38%
Average Annual Return:
5.96%
Average Annual Return:
6.71%
Average Annual Return:
7.33%
Average Annual Return:
7.91%
Average Annual Return:
8.47%
Average Annual Return:
8.88%
Average Annual Return:
9.55%
Average Annual Return:
10.02%
Short TermAggressive
GrowthMost
AggressiveBalanced Growth
100%30%
14%50%
6% 10%
35%40%
15% 5%
49%25%
21%
70%
30%60%
15%
25%
50%
20%
21%
9%
45%
12% 15% 28%
5%18%
35% 42%
100%Short Term
30%Short Term
14%U.S. Stocks
50%Bonds
6%Int’l Stocks
10%Short Term
35%U.S. Stocks40%
Bonds
15%Int’l Stocks
5%Short Term
49%U.S. Stocks
25%Bonds
21%Int’l Stocks
60%U.S. Stocks
15%Bonds
25%Int’l Stocks
70%U.S. Stocks
30%Int’l Stocks
Legend:
n Short-Term n International Stocks n Domestic Stocks n Bonds
Legend:
n Highest One-Year Return
n Lowest One-Year Return
n Highest Five-Year Return n Lowest Five-Year Return
Improper asset allocationChoose a mix of stocks, bonds, and cash that is appropriate for your retirement investing goals.
Take into account your time horizon, financial situation, and tolerance for market shifts. As this chart illustrates, allocation mixes with more stock exposure have the potential for both higher returns and larger losses. An overly conservative strategy can result in missing out on the long-term potential of stocks, while an overly aggressive strategy can mean taking on undue risk during volatile markets.
Return to Table of Contents
RETIREMENT PLANNING AND INCOME PROTECTION4
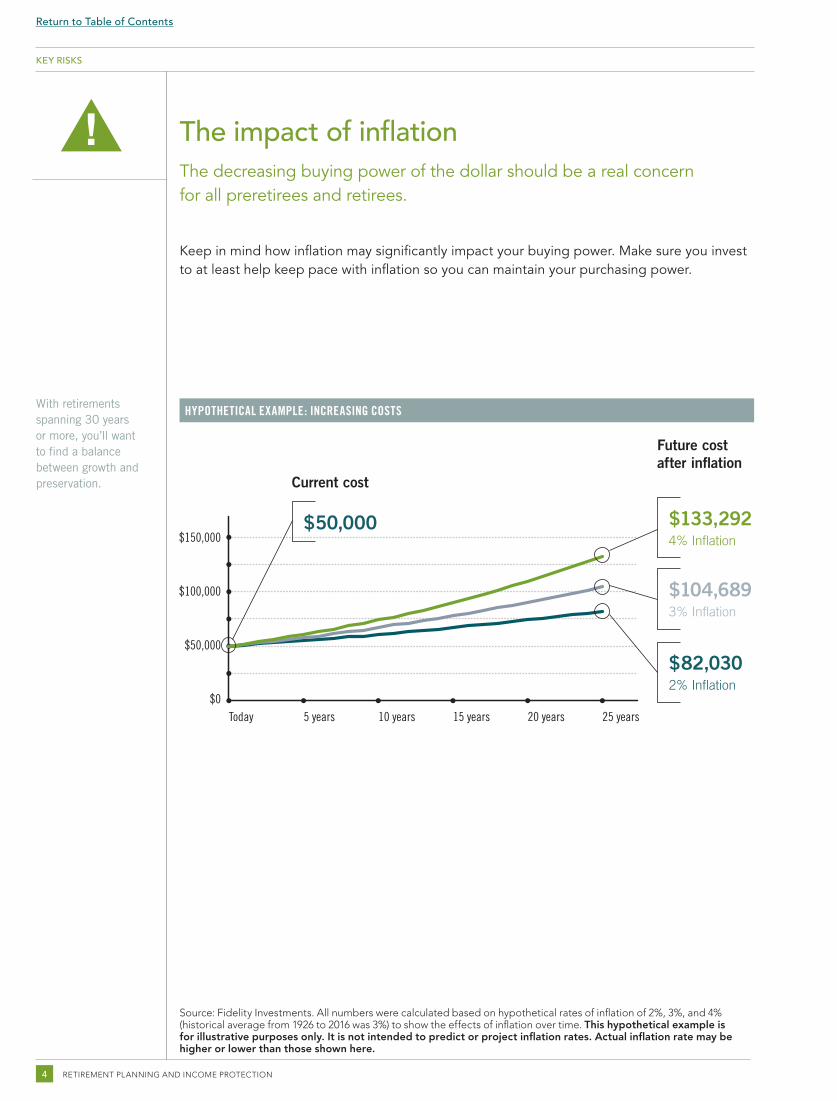
The impact of inflationThe decreasing buying power of the dollar should be a real concern for all preretirees and retirees.
Keep in mind how inflation may significantly impact your buying power. Make sure you invest to at least help keep pace with inflation so you can maintain your purchasing power.
Source: Fidelity Investments. All numbers were calculated based on hypothetical rates of inflation of 2%, 3%, and 4%(historical average from 1926 to 2016 was 3%) to show the effects of inflation over time. This hypothetical example isfor illustrative purposes only. It is not intended to predict or project inflation rates. Actual inflation rate may behigher or lower than those shown here.
With retirements spanning 30 years or more, you’ll want to find a balance between growth and preservation.
KEY RISKS
HYPOTHETICAL EXAMPLE: INCREASING COSTS
$0Today 5 years 10 years 15 years 20 years 25 years
$50,000
$100,000
$150,000$50,000
Current cost
$104,6893% Inflation
$82,0302% Inflation
Future cost after inflation
$133,2924% Inflation
Return to Table of Contents
KEY RISKS 5
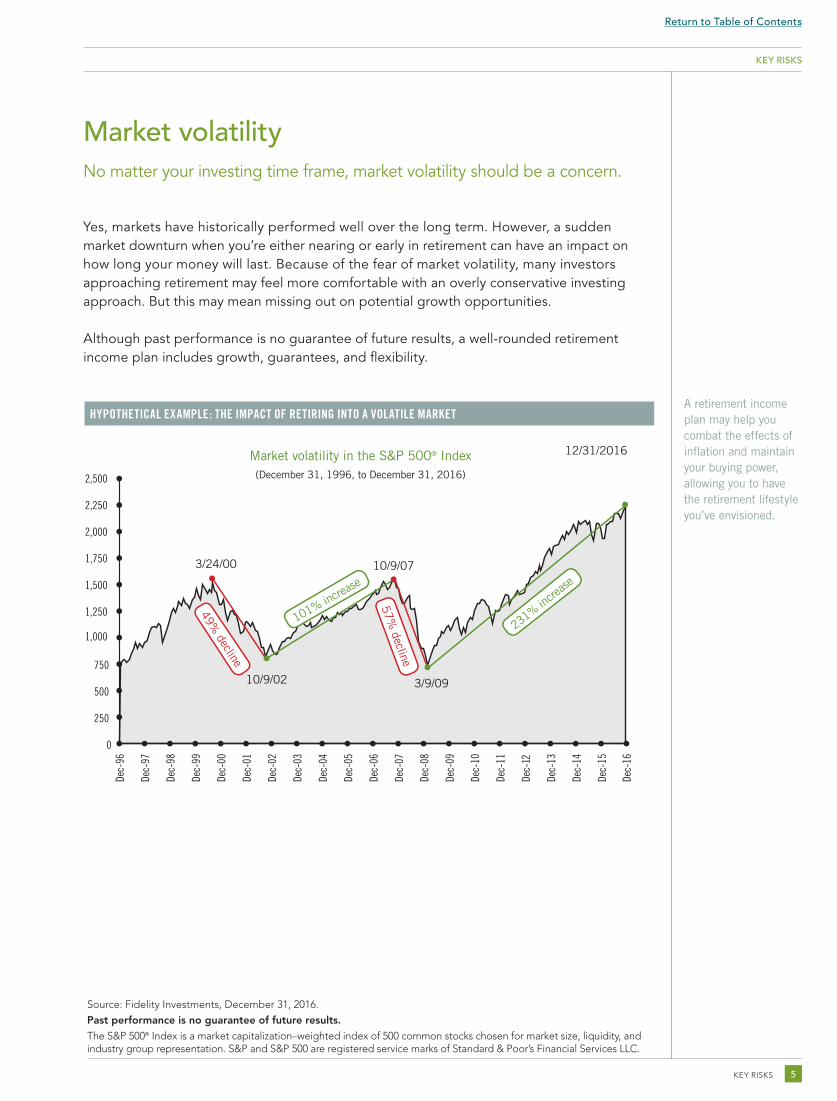
Market volatilityNo matter your investing time frame, market volatility should be a concern.
Yes, markets have historically performed well over the long term. However, a sudden market downturn when you’re either nearing or early in retirement can have an impact on how long your money will last. Because of the fear of market volatility, many investors approaching retirement may feel more comfortable with an overly conservative investing approach. But this may mean missing out on potential growth opportunities.
Although past performance is no guarantee of future results, a well-rounded retirement income plan includes growth, guarantees, and flexibility.
A retirement income plan may help you combat the effects of inflation and maintain your buying power, allowing you to have the retirement lifestyle you’ve envisioned.
Source: Fidelity Investments, December 31, 2016.
Past performance is no guarantee of future results.
The S&P 500® Index is a market capitalization–weighted index of 500 common stocks chosen for market size, liquidity, and industry group representation. S&P and S&P 500 are registered service marks of Standard & Poor’s Financial Services LLC.
KEY RISKS
HYPOTHETICAL EXAMPLE: THE IMPACT OF RETIRING INTO A VOLATILE MARKET
0
250
500
750
1,250
1,000
1,500
1,750
2,000
2,250
2,500
Dec-
14
Dec-
15
Dec-
16
Dec-
96
Dec-
97
Dec-
98
Dec-
99
Dec-
00
Dec-
01
Dec-
02
Dec-
03
Dec-
04
Dec-
05
Dec-
06
Dec-
07
Dec-
08
Dec-
09
Dec-
10
Dec-
11
Dec-
12
Dec-
13
3/24/00
10/9/02 3/9/09
10/9/07
49% decline
101% increase
57% decline
12/31/2016
231% incre
ase
Market volatility in the S&P 500® Index(December 31, 1996, to December 31, 2016)
Return to Table of Contents
RETIREMENT PLANNING AND INCOME PROTECTION6
KEY RISKS
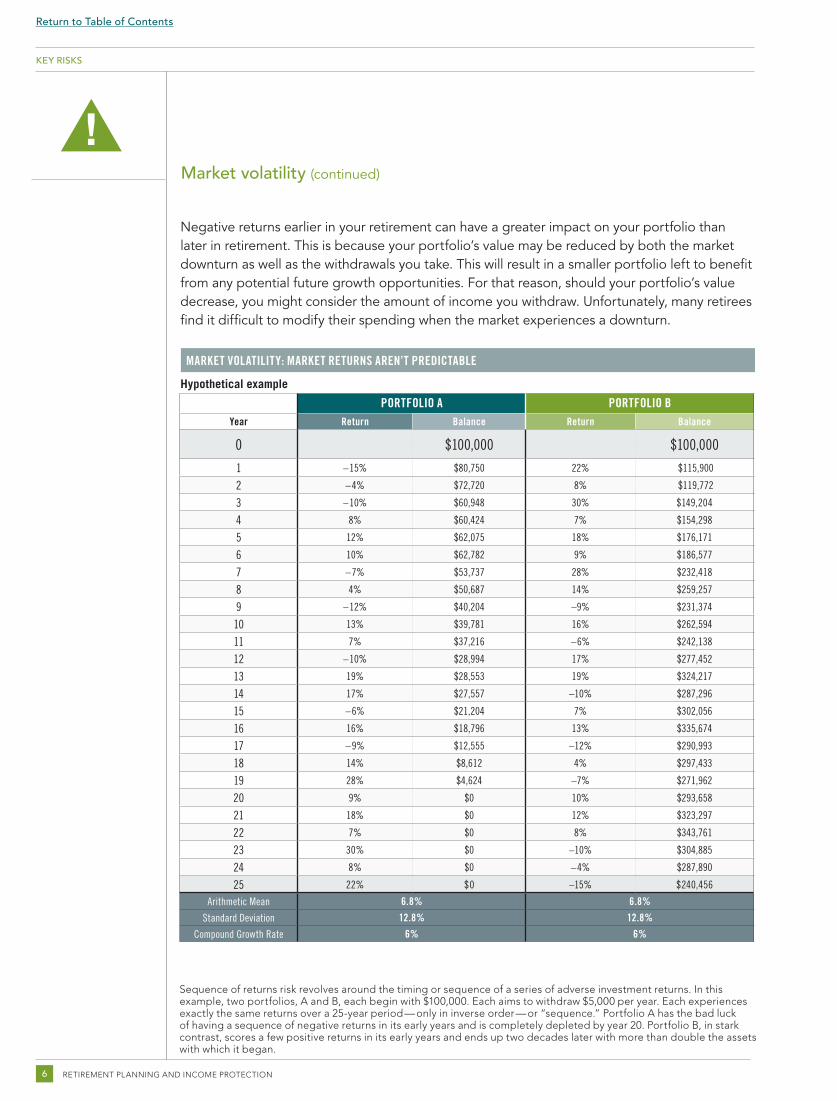
MARKET VOLATILITY: MARKET RETURNS AREN’T PREDICTABLE
Negative returns earlier in your retirement can have a greater impact on your portfolio than later in retirement. This is because your portfolio’s value may be reduced by both the market downturn as well as the withdrawals you take. This will result in a smaller portfolio left to benefit from any potential future growth opportunities. For that reason, should your portfolio’s value decrease, you might consider the amount of income you withdraw. Unfortunately, many retirees find it difficult to modify their spending when the market experiences a downturn.
Hypothetical example
PORTFOLIO A PORTFOLIO BYear Return Balance Return Balance
0 $100,000 $100,000
1 –15% $80,750 22% $115,900
2 –4% $72,720 8% $119,772
3 –10% $60,948 30% $149,204
4 8% $60,424 7% $154,298
5 12% $62,075 18% $176,171
6 10% $62,782 9% $186,577
7 –7% $53,737 28% $232,418
8 4% $50,687 14% $259,257
9 –12% $40,204 –9% $231,374
10 13% $39,781 16% $262,594
11 7% $37,216 –6% $242,138
12 –10% $28,994 17% $277,452
13 19% $28,553 19% $324,217
14 17% $27,557 –10% $287,296
15 –6% $21,204 7% $302,056
16 16% $18,796 13% $335,674
17 –9% $12,555 –12% $290,993
18 14% $8,612 4% $297,433
19 28% $4,624 –7% $271,962
20 9% $0 10% $293,658
21 18% $0 12% $323,297
22 7% $0 8% $343,761
23 30% $0 –10% $304,885
24 8% $0 –4% $287,890
25 22% $0 –15% $240,456
Arithmetic Mean 6.8% 6.8%
Standard Deviation 12.8% 12.8%
Compound Growth Rate 6% 6%
Sequence of returns risk revolves around the timing or sequence of a series of adverse investment returns. In this example, two portfolios, A and B, each begin with $100,000. Each aims to withdraw $5,000 per year. Each experiences exactly the same returns over a 25-year period — only in inverse order — or “sequence.” Portfolio A has the bad luck of having a sequence of negative returns in its early years and is completely depleted by year 20. Portfolio B, in stark contrast, scores a few positive returns in its early years and ends up two decades later with more than double the assets with which it began.
Market volatility (continued)
Return to Table of Contents

KEY RISKS 7
KEY RISKS
Rising health care costsHealth care expenses should be addressed in your planning.
Longer life spans, rising medical costs, declining employer-sponsored medical coverage, and possible shortfalls ahead for Medicare all combine to make health care expenses a critical challenge for preretirees and retirees.
HEALTH CARE EXPENSES CAN TAKE A CHUNK OUT OF SAVINGS
40%Medicare
cost-sharing provisions
24%Out-of-pocketprescription
drug expenses
36%Out-of-pocketfor Medicare, Part B and D
premiums
$260,000Out-of-pocket
health care expense estimate for a
65-year-old couple1
A 2016 Fidelity study estimated that a couple retiring today at the age of 65 will need $260,000 to cover medical care costs throughout retirement.
For illustrative purposes only.
Return to Table of Contents
RETIREMENT PLANNING AND INCOME PROTECTION8
KEY RISKS
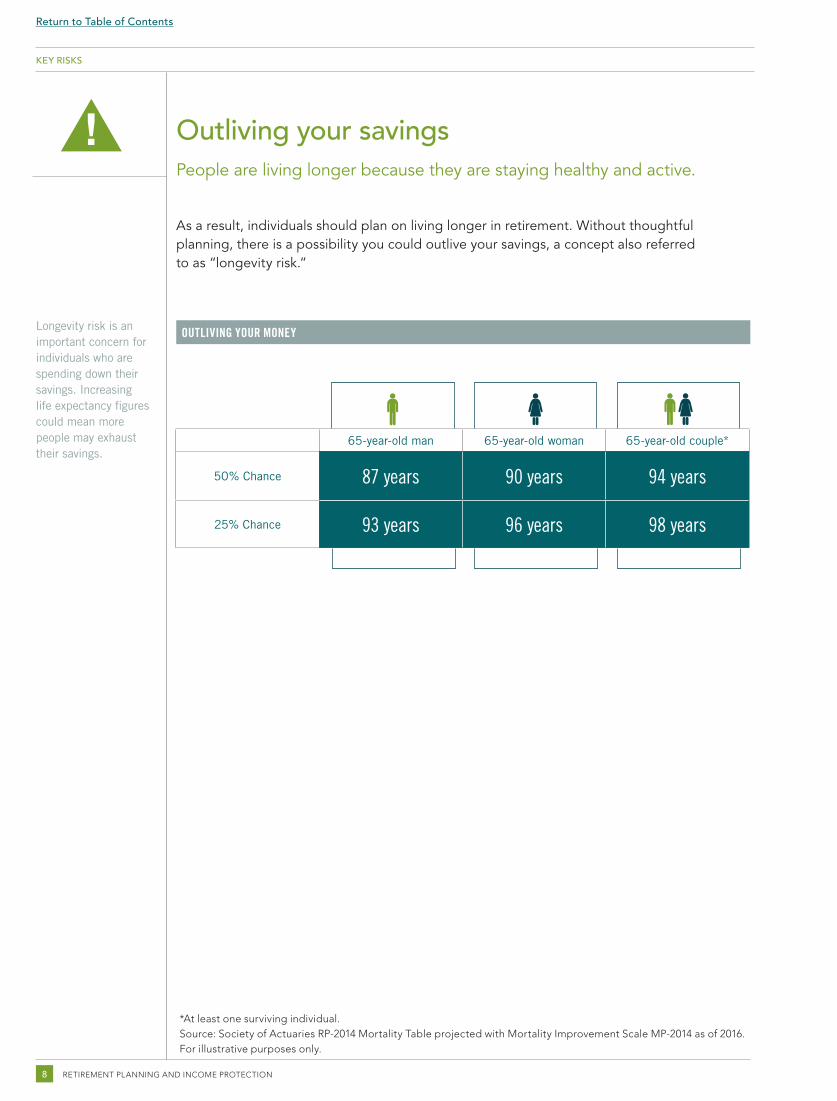
Outliving your savingsPeople are living longer because they are staying healthy and active.
As a result, individuals should plan on living longer in retirement. Without thoughtful planning, there is a possibility you could outlive your savings, a concept also referred to as “longevity risk.”
OUTLIVING YOUR MONEY
65-year-old man 65-year-old woman 65-year-old couple*
50% Chance 87 years 90 years 94 years
25% Chance 93 years 96 years 98 years
Longevity risk is an important concern for individuals who are spending down their savings. Increasing life expectancy figures could mean more people may exhaust their savings.
*At least one surviving individual.Source: Society of Actuaries RP-2014 Mortality Table projected with Mortality Improvement Scale MP-2014 as of 2016.For illustrative purposes only.
Return to Table of Contents

SAVING FOR RETIREMENT 9
Saving for retirement
• What is your plan for retirement?
• Are you on track to reach your retirement goals?
• Are you saving enough?
You should start early to save for your retirement and take steps to accumulate enough assets to last your lifetime. In general, Fidelity believes you may need to save 10% to 15% or more of your earnings each year in order to reach your long-term retirement savings goals. Given the rising cost of health care, education, and living expenses, this is more challenging than ever. This is why you’ll want to maximize all the tax advantages available to you.
In addition, you should:• Develop a retirement savings plan
• Consolidate your retirement plan assets*
• Build an asset allocation strategy designed to your needs and stay committed to it
• Regularly review and rebalance your retirement portfolio’s results
* Be sure to consider all your available options and the applicable fees and features of each before moving your retirement assets.
Return to Table of Contents
RETIREMENT PLANNING AND INCOME PROTECTION10
Additional savings opportunities that may be available for you include increasing contributions to your workplace savings plan, contributing to another tax-advantaged savings vehicle such as an IRA or an annuity, and paying off debt.
SAVING FOR RETIREMENT
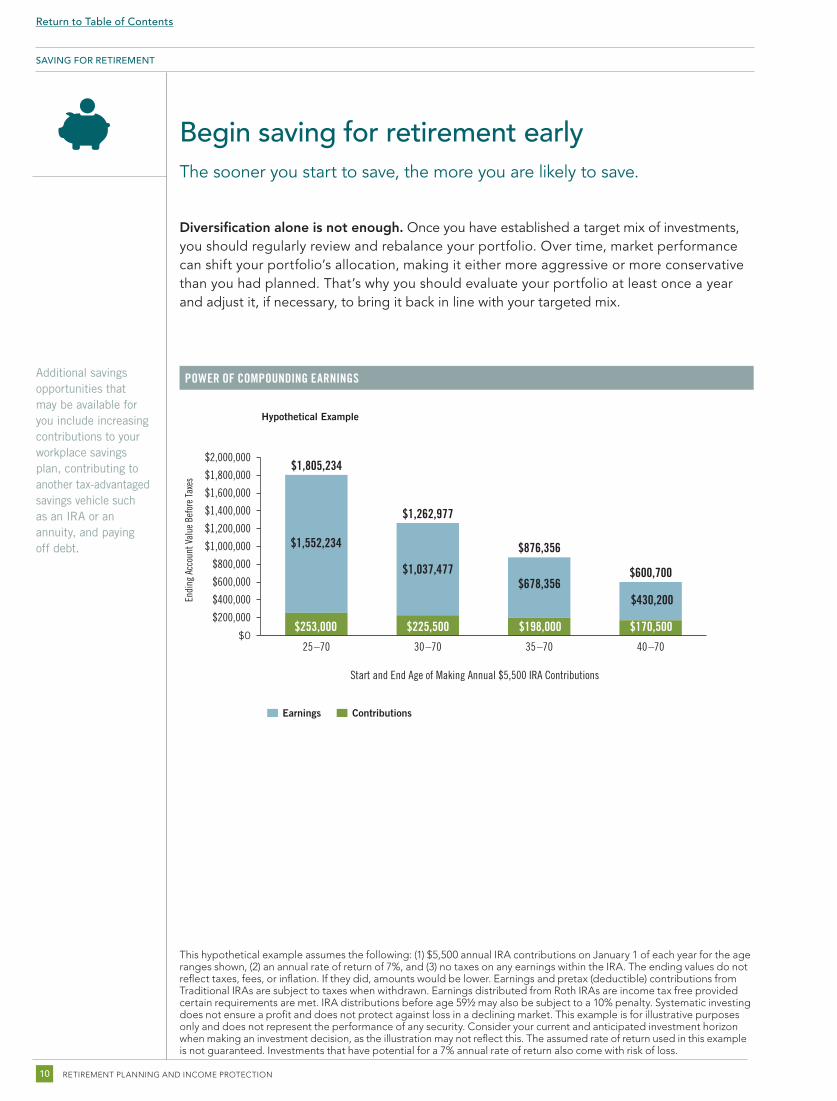
Begin saving for retirement early The sooner you start to save, the more you are likely to save.
Diversification alone is not enough. Once you have established a target mix of investments, you should regularly review and rebalance your portfolio. Over time, market performance can shift your portfolio’s allocation, making it either more aggressive or more conservative than you had planned. That’s why you should evaluate your portfolio at least once a year and adjust it, if necessary, to bring it back in line with your targeted mix.
POWER OF COMPOUNDING EARNINGS
This hypothetical example assumes the following: (1) $5,500 annual IRA contributions on January 1 of each year for the age ranges shown, (2) an annual rate of return of 7%, and (3) no taxes on any earnings within the IRA. The ending values do not reflect taxes, fees, or inflation. If they did, amounts would be lower. Earnings and pretax (deductible) contributions from Traditional IRAs are subject to taxes when withdrawn. Earnings distributed from Roth IRAs are income tax free provided certain requirements are met. IRA distributions before age 59½ may also be subject to a 10% penalty. Systematic investing does not ensure a profit and does not protect against loss in a declining market. This example is for illustrative purposes only and does not represent the performance of any security. Consider your current and anticipated investment horizon when making an investment decision, as the illustration may not reflect this. The assumed rate of return used in this example is not guaranteed. Investments that have potential for a 7% annual rate of return also come with risk of loss.
$0
$200,000
$400,000
$600,000
$800,000
$1,000,000
$1,200,000
$1,400,000
$1,600,000
$1,800,000
$2,000,000
40–7035–7030–7025–70
Endi
ng A
ccou
nt V
alue
Bef
ore
Taxe
s
$1,805,234
$1,552,234
$253,000 $225,500 $198,000 $170,500
$1,262,977
$1,037,477
$876,356
$678,356$600,700
$430,200
Hypothetical Example
Start and End Age of Making Annual $5,500 IRA Contributions
Earnings Contributions
Return to Table of Contents
SAVING FOR RETIREMENT 11
SAVING FOR RETIREMENT
Personal and workplace investmentsTake full advantage of the retirement savings alternatives available to you.
As you develop your retirement savings plan, there are a few important goals to keep in mind:
• Increasing your tax-advantaged and taxable savings
• Managing the impact current taxes have on your investment income
• Taking advantage of the potential to grow your retirement assets faster than with comparable taxable investments
• Gaining greater control over when you pay taxes
Among the largest tax benefits available to most retirement savers are the deferral advantages offered by retirement savings accounts such as 401(k) plans, 403(b) plans, and IRAs. These accounts can offer a double dose of tax advantages — the contributions you make may reduce your current taxable income, saving you cash this year, and any investment growth is tax deferred, saving you money while you are invested.
To max out all the tax advantages available to you, make sure to:
• Get your full company match
• Contribute the maximum to your workplace savings plan
• Contribute the maximum to a traditional IRA, if you qualify*
These types of retirement savings accounts have strict annual contribution limit rules. If you’re looking for additional tax-deferred savings opportunities, you should consider a deferred variable annuity,† which has no IRS contribution limits.‡
* For a traditional IRA, full deductibility of a contribution is available to active participants whose 2017 Modified Adjusted Gross Income (MAGI) is $99,000 or less (joint) and $62,000 or less (single); partial deductibility for MAGI up to $119,000 (joint) and $72,000 (single). In addition, full deductibility of a 2017 contribution is available for working or nonworking spouses who are not covered by an employer-sponsored plan and whose MAGI is less than $186,000; partial deductibility for MAGI up to $196,000 for 2017.
† Investing in a variable annuity involves risk of loss — investment returns and contract value are not guaranteed and will fluctuate.
‡ Issuing insurance company reserves the right to limit contributions.
Return to Table of Contents
RETIREMENT PLANNING AND INCOME PROTECTION12
SAVING FOR RETIREMENT
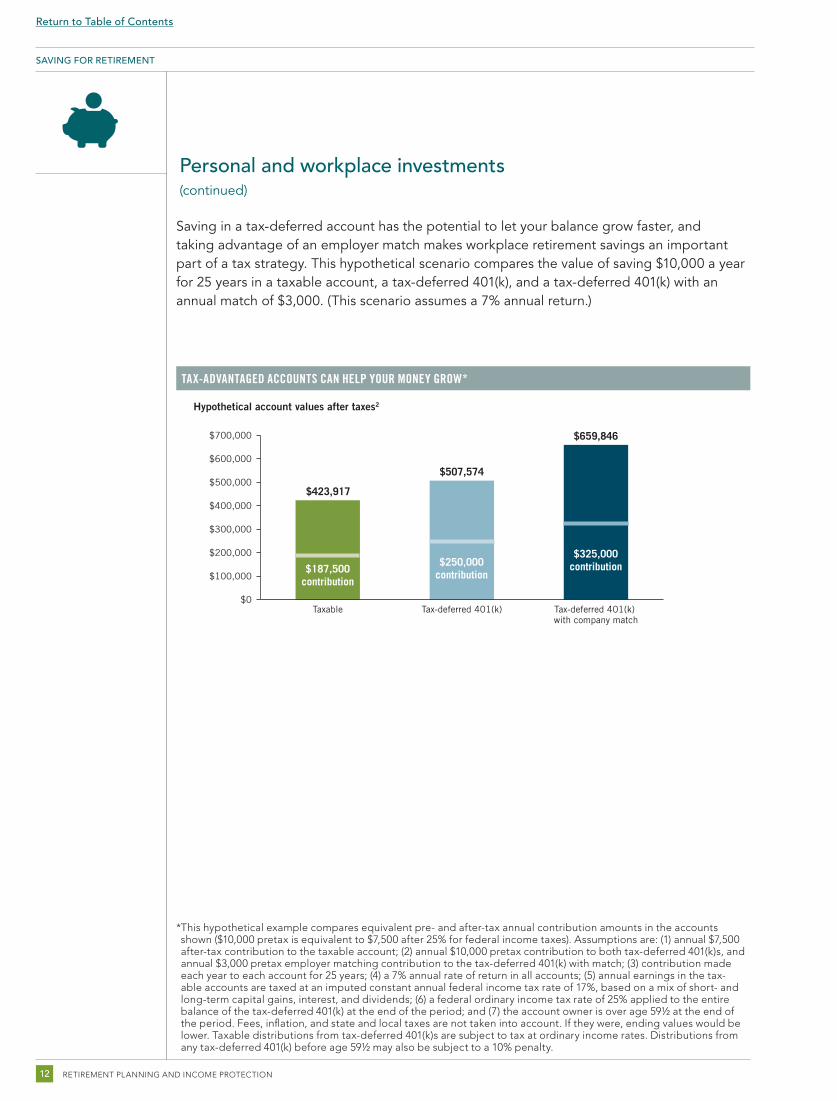
* This hypothetical example compares equivalent pre- and after-tax annual contribution amounts in the accounts shown ($10,000 pretax is equivalent to $7,500 after 25% for federal income taxes). Assumptions are: (1) annual $7,500 after-tax contribution to the taxable account; (2) annual $10,000 pretax contribution to both tax-deferred 401(k)s, and annual $3,000 pretax employer matching contribution to the tax-deferred 401(k) with match; (3) contribution made each year to each account for 25 years; (4) a 7% annual rate of return in all accounts; (5) annual earnings in the tax-able accounts are taxed at an imputed constant annual federal income tax rate of 17%, based on a mix of short- and long-term capital gains, interest, and dividends; (6) a federal ordinary income tax rate of 25% applied to the entire balance of the tax-deferred 401(k) at the end of the period; and (7) the account owner is over age 59½ at the end of the period. Fees, inflation, and state and local taxes are not taken into account. If they were, ending values would be lower. Taxable distributions from tax-deferred 401(k)s are subject to tax at ordinary income rates. Distributions from any tax-deferred 401(k) before age 59½ may also be subject to a 10% penalty.
Saving in a tax-deferred account has the potential to let your balance grow faster, and taking advantage of an employer match makes workplace retirement savings an important part of a tax strategy. This hypothetical scenario compares the value of saving $10,000 a year for 25 years in a taxable account, a tax-deferred 401(k), and a tax-deferred 401(k) with an annual match of $3,000. (This scenario assumes a 7% annual return.)
TAX-ADVANTAGED ACCOUNTS CAN HELP YOUR MONEY GROW*
Hypothetical account values after taxes2
$0
$100,000
$200,000
$300,000
$400,000
$500,000
$600,000
$700,000
Tax-deferred 401(k) with company match
Tax-deferred 401(k)Taxable
$423,917
$187,500contribution
$250,000contribution
$325,000contribution
$507,574
$659,846
Personal and workplace investments (continued)
Return to Table of Contents

SAVING FOR RETIREMENT 13
SAVING FOR RETIREMENT
Income protection and saving for retirementTake full advantage of the retirement savings alternatives available to you.
You need to hedge against rising costs and plan your family’s well-being in the event of your untimely death or disability. You should consider how you can use life insurance planning tools to help protect your family’s income in the event of death or disability. Life, accident, and health insurance can be an important part of your overall financial plan.
5.Don’t
withdraw too much savings
2. Expect to live longer
3. Be prepared for inflation
4. Position
investments for growth
1. Plan for
health carecosts
When you are planning for retire-ment, it’s important to think about protecting what you’ve saved and ensuring your income needs are met now and in the future. These are the five rules of thumb to help manage any risks to your retire-ment income.
FIVE RETIREMENT RULES OF THUMB
Return to Table of Contents

RETIREMENT PLANNING AND INCOME PROTECTION14
Return to Table of Contents
INVESTMENT STRATEGY DISCUSSION GUIDE: SECTION TITLE HERE 00TRANSITIONING TO RETIREMENT 15
Transitioning to retirement
• How long will my retirement last?
• What will my lifestyle look like, and will I have enough income?
• What will happen to my income if the markets go down?
The uncertainty of retiring at a time when there are fewer sources of guaranteed income, low interest rates, and increased market fluctuation has many people worried. This is why it’s more important than ever to have a plan that includes diverse sources of income to cover your essential and discretionary expenses.
As you transition to retirement, your portfolio needs to provide you with lifetime income, protection from market volatility, growth potential, and the flexibility to meet unexpected expenses.
Return to Table of Contents
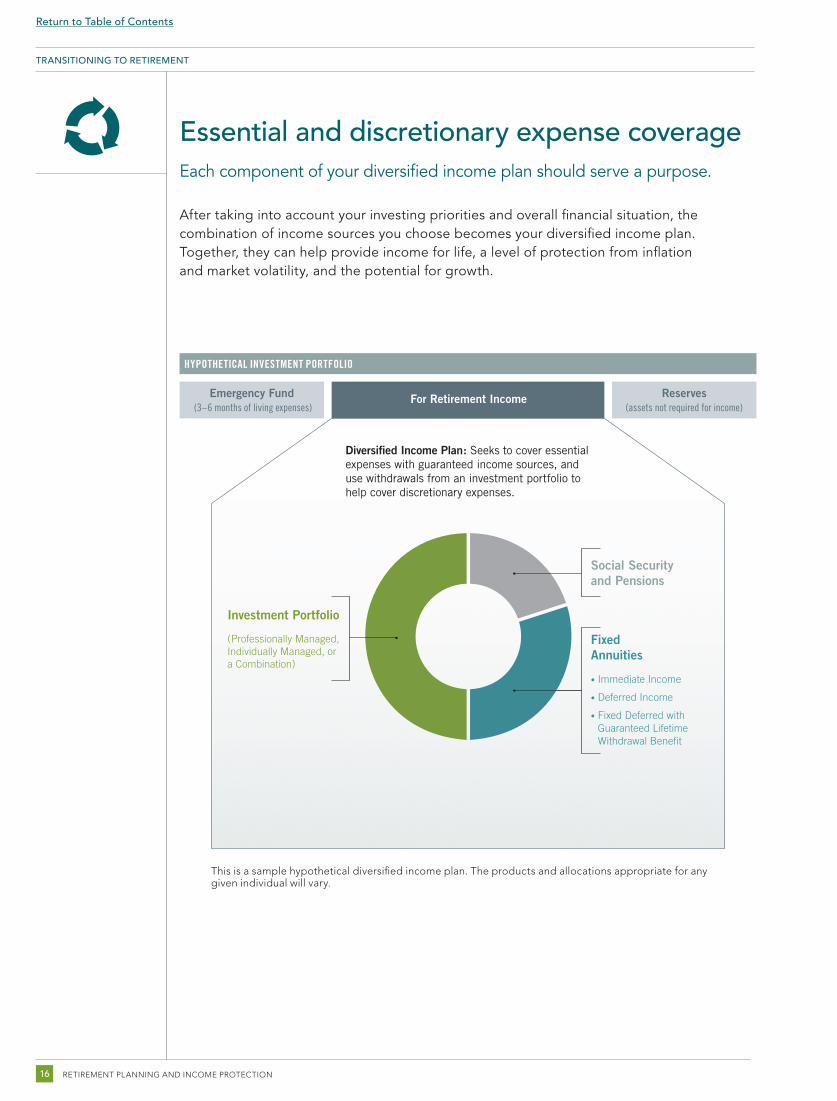
Essential and discretionary expense coverage Each component of your diversified income plan should serve a purpose.
After taking into account your investing priorities and overall financial situation, the combination of income sources you choose becomes your diversified income plan. Together, they can help provide income for life, a level of protection from inflation and market volatility, and the potential for growth.
RETIREMENT PLANNING AND INCOME PROTECTION16
TRANSITIONING TO RETIREMENT
HYPOTHETICAL INVESTMENT PORTFOLIO
Fixed Annuities
• Immediate Income
• Deferred Income
• Fixed Deferred with Guaranteed Lifetime Withdrawal Benefit
Social Security and Pensions
Diversified Income Plan: Seeks to cover essential expenses with guaranteed income sources, and use withdrawals from an investment portfolio to help cover discretionary expenses.
Investment Portfolio
(Professionally Managed, Individually Managed, or a Combination)
Emergency Fund ReservesFor Retirement Income(assets not required for income)(3–6 months of living expenses)
This is a sample hypothetical diversified income plan. The products and allocations appropriate for any given individual will vary.
Return to Table of Contents
TRANSITIONING TO RETIREMENT 17
TRANSITIONING TO RETIREMENT
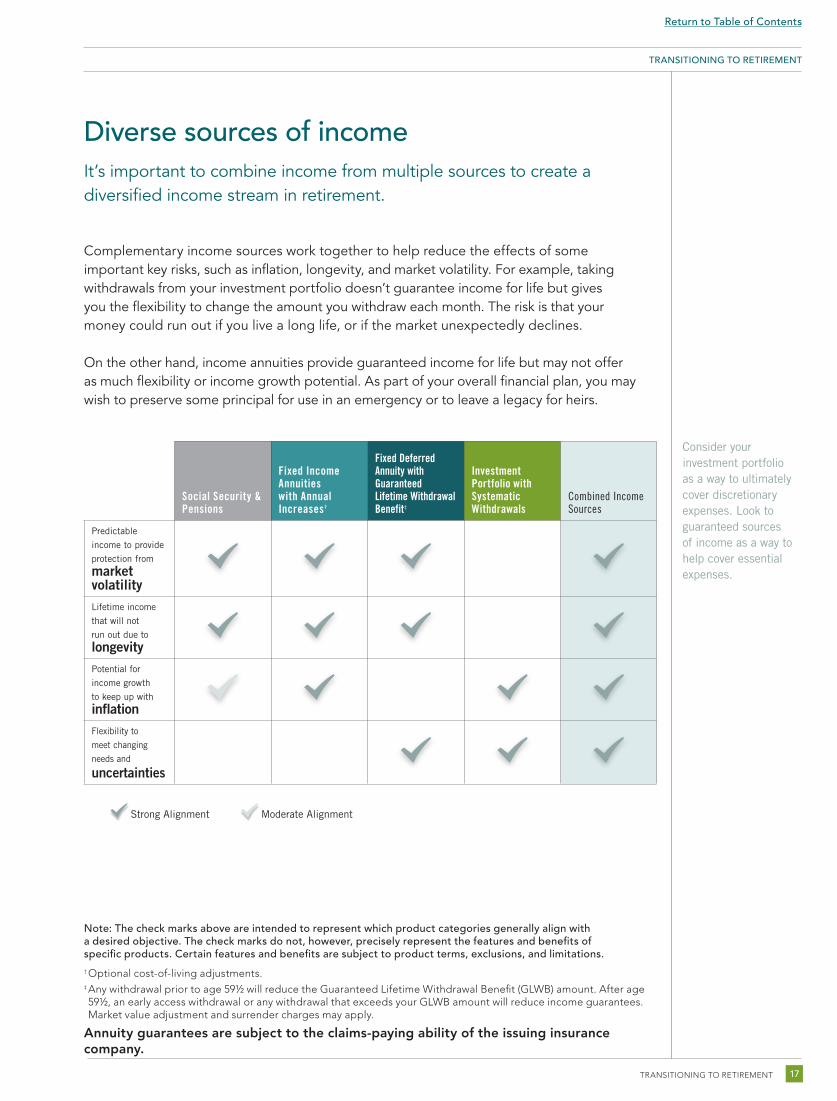
Diverse sources of income It’s important to combine income from multiple sources to create a diversified income stream in retirement.
Complementary income sources work together to help reduce the effects of some important key risks, such as inflation, longevity, and market volatility. For example, taking withdrawals from your investment portfolio doesn’t guarantee income for life but gives you the flexibility to change the amount you withdraw each month. The risk is that your money could run out if you live a long life, or if the market unexpectedly declines.
On the other hand, income annuities provide guaranteed income for life but may not offer as much flexibility or income growth potential. As part of your overall financial plan, you may wish to preserve some principal for use in an emergency or to leave a legacy for heirs.
Consider your investment portfolio as a way to ultimately cover discretionary expenses. Look to guaranteed sources of income as a way to help cover essential expenses.
Note: The check marks above are intended to represent which product categories generally align witha desired objective. The check marks do not, however, precisely represent the features and benefits ofspecific products. Certain features and benefits are subject to product terms, exclusions, and limitations.† Optional cost-of-living adjustments.‡ Any withdrawal prior to age 59½ will reduce the Guaranteed Lifetime Withdrawal Benefit (GLWB) amount. After age 59½, an early access withdrawal or any withdrawal that exceeds your GLWB amount will reduce income guarantees. Market value adjustment and surrender charges may apply.
Annuity guarantees are subject to the claims-paying ability of the issuing insurance company.
Social Security & Pensions
Fixed Income Annuities with Annual Increases†
Fixed Deferred Annuity with Guaranteed Lifetime Withdrawal Benefit‡
Investment Portfolio with Systematic Withdrawals
Combined Income Sources
Predictable
income to provide
protection from
market volatilityLifetime income
that will not
run out due to
longevityPotential for
income growth
to keep up with
inflationFlexibility to
meet changing
needs and
uncertainties
Strong Alignment Moderate Alignment
Return to Table of Contents
RETIREMENT PLANNING AND INCOME PROTECTION18
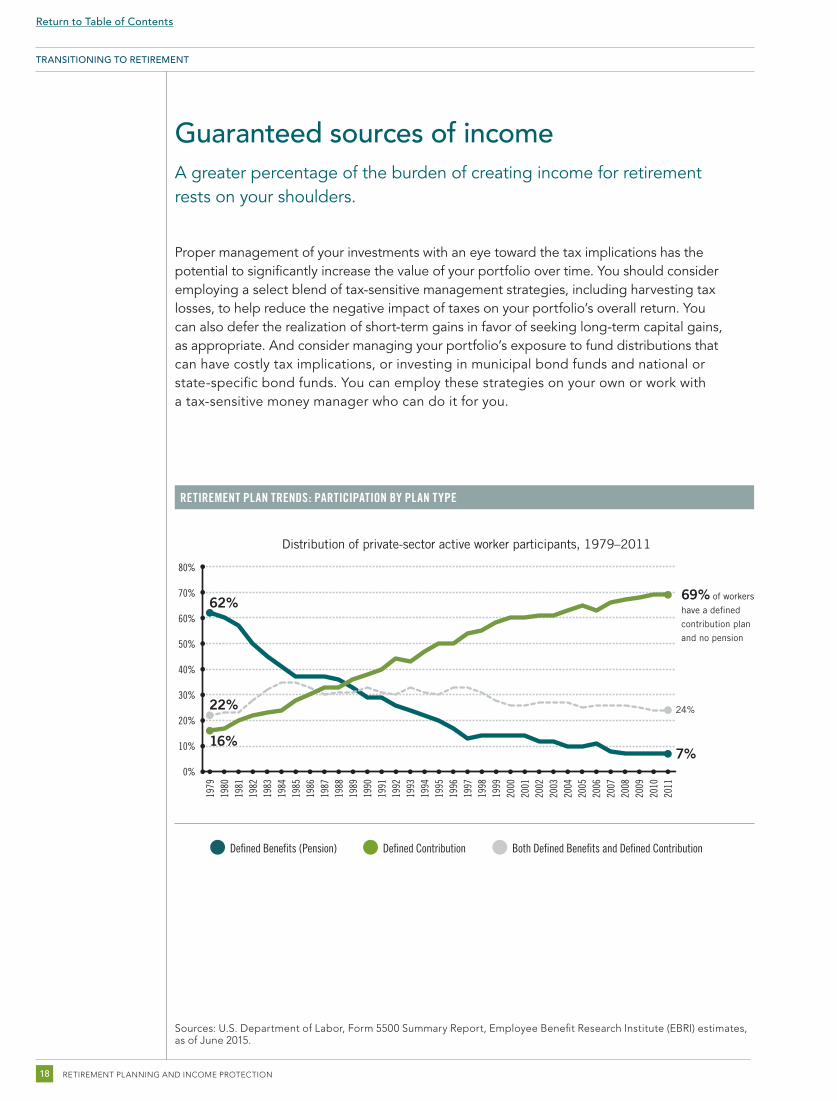
Guaranteed sources of incomeA greater percentage of the burden of creating income for retirement rests on your shoulders.
Proper management of your investments with an eye toward the tax implications has the potential to significantly increase the value of your portfolio over time. You should consider employing a select blend of tax-sensitive management strategies, including harvesting tax losses, to help reduce the negative impact of taxes on your portfolio’s overall return. You can also defer the realization of short-term gains in favor of seeking long-term capital gains, as appropriate. And consider managing your portfolio’s exposure to fund distributions that can have costly tax implications, or investing in municipal bond funds and national or state-specific bond funds. You can employ these strategies on your own or work with a tax-sensitive money manager who can do it for you.
RETIREMENT PLAN TRENDS: PARTICIPATION BY PLAN TYPE
TRANSITIONING TO RETIREMENT
Sources: U.S. Department of Labor, Form 5500 Summary Report, Employee Benefit Research Institute (EBRI) estimates, as of June 2015.
80%
1979
1980
1981
1982
1983
1984
1985
1986
1987
1988
1989
1990
1991
1992
1993
1994
1995
1996
1997
1998
1999
2000
2001
2002
2003
2004
2005
2006
2007
2008
2009
2010
2011
70%
60%
50%
40%
30%
20%
10%
0%
69% of workers
have a defined
contribution plan
and no pension
62%
24%22%
7%16%
Distribution of private-sector active worker participants, 1979–2011
Defined Benefits (Pension) Defined Contribution Both Defined Benefits and Defined Contribution
Return to Table of Contents
LIVING IN RETIREMENT 19
Living in retirement
• What is your retirement income plan?
• How will you meet your essential and discretionary expenses?
• How are your retirement assets invested?
If you make a mistake during the distribution phase of retirement, or if the market experiences a downturn, you can’t start over. Instead, you are relying solely on your investments to create retirement cash flow. Because of this fact, we believe that every retiree should have a retirement income plan that:
• Incorporates a realistic estimate of anticipated expenses
• Ensures you do not outlive your assets
• Addresses inflation and health care costs
• Balances the need for long-term investment growth with the risk of shorter-term market volatility
• Ensures your essential expenses, including health care, are covered by reliable and or guaranteed sources of lifetime income
Return to Table of Contents
LIVING IN RETIREMENT
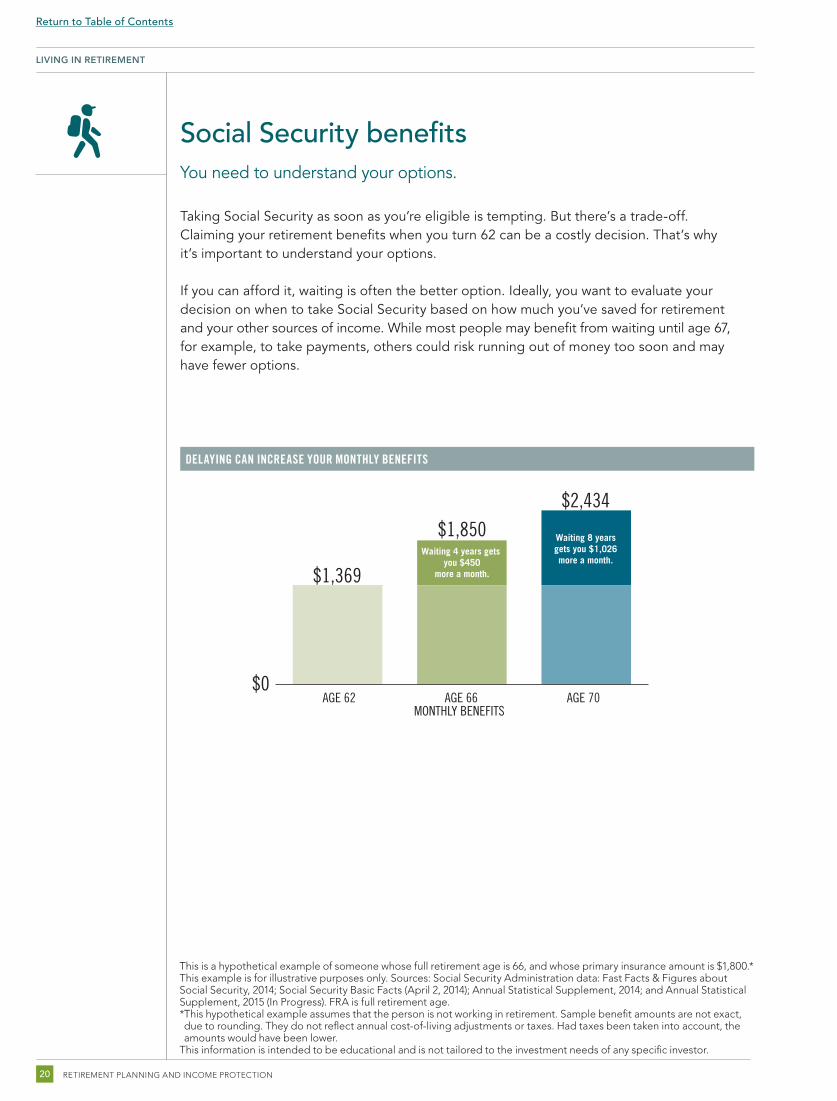
Social Security benefits You need to understand your options.
Taking Social Security as soon as you’re eligible is tempting. But there’s a trade-off. Claiming your retirement benefits when you turn 62 can be a costly decision. That’s why it’s important to understand your options.
If you can afford it, waiting is often the better option. Ideally, you want to evaluate your decision on when to take Social Security based on how much you’ve saved for retirement and your other sources of income. While most people may benefit from waiting until age 67, for example, to take payments, others could risk running out of money too soon and may have fewer options.
DELAYING CAN INCREASE YOUR MONTHLY BENEFITS
$1,369
AGE 62 AGE 66MONTHLY BENEFITS
AGE 70
$1,850$2,434
$0
Waiting 4 years gets you $450
more a month.
Waiting 8 yearsgets you $1,026more a month.
This is a hypothetical example of someone whose full retirement age is 66, and whose primary insurance amount is $1,800.*This example is for illustrative purposes only. Sources: Social Security Administration data: Fast Facts & Figures about Social Security, 2014; Social Security Basic Facts (April 2, 2014); Annual Statistical Supplement, 2014; and Annual Statistical Supplement, 2015 (In Progress). FRA is full retirement age.* This hypothetical example assumes that the person is not working in retirement. Sample benefit amounts are not exact, due to rounding. They do not reflect annual cost-of-living adjustments or taxes. Had taxes been taken into account, the amounts would have been lower.
This information is intended to be educational and is not tailored to the investment needs of any specific investor.
RETIREMENT PLANNING AND INCOME PROTECTION20
Return to Table of Contents
LIVING IN RETIREMENT 21
LIVING IN RETIREMENT
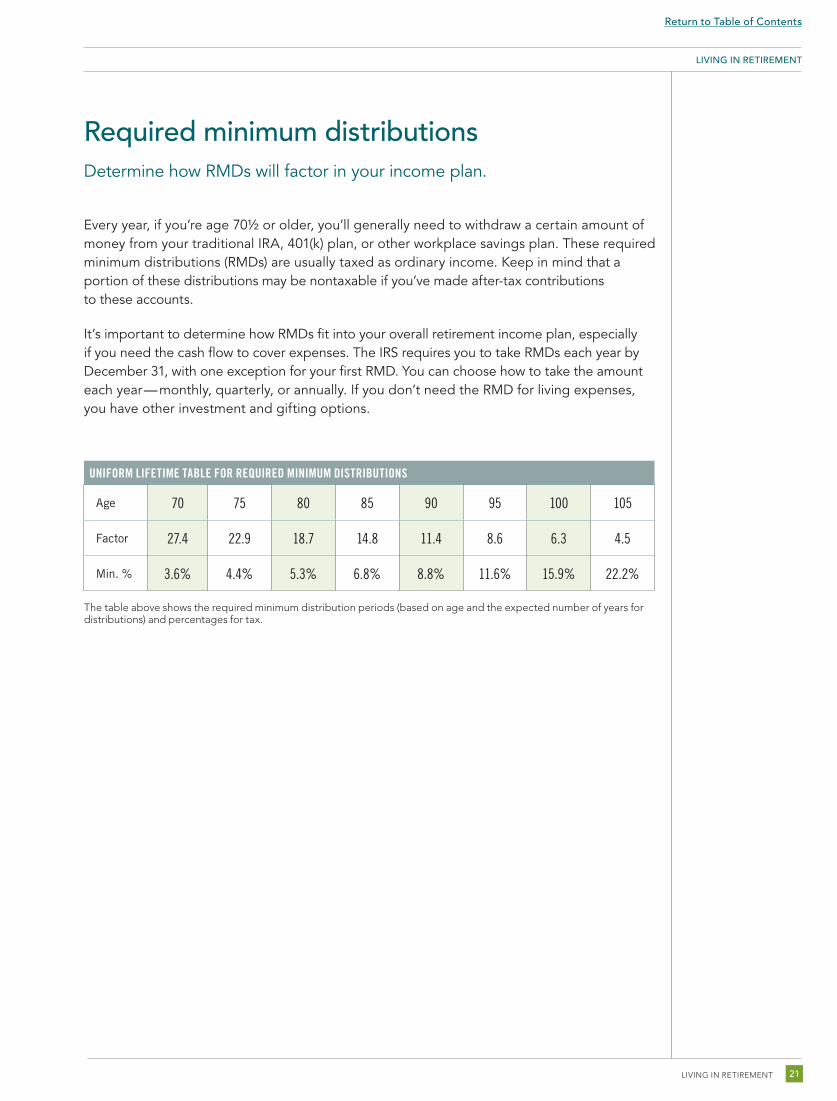
Required minimum distributionsDetermine how RMDs will factor in your income plan.
Every year, if you’re age 70½ or older, you’ll generally need to withdraw a certain amount of money from your traditional IRA, 401(k) plan, or other workplace savings plan. These required minimum distributions (RMDs) are usually taxed as ordinary income. Keep in mind that a portion of these distributions may be nontaxable if you’ve made after-tax contributions to these accounts.
It’s important to determine how RMDs fit into your overall retirement income plan, especially if you need the cash flow to cover expenses. The IRS requires you to take RMDs each year by December 31, with one exception for your first RMD. You can choose how to take the amount each year — monthly, quarterly, or annually. If you don’t need the RMD for living expenses, you have other investment and gifting options.
UNIFORM LIFETIME TABLE FOR REQUIRED MINIMUM DISTRIBUTIONS
Age 70 75 80 85 90 95 100 105
Factor 27.4 22.9 18.7 14.8 11.4 8.6 6.3 4.5
Min. % 3.6% 4.4% 5.3% 6.8% 8.8% 11.6% 15.9% 22.2%
The table above shows the required minimum distribution periods (based on age and the expected number of years for distributions) and percentages for tax.
Return to Table of Contents

RETIREMENT PLANNING AND INCOME PROTECTION22
LIVING IN RETIREMENT
Income protection and living in retirementPlan to protect your family’s wealth for generations to come.
Retirement income planning with a proactive investment strategy can help you better preserve and help protect the wealth you have built. There are several income planning tools you can use to help attain your income goals for retirement.
An income annuity can reduce the uncertainty of outliving your retirement assets due to living longer or spending too much in retirement.
Insurance and annuities can help you and your family to meet a variety of goals, from replacing income to becoming an integral part of a well-designed wealth transfer plan.
Be prepared for a longer life.Medical advances mean many of us are expected to live longer. That’s why planning ahead for long-term care is important. Long-term care can be expensive, but the right insurance may help offer you and your family some sense of assurance that medical events won’t derail your financial plan.
Return to Table of Contents

LIVING IN RETIREMENT 23
LIVING IN RETIREMENT
<$5,000 $5,000–$5,999 $6,000–$6,999 $7,000–$7,999 $8,000–$8,999 >$9,000
AR, KS, LA, MO, OK, TX AL, GA, IA, IL, KY, MS, MT, NE, SC, SD, TN, UT
AZ, ID, IN, NC, NM, OH, VA, WY
CO, FL, MI, MN, NV, OR, VT, WA, WI, WV
AK, CA, CT, DC, DE, HI, MA, MD, ME, ND, NH, NJ, NY, PA, RI
WHAT COULD LONG-TERM CARE COST?
Monthly nursing home rates for private rooms
The potential need for long-term medical care is higher than most people realize. Medicare does not cover most long-term care needs and will typically help only once you have exhausted your savings. Long-term care insurance can help cover the cost of these services and may prevent these expenses from depleting your retirement assets. There are significant variations among long-term care policies, though, so you should investigate them thoroughly before making a choice.
Data provided from the Genworth 2016 Cost of Care Survey, conducted by CareScout®, April 2016. CareScout has conducted the Genworth Cost of Care Survey annually since 2004. Located in Waltham, Massachusetts, CareScout has specialized in helping families find long-term care providers nationwide since 1997. This year, CareScout — a Genworth company — contacted more than 43,000 providers* to complete over 15,000 surveys of nursing homes, assisted living facilities, adult day health facilities, and home care providers. Potential respondents were selected randomly from the CareScout nationwide database of providers in each category of long-term care services. Survey respondents representing all 50 states, the District of Columbia, and Puerto Rico were contacted by phone during January and February of 2016. Survey respondents were informed that survey data provided would be included in the Genworth 2016 Cost of Care Survey results. Survey questions varied based on the type of care provider. Fidelity is not affiliated with CareScout or with Genworth. Fidelity does not provide long-term care insurance. The Genworth Cost of Care Survey publishes costs in 440 regions based on the 381 U.S. Metropolitan Statistical Areas (MSAs). MSA definitions are established by the U.S. Office of Management and Budget and include approximately 85 percent of the U.S. population. The survey also includes some counties outside of the MSA regions. To create accurate historical trends for this expanded scope, CareScout recast the base data from the 2011 survey into the current region structure. As a result, CareScout is able to report a five-year compound annual growth rate for each region.
Return to Table of Contents
RETIREMENT PLANNING AND INCOME PROTECTION24
LIVING IN RETIREMENT
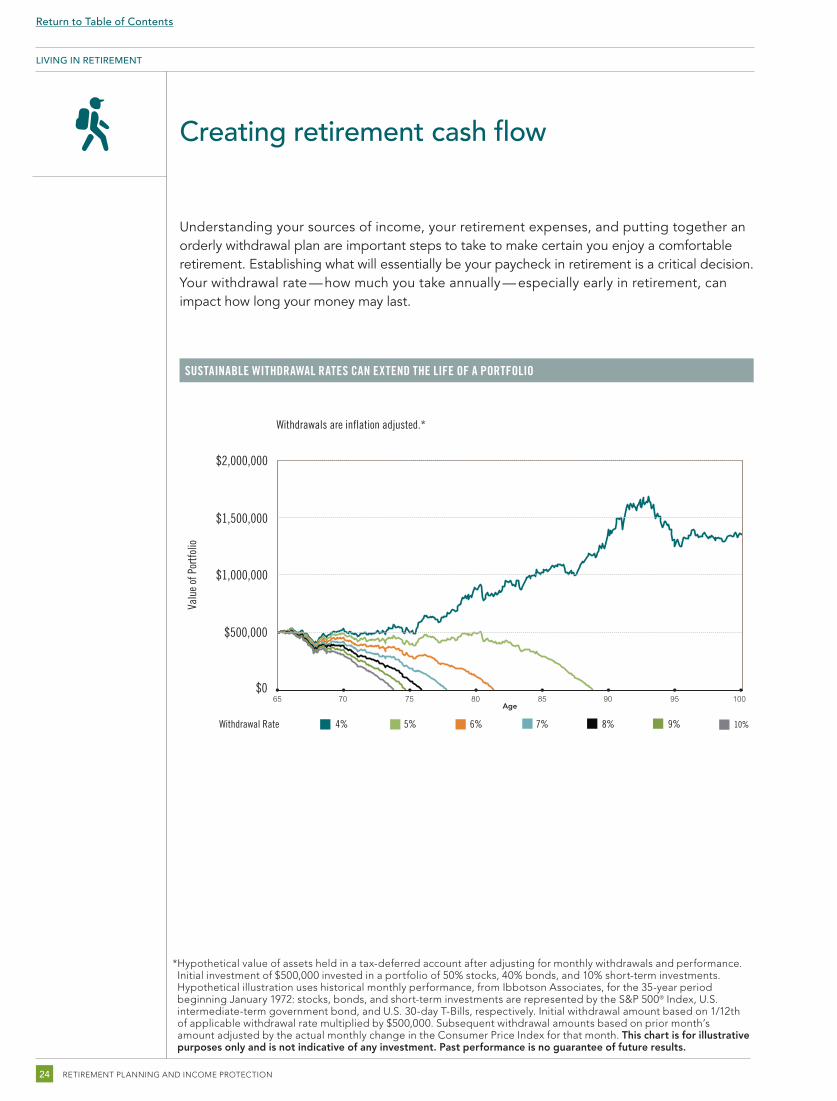
Creating retirement cash flow
Understanding your sources of income, your retirement expenses, and putting together an orderly withdrawal plan are important steps to take to make certain you enjoy a comfortable retirement. Establishing what will essentially be your paycheck in retirement is a critical decision. Your withdrawal rate — how much you take annually — especially early in retirement, can impact how long your money may last.
SUSTAINABLE WITHDRAWAL RATES CAN EXTEND THE LIFE OF A PORTFOLIO
* Hypothetical value of assets held in a tax-deferred account after adjusting for monthly withdrawals and performance. Initial investment of $500,000 invested in a portfolio of 50% stocks, 40% bonds, and 10% short-term investments. Hypothetical illustration uses historical monthly performance, from Ibbotson Associates, for the 35-year period beginning January 1972: stocks, bonds, and short-term investments are represented by the S&P 500® Index, U.S. intermediate-term government bond, and U.S. 30-day T-Bills, respectively. Initial withdrawal amount based on 1/12th of applicable withdrawal rate multiplied by $500,000. Subsequent withdrawal amounts based on prior month’s amount adjusted by the actual monthly change in the Consumer Price Index for that month. This chart is for illustrative purposes only and is not indicative of any investment. Past performance is no guarantee of future results.
65 70 75 80 85 90 95 100
Age
$0
Withdrawals are inflation adjusted.*
$1,500,000
$2,000,000
$1,000,000
$500,000
4%Withdrawal Rate 5% 6% 7% 8% 9% 10%
Valu
e of
Por
tfolio
Return to Table of Contents

LIVING IN RETIREMENT 25
Return to Table of Contents
Put your strategies to work Fidelity can help guide you along the path to — and through — retirement. No matter where you are in life, we can provide guidance, tools, and services to help you prepare for retirement.
Working together with you, we’ll take the following three steps to help you and your family reach your retirement goals:
Your next stepsWe have developed this discussion guide as part of Fidelity Viewpoints®, an exclusive program that enables you to take advantage of our latest thinking on the financial markets, investing ideas, and other tips for personal finance. You have access to Fidelity’s resources and products and services — including our informational and educational videos, seminars, and webinars — to help evaluate and refine your plan for retirement.
RETIREMENT PLANNING AND INCOME PROTECTION26
2
1 Review where you stand:
• Visit the Planning & Guidance Center to create, review, monitor, and update your retirement savings or retirement income plan.3, 4
Devise a plan:
• Plan for lifetime income
• Have a strategy for meeting essential and discretionary income needs
3 Put your plan into motion:
• Professionally managed accounts with Fidelity Portfolio Advisory Service® and Fidelity® Personalized Portfolios5
• Fidelity Personal Retirement Annuity® 6, 7
• Immediate and deferred fixed income annuities through The Fidelity Insurance Network8, 9
• Advanced planning and investment services through Fidelity Private Wealth Management® 10 and Fidelity Wealth Advisor Solutions® programs11
Return to Table of Contents

NEXT STEPS 27
Before investing, consider the investment objectives, risks, charges, and expenses of the fund or annuity and its investment options. Contact Fidelity for a prospectus or, if available, a summary prospectus containing this information. Read it carefully.Fidelity does not provide legal or tax advice. The information herein is general in nature and should not be considered legal or tax advice. Consult an attorney or tax professional regarding your specific situation.Keep in mind that investing involves risk. The value of your investment will fluctuate over time and you may gain or lose money.
Annuity guarantees are subject to the claims-paying ability of the issuing insurance company.Fidelity, Fidelity Investments, and the Fidelity Investments and pyramid design logo are registered service marks of FMR LLC.Clearing, custody, or other brokerage services may be provided by National Financial Services LLC or Fidelity Brokerage Services LLC, MembersNYSE, SIPC. Both are Fidelity Investments companies.
1 Estimate based on a hypothetical couple retiring in 2016, 65 years old, with average life expectancies of 85 for a male and 87 for a female. Estimates are calculated for “average” retirees, but may be more or less depending on actual health status, area of residence, and longevity. Estimate is net of taxes. The Fidelity Retiree Health Care Costs Estimate assumes individuals do not have employer-provided retiree health care coverage, but do qualify for the federal government’s insurance program, Original Medicare. The calculation takes into account cost-sharing provisions (such as deductibles and coinsurance) associated with Medicare Part A and Part B (inpatient and outpatient medical insurance). It also considers Medicare Part D (prescription drug coverage) premiums and out-of-pocket costs, as well as certain services excluded by Original Medicare. The estimate does not include other health-related expenses, such as over-the-counter medications, most dental services, and long-term care.
2 The taxable account does not reflect tax-savings strategies such as tax-loss carryforwards, earnings consisting mostly of unrealized gains each year, or other strategies that might be used to reduce taxes in a taxable account, which could make the ending value of the taxable account more favorable.
3 This information is intended to be educational and is not tailored to the investment needs of any specific investor.4 IMPORTANT: The projections or other information generated by Fidelity’s Planning & Guidance Center Retirement Analysis, regarding the likelihood of various investment outcomes, is hypothetical in nature, does not reflect actual investment results, and is not a guarantee of future results. Results may vary with each use and over time.
5 Fidelity Portfolio Advisory Service® is a service of Strategic Advisers, Inc., a registered investment adviser and a Fidelity Investments company. Fidelity Private Portfolio Advisory Service® may be offered through the following Fidelity Investments companies: Strategic Advisers, Inc.; Fidelity Personal Trust Company, FSB (“FPT”), a federal savings bank; or Fidelity Management Trust Company (“FMTC”). Nondeposit investment products and trust services offered through FPT and FMTC and their affiliates are not insured or guaranteed by the Federal Deposit Insurance Corporation or any other government agency, are not obligations of any bank, and are subject to risk, including possible loss of principal. These services provide discretionary money management for a fee.
6 This is a deferred variable annuity: investment returns and contract value are not guaranteed and will fluctuate depending on market performance.7 Fidelity Personal Retirement Annuity (Policy Form No. DVA-2005, et al.) is issued by Fidelity Investments Life Insurance Company, 100 Salem Street, Smithfield, RI 02917, and, for New York residents, Personal Retirement Annuity (Policy Form No. EDVA-2005, et al.) is issued by Empire Fidelity Investments Life Insurance Company®, New York, N.Y. Fidelity Brokerage Services, Member NYSE, SIPC, and Fidelity Insurance Agency, Inc., are the distributors. A contract’s financial guarantees are subject to the claims-paying ability of the issuing insurance company.
8Deferred Income Annuity contracts are irrevocable, have no cash surrender value, and no withdrawals are permitted prior to the income start date. 9 Fixed annuities available at Fidelity are issued by third-party insurance companies, which are not affiliated with any Fidelity Investments company. These products are distributed by Fidelity Insurance Agency, Inc., and, for certain products, Fidelity Brokerage Services, Member NYSE, SIPC. A contract's financial guarantees are solely the responsibility of and are subject to the claims-paying ability of the issuing insurance company.
10 Fidelity Private Wealth Management® is a service of Strategic Advisers, Inc., a registered investment adviser and a Fidelity Investments company. This service provides nondiscretionary investment advisory services for a fee.
11 The Fidelity Wealth Advisor Solutions® program (“the Program”) is provided without charge as a convenience to you by Strategic Advisers, Inc. (SAI), a Fidelity Investments company. In no event shall SAI’s providing the names of one or more registered investment advisors (RIAs) constitute an endorsement, recom mendation, or opinion as to the quality or appropriateness of the RIA or the related advisory services. SAI acts as solicitor to the RIAs in the Program, and receives solicitation fees from the RIAs as a result of their participation. RIAs are not affiliated with nor are they agents of SAI or any other Fidelity Investments company, but they are Fidelity Investments customers and their clients compensate Fidelity Investments for custody, clearing, or other brokerage services. You must conduct the evaluation and due diligence you deem necessary to determine whether an RIA and any related advisory services are suitable for your needs.
Fidelity Brokerage Services LLC, Member NYSE and SIPC, 900 Salem Street, Smithfield, RI 02917
Return to Table of Contents

900 SALEM STREET SMITHFIELD, RHODE ISL AND 02917
© 2017 FMR LLC. All rights reserved. 698713.3.0 1.961893.102


