RWR OPERATIONS MANUAL The computer program provided by Toolsformoney.com is a copyrighted proprietary trade secret. This copyright notice should not be construed as evidence of publication Copyright 1997 - 2009 Toolsformoney.com, All Rights Reserved REAL WORLD RETIREMENT (RWR) THE WORLD’S MOST POWERFUL, FLEXIBLE, AND FUNCTIONAL RETIREMENT PLANNING SOFTWARE PROGRAM REAL WORLD PERSONAL FINANCE SOFTWARE 2130 9 th St. W #166 Whitefish, MT 59912-4416 (800) 658-1824 [email protected]http://www.toolsformoney.com/
Transcript
RWR OPERATIONS MANUAL
The computer program provided by Toolsformoney.com is a copyrighted proprietary trade secret. This copyright notice should not be construed as evidence of publication
Copyright 1997 - 2009 Toolsformoney.com, All Rights Reserved
REAL WORLD RETIREMENT (RWR)
THE WORLD’S MOST POWERFUL, FLEXIBLE, AND FUNCTIONAL RETIREMENT PLANNING SOFTWARE PROGRAM
REAL WORLD PERSONAL FINANCE SOFTWARE
2130 9th St. W #166 Whitefish, MT 59912-4416 (800) 658-1824
Important: Please read this before using the retirement software program. Installation/copying files to hard disk/unzipping or use of the program in any manner constitutes your acceptance of the following terms and conditions. Once you have used the installation disk, opened the e-mail attachment, or unzipped the file, you have agreed to the following terms and conditions.
Disclaimer: Estimates are generated by using many assumptions made by the program, clients, and the user. No person nor software program can predict the future with any degree of certainty. No warranty as to correctness is given and no liability is accepted for any error, omission, nor any loss which may arise from relying upon data generated from reports produced by this program. In no event shall Toolsformoney.com be liable to you or any other party, for any special, consequential or incidental damages suffered by you or such other party as a result of any problems that may arise because of the installation or (improper) use of this software or presentation of reports produced by this software. All reports generated by this software are only rough estimates of many possible future scenarios.
Permitted Uses: This is a copyrighted, single-user product. You may operate the program for your own use to generate reports for yourself, family, and/or for your individual clients and prospects.
Non-Permitted Uses: Without express written permission from Toolsformoney.com, you may not use this software:
In a computer service business including rental, Internet, networking or time-sharing software operation. For multiple-user or multiple-computer system applications in the absence of individual licenses. In other words, the program is only licensed to run on one computer at a time. You will need to purchase additional copies at to run the program on more than one computer at a time. To provide reports for other financial planners, brokers, advisors or investment managers as a consultant, for fee, free, or commissions. To perform, or attempt to perform any: Translation, reverse programming or reverse engineering of the product, or any reconstruction to essentially duplicate the essence or basic operation of the program. Sell, copy, give, rent, publish, disclose or otherwise make the program available to others.
Ownership and Security: The program is a proprietary product and shall at all times remain the sole exclusive property of Toolsformoney.com. This license agreement gives you the license to operate the program.
Warranty and Limitation of Liability: Toolsformoney.com’s sole obligation under any of the warranties set forth in this Agreement shall be to repair or replace any defective operations of the program. In no event will Toolsformoney.com be liable to such customer or to Licensee for any representations or warranties made by the Licensee other than those stated within. Other than as expressly stated herein, Toolsformoney.com makes no other warranties, including, but not limited to, any implied warranties of merchantability or fitness for a particular use. The foregoing shall be the extent of Toolsformoney.com’s liability under this Agreement, regardless of the form in which any legal or equitable action may be brought against Toolsformoney.com and the foregoing shall constitute Licensee’s sole remedies. The foregoing constitutes the entire liability of Toolsformoney.com and sole remedy of licensee with respect to any claim or action based in whole or in part upon patent or copyright infringement.
Copyright 1997 - 2009 Toolsformoney.com, All Rights Reserved Page 2 of 60
REAL WORLD RETIREMENT
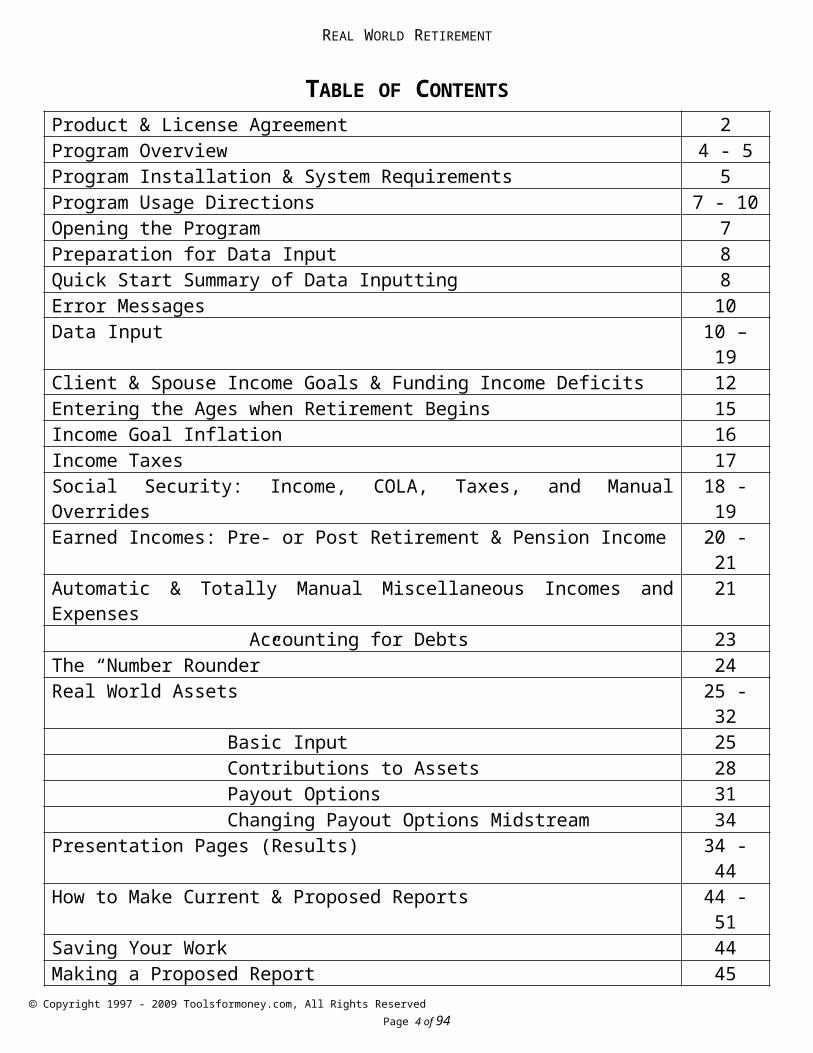
TABLE OF CONTENTS
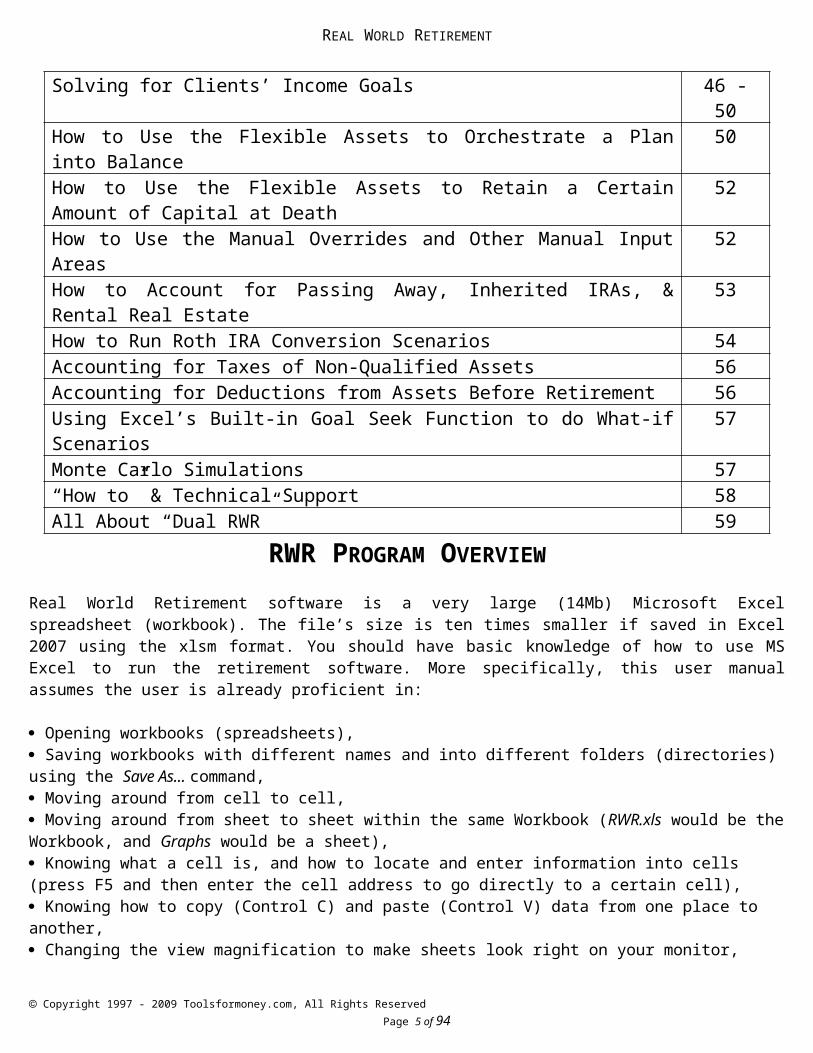
Product & License Agreement 2Program Overview 4 - 5Program Installation & System Requirements 5Program Usage Directions 7 - 10Opening the Program 7Preparation for Data Input 8Quick Start Summary of Data Inputting 8Error Messages 10Data Input 10 – 19Client & Spouse Income Goals & Funding Income Deficits 12Entering the Ages when Retirement Begins 15Income Goal Inflation 16Income Taxes 17Social Security: Income, COLA, Taxes, and Manual Overrides 18 - 19Earned Incomes: Pre- or Post Retirement & Pension Income 20 - 21Automatic & Totally Manual Miscellaneous Incomes and Expenses 21 Accounting for Debts 23The “Number Rounder” 24Real World Assets 25 - 32 Basic Input 25 Contributions to Assets 28 Payout Options 31 Changing Payout Options Midstream 34Presentation Pages (Results) 34 - 44How to Make Current & Proposed Reports 44 - 51Saving Your Work 44Making a Proposed Report 45Solving for Clients’ Income Goals 46 - 50How to Use the Flexible Assets to Orchestrate a Plan into Balance 50How to Use the Flexible Assets to Retain a Certain Amount of Capital at Death 52How to Use the Manual Overrides and Other Manual Input Areas 52How to Account for Passing Away, Inherited IRAs, & Rental Real Estate 53How to Run Roth IRA Conversion Scenarios 54Accounting for Taxes of Non-Qualified Assets 56Accounting for Deductions from Assets Before Retirement 56Using Excel’s Built-in Goal Seek Function to do What-if Scenarios 57Monte Carlo Simulations 57“How to” & Technical Support 58All About “Dual RWR” 59
RWR PROGRAM OVERVIEW
Copyright 1997 - 2009 Toolsformoney.com, All Rights Reserved Page 3 of 60
REAL WORLD RETIREMENT
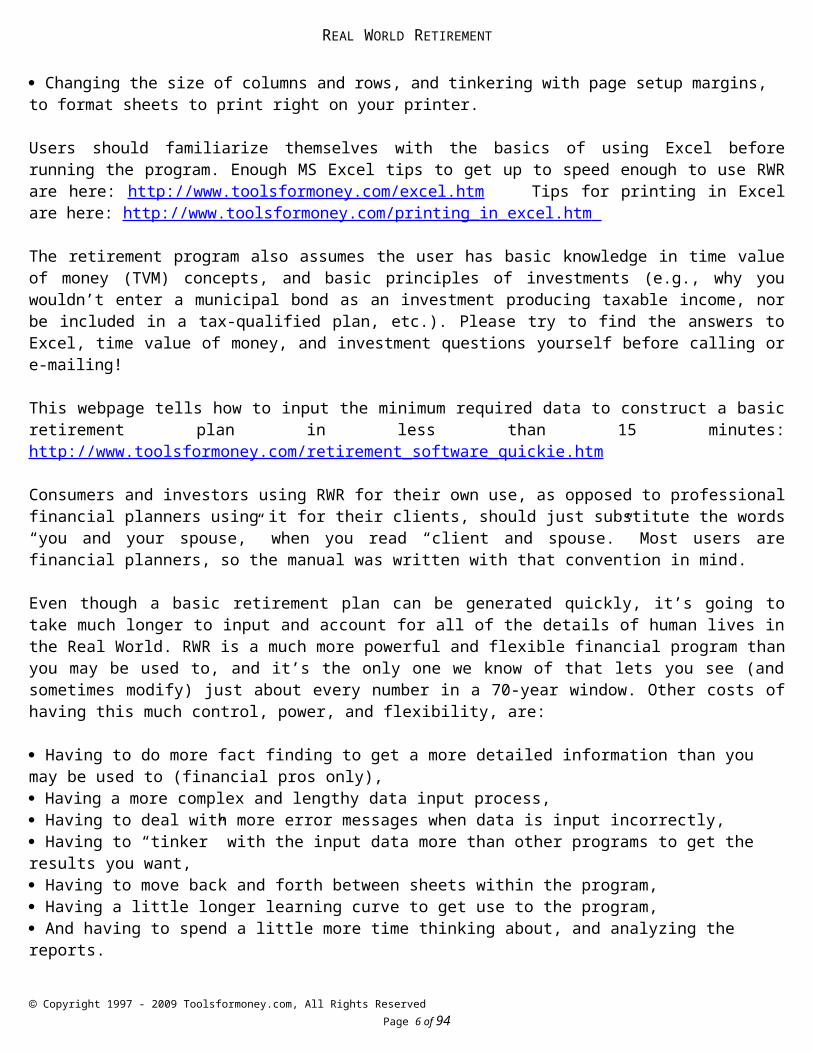
Real World Retirement software is a very large (14Mb) Microsoft Excel spreadsheet (workbook). The file’s size is ten times smaller if saved in Excel 2007 using the xlsm format. You should have basic knowledge of how to use MS Excel to run the retirement software. More specifically, this user manual assumes the user is already proficient in:
Opening workbooks (spreadsheets), Saving workbooks with different names and into different folders (directories) using the Save As... command, Moving around from cell to cell, Moving around from sheet to sheet within the same Workbook (RWR.xls would be the Workbook, and Graphs would be a sheet), Knowing what a cell is, and how to locate and enter information into cells (press F5 and then enter the cell address to go directly to a certain cell), Knowing how to copy (Control C) and paste (Control V) data from one place to another, Changing the view magnification to make sheets look right on your monitor, Changing the size of columns and rows, and tinkering with page setup margins, to format sheets to print right on your printer. Users should familiarize themselves with the basics of using Excel before running the program. Enough MS Excel tips to get up to speed enough to use RWR are here: http://www.toolsformoney.com/excel.htm Tips for printing in Excel are here: http://www.toolsformoney.com/printing_in_excel.htm
The retirement program also assumes the user has basic knowledge in time value of money (TVM) concepts, and basic principles of investments (e.g., why you wouldn’t enter a municipal bond as an investment producing taxable income, nor be included in a tax-qualified plan, etc.). Please try to find the answers to Excel, time value of money, and investment questions yourself before calling or e-mailing!
This webpage tells how to input the minimum required data to construct a basic retirement plan in less than 15 minutes: http://www.toolsformoney.com/retirement_software_quickie.htm
Consumers and investors using RWR for their own use, as opposed to professional financial planners using it for their clients, should just substitute the words “you and your spouse,” when you read “client and spouse.” Most users are financial planners, so the manual was written with that convention in mind.
Even though a basic retirement plan can be generated quickly, it’s going to take much longer to input and account for all of the details of human lives in the Real World. RWR is a much more powerful and flexible financial program than you may be used to, and it’s the only one we know of that lets you see (and sometimes modify) just about every number in a 70-year window. Other costs of having this much control, power, and flexibility, are:
Having to do more fact finding to get a more detailed information than you may be used to (financial pros only), Having a more complex and lengthy data input process, Having to deal with more error messages when data is input incorrectly, Having to “tinker” with the input data more than other programs to get the results you want, Having to move back and forth between sheets within the program, Having a little longer learning curve to get use to the program, And having to spend a little more time thinking about, and analyzing the reports.
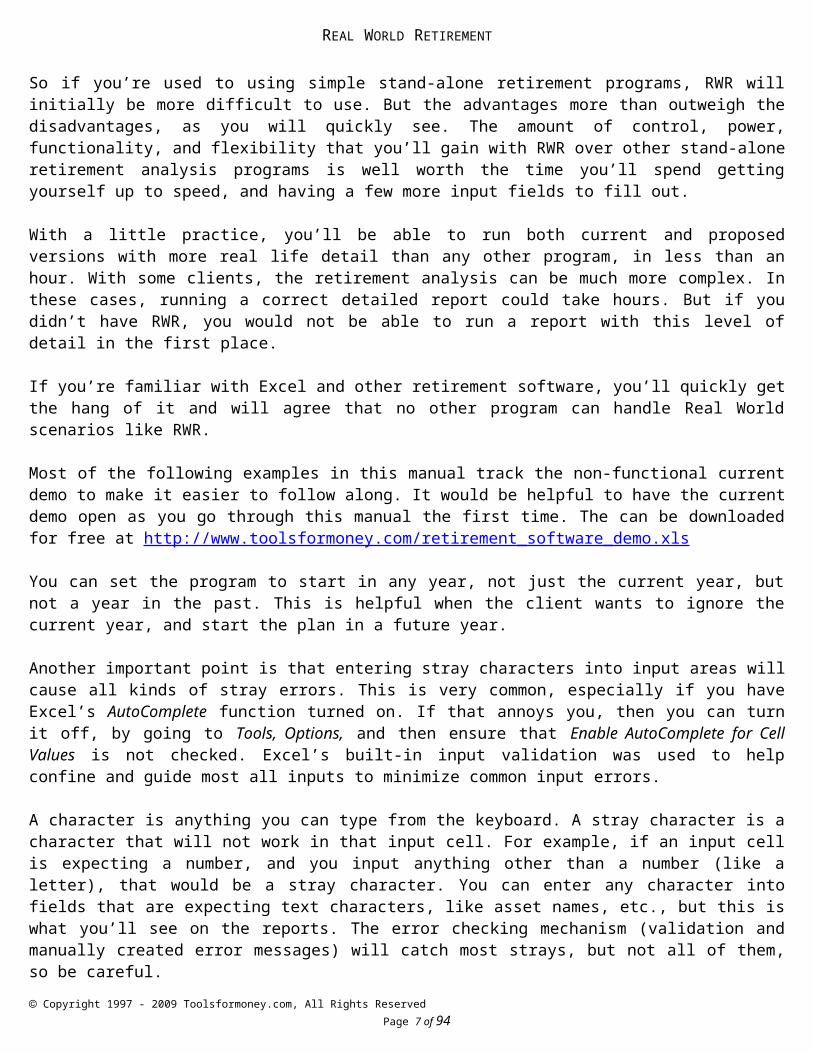
So if you’re used to using simple stand-alone retirement programs, RWR will initially be more difficult to use. But the advantages more than outweigh the disadvantages, as you will quickly see. The amount of control, power, functionality, and flexibility that you’ll gain with RWR over other stand-alone retirement analysis programs is well worth the time you’ll spend getting yourself up to speed, and having a few more input fields to fill out.
Copyright 1997 - 2009 Toolsformoney.com, All Rights Reserved Page 4 of 60
With a little practice, you’ll be able to run both current and proposed versions with more real life detail than any other program, in less than an hour. With some clients, the retirement analysis can be much more complex. In these cases, running a correct detailed report could take hours. But if you didn’t have RWR, you would not be able to run a report with this level of detail in the first place.
If you’re familiar with Excel and other retirement software, you’ll quickly get the hang of it and will agree that no other program can handle Real World scenarios like RWR.
Most of the following examples in this manual track the non-functional current demo to make it easier to follow along. It would be helpful to have the current demo open as you go through this manual the first time. The can be downloaded for free at http://www.toolsformoney.com/retirement_software_demo.xls
You can set the program to start in any year, not just the current year, but not a year in the past. This is helpful when the client wants to ignore the current year, and start the plan in a future year.
Another important point is that entering stray characters into input areas will cause all kinds of stray errors. This is very common, especially if you have Excel’s AutoComplete function turned on. If that annoys you, then you can turn it off, by going to Tools, Options, and then ensure that Enable AutoComplete for Cell Values is not checked. Excel’s built-in input validation was used to help confine and guide most all inputs to minimize common input errors.
A character is anything you can type from the keyboard. A stray character is a character that will not work in that input cell. For example, if an input cell is expecting a number, and you input anything other than a number (like a letter), that would be a stray character. You can enter any character into fields that are expecting text characters, like asset names, etc., but this is what you’ll see on the reports. The error checking mechanism (validation and manually created error messages) will catch most strays, but not all of them, so be careful.
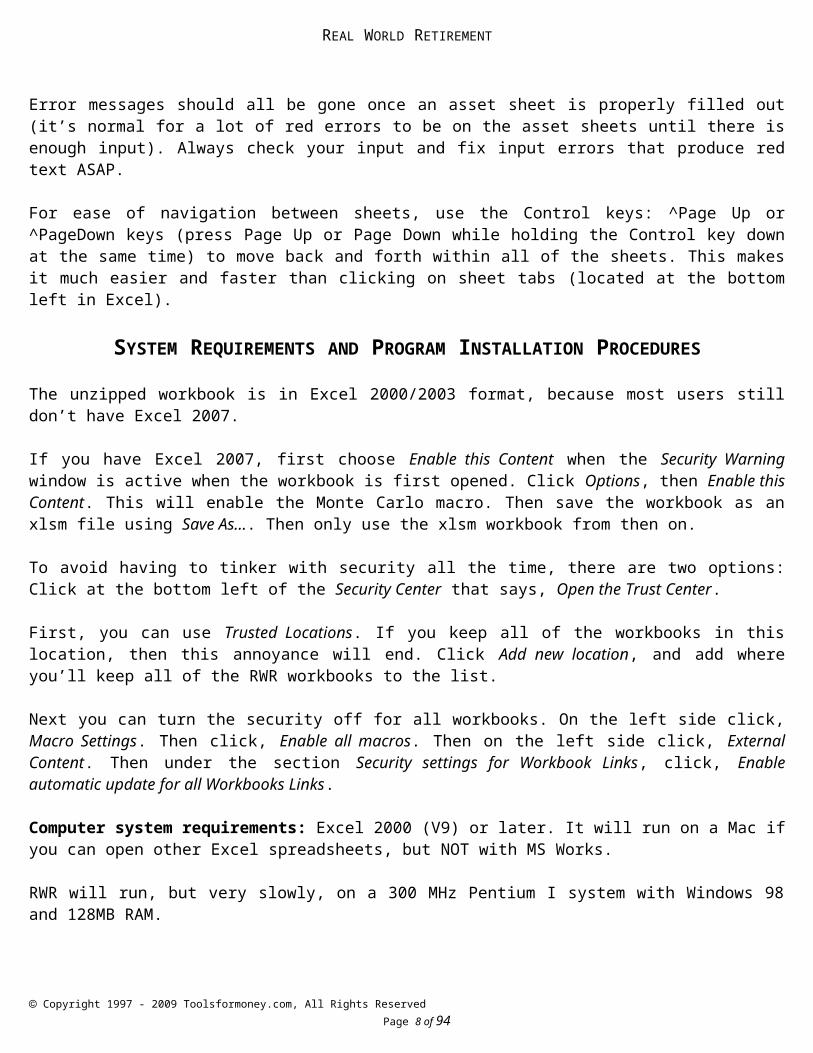
Error messages should all be gone once an asset sheet is properly filled out (it’s normal for a lot of red errors to be on the asset sheets until there is enough input). Always check your input and fix input errors that produce red text ASAP.
For ease of navigation between sheets, use the Control keys: ^Page Up or ^PageDown keys (press Page Up or Page Down while holding the Control key down at the same time) to move back and forth within all of the sheets. This makes it much easier and faster than clicking on sheet tabs (located at the bottom left in Excel).
SYSTEM REQUIREMENTS AND PROGRAM INSTALLATION PROCEDURES
The unzipped workbook is in Excel 2000/2003 format, because most users still don’t have Excel 2007.
If you have Excel 2007, first choose Enable this Content when the Security Warning window is active when the workbook is first opened. Click Options, then Enable this Content. This will enable the Monte Carlo macro. Then save the workbook as an xlsm file using Save As…. Then only use the xlsm workbook from then on.
To avoid having to tinker with security all the time, there are two options: Click at the bottom left of the Security Center that says, Open the Trust Center.
First, you can use Trusted Locations. If you keep all of the workbooks in this location, then this annoyance will end. Click Add new location, and add where you’ll keep all of the RWR workbooks to the list.
Copyright 1997 - 2009 Toolsformoney.com, All Rights Reserved Page 5 of 60
Next you can turn the security off for all workbooks. On the left side click, Macro Settings. Then click, Enable all macros. Then on the left side click, External Content. Then under the section Security settings for Workbook Links, click, Enable automatic update for all Workbooks Links.
Computer system requirements: Excel 2000 (V9) or later. It will run on a Mac if you can open other Excel spreadsheets, but NOT with MS Works.
RWR will run, but very slowly, on a 300 MHz Pentium I system with Windows 98 and 128MB RAM. If you received a CD, then you won’t need to follow these unzipping instructions. Just copy all of the files from the CD to a folder on your hard drive using Windows Explorer (right click on the Start button and choose Explore).
Then use MS Excel to open RWR.xls (or Dual RWR.xls) as you would any other workbook (Excel spreadsheet).
If you received your RWR via e-mail, then it will need to be de-compressed, or unzipped, before it can be used. If you don’t have Windows XP/Vista, and you regular double-click on RWR.zip (or Dual RWR.zip), you’ll get an error message, because nothing can open a zipped file.
Windows XP/Vista will automatically unzip the files by double clicking on them. Just double-click on the attachment icon in the original delivery e-mail message (RWR.zip or Dual RWR.zip). Several different versions of an XP/Vista unzipper may come up, so it’s impossible to give exact instructions. Just follow the directions it’s giving you, and choose options that look like “extract all files.”
When you get what looks like a Windows Explorer window that’s displaying a file called RWR.xls, or Dual RWR.xls, then it’s unzipped.
All you need to do is move this file to a location on your hard drive where you can remember how to find it later (or just move or copy it to your desktop, or My Documents, or you can open it from here with Excel and then save it to a folder). This is an important step, so ensure that you remember to copy the spreadsheet to a folder on your hard drive, as soon as the unzipping program does its thing, and displays the Explorer window, or you’ll have to do it again.
If you’re confused, just copy it to your My Documents folder for now: When you get the Windows Explorer screen that’s displaying a file called RWR.xls, or Dual RWR.xls, click once on the file. Press Control C to copy it to the Windows Clipboard. Or right click on the file, and choose, Copy. Then open up a new Windows Explorer window, by Right clicking on Start, then choose Explore. Then click on the My Documents folder. Then press Control V, to paste the file into the folder. Or Right click on the My Documents folder, and choose Paste. It’s there when you can look at your My Documents folder, and see either RWR.xls or Dual.xls. If the files are RWR.zip or Dual RWR.zip, then you moved the file before you unzipped it, and you’ll need to start over again.
Do not delete the original delivery e-mail with the zipped files to provide a fresh backup if needed.
When the spreadsheet is on your hard drive in a place where you know where to find it, open MS Excel (or Lotus or QuattroPro) and find it and open it. When you can do that, then you’re done.
If you don’t have Windows XP/Vista/newer version of Windows, then contact the site for unzipping directions.
RETIREMENT SOFTWARE INSTRUCTIONS
Important! Please read the program overview (pages 4 & 5) before proceeding
Copyright 1997 - 2009 Toolsformoney.com, All Rights Reserved Page 6 of 60
REAL WORLD RETIREMENT
If you have Dual RWR, please read the last page now
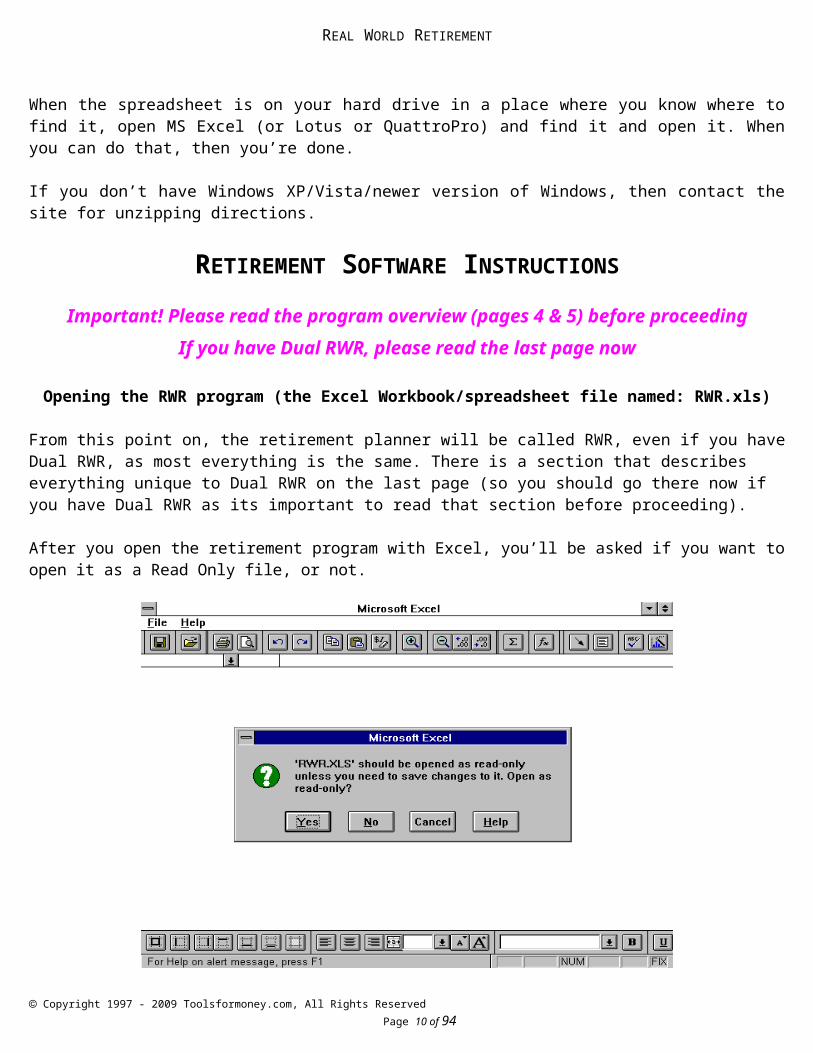
Opening the RWR program (the Excel Workbook/spreadsheet file named: RWR.xls)
From this point on, the retirement planner will be called RWR, even if you have Dual RWR, as most everything is the same. There is a section that describes everything unique to Dual RWR on the last page (so you should go there now if you have Dual RWR as its important to read that section before proceeding).
After you open the retirement program with Excel, you’ll be asked if you want to open it as a Read Only file, or not.
The purpose of this is to preserve all of the empty input fields (and presentation sheet formulas and formats) in the original template, to help in preserving the original file, saving client data, and to facilitate making proposed versions from current versions. This is discussed in more detail below. For now, click Yes.
The template can be saved later (preferably under a folder/directory specific to a client) using a different file name than RWR.xls (or whatever you renamed it).
Not overwriting RWR.xls will preserve the template with blank input cells, and everything in its original state. This will make starting a new client, or a new version, easier as you won’t have to manually blank out all of the input cells before you start inputting a new client. This is all explained on pages 10 & 11. Following these steps will save time.
Tips for organizing client data, client work, computer files, and saving them in logical places, are here: http://www.toolsformoney.com/filesave.doc
If you see #REF! anywhere in the retirement software, then send an e-mail to get a new copy of the program. This happens when bits were lost either in the e-mailing, zipping, or CD creation process. If you're seeing this: #### then either increase your View, Zoom magnification number, or make the column width wider or row height bigger.
Copyright 1997 - 2009 Toolsformoney.com, All Rights Reserved Page 7 of 60
Here’s the general flow of data input when you start from scratch:
1) Input all of the generic information into the top left of the Summing & Input sheet, starting in cell A2. It doesn’t matter which cells you do first, but you will get more error messages if you do not use the generic “top to bottom then left to right” convention (you start at the top left side of the Summing & Input sheet, and then you work your way down, then move to the next column to the right, and then continue top to bottom).
2) Input tax information in cell E8 of the Summing & Input sheet.
3) Input Social Security tax information starting in cells E22 of the Summing & Input sheet.
4) Input any earned incomes starting in cells L2 of the Summing & Input sheet.
5) Input any pensions, or similar investments, starting in cells U2 of the Summing & Input sheet.
6) Input any miscellaneous income or expenses into any of the 14 input areas of the Summing & Input sheet.
7) Input the accuracy of the data you want to show on the presentation pages by entering a value into cell BP7 of the Summing & Input sheet
8) Input retirement asset information. Start with Oldest’s Asset #1, and work your way left. If it’s a jointly held investment, it doesn’t matter if it’s input into the oldest or youngest’s assets. See previous sections of this manual for more details on entering asset information. But try to keep them in order to keep things organized.
a) Enter the investment names, market values, effective age, rates or return, contributions, and the age when it will begin to pay out retirement income.
b) Enter the payout method into cell A16. Make sure you input required data into cell A27. This will vary with the ten payout methods. The clients probably didn’t fill out the payout method on the Fact Finder, so it’s up to you which one you want to use, or you can discuss it with the clients. Remember, you should have at least one Flexible Asset at all times once the first client retires. If in doubt, always use payout method #6.
9) Scan the input areas of the Summing & Input sheet, and all of the Asset sheets that you entered information into, for red error messages. Read them as they will tell you where to look to fix the exact cell with bad input.
10) Correct all input errors until your current version is correct.
11) Print the current version until you have what you need to present the current version to the clients. We sometimes send the current version to clients in the mail as a way of confirming the data, and to show them why they need to bring their checkbooks to their next meeting.
12) Save the current version with a unique file name, and into a unique client folder.
13) Make changes that result in progress reaching income goals in the proposed version.
14) Save this proposed version with a unique file name, and into a unique client folder. Print.
Copyright 1997 - 2009 Toolsformoney.com, All Rights Reserved Page 8 of 60
REAL WORLD RETIREMENT
Back to explaining basic input concepts: The program will initially open up to the main input sheet, and the main input area, of the sheet.
Now let’s prepare to input data into the top left part of the main data input sheet, which is called Summing & Input on the sheet tab shown in the bottom left corner. This is where everything but the specific asset (assets with market values) information in entered. Dual RWR will open up to the Master Input sheet. All inputs, except manual overrides, are here on this one sheet to help minimize having to switch between the sheet tabs so much during the input process.
Unless you saved the template with data stored in input cells, the program will open up with the Summing & Input sheet ready to accept new input data. To go to the top left of a sheet, press ^Home (Control and Home at the same time).
The first thing you should know at this point is that all of the input cells throughout the program are color-coded. Knowing the colors will help you learn the program much quicker and will save time. There are basically five colors to be aware of:
Cells that are “pea green” accept data input that affect both clients (e.g., cell A2 in the graphic below).
Cells shaded light green, accept data input only for the oldest client (e.g., cell A3 in the graphic below).
Cells shaded bright green; accept data input for only for the youngest client (e.g., cell A4 below).
Anything colored red is an error message. All errors should be read and dealt with before proceeding.
Cells that are any other color but green (white, yellow, or gray) on the calculation and input sheets are program
cells. Program cells do not accept user data and cannot be accessed by the user. This prevents the user from
making a mistake and destroying the program.
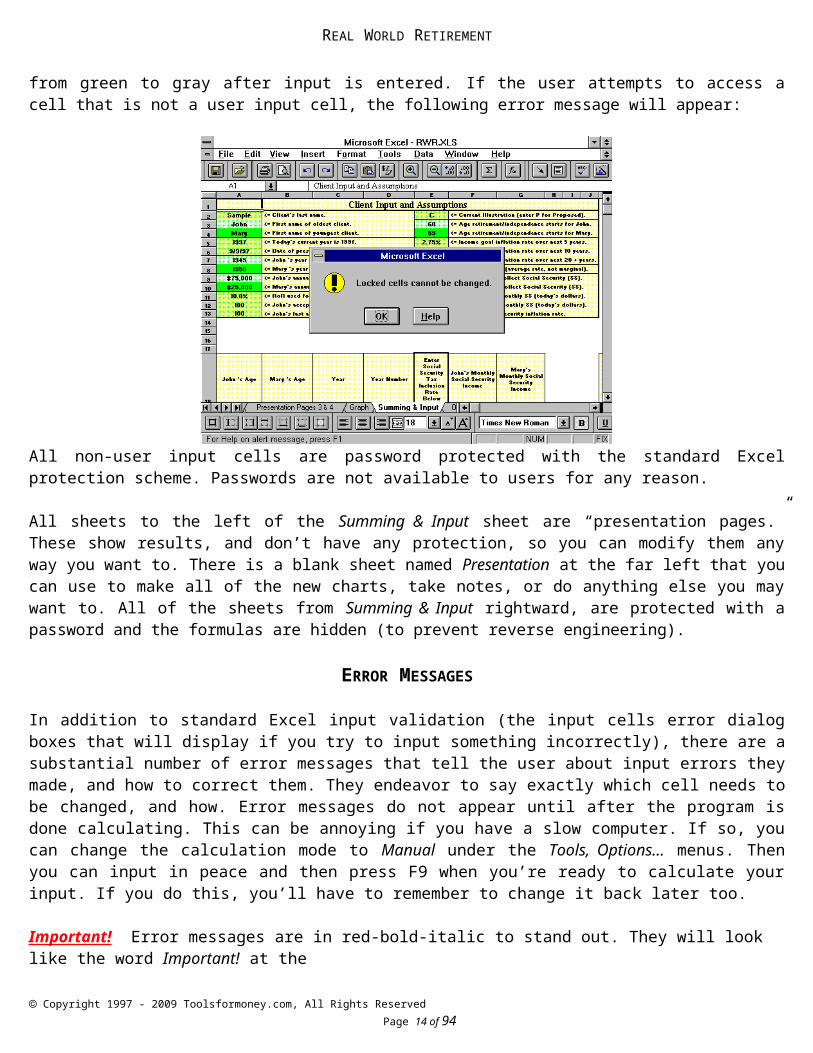
All of the sheets left of the input sheets are presentation sheets. Everything on these sheets can be changed as there is no password needed to unprotect them. With most input cells, Conditional Formatting is used to change the color from green to gray after input is entered. If the user attempts to access a cell that is not a user input cell, the following error message will appear:
All non-user input cells are password protected with the standard Excel protection scheme. Passwords are not available to users for any reason.
Copyright 1997 - 2009 Toolsformoney.com, All Rights Reserved Page 9 of 60
REAL WORLD RETIREMENT
All sheets to the left of the Summing & Input sheet are “presentation pages.” These show results, and don’t have any protection, so you can modify them any way you want to. There is a blank sheet named Presentation at the far left that you can use to make all of the new charts, take notes, or do anything else you may want to. All of the sheets from Summing & Input rightward, are protected with a password and the formulas are hidden (to prevent reverse engineering).
ERROR MESSAGES
In addition to standard Excel input validation (the input cells error dialog boxes that will display if you try to input something incorrectly), there are a substantial number of error messages that tell the user about input errors they made, and how to correct them. They endeavor to say exactly which cell needs to be changed, and how. Error messages do not appear until after the program is done calculating. This can be annoying if you have a slow computer. If so, you can change the calculation mode to Manual under the Tools, Options… menus. Then you can input in peace and then press F9 when you’re ready to calculate your input. If you do this, you’ll have to remember to change it back later too.
Important! Error messages are in red-bold-italic to stand out. They will look like the word Important! at the beginning of this paragraph. The only things in the whole program that are colored red are the error messages. Any time you see anything red, always stop what you’re doing, read, and correct, all error messages immediately when they come up. This will save time chasing your tail.
They should all go away after at least one of the 20 asset sheets are populated with valid data.
Note: Some error messages are just informational only. If the word Error! appears (with an exclamation point), then it’s a real error message that needs attention. To maintain maximum flexibility, the program will run along most of the time with faulty input that produced an Error! message. This is because sometimes you need to do things that are out of ordinary to get the results you need. In other words, error messages rarely stop the program from running, so it’s up to the user to decide whether or not to illustrate using input that caused an error message.
If you see #DIV/0!, #VALUE!, #REF!, other Excel error messages, or an input validation error box appears, then it’s a real error that needs to be fixed before the program will calculate properly.
If the word Error? appears (with a question mark), then the program is just pointing out that the user entered data that may have been in error. It’s just a way to remind you to check your input, because you did something unusual.
Because of the myriad combinations of data input, there may be errors in the error messages. There also may be combinations of data that should have produced an error message, but didn’t. If you have a question about any of them, please send an e-mail stating the sheet, the exact cell, and the other pertinent input that led it.
If you get a dialog box saying that the valid range of values is from this to that, and your value is between these values, then the problem is you can’t input pennies into that field. The values have to be whole numbers without decimals. This is an Excel feature called input validation, and will help prevent inputting most stray characters and errors caused by input that’s not logical.
DATA ENTRY
Now you’re ready you enter data into the retirement software.
A web page about making simple basic quickie reports using minimal input is here: http://www.toolsformoney.com/retirement_software_quickie.htm
Always start at the top left of the sheet tab named Summing & Input (or the Master Input sheet on Dual RWR).
Copyright 1997 - 2009 Toolsformoney.com, All Rights Reserved Page 10 of 60
You can copy the input areas to the far left unprotected presentation sheet, then make notes there, so you'll know why you did what you did later.
Enter the client, prospect’s, or your last name in cell A2 (<= Enter the Client’s last name. or cell A4 on Dual RWR). Then close the workbook by either by choosing Close through the File menu, or by clicking the top right close box.
If you’ve purchased RWR for your own use, and don’t generate reports for other people, then substitute you and your spouse’s names when you read client or spouse in this manual. You’ll still need to input data in order of which one of you is older though. This makes everything flow logically.
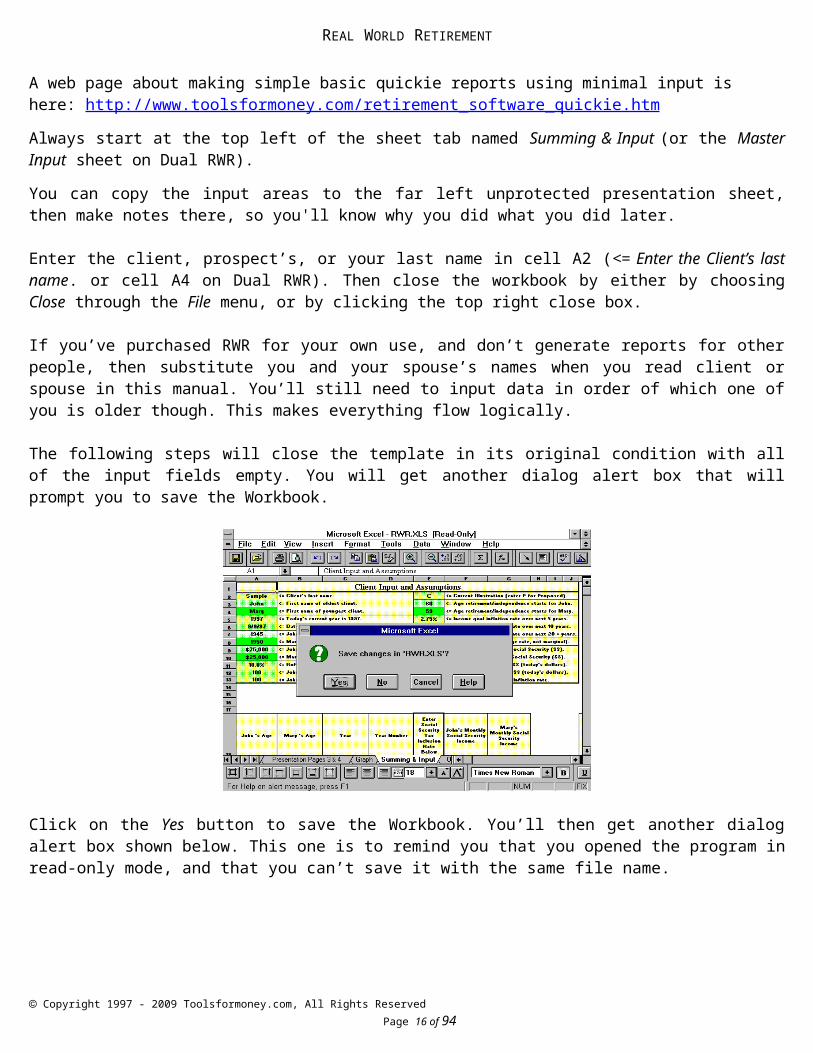
The following steps will close the template in its original condition with all of the input fields empty. You will get another dialog alert box that will prompt you to save the Workbook.
Click on the Yes button to save the Workbook. You’ll then get another dialog alert box shown below. This one is to remind you that you opened the program in read-only mode, and that you can’t save it with the same file name.
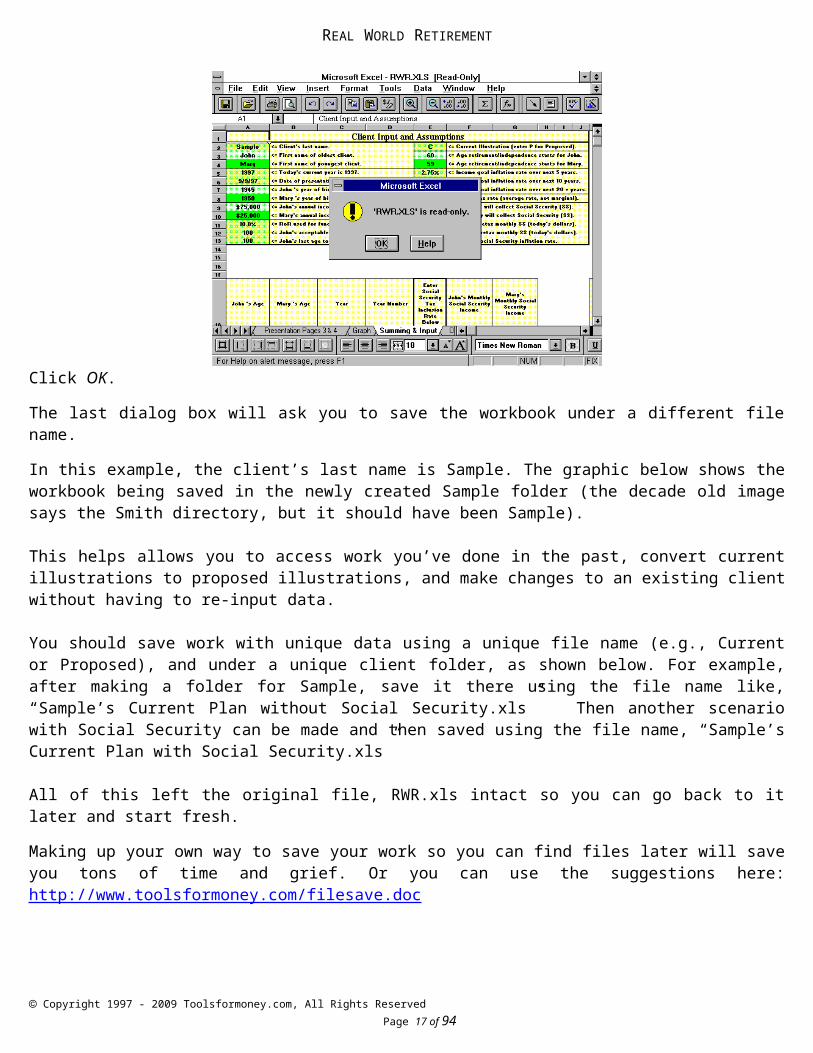
Click OK.
The last dialog box will ask you to save the workbook under a different file name.
Copyright 1997 - 2009 Toolsformoney.com, All Rights Reserved Page 11 of 60
REAL WORLD RETIREMENT
In this example, the client’s last name is Sample. The graphic below shows the workbook being saved in the newly created Sample folder (the decade old image says the Smith directory, but it should have been Sample).
This helps allows you to access work you’ve done in the past, convert current illustrations to proposed illustrations, and make changes to an existing client without having to re-input data.
You should save work with unique data using a unique file name (e.g., Current or Proposed), and under a unique client folder, as shown below. For example, after making a folder for Sample, save it there using the file name like, “Sample’s Current Plan without Social Security.xls” Then another scenario with Social Security can be made and then saved using the file name, “Sample’s Current Plan with Social Security.xls”
All of this left the original file, RWR.xls intact so you can go back to it later and start fresh.
Making up your own way to save your work so you can find files later will save you tons of time and grief. Or you can use the suggestions here: http://www.toolsformoney.com/filesave.doc
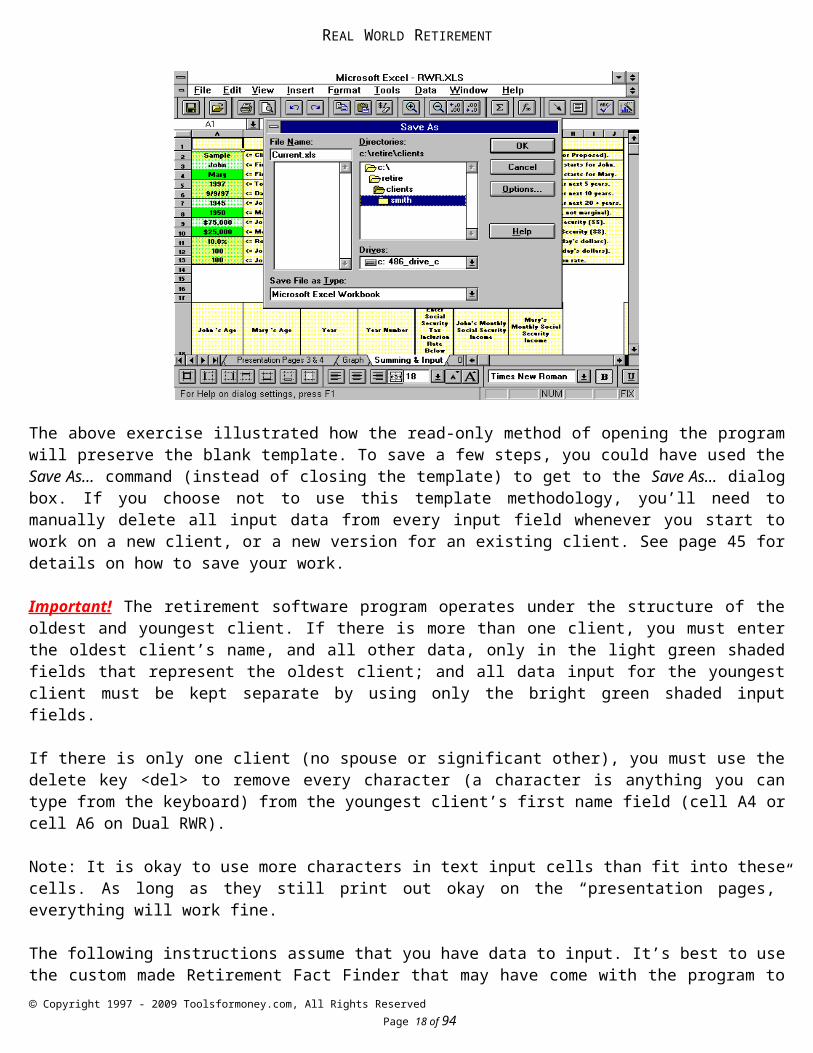
The above exercise illustrated how the read-only method of opening the program will preserve the blank template. To save a few steps, you could have used the Save As... command (instead of closing the template) to get to the Save As... dialog box. If you choose not to use this template methodology, you’ll need to manually delete all input data from every input field whenever you start to work on a new client, or a new version for an existing client. See page 45 for details on how to save your work.
Important! The retirement software program operates under the structure of the oldest and youngest client. If there is more than one client, you must enter the oldest client’s name, and all other data, only in the light green shaded fields that represent the oldest client; and all data input for the youngest client must be kept separate by using only the bright green shaded input fields.
If there is only one client (no spouse or significant other), you must use the delete key <del> to remove every character (a character is anything you can type from the keyboard) from the youngest client’s first name field (cell A4 or cell A6 on Dual RWR).
Copyright 1997 - 2009 Toolsformoney.com, All Rights Reserved Page 12 of 60
Note: It is okay to use more characters in text input cells than fit into these cells. As long as they still print out okay on the “presentation pages,” everything will work fine.
The following instructions assume that you have data to input. It’s best to use the custom made Retirement Fact Finder that may have come with the program to get the data from the client (available for a few bucks more). It is an unprotected MS Word document and the file name is Retirement Fact Finder.doc.
Start by entering the client’s last name into cell A2 of the Summing & Input sheet (you may already have done this in a previous step), and then continue entering data into the generic input (cells A3 to A8). At least one character must be input into both of the oldest client’s name fields (cells A2 & A3) for the program to work properly. (Add two row numbers in cell references for Dual RWR, so A2 is A4).
Input generic year/date data into cells A5 - A8. In cells B7 - B8, their current age and life expectancy will display.
A generic tip in the 21st century is to input years including the 2000. If you input 6/30/08 in Excel, it will sometimes think it is 6/30/1908. So input 6/30/2008 instead.
CLIENT AND SPOUSE INCOME GOALS
Cells A9 and A10, respectively, ask for the client and spouse’s input goals. An income goal is how much money the client needs, or wants, to have when they retire.
Both client & spouse can have their own separate income goals. For example, assume husband and wife are the same age (in this case, it doesn’t matter who is input into as the oldest and youngest). The husband (client, or oldest client) can retire at his age 60 with a goal of $75,000 a year, while the wife keeps working five more years after the husband retires, and then she retires on $25,000 a year. You typically ask them to tell you what they want to use as income goals, and if these goals are before or after taxes. These questions are all on the custom Retirement Fact Finder.
The personal budget software that’s available to compute these present or future income goals, down to the dollar in every year, are here: Family Budgeting and Cash Flow Projector.
These retirement income goals are in today’s dollars and net of taxes. In other words, how much money will be spent. Also, these amounts are before taking inflation into account. Cost of living inflation will be input and compounded onto these income goals, as discussed in detail below. So don’t input into cells A9 or A10, what you think income goals are going to be in the future, after being adjusted for inflation. If you know for sure what they’ll be in future years, then account for them using the Income Goal manual override column, as explained in a later section. (Add two row numbers in cell references for Dual RWR, so A9 is A11).
If both clients want to retire in the same year, you may want to keep things simple by using a combined income goal.
To do this, just leave cell A10 (Youngest Client’s Income Goal) blank by using the <del> key to delete all characters from this cell. Or, you can divide this combined goal in half and enter half in cell A9, and half in cell A10. Either way will produce the same numeric results if both people are retiring in the same year. The only difference between these two methods is the way the income goal text appears on the Assumptions & Additional Need sheet.
After you have entered this generic input and income goals, you’ll notice income deficits if you look at other sheets. This is because you’ve not entered any assets or anything that generates income yet. Let’s prepare to discuss that now.
FUNDING INCOME DEFICITS
Copyright 1997 - 2009 Toolsformoney.com, All Rights Reserved Page 13 of 60
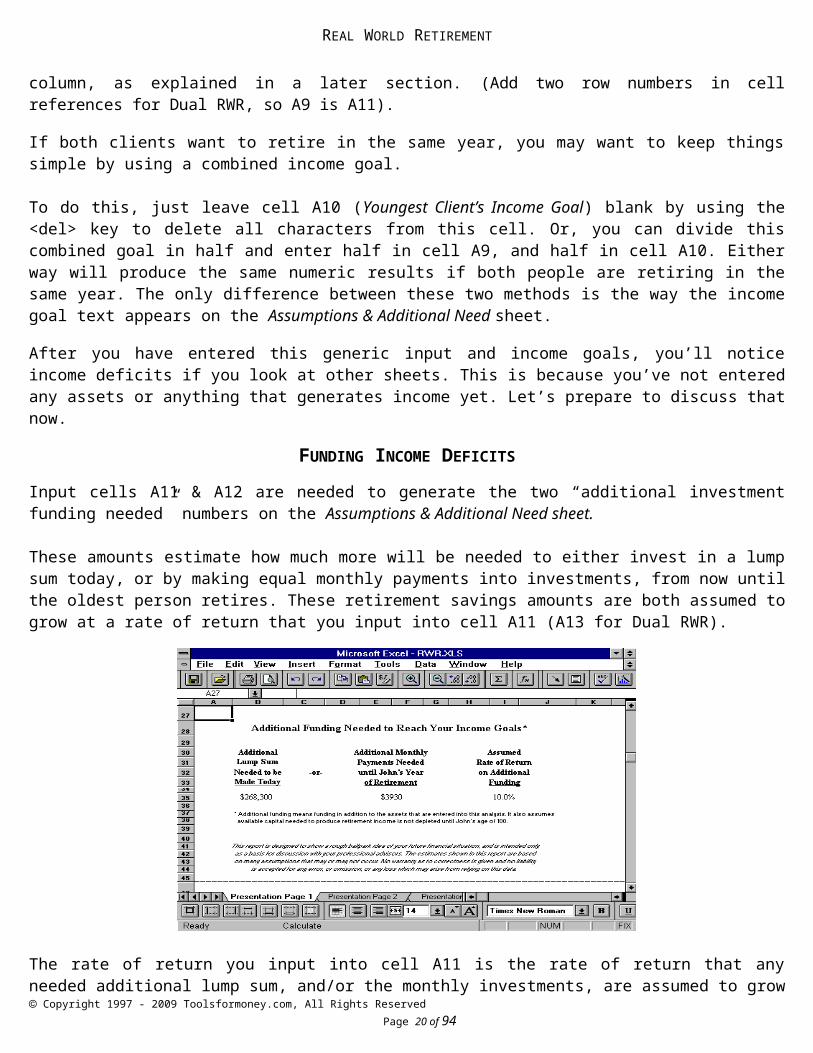
Input cells A11 & A12 are needed to generate the two “additional investment funding needed” numbers on the Assumptions & Additional Need sheet.
These amounts estimate how much more will be needed to either invest in a lump sum today, or by making equal monthly payments into investments, from now until the oldest person retires. These retirement savings amounts are both assumed to grow at a rate of return that you input into cell A11 (A13 for Dual RWR).
The rate of return you input into cell A11 is the rate of return that any needed additional lump sum, and/or the monthly investments, are assumed to grow at. This rate of return is also assuming tax-free distributions, so use the appropriate larger number if you want it to be taxable. These lump sum and monthly numbers are how much more needs to be invested to reach the stated income goals. This is in addition to everything that has already been inputted.
The above graphic shows the choice if they want to reach their goals: 1) Invest $268,300 today and get a 10% rate of return until the oldest client retires, or 2) Invest $3,930 per month, every month at 10% until the oldest client retires.
Data Input Tip: How Excel accepts numbers into data input fields that are asking for percentages (e.g., cell A11 of the Summing & Input sheet), is determined by what version of Excel you have. In newer versions, (7 and above) entering a 10 into the cell will produce 10%. In older versions, entering a
10 will produce 1,000%. Keep an eye on this, and watch for red error messages.
The lower the rate of return entered into cell A11, the higher both the lump sum and monthly payments will be, and vice versa. This is because the new money you’re saving will grow slower with lower interest rates. If you don’t understand this point, you should brush up on basic time value of money concepts before proceeding.
Cell A12 (A14 for Dual RWR) is the FV (Future Value) part of this time value of money equation. The user enters the year that the oldest person is assumed to be passed away, or has told you that it’s acceptable for their assets to be depleted at this age. The longer people are alive and taking income withdrawals, the larger the dollar amounts of additional need will be for both methods of funding the income deficits (lump sum or monthly), and vice versa.
This information should come from the clients, again using the Retirement Fact Finder. If you are running reports for clients, then we recommend using a minimum of age 95 in cell A12, even if they tell you that they plan to kick off at age 85. This is because medical technology is progressing so rapidly, people are living a lot longer than they think they will (sometimes even beyond their wishes). This is more conservative, will keep you out of trouble, and will help people see the need to invest more money and/or strive to get a higher rate of return over the long run.
Copyright 1997 - 2009 Toolsformoney.com, All Rights Reserved Page 14 of 60
REAL WORLD RETIREMENT
TWO GENERIC INPUT FIELDS
The next two input fields don’t have anything to do with calculating numbers. Cell A13 (A15 for Dual RWR) is asking when you want to stop the numbers from printing on Annual Summary Numbers, and other presentation sheets.
If clients told you they want to assume they will be passed away at oldest client’s age of 95, but they ran out of money at the oldest client’s age of 85, it’s up to you whether you want to illustrate ten years of income deficits or not. You can show these numbers all the way through the 70-year window, but we usually don’t. Once the money runs out, it’s usually futile and distracting to show a bunch of meaningless negative numbers, so you can stop them from printing at any age. The age you choose here does not have any effect on calculations done to produce the additional funding numbers. It just stops them from displaying and printing out.
Cell E2 switches presentation page text between Current and Proposed versions via drop down menu (where you choose between the available options (sorry, but there’s no way to make the text bigger on the drop down menus).
A “current” version is made when you input client data just using the information they gave you. This illustrates what their future would most probably look like if they never met you, and just kept on doing whatever it is they’re doing. This switch is not on Dual RWR because current and proposed versions are already hard-wired into the program.
Financial planners then earn their money by making changes to the structure of their investments, incomes, expenses, income goals, tax rates, and then “propose” these changes to them by running a “proposed” report.
You can change this text from Current to Old, and Proposed to New if you want to on the presentation pages. All cell E2 does is change the text on the presentation pages, and the headings on all of the asset pages. It does not magically turn the current version into the proposed version with different numbers that show the client how to reach their goals! That’s what clients’ pay you to figure out. Retirement strategies that detail how to take a current version that’s not meeting the client’s needs, and turn it into a proposed version that does, is discussed later.
People using RWR for their own purposes would most likely not use a current version. They’d input what they thought was going to happen, then would have to “tinker” with different input until they see how they will reach the main objectives. This is usually retiring young enough to enjoy life, being able to have enough money to cover expected expenses, all without outliving their money.
So consumers rarely save current scenarios, as it’s not needed. In this case, you can choose the option “Neither” from the drop down menu, and this text will go away.
THE AGES WHEN RETIREMENT BEGINS
Cell E3 (A16 for Dual RWR) is where you enter the oldest person’s age when they want to either retire, stop working full time, be financially independent, or whatever you or they want to call it.
Cell E4 (A17 for Dual RWR) is the same thing for the youngest client.
Normally clients will tell you this age, and of course it’s always best to use the Retirement Fact Finder to gather this data before inputting. The age you specify here is when the income goals begin to be added into the equation, and activates when numbers begin to appear on Annual Summary Numbers, and other sheets.
Copyright 1997 - 2009 Toolsformoney.com, All Rights Reserved Page 15 of 60
Client and spouse can retire in any year starting at their current ages. Client and spouse do not have to retire in the same year, it doesn’t matter who retires first, and it doesn’t matter how many years are in between the two retirement ages.
You cannot, however, enter a retirement age that is earlier than the client’s current age. If you have a client who is currently 70, and he retired at age 65, you will get a real error message, and the program will not function, if you enter any age less than 70 into cell E3. This concept is the same throughout the program - you cannot go back in time.
INCOME GOAL INFLATION
Cells E5, E6, & E7 (A18 – A20 on the Master Input sheet for Dual RWR) on the Summing & Input sheet is a tricky part that you may not to even want to use. The program has three (five really) layers of retirement income goal inflation for maximum control and flexibility:
The first cell (E5) is the user’s, or the client’s, assumption of what the average inflation rate over the next 1 - 5 years will be. Since inflation will more than likely happen every year, the first year of inflation is the current year, not the first year of the clients’ retirement. Entering a number here will inflate the income goals at that rate for each of the next five years on an annual compounding basis. E5 is A18 on Dual RWR.
Unique RWR feature: To settle the controversial issue of how much to inflate the income goal in the first year with a former group of picky financial planners, we made RWR only inflate the first year by half
(because half the year is probably gone anyway). This only applies to the first year’s numbers. If the income goal is $100,000, and the 1 - 5 year inflation rate is 2%, then the first year’s income goal will be $101,000, not $102,000. Then second year, the number will be $103,020. The argument was if it was February when you’re making the report, then this year’s total inflation rate should be applied to the first year, but if it was December then you should ignore this year’s inflation because this year is essentially over anyway. To avoid having to make the program work on a monthly basis, we compromised and just made the first year inflate by half. Nobody knows what inflation will be anyway, so it’s no biggy. Even
if you were to use the Cash Flow Projector, and manually inflated every expense for every year, you’re still going to be way off from what’s going to happen in the Real World.
The second (cell E6) is the assumption of what the average inflation rate over the next 1 - 10 years will be. Again, year 1 is the current year, not the first year of the clients’ retirement. It’s logical to assume that you have a question at this point! If you entered an inflation rate for years 1 - 5, and then another for years 1 - 10, wouldn’t that wipe out the rate you used for years 1 - 5? Well, this is one of those times where we put all of the information learned in the CFA program to work for a change.
Each of these three rates are true actual rates for those time periods. The 1 - 10 and 1 - 20 year’s rates are “implied.” This is beyond the scope of this manual, but suffice it to say that income goals begin being inflated for all three time periods will be inflated at the correct rates that you input for all three ranges. If you input 2% for years 1 - 5, and 3% for years 1 - 10, then the rate will be higher than 3% in years 5 - 10 to make up the difference. Cell E6 is A19 n Dual RWR.
The third (cell E7) is the user’s, or the client’s, assumption of what the average inflation rate over the next 1 - 20 years will be. The same text as above applies, with an extra point. The years from 21 on are inflated at this rate too (the fourth “layer”). If you input a 1 - 10 year rate that’s higher than the other two rates, then the 11 - 20th years will have inflation higher than the number you input into cell E7. Starting in year 21, however, the inflation rate will be exactly what you input into cell E7 (A20 on Dual RWR).
So, what does this melarchy mean, and why should you care? Assume, for example, that inflation for this year and the next are assumed to be 6.5%. In the next three years, things will assume to be calm again, with inflation down to around an average of 3.5%. If you were a detail person, you would enter 4.7% for years 1 - 5 (the average rate for those 5 years). And if you assumed that inflation would be around 2.75% from years 5 - 10, a detailed person may
Copyright 1997 - 2009 Toolsformoney.com, All Rights Reserved Page 16 of 60
REAL WORLD RETIREMENT
enter 3.75% for years 1 - 10 (the average rate for those 10 years, using the same assumptions for the first 5 years again). The same process applies for years 1 - 20. Non-detailed people can just enter 3% for all three-time periods and it will be 3% all the time for all time periods.
The Retirement Fact Finder asks the client to fill out these three ranges. Sometimes the clients fill out all three, sometimes they just fill out one and leave the others blank, and sometimes they just put question marks everywhere. The point is that the power is there if you want to use it. If you don’t, then just make all three cells the same number, and you’re done. You don’t have to use this feature, but it’s nice to know it’s there.
The income goal inflation number shown on the Assumptions & Additional Need sheet is the average over the next 30 years. This is the “fifth layer.” You can tweak all three input fields to get different combinations of the five layers you want to show.
There is a text footnote on the Assumptions & Additional Need sheet to show your input. Income goal inflation also can be manually overridden each year as explained later.
If retirement income goal data is all coming from the Cash Flow Projector, then all of this is ignored anyway.
INCOME TAXES
You have the following options on how you want the program to consider taxes:
You can enter a global average (not marginal) rate in cell E8 (A21 for Dual RWR), which will take out this percent in income taxes from every source of income.
You can manually override this global average rate by using the section starting in cell Q94 on the Summing & Input sheet. This allows you to change the global tax rate used throughout the program at any year.
You can make everything gross of taxes (no taxes will be taken out of anything) by leaving cell E8 blank or entering a 0 into it (or cell A21 on the Summing & Input sheets of Dual RWR).
On most of the “assets” that produce income, but do not have market values, you can choose to either to tax, or not. These are earned incomes, pensions, and the manual income and expense input areas.
On Social Security, you can either enter a global inclusion rate, which will make Social Security taxable at a certain rate in every year, or you can opt to make Social Security non-taxable by entering 0 into cell E22 on the Summing & Input sheet, or you can choose to manually override the Social Security tax
inclusion rate in any year you want to (starting in F94 on the Summing & Input sheet). E22 is A27 on Dual RWR.
On each of the 20 Real World assets, you enter a percentage of the automatically generated income withdrawals that would be subject to taxes. Only the income generated from retirement assets are taxed.
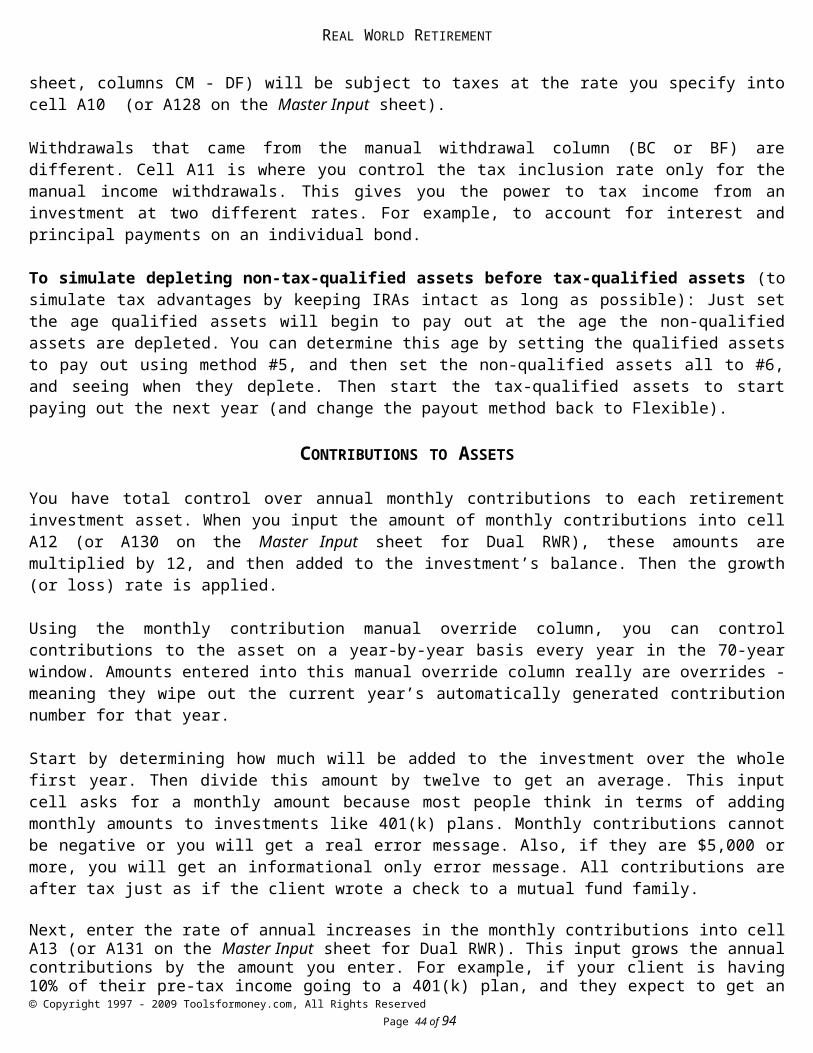
You can also separately enter the percentage of income that is subject to taxes from manual withdrawal income (cell A11 and column BC on the asset sheets. On Oldest’s Asset #1, it’s cell A129 on Dual RWR).
The last two items are explained in later sections. It may sound complex, but you’ll get the hang of it quickly and will appreciate the amount of control you have with a little practice.
Copyright 1997 - 2009 Toolsformoney.com, All Rights Reserved Page 17 of 60
REAL WORLD RETIREMENT
First of all, you should decide if you even need to tinker with all of the following tax stuff. If the client and spouse want to see reports gross of taxes (no taxes), then there are two ways of handling this. First you could just set the tax rate input field (cell E8 or A21 on Dual RWR) to be 0%, and the plan would illustrate everything gross (before taxes).
Or you could take their gross (before tax) income goal amount and multiply it by their assumed average tax rate, and then convert their retirement income goal to net after tax numbers. Example: The oldest client put down $50,000 gross, and the youngest client put down $25,000 net. You estimate they’ll be in an average bracket of 20% when they retire. You would then enter $40,000 ($50,000 minus 20% in taxes) in cell A9, and $25,000 in cell A10 (A12 on Dual RWR). Remember that retirement income goals are always net of taxes, or are spendable money.
Note: Taxes are taken out of the Flexible Asset payouts on column BH of the asset sheets, not the blue area of the Summing & Input sheet, like all of the other nine retirement income withdrawal methods.
Withdrawals are first subtracted from the beginning of the year’s investment balance, then taxes are subtracted, then the rate of return is applied to get the end of the year investment balance. Amounts shown on the Flexible Asset column of the asset sheets (column AO) are how much income was used to fund the retirement income goal. Taxes will not show up here to show how much was withdrawn and used and applied to the income goal plus taxes. Tax amounts are shown and summed on the Taxes sheet. First the annual payment is calculated and applied toward the income goal. Then taxes are calculated and added to the payment. Then the rate of return is applied. This is now the ending year’s investment balance, shown in column BH (which is also the next years’ beginning balance).
To figure it out, first take the average tax rate on cell E8 of the Summing & Input sheet (or column Q of the Summing & Input sheet if it was manually overridden), and multiply that by how much taxes are applied to distributions you input on the asset page (cell A10).
For example, if you input 25% as a global tax rate into cell E8 of the Summing & Input sheet, and 50% into cell A10 of the asset sheet, then 12.5% of the total distribution from the Flexible Asset will be taxed (and will not be applied toward funding the income goal, but will be deducted from the account balance).
To see how this works, divide the amount shown in the Flexible Asset column AO by 1-0.125 (or 0.88). The resulting amount is the total amount subtracted from the Flexible Asset in that year. This amount will add up to the amount needed to fund the income goal in that year, plus taxes paid in that year.
Taxes are taken out of retirement asset payouts on the blue areas of the Summing & Input sheet (column CM) for all other payout methods. These amounts have the taxes included with the income amounts. In other words: For all payout methods except Flexible: Gross amounts of income are subtracted from the investment’s balance in column BH of the asset sheets. Taxes are not accounted for here. The annual income amounts shown in the blue areas of the asset sheets display how much money is coming out the investment, gross. These income amounts are then divided by 12 to convert them to monthly income amounts. These monthly income amounts are then used in columns CM to DF (or CV on Dual RWR) on the Summing & Input sheet. It is here (in columns CM to DF on the Summing & Input sheet) that taxes are deducted. Then these net amounts are used to fund the retirement income goals.
Also, taxes are not accounted for during the accumulation phase. Taxes are only accounted for when investments pay out income. Capital gains, interest, and dividend taxes are assumed to be paid from earned income before the investment pays out. You should account for this as you input data if needed (by using a manual expense input area).
SIMPLE (GLOBAL) INPUT OF AVERAGE FEDERAL TAX RATES
Global means that whatever you did affects everything everywhere.
Copyright 1997 - 2009 Toolsformoney.com, All Rights Reserved Page 18 of 60
REAL WORLD RETIREMENT
Enter the client and spouses’ assumed average income tax rate into cell E8 of the Summing & Input sheet (A21 on the Master Input sheet of Dual RWR). This global average tax rate entered will be used every year, on everything.
It’s best to use the average rate because you are (hopefully) dealing with all of the clients’ investments, and income from all sources. Using marginal rates here would be incorrect, because marginal rates are the rates that an additional dollar is taxed at, on top of all of the other income. Here you are, in theory, accounting for all of the clients’ income, not just the additional $1 of marginal income.
For example, take a single person filing an EZ form, making around $50,000. Their marginal rate could be 28%, but their average rate could be around 15%. Add in some mortgage interest deductions, dependents, and credits here and there, and the overall average tax bracket could be well below 10%, even with a $60,000 gross income.
You should account for state taxes too. Don’t account for FICA (Federal Insurance Contribution Act, AKA Social Security and Medicare Payroll Taxes) because this typically won’t be deducted from post-retirement incomes. This tax is only applied to earned incomes, so income received from investments are not subject to FICA Payroll taxes.
The best way to determine the average tax bracket is to use one of the last four sheets to the far left to calculate it: Input data into the three green-shaded cells, and then scroll down and look for numbers that appear in either column D, G, or J. That’s the estimated average tax bracket that you should input into cell E8 of the Summing & Input sheet.
Or you can take data from their most recent tax return. Divide the total amount of state and federal taxes paid (after adjusting for FICA, any refunds or filing payments) by the total amount of Adjusted Gross Income. This is the combined average tax bracket. For example, if the client earned $50,000 in gross income, and paid a total of $10,000 in federal and state income taxes (not FICA), their combined average tax bracket would be 20%.
You can manually override the global average rate at any year by entering the tax rate you want to use in column Q (starting in cell Q94) on the Summing & Input sheet(s).
Most people’s average tax will decline in retirement, so you can account for that easily here. Or if you’re going to have a really good income year while retired, you can temporarily account for that by raising it in those years.
SOCIAL SECURITY: INCOME, COST OF LIVING INFLATION, AND TAXES
Note: Because one would need to know the entire client’s past earnings history to even begin to estimate the clients’ PIA (Primary Insurance Amount, or the amount of monthly benefit), RWR does not compute Social Security PIAs (the amount of Social Security a person will get). This is virtually impossible, and most planners in the Real World either look it up in Social Security literature, use the Social Security website, or have had the clients send away for an actual Social Security determination of benefits from Social Security as part of the planning process (you can call Social Security and order some of these forms for your practice. If you enter more than the maximum benefit, you’ll get an informational error message. These maximums are updated annually.
You should contact Social Security and get a benefit statement showing what the PIA will be at assumed retirement age. Then enter these amounts from your statement or online report into cells E11 & E12 as shown below (or A24 & 25 on the Master Input sheet for Dual RWR).
You can download the Social Security Administration's free AnyPIA benefit calculator here. It's more accurate than commercial benefit calculators, so it's best not to use them.
Copyright 1997 - 2009 Toolsformoney.com, All Rights Reserved Page 19 of 60
There is a page on the site discussing the benefits of taking Social Security at 62 vs. waiting until the full PIAs kick in: http://www.toolsformoney.com/social_security.htm
Start by inputting the age the oldest client wants to start collecting Social Security in cell E9, and the youngest’s age in cell E10 (or A22 & 23 on the Master Input sheet for Dual RWR). The earliest acceptable age without getting an informational error message is 60 (earliest age to collect the survivor’s benefit). You can start Social Security in any year - but be careful, most of the time age 62 is the earliest age Social Security will start up under normal circumstances. Also be aware that the age Social Security will pay the “normal” full benefit goes up from 65 to 68 or so in the future too. The manual overrides discussed later will allow you to account for that.
The user can specify the ages that both client and spouse start to collect Social Security separately. If someone wants to wait to get more than the normal full benefit, they can do that regardless of when the other spouse started collecting theirs, or who “retired” first.
The age you enter to start collecting Social Security will generate monthly income numbers (inflation adjusted) in that year regardless if the client is not yet retired in that year, or has retired 10 years ago. If you do something like that, you will most likely get an Error? error message. As explained in a section above, this is okay and will not affect program operation as long as you’re aware of what you’re doing.
You can manually override any year’s Social Security incomes once they get going by using the Social Security Manual Override section starting in cell F94 on the Summing & Input sheet(s). Just enter the monthly amounts you want to use in that year. You can also manually override the tax inclusion rate (how much of your Social Security income the IRS thinks should be taxed as ordinary income). This is very helpful if they change the rules. With these manual override columns, you can account for any future changes in the Social Security system.
Now use cells E11 and E12 to enter the dollar amounts of Social Security for the client and spouse, respectively. These are cells A24 and A25 on Dual RWR.
Next, enter an annual Social Security COLA (Cost Of Living Allowance) inflation rate into cell E13 (or A26 on the Master Input sheet for Dual RWR). Use your guesstimate, or what the clients entered on the Retirement Fact Finder.
There is no method of accurately predicting these numbers. A tip is to be conservative by inputting a percentage point or less of what you think annual CPI inflation will be. For example, if you think inflation will be 3%, then input 2%.
The percentage input will start to inflate the Social Security income in the year after the current year. This is important to remember because if your client has a statement from Social Security stating their benefit in a future year, you will need to play with the numbers to make the dollar amount match the correct year. What? If they bring their actual benefit estimate form, these numbers will be in today’s dollars. Meaning that the amounts on the statement are as if they retired today. These amounts will increase over time, even if the client has twenty years before retirement.
If you want to manually override the inflation rate, you can do this: Enter the amount of Social Security you expect to have in the Summing & Input sheet’s manual override column F or I, starting in row 94. For example, say you changed the automatically generated amount in cell F110 from $1,000 to $1,100. For the following years you want to show it growing at only 1%, rather than the 2% that you input into cell E13. Enter this formula into cell F111: =F110*1.01 Then use the drag handle (the little square at the bottom right of cell F111) and drag it down to complete the rest of the column. Doing that will both override the automatically generated amount, and its COLA rate.
Copyright 1997 - 2009 Toolsformoney.com, All Rights Reserved Page 20 of 60
Next, decide whether you want to set the Social Security tax inclusion rate globally, or let this income be non-taxable. If you want to set it globally, enter the guesstimated amount of Social Security that the client and spouse will include as part of their taxable income each year into cell E22 on the Summing & Input sheet (or A27 of Dual RWR).
It’s up to the user to determine the correct Social Security inclusion rate, because it will probably change in the future. This tax inclusion rate can also be easily manually overridden in every year by using columns G or J (starting in cell G94 or J94 on the Summing & Input sheet).
ACCOUNTING FOR EARNED INCOMES AFTER RETIREMENT
Important! Don’t input any income or expenses for years before retirement occurs. The program only accounts for cash flows after retirement has begun for at least one person. What is earned, and/or spent, before retirement is irrelevant, and just causes problems, isn’t what happens in the Real World, and so nothing should be input. The only cash flows that need to be accounted for before someone retires, are contributions to assets, as described below.
This is good time to point out that using any of the income slots on the Summing & Input sheet will “force” income and expenses into the equations (the same with earned incomes and pensions). So it’s possible to force more income into the picture than is needed to fund income goals. Surplus income (income over their total combined inflated income goal), is added to the Flexible Assets (explained later). As explained below, you can also use any of the 14 additional miscellaneous income or expense areas if you need to account for more than one earned income stream per client or spouse within the 70-year window.
Now we’re moving away from the first box of input fields on the Summing and Input sheet, and moving right to the next - starting in column L.
Both client and spouse can each have separate post-retirement earned income that can start and stop at any year, can be inflated, and can be manually overridden at each year.
Let’s assume the oldest client put in their Fact Finder that they want to retire at age 60, but has a side business they want to do from ages 61 to 68. They’ll be earning $500 per month in taxable income, and expect profits to increase at a 1% annual rate. See the demo: http://www.toolsformoney.com/retirement_software_demo.xls
First decide if this income will be earned from just one client, or if it will be a joint effort. If it’s a joint effort, then enter a “J” into cell L2 for the first input area (or A30 on the Master Input sheet for Dual RWR). All this does is remove the client’s name on the Assets & Misc. Summaries presentation sheet.
Next, enter $500 in cell L3 (or A31 on the Master Input sheet for Dual RWR). Enter 61 in cell L4. Enter 68 in cell L5. Enter 1% in cell L6. And a “Y” to make it taxable in cell L7. If taxable, this income will have taxes taken out at the rate in column R for those years. That’s all there is to it.
To manually override any of these numbers in any year, use the Manual Overrides, in column M & R on the Summing & Input sheet(s). Any number you input into one of these manual override columns actually “overrides” the numbers the program automatically calculated (meaning it wiped out the automatically generated number completely).
In the demo, John estimated that he’d earn $1,000 per month in the last year of his earned income at age 68, instead of the automatically generated $566. So $1,000 was input into cell M42.
Use columns N and S to make notes of why you used a manual override in that year. This doesn’t affect calculations.PENSION AND ANNUITIZED ANNUITY INCOMES
Copyright 1997 - 2009 Toolsformoney.com, All Rights Reserved Page 21 of 60
The input areas to the right of the Earned Income input area on the Summing and Input sheet(s), columns U & W, are for pension incomes.
Both client and spouse can each have two pensions (or assets with life incomes and no market values, like annuities that have already been annuitized). These incomes can also be inflated. This input area only works for pensions and like investments without market values (meaning you can’t sell them), and nothing can be overridden (you can’t change pensions or annuitized fixed annuities once they start in real life, so why bother?).
Here’s an example shown in the demo: Assume John, the oldest client, works for IBM and plans to retire at age 60. His benefit statement says he’s eligible for a reduced pension at this age, so he’ll get $250 per month if he chooses the single life option. IBM’s regular old defined benefit plan doesn’t provide COLAs (Cost of Living Allowance, nor an inflation benefit), so John will get $250 per month until he dies. The pension section operates a little differently than the others: This $250 per month will not start inflating until the age it starts to pay out. This is because this is the way they show up on people’s benefit statements in the Real World. So the first numbers that appear will be either $250, or $250 less taxes (in the demo, he receives $213 monthly after taxes).
You can change the inputted dollar amount to get whatever amounts you want in the calculations.
It’s not a jointly owned annuity; so do not enter a “J” into cell W2 (or A44 on the Master Input sheet for Dual RWR). Enter “IBM Pension” in cell W3 so this name will show up on the Asset & Misc. Summaries sheet. Enter $250 in cell W4 for the monthly income amount. Enter 60 into cell W5. Enter 0%, or delete all characters, in cell W6 to account for the lack of COLA. Enter “Y” in cell W7 because it will be taxable income. That’s it.
You usually can’t do anything about defined benefit pensions, or fixed annuities, once they start to pay out, so you can’t change any of the numbers once they generate. This income will continue showing up all the way until the end of the 70-year window (but will only be used up until the last year input into cell A12).
Note: This area should only be used for investments that have no current market value. If an annuity has a current market value, then it probably hasn’t annualized yet, and there may still be hope left in converting it to something else better. In this case, you would enter this as a Real World asset into of the twenty asset sheets.
INDIVIDUAL AUTOMATIC MISCELLANEOUS INCOME AND EXPENSES
Both client and spouse can each have up to two miscellaneous incomes or expenses with normal input fields that automatically generate incomes, but without manual overrides.
You can enter amounts starting and stopping in any year, for both clients separately, and they can be inflated automatically. Use this input area if you want to identify these incomes or expenses with the client or spouse’s name on the Income & Expense - Detail sheet. If you want to enter a joint income or expense, use the joint input areas as discussed in the next section. An example would be adding child-care expenses, or recommended Long-term Care premiums in the proposed version.
Demo example: Assume the youngest client put in their Fact Finder that they plan on receiving $20,000 per year from a trust settlement from the age 65 to 70. The income won’t increase in the future, so leave cell AE12 blank.
Enter “Trust Settlement” in cell AE8 (or A70 on the Master Input sheet for Dual RWR) so these words will show up on the Income & Expense - Detail sheet. Enter $1,667 in cell AE9 to account for the $20,000 annual income (you must enter the minus sign to account for expenses. In this case it’s an annual income, so divide it by 12 to input a monthly number). Enter 65 in cell AE10. Enter 70 in cell AE11. Enter “N” in cell AE13, because it’s non-taxable income (if you entered a “Y” with an expense, you’ll get an error message).
Copyright 1997 - 2009 Toolsformoney.com, All Rights Reserved Page 22 of 60
REAL WORLD RETIREMENT
Note how expenses have to have a minus sign input before the monthly dollar amounts (cell AE3 of the current demo). This is a common support question, as is forgetting to convert annual amounts into monthly amounts.How to sell Long-Term Care (LTC) insurance using RWR: Input all of the same parameters in both scenarios by copying and pasting all inputs from current version into proposed version. Then in the current version, use the manual expense input area to input the catastrophic costs of uninsured long-term care - Say $10,000 per month from 75 to 95. Then in the proposed version, you just input, into the same manual input area, just the LTC premiums needed to pay the $10,000 per month benefit (don't input the $10,000 per month expenses). The night and day differences in all of the results then sell the LTC policy for you without even needing the usual sales pitch.
JOINT AUTOMATIC MISCELLANEOUS INCOME AND EXPENSES
You can have up to four miscellaneous joint incomes or expenses with normal input fields that automatically project into the future, but without manual overrides.
If you want to have the income or expense items show up in the Income & Expense - Detail sheet without the client or spouse’s name associated with it, then use these four miscellaneous incomes or expenses input areas to the right starting at cell AO2 (or A96 on the Master Input sheet for Dual RWR). The operation is the same as the individual automatic miscellaneous income and expense input areas described above.
The only thing unusual to watch for here is that the top two input areas (rows 2 - 7) are looking for the oldest client’s starting and stopping ages, and the bottom two input areas (rows 8 - 13) use the youngest client’s ages.
This is a good place to account for paying for children’s educations with out-of-pocket money during retirement, as shown in the demo.
Accounting for debt payments: The best way to do this is using the Cash Flow Projector to account for them, and then integrating into RWR. Ensure that you don’t input them into RWR too, as you’ll be counting them twice.
But if you don’t have the Cash Flow Projector, then just input the debt payments into a miscellaneous expense area. You can also reduce the income goal in the year they are paid off by using the income goal manual override column.
THE TOTALLY MANUAL MISCELLANEOUS INCOME AND EXPENSE FIELDS
These six input areas are not on the Master Input sheet of Dual RWR. They are on the Summing & Input sheet(s).
Both client and spouse can each have up to three totally manual input items (six total) for miscellaneous expenses or income sources (without market values, rates of return, or regular cash flows).
There is nothing automatic about these areas (there is no inflator, rate of return, or tax switch), unlike the eight input areas mentioned above, so you have to manually enter every number in every year. But you here you have total control over every number in the 70-year window. You can enter any regular Excel formula for inflation escalations, deflations, etc., and drag it down to autofill the selected years.
This is the input area where you can change amounts to be any number you want in any year. Then you can also make some text notes in the columns to the right to remember why you did what you did.
Copyright 1997 - 2009 Toolsformoney.com, All Rights Reserved Page 23 of 60
REAL WORLD RETIREMENT
Just enter the name of the income or expense into cell AZ17, BB17, or BD17 for the oldest client, and cell BH17, BJ17, or BL17 for the youngest client. The client’s first name and the numbers will then show up on the Income & Expense - Detail sheet.
After you have entered a name for the item, the cells in row 18 will become active with text letting you know it ready to input numbers for each year’s income or expense into the cells below.
Taxes are not considered in this area, so be sure to enter all income amounts net of all taxes.
Let’s examine accounting for the Sample’s estimated vehicle replacement expenses, as this will illustrate the power of this unique RWR feature. Please see column AZ of the demo.
The Samples will replace a vehicle in 16 years. After trade-in allowance, they plan to spend $18,000. So this $18,000 would be around $37,000, with a 5% vehicle inflation rate. So that divided by 12 is $3,085. These input areas work on a monthly basis, so that’s what needs to be input here - minus $3,085 (-3085). In 26 years, the same thing will happen. In this case the cost of a car has also risen, and so -$4,567 was input as that year’s monthly expense.
Here’s how to do all of this future accounting in Excel: Input the monthly post-trade-in cost of the vehicle today, in this case, $18,000 into the current year’s input cell. So in cell AZ19, input =18000/12
Inflate this 5% in the next year in cell AZ20: =AZ19*1.05 Drag this formula down until the last year of vehicle replacements, in this case down to cell AZ54. Now in each of the years you actually want to make these purchases, do this - starting in cell AZ34: Press Control C to copy. Stay in the same cell AZ34, and then go to Edit, Paste Special. A menu comes up - choose, Values, then click OK. Or you could have just typed in -3085 enter.
This wipes out the formula in cell AZ34 and replaced it with a number. Now delete everything in cells AZ19 - AZ33. These formulas are not needed anymore. Repeat with all of the other years in which you wish to show this purchase (in the case of the demo, cells AZ44 and AZ54). When you’re done, you have properly accounted for three vehicle replacements in three future years, and accounted for the fact that prices will be going up. Just be sure that there’s only three negative monthly expense numbers in that column when you’re done.
THE “NUMBER ROUNDER”
There is a number rounder that allows the user to control the amount of zeros shown on all of the presentation pages.
The input location is on the Summing & Input sheet at cell BP7. This is the only place in RWR with the color red, other than the error messages. This allows the user to round everything on Annual Summary Numbers, Asset & Misc. Summaries, and the additional funding section on the Assumptions & Additional Need sheets, to the nearest $1, $10, $100 or $1,000. Just enter the accuracy that you want to show by entering a 1 in cell BP7 to round everything to the nearest $1. Enter 10 for $10, etc.
The monthly additional need section on the Assumptions & Additional Need sheet, is rounded down one order of magnitude less than everything else. For example, if you enter 100 to round everything to the nearest $100, the monthly need figure will be rounded to the nearest $10. This is because the monthly need number is usually at least one order of magnitude smaller than the rest of the other numbers.
FINISHING UP THE SUMMING & INPUT SHEET
Columns BO - BQ are self-explanatory. Columns BT - CC are explained in a later section.
Copyright 1997 - 2009 Toolsformoney.com, All Rights Reserved Page 24 of 60
REAL WORLD RETIREMENT
Columns CE/CF and CG/CH display how much monthly income is needed in that year (CE) and how much was available from all of the non-asset income to the left on the Summing & Input sheet.
In the demo, John’s first year of retirement shows a total of $1,000 per month in non-asset income (cell BO29), and a need of $5,824 (shown in cells BU29 and CE29). This resulted in $4,824 that needs to come from assets (CF29). Since Mary was not retired yet, there is no income goal for her in cell CG29, so just the $4,824 monthly deficit shows up in the total column, CH.
The unique blue areas: Columns CM to DF are where you can start to see the monthly incomes from the Real World assets, that are not paying out using the Flexible method. Taxes are accounted for here, added to the income amounts from the asset sheets, and the total amounts are deducted from the investment’s end-of-year values.
Column DH shows the total annual combined monthly incomes from all of the non-flexible retirement asset payouts.
Column DJ shows the monthly income need amounts that still need to be funded after all of the incomes from the Summing & Input sheet, and the non-Flexible Assets have been accounted for. In the current demo, cell CH29 shows that after all of the incomes from the Summing & Input sheet have been applied to the first year of retirement income need, $4,824 still needs to be funded to reach that year’s goal. $567 was supplied by retirement investments paying out non-flexible incomes (cell DH29). This leaves $4,257 (cell DJ29) that still needs to be funded via the Flexible Assets to reach that year’s income goals.
Normally, this would have happened just fine, in columns DO - EH, BUT there was no Flexible Asset in place in that year. So there was an income deficit in that year, which is shown in cell EK29.
THE 20 REAL WORLD ASSETS
For ease of navigation between sheets, use the ^PageUp (press PageUp while holding the Control key down at the same time) and ^PageDown keys to move back and forth. This is easier and faster than clicking on the sheet tabs.
Dual RWR only has ten assets as it reached the limits of Excel (there are still twenty assets, but there are ten for Current and ten for Proposed). The inputs start in cell A122 of the Master Input sheet.
The structure of the assets makes RWR the most powerful and flexible retirement planner ever created. As you will see below, these assets give you the total control needed to simulate every Real World scenario. You have total control over how and when assets come into being, how money is added, how they grow or shrink, how they pay out income, and are depleted, down to the dollar in every year.
Each asset has its own separate input and calculation sheet within the main workbook. The twenty sheets start at the sheet called Oldest’s Asset #1, and continue all the way to the sheet named Youngest’s Asset #10 (or Proposed Youngest’s Asset #5 on Dual RWR).
The important things to point out are the unique structure of these asset input sheets. First, they all calculate independently of each other, expect for determining the amount of Flexible Asset income generated. Having assets totally be stand-alone is very powerful because that’s how things work in the Real World.
First, notice that there are ten assets each for the oldest and youngest client (or five each and then they’re duplicated for Dual RWR). This methodology is different from other programs you may have used in the past, so it may take a
Copyright 1997 - 2009 Toolsformoney.com, All Rights Reserved Page 25 of 60
REAL WORLD RETIREMENT
little getting used to. Most of the functionality of RWR comes from being able to set each asset’s parameters independently, regardless of what you input into the other assets.
After you’ve input all of your data into the Summing & Input sheet, go to the sheet named Oldest’s Asset #1 (or Current Oldest’s Asset #1 on Dual RWR). Move to that sheet now. Next, press ^Home to go to cell A1 (hold the control key down and press the Home key at the same time).
Like the Summing & Input sheet, these sheets are protected so you can’t change the column widths or row heights.
Next, it’s very important to always remember to keep an eye out for red error messages in the top of column BH. If the user makes an input error, this will most likely be spotted and reported once the program calculates. If there are any errors anywhere in column BH, then cell BH5 will display: Input Errors! This will be displayed in cell BH5 even if the errors are informational only (the error message will say Error? instead of Error! if it’s informational only).
Due to Excel limitations, error messages on asset sheets will begin as soon as you start your input. Ignore them and continue your input until you think your input is complete. Now read and deal with any remaining error messages. They will all go away when input is complete and proper.
It’s very important to stop what you’re doing and deal with all error messages the moment they occur. If you don’t, you could waste lots of time chasing your tail trying to find out why you didn’t get the results you expected.
Even though all twenty asset sheets are the same (except for ten being for each the oldest and youngest client), Oldest’s Asset #1 is where you most always will input the first asset with a market value. Although you can haphazardly enter assets anywhere in the program, it will save time and effort to start with Oldest’s Asset #1, enter the oldest client’s second asset into Oldest’s Asset #2, etc. If the oldest client only has two assets, and the youngest client only has one, then Oldest’s Asset #3-10, and Youngest’s Asset #2-10, should not have anything input into them.
It’s also important to always enter the non-jointly owned oldest client’s assets into the Oldest’s Asset sheets, and the non-jointly owned youngest client’s assets into the Youngest’s Asset sheets. Jointly held assets can be entered into either, but try to enter them last to help keep your data organized.
Notice the information in rows 1 & 3 on the asset sheets. The text in row 1 will change when you start inputting asset data into cell A5. The text in row 3 comes from information input on the Summing & Input sheet. It will save you time and effort to pay attention to this data when you’re using the asset sheets.
Inputting proposed data into a current version is one of the mistakes we make the most. This is why this is there, in cell AO3, and you can use the Read Only mode of opening the program.
Also, if there is no youngest client’s first name entered in cell A4 of the Summing & Input sheet (or A6 on the Master Input sheet for Dual RWR), all of the text in all of the Youngest’s Clients Asset sheets will be blank. You cannot use these ten assets if there is only one client (you can, but you will get errors).
BASIC ASSET INPUT
Now let’s input data into Oldest’s Asset #1. Start with cell A4 (or A122 on the Master Input sheet for Dual RWR). If this asset is jointly owned (any kind of joint ownership - community property, TIC, JTROS, etc.), then you’ll probably want to enter a “J” into cell A4. This will eradicate the client’s first name from showing up in row 1 of that asset sheet, and where the asset is listed on the Asset & Misc. Summaries sheet. Use the delete key to delete all stray characters from cell A4 if you want this asset to appear as being individually owned. Cell A4 only accepts blank
Copyright 1997 - 2009 Toolsformoney.com, All Rights Reserved Page 26 of 60
REAL WORLD RETIREMENT
spaces and “J,” so if you enter any stray characters in cell A4, you will get an error message. All this does is change this text, no calculations are affected.
Enter the name of the investment asset into cell A5. Don’t worry if the name is too long to fit into cell A5. As long as it’s not too big where it shows up on the Asset & Misc. Summaries page, you can make it as long as you want to.
Notice (after calculation) that the investment name in row 1 changed to help you keep things straight. Also notice that the text in cell B5 changed from “<= Input Asset name” to just “<= Asset Name.” This type of user guidance occurs throughout the program, and it will save you time and effort to let these text changes help guide your input.
Next, enter either the investment’s current market value, or the guesstimated future market value in cell A6 (or A124 on the Master Input sheet for Dual RWR). For example, a mutual fund that the client current owns that’s worth $250,000 would be input as $250,000. And if the client is expecting to get control of an investment in a future year, then input the investment’s value in that future year. For example, if the client were expecting an inheritance of $25,000 nine years from now, then you would still enter $25,000 in cell A6.
If an investment has a liability associated with it, like investment margin, then just subtract the liability from the market value. For example, if you have a stock portfolio that can be sold today for $50,000, but you owe $10,000 margin, then input its value today as $40,000. You can compensate for the leverage by using high rates of return in column C until the loan is paid off.
The only time that you would leave cell A6 blank, or enter $0, is when this investment currently does not have a market value, and you plan to make contributions to this investment either in the current year, or any year in the future. In this scenario, the investment would “come alive” when the contributions started.
Next, enter the client’s age the investment will become effective into cell A7. Each investment has its own effective age. This allows the user to start an investment’s life at any year. For example, if a client is expecting an inheritance when they’re 70, you can start the investment’s life in the year they are 70, when they’re only 60 now.
This program does not go back in time, so if you enter a starting age that’s earlier than their current age, you will get an error message. The age you enter here is the age when the investment’s market value you entered into cell A6 will become effective, and will start to be used in the program’s calculations. You can use any age you want, even if it’s past the client’s retirement age, as long as you don’t enter an age that is earlier than their current age.
Next, enter the age when this investment will start to produce, generate, or “pay out” income to be spent or reinvested into a Flexible Asset (explained later) into cell A8. The program will then use the payout method you selected and start paying out income at this age.
If you chose payout method 4 or 5, you will get an error message if there are any characters in cell A8. This is because method 4 is programmed to only start paying out at age 70, and retirement withdrawal method 5 does not use a structured payout method. If you get this error message, then delete all characters from cell A8.
Next, enter the annual rate of return this investment will grow at, into cell A9 (or A126 on the Master Input sheet for Dual RWR). This annually compounding growth rate is applied to the investment after all contributions and withdrawals are added or subtracted. This rate of return is automatically applied to the investment at every year, unless it is manually overridden, as discussed later.
For example (see demo), say your client has something that has an erratic rate of return - Gold in this case in the demo’s Oldest Asset #1. You would input this data using the rate of return manual override column (column C) in conjunction with the withdrawal manual override column (column BC on Dual RWR and BF on single RWR).
Copyright 1997 - 2009 Toolsformoney.com, All Rights Reserved Page 27 of 60
REAL WORLD RETIREMENT
Next, enter the percentage amount of this retirement income that will be subject to the overall average tax rate you specified on cell A10 of the Summary & Input sheet. If you enter 100%, then all of the income withdrawals will have income taxes taken out at the rate specified. If you enter 0%, then none of these withdrawals will have taxes deducted from them. If you enter 50% into cell A10, then 50% of the income paid out will be taxed at the rate you entered in cell E8 of the Summing & Input sheet (or whatever the manual override rate is in that year).
Note that taxes will be deducted from all withdrawals, not just what you may consider to be “income,” because any time money is taken from an investment as a result of a normal payout option (discussed later), it’s considered an income withdrawal by the program. A simple way to remember it is that all of the income generated from all of the blue colored cells (on the Summing & Input sheet, columns CM - DF) will be subject to taxes at the rate you specify into cell A10 (or A128 on the Master Input sheet).
Withdrawals that came from the manual withdrawal column (BC or BF) are different. Cell A11 is where you control the tax inclusion rate only for the manual income withdrawals. This gives you the power to tax income from an investment at two different rates. For example, to account for interest and principal payments on an individual bond.
To simulate depleting non-tax-qualified assets before tax-qualified assets (to simulate tax advantages by keeping IRAs intact as long as possible): Just set the age qualified assets will begin to pay out at the age the non-qualified assets are depleted. You can determine this age by setting the qualified assets to pay out using method #5, and then set the non-qualified assets all to #6, and seeing when they deplete. Then start the tax-qualified assets to start paying out the next year (and change the payout method back to Flexible).
CONTRIBUTIONS TO ASSETS
You have total control over annual monthly contributions to each retirement investment asset. When you input the amount of monthly contributions into cell A12 (or A130 on the Master Input sheet for Dual RWR), these amounts are multiplied by 12, and then added to the investment’s balance. Then the growth (or loss) rate is applied.
Using the monthly contribution manual override column, you can control contributions to the asset on a year-by-year basis every year in the 70-year window. Amounts entered into this manual override column really are overrides - meaning they wipe out the current year’s automatically generated contribution number for that year.
Start by determining how much will be added to the investment over the whole first year. Then divide this amount by twelve to get an average. This input cell asks for a monthly amount because most people think in terms of adding monthly amounts to investments like 401(k) plans. Monthly contributions cannot be negative or you will get a real error message. Also, if they are $5,000 or more, you will get an informational only error message. All contributions are after tax just as if the client wrote a check to a mutual fund family.
Next, enter the rate of annual increases in the monthly contributions into cell A13 (or A131 on the Master Input sheet for Dual RWR). This input grows the annual contributions by the amount you enter. For example, if your client is having 10% of their pre-tax income going to a 401(k) plan, and they expect to get an average 2% raise every year until they retire, then their contributions (made monthly) will be increasing at a 2% annual rate because of their 2% annual pay increase. If the amount you enter is 6% or over, you will get an informational error message (because it’s rare).
Next, enter the client’s age when the first monthly contribution will be made into cell A14 (or A132 on the Master Input sheet for Dual RWR). This can be any year, even after retirement has begun, as long as it’s not earlier than the client’s current age, or earlier than the investment’s effective age. If you’re a detail person, here’s an example: Assume the client has a 401(k) plan they’ll be eligible for in September next year. Currently, the investment called
Copyright 1997 - 2009 Toolsformoney.com, All Rights Reserved Page 28 of 60
REAL WORLD RETIREMENT
“401(k)” has no market value because it doesn’t exist yet. This investment will then be “brought to life” by making future contributions to it.
The images below show how you would input this asset with the following assumptions: The client plans to start contributing 5% of his $5,000 monthly salary (it’s $5,000 in year 2) starting next September to the company 401(k) plan, and expects to get raises of 2% every year until retirement.
5% of a $5,000 monthly salary would be $250 per month, so the total first year’s contributions would only be $1,000 because they didn’t start until September. You would divide $1,000 by 12 to get an average monthly contribution of $83 for that year (enter =1000/12 into cell F26), and enter that amount into the manual override column:
Here’s how the numbers would look after you figured the Manual Override amount:
Copyright 1997 - 2009 Toolsformoney.com, All Rights Reserved Page 29 of 60
REAL WORLD RETIREMENT
How to account for 401(k) employer matches: Input the total amount of contributions (both yours and the employers).
Next, enter the client’s age when these contributions will end into cell A15. Most of the time the correct way to input this is to use one year less than the age that the client will retire. For example, if the client retires at 60, you would want to set the last year of contributions to be age 59 (see the two graphics above). You are able to continue contributing to the asset after the client’s retirement age (but not past age 69 if you use payout method #4). However, if you do, you’ll get an informational error message. You’ll get a real error message if you enter the last year at an age earlier than the starting year, earlier than the client’s current age, or the earlier than the effective age of the asset.
REAL WORLD ASSET PAYOUTS
Each of the twenty assets has ten payout methods to simulate, as closely as possible, life in the Real World. “Payout” means how a financial asset pays out income for someone to spend (AKA retirement income withdrawals). This income can come from combinations of interest, dividends, capital gains, and return of principal.
Payout methods 1-4 & 6-10 can be used simultaneously with payout method #5 - the manual withdrawal column. If you choose payout method #5, you cannot use any other payout method with that asset.
Except for the Flexible Assets (explained later), all assets work independently of all of the other assets. This means you can do anything you want with the way an individual asset pays out income, regardless of how the other assets are set up. A Flexible Asset is just one, or more, of the assets using payout method #6.
Asset payout methods are explained below. To select one, just enter the corresponding number into cell A16 (or A134 on the Master Input sheet for Dual RWR) on that asset sheet. After selecting the payout method, look at cell
Copyright 1997 - 2009 Toolsformoney.com, All Rights Reserved Page 30 of 60
REAL WORLD RETIREMENT
B27, and A17, to see if that payout method requires additional input into cell A27 (or A145 on Master Input for Dual RWR).
THE TEN ASSET PAYOUT METHODS
1) Lump Sum: 100% of the investment’s balance is paid out as a lump sum at any year specified (whether retired or not, or way past the age retirement has already started). You can also control how much is taxed, and tax rates can be different in the two payout phases (manual withdrawals and then lump sum). You can still use the manual withdrawal column BF (BC on Dual RWR) to take out amounts before the 100% lump sum year, but you can’t use it on the same year, nor afterwards. If you attempt to do this, it will ignore any amount you enter into the manual withdrawal column and will not give you an error message.
If you want to divide the lump sum into two parts to tax them differently, then figure it out and do it manually.
Here’s the answer to many support questions regarding taxation of non-qualified plans: First, divide the lump sum into two parts and tax them differently. For example, assume you have a $100,000 non-qualified mutual fund that’s 50% basis and 50% unrealized capital gains (you paid $50,000 lump sum for it, and now it’s worth $100,000). The capital gains tax rates is 20%. Assume this is going to be depleted in ten years. Also assume a 15% marginal income tax bracket.
Enter ~12% into cell A156. We got that by first figuring the amount that’s going to be taxed for the currently unrealized capital gains, which is $50,000 x 20% = $10,000 (all will be realized over the next ten years). Then assume, because of interest and dividends paid, that $10,000 will be taxed over its distribution lifetime at average ordinary income rates of 15%. So that’s $10,000 x 15% = $1,500. So total taxes paid over this asset’s life are around $11,500, or ~12%. As you can see, inputting 12% vs. 15% is going to end up making an insignificant difference to overall both cash flow and net worth, so don’t get all frustrated over this. It doesn’t matter too much. Just guess in the 15% to 25% range. Whatever you input will end up being wrong compared to what actually happened anyway.
2) Yield Only: The biggest use for this is when you want to keep the principal intact forever. It has more uses than that, as explained below. For example, to account for CDs or individual bonds in the Real World, you can account for just the income, and then use the manual withdrawal column to lump sum maturity proceeds. You can also simulate any number of individual CDs or bonds maturing on different years by using the withdrawal manual override column in conjunction with the investment’s rate of return manual override column. You can also account for some maturing while others are reinvested. Here you would enter the total market value of all of the bonds into cell A6 (or an investment market value cell like A124 on Dual RWR). Then manually determine the interest rate every year by taking a weighted average, and enter this rate into the rate of return manual override column for that year. Then use the manual withdrawal column and enter the individual maturity proceeds until all the bonds have matured. If you want to get real fancy with fluctuating principal (e.g., bonds that self-destruct like GNMAs) you can use the rate of return manual override column to make the market values what you want in every year.
Another use of this payout option is simulating investments like bond mutual funds by assuming a total return of 7%, taking out 6% interest income, and having the principal grow by some small amount. Or slowly deplete it by taking out 7% and growing it at 6%. And municipal bonds, or funds, can be simulated by setting the amount taxable input field (cell A10 or an asset tax rate cell like A128 on Dual RWR) to 0%. If there’s a capital gain to pay when it’s sold or matured; enter a tax inclusion rate into cell A11 (or an investment tax rate cell like A129 on Dual RWR). Or the tax rate on any mix of state and federally taxable scenarios can be run too. You basically have control over most any bond scenario with this payout option. Note: Income generated by investments before retirement (payout age) is assumed to be spent, so it’s not reinvested, accounted for, nor taxed anywhere.
3) Inflation Adjusted Income Stream Generator: This method automatically answers the question, “What’s the most money I can take out of this investment every year, have this income stream keep up with inflation every year,
Copyright 1997 - 2009 Toolsformoney.com, All Rights Reserved Page 31 of 60
REAL WORLD RETIREMENT
and have it last until age 100?” All you do is enter a 3 into cell A16 (or an asset payout cell like A134 on Dual RWR), then the age when you want the investment to be depleted into cell A27 (or the extra input cell like A145 on Dual RWR). Everything else is automatic. You should check the numbers on the asset sheet, as some combinations of returns and depletion ages will result in the asset not depleting in the exact year. You can play with the rate of returns and depletion ages to get the results you want. You can still use the manual income withdrawal column before the payout starts. This retirement income distribution method is also known as calculating a systematic withdrawal plan.
4) IRS Required Age 70 & 1/2 Minimum Distributions: It only does it starting at age 70, and it only uses the recalculation with single life method. The joint methods are near impossible to program (and few investors care). The following terms all mean the same things: MDIB (Minimum Distribution Incidental Benefit), RMD (Required Minimum Distributions), or MRD (Minimum Required Distribution).
This payout method estimates these amounts. RWR will estimate the annual minimum amounts that need to be withdrawn from a tax-qualified plan, like IRAs and 401(k)s. You can still use the income withdrawal manual override column at any age too, so you can tap into it when it's needed, and then have it go back to paying the required minimum distributions.
5) Specific Amounts: This method just disables all of the other nine payout methods, so that only manual withdrawals using the manual income withdrawal column will work. This is at column BF starting at row 29 (BC on Dual RWR).
In other words, you have to manually enter retirement income payout withdrawals in each year by inputting the year-by-year manual withdrawal amounts. Then the retirement software forces that much net income into the picture. If there's a surplus over what's needed, it's added back pro-rata to the Flexible Assets.
Taxes have an independent percent taxable input field located at cell A11 (or an asset tax rate cell like A129 on Dual RWR). The tax rate you specified in cell A10 (or an asset tax rate cell like A128 on Dual RWR) will be ignored.
If you enter a number that is larger than the amount of the investment’s beginning of the year balance, only the beginning of the year’s balance will be used as income, and you will not get an error message.
Numbers entered into this column do not override the normal payout amounts - they are added to them, so they are not manual overrides like in most other similar input fields. It’s just a way of being able to take out more if you want to.
6) Flexible Asset: A Flexible Asset is an investment that does not have a structured payout option (1 - 4 or 7 - 10) assigned to it by the user. This makes this Real World asset behave very differently than the others. It’s an easy way to just let the retirement software figure everything out based on what's needed. A Flexible Asset is different because it’s the only payout method that frees the investment to pay income to fund the netted cash flow deficits in each year that remain after all income from the Summing & Input sheet, and investments with other structured payout methods, have paid out. It basically funds whatever is needed to reach the client’s income goals after everything else has paid out.
If there is more than one Flexible Asset, then income distributions from all of them occur simultaneously, and are calculated on a pro-rata basis, according to size (the previous year’s end-of-year value).
Flexible Assets can also accept income surpluses in years when there is a surplus. These surpluses get added back to the Flexible Asset’s market value so they can grow until needed in the future to pay out retirement income. They only accept surpluses on or after the year that you make it available to payout income (cell A8 or an asset payout age cell
Copyright 1997 - 2009 Toolsformoney.com, All Rights Reserved Page 32 of 60
REAL WORLD RETIREMENT
like A126 on Dual RWR). In order to get a Flexible Asset to accept surpluses, it must have a current balance in the year of the surplus. If not, it won’t work. To get around this, make a new Flexible Asset with a $1 beginning balance becoming effective in the year before the year that the surplus(es) start. Accounting for surpluses is important, so make sure they are increasing the account balance by looking at column E. Taxes that may have been taken out of an asset that generated the surplus, are not added back.
All of this Flexible Asset stuff is very important in orchestrating the whole plan into balance to simulate life in the real world. There should always be at least one Flexible Asset in the retirement plan to properly design a plan that will simulate retirement in the real world! This is the #1 support question.
7) Single Life Fixed Annuity: This withdrawal method trades the investment’s market value in for a permanent income stream. This income stream most resembles a single life annuity (or old-style defined pension plan). The income stream does not inflate, it wipes out the asset’s market (principal) value when it starts to pay out, it pays out until death, and cannot be altered once it begins. It basically allows you to simulate what will happen in the Real World if you were to annuitize a fixed-rate annuity via an insurance company, without inflation/cost of living benefits.
Note: The asset’s market value is supposed to vanish when the income stream starts - so this is not a program error.
There are no options for doing any kind of joint & survivor or term certains. On the bright side, unlike other programs where you have to manually enter annuity rates every year to simulate annuities, RWR just gets the income stream into the ballpark (without having to enter hundreds of numbers every year from annuity tables). If you really want to use exact numbers from tables, you’ll need to get the amounts from somewhere else (like the insurance company that holds the annuity) and enter them manually using payout method #5 (or the pension input area).
8) Inherited IRA or IRS Rule 72(t) Governing Pre-Age-59 ½ Tax-Qualified Plan Distributions: What? To sum this long story up, if you have a tax-qualified plan (e.g., IRA), the IRS has rules to make sure people pay the taxes that they saved during the accumulation phase. There are also rules saying that if you take money out of an IRA before you turn age 59 ½, then you have to pay a 10% premature distribution tax (in addition to ordinary income tax).
In 2002, the IRS realized the error of its ways, and made exceptions to these rules in Section 72 of the code. Part “t” makes exceptions to receiving these premature distributions, because many people are already retired at ages before 59. Also, people that have inherited IRAs may need the money now.
Read the IRS page that describes how to avoid IRA premature penalties by using 72(t) distributions here. You can tap your IRA without paying penalties, and other tax-qualified assets, before you turn 60, as long as you use what the IRS calls, "A substantially equal series of payments lasting until life expectancy." There are three ways to avoid the 10% penalty tax in section 72(t). The three methods are not the only ways to qualify for these exceptions. All the IRS cares about is that you are receiving “substantially equal periodic payments” from the IRA, and thus are paying taxes on this income. Payout method #3 is also a way to do this (but don’t use it before getting advice from a tax pro!).
Payout method #8 uses the same calculations used for Inherited IRA distributions and the 72(t) method called Life Expectancy (except it can start earlier than 70). The end of the last year’s balance is divided by the life expectancy of the owner. These life expectancy numbers go down every year, so the required payments escalate to the point that all of the IRA is distributed over the person’s lifetime (assuming that they live until life expectancy). Of the three methods of doing 72(t), this method will result in the lowest annual required minimum distributions from the IRA.
9) IRS Rule 72(t) Governing Pre-Age-59 ½ Tax-Qualified Plan Distributions Using the Fixed Amortization Method: The same story applies as above, but the formula is different. A time value of money formula is used, using
Copyright 1997 - 2009 Toolsformoney.com, All Rights Reserved Page 33 of 60
life expectancy numbers, end of the last year’s balance, and an assumed interest rate. This method will result in the highest annual distributions.
10) IRS Rule 72(t) Governing Pre-Age-59 ½ Tax-Qualified Plan Distributions Using the Annuitization Method: The same story as above. This method uses an actuarially determined annuity factor, so be careful! You can get examples from the IRA website: http://irs.gov This method produces about the same annual distributions as payout method #9, but are just a little less. This is the least popular method.
CHANGING ASSET PAYOUT OPTIONS MIDSTREAM
If you didn’t use all of the assets already, you have the ability to change an investment’s payout option after it has already started to pay out retirement income.
To do this, first use the manual income withdrawal column and lump sum the asset’s total balance in the year that you want to make the switch. Ensure it’s taxed correctly too (obviously you’ll have a tax conflict if you’ve already used the tax rate on manual withdrawals). This will effectively terminate that asset. In other words, take the year’s beginning balance, and then enter that amount into column BF (BC on Dual RWR).
Next, make a new asset starting in the same year that you lump summed the proceeds of the old asset.
Then make the first year’s market value whatever the old asset’s market value was lump summed out at. Don’t forget to subtract any taxes that were due and vanished. You can see what the after-tax amount is on the Summing & Input sheet, columns CM to DF. These amounts are monthly, so you’ll have to multiply by twelve to get the total amount needed to input into the new investment’s beginning balance input field. If you want to not have any taxes cloud the picture, just set the tax rate to be zero in cell A11 (or A128 on the Master Input sheet for Dual RWR).
Next, use one of the manual income or expense input areas on the Summing & Input sheet to account for the “expense” of giving birth to the new asset. If you don’t, you’ll have the lump sum payout come out as income, and then a new asset appearing out of thin air. You’ll need to account for the “expense” of this new asset starting somewhere to offset this lump sum’s “income.” Use the same after-tax amount arrived at in the paragraph above.
Another minor glitch is that you’ll have another, or extra, asset listed on the Asset & Misc. Summaries page. But remember, you can just edit the name of this asset directly, delete or hide that row, or do anything you want to make it print right. You have then effectively changed the asset’s payout method by killing one asset and giving birth to another.
THE PRESENTATION SHEETS
Starting from the right, the first left six sheets of the workbook are where the results are, and they are designed to be presented to clients and prospects. There are a total of six presentation sheets - five text/number pages and one graph/chart sheet. They’re called presentation pages because they are the pages a financial planner would present to a client or prospect (even though they don’t say presentation on the sheet tabs). Sometimes, actual asset sheets are printed and presented too. Each individual asset has its own end-of-year balance column that shows each asset’s end-of-year balance after contributions/withdrawals are considered with annual compounding. Each asset sheet also shows all of the asset’s cash flows over the 70 years. So there is a lot of useful “nerdy” information on the asset pages, just not a lot of “salesy” information. It’s up to you whether or not you want to print and present the asset sheets.
One of the advantages of the program being written in Excel is that the user if free to do just about anything they want to with the presentation sheets, as well as the blank left-most Presentation sheet.
Copyright 1997 - 2009 Toolsformoney.com, All Rights Reserved Page 34 of 60
The text “Financial Independence Analysis” is just text (there is no formula involved), so you can alter it without having to worry about wiping out a formula.You’ll probably want to edit the footer by going to View, Header & Footer, Custom Footer
Warning: None of the presentation pages are “protected,” so if you tinker with something on a presentation page and destroy a formula on the main template, you won’t get any support to fix it if you’re an unsupported user. It’s best not to make any changes on the main template unless you’re sure you know what you’re doing! Click “Yes” to the “Read Only” question when you open the Workbook.
PRINTING THE PRESENTATION PAGES
Because of all of the information on most of these sheets, you can’t just click print and have it print well. Some of the sheets are pre-formatted to print well after minor tinkering with row and column sizes. But you may have to use the print range procedure to print things like asset sheets. Detailed instructions on how to do that are on the site here: http://www.toolsformoney.com/printing_in_excel.htm
Important! Here’s a tip to save you lots of time and trouble: Before you start printing reports using real client data, you’ll want to first format the presentation pages, and the asset sheets, to print right on your printer. Excel being what it is, the way the sheets print will depend on what kind of printer you have. Here is how to do this:
1) Open the program, but this time click on No when the Read-Only dialog box appears. You want to make changes to the template this time.
2) Print all of the sheets you plan to print. Use Print Preview first to save paper.
3) Tinker with the row and column widths, page setup margins, etc. until all of the sheets print exactly the way you like them to. Do not tinker with anything else that you do not want to save on the template.
4) Exit the program.
5) Answer Yes when the save dialog box appear to save the formatting changes you made to the template.
The pages will print the way you want them to until you make and save changes again to the main template.
ABOUT THE ASSUMPTIONS & ADDITIONAL NEED SHEET
CLIENT NAMES
First, the names on row 2. The general format of the way the names will be displayed on the reports as follows:
Oldest client’s first name & Youngest client’s first name Last name
These names came from cells A2 - A4 of the Summing & Input sheet (or A4 – A6 on the Master Input sheet for Dual RWR). Since it’s in Excel, you can manually change the names to anything you want just by entering new data into cell A2 of the Assumptions & Additional Need page.
Warning! Only enter data into these cells on a presentation sheet that you intend to save under a specific client. Do not enter data into these cells on the main template, as this will wipe out the formulas. If you do wipe it out and need to get it back, refer to another copy of the program to copy them back. Unsupported users won’t get technical support for wiping out formulas in unprotected cells.
Copyright 1997 - 2009 Toolsformoney.com, All Rights Reserved Page 35 of 60
The following are examples of some name combinations that will work with the automatic name input areas:
Mr. & Mrs. Sample
Dr. & Mrs. Sample
Dr. John Sample & Mrs. Sample (enter Dr. John Sample into the oldest client’s first name, Mrs. Sample into the youngest client’s first name, and a space into the last name field)
John Sample & Mary Jones (enter John Sample into the oldest client’s first name, Mary Jones into the youngest client’s first name, and a space into the last name field)
John Sample & Mary Lee-Jones (enter John Sample into the oldest client’s first name, Mary Lee-Jones into the youngest client’s first name, and a space into the last name field)
FINANCIAL INDEPENDENCE ANALYSIS, CURRENT VS. PROPOSED, AND THE DATE ON THE ASSUMPTIONS & ADDITIONAL NEED PAGE
The text, Illustration for Current Plan (before recommendations) -or- Proposed Plan, comes from a formula and will appear depending on your input into cell E2 on the Summing & Input sheet (this doesn’t apply to Dual RWR).
The date in the report header comes from your input into cell A6 on the Summing & Input sheet (or A8 on the Master Input sheet for Dual RWR). You can alter any of this text by just reformatting or manually entering data into the cells which contain these formulas.
INCOME GOALS
The income goal text on the Assumptions & Additional Need sheet changes depending on your input. If you use separate income goals (where both the oldest and the youngest have an income goal that occur on different years), then the oldest client’s income goal will appear in row 14, and the youngest’s will appear in row 16.
When there is only one client, the income goal text on row 16 disappears. If there are two clients, and you only use one income goal (if you chose to leave the youngest client’s goal blank for whatever reason) then only the oldest client’s income goal will appear on row 14. Row 14’s text will also change to say “Combined.”
If both clients’ income goals start on the same year, and you entered the same amounts in each input fields, then both oldest’s and youngest’s numbers will be added together and row 14’s text will change to say, “Combined.”
CLIENT CURRENT AGES AND RETIREMENT AGES
Client current ages are automatically calculated when you enter the current year and the age of birth of each client (the current year is just subtracted from the client’s year of birth). If the current ages are not what you want to show, you can either change the inputted year of birth on the Summing & Input sheet, the current year on the Summing & Input sheet, or manually change cells E14 or E16 on the Assumptions & Additional Need page. Changing years or ages on the Summing & Input sheet or Master Input sheet will effect calculations and results.
Retirement ages are just referenced from the Summing & Input sheet. Be careful if you manually edit this on the presentation page because not only will you overwrite the formula, you could be also presenting incorrect data.
Copyright 1997 - 2009 Toolsformoney.com, All Rights Reserved Page 36 of 60
REAL WORLD RETIREMENT
The life expectancy numbers, shown in cells G14 & G17 are from IRS Unisex mortality tables. Tip: If you see mortality tables that have separate life expectancies for males and females, then it’s very old and should not used.
INCOME GOAL INFLATION
The income goal inflation rate number showing on the Assumptions & Additional Need sheet is the average over the next 30 years. If you’d like to know more about this, please refer to the previous section that discusses inputting the income goal inflation rates. There is also a quick summary of your input on the footnote.
OVERALL INCOME TAX RATE AND SOCIAL SECURITY INCLUSION RATE
These are just the rates you entered for taxes in cells E8 and E22 on the Summing & Input sheet.
ADDITIONAL FUNDING NEEDS
This section is explained on page 13. Basically, this is the amount of additional funding required for the clients’ to achieve their stated income goal objectives. They can either choose to fund the deficits on a lump sum basis OR by making equal monthly payments until the year that the first client retires.
These amounts are how much more money needs to be invested to reach their income goals. This is in addition to everything you have already entered into the program. This number is the amount of additional capital needed now, not at retirement.
Except for the three cells with numbers (formulas in B35), this area is just text, so you can alter it any way you like.
ABOUT THE ASSET & MISC. SUMMARIES PAGE
This sheet summarizes your input for the assets, Social Security, earned and pension income, and most all of the other details of input entered into the Summing & Input sheet.
ASSET SUMMARY: ASSET NAMES (COLUMN A)
The order of the asset listing is as follows:
Oldest’s Asset #1Youngest’s Asset #1Oldest’s Asset #2Youngest’s Asset #2Oldest’s Asset #3Youngest’s Asset #3Oldest’s Asset #4Youngest’s Asset #4Oldest’s Asset #5Youngest’s Asset #5Etc. down to asset #10 on single RWR
If assets are not input in this exact order, there will be blank rows where the empty assets are. For example, if you used Oldest’s Assets #1 - 4, and only Youngest’s #1, there will be blank rows where Oldest’s Assets #5 and Youngest’s Asset #2 - 3 would have been if you had used them. You can delete these blank rows, but we recommend
Copyright 1997 - 2009 Toolsformoney.com, All Rights Reserved Page 37 of 60
REAL WORLD RETIREMENT
just hiding them so there won’t be blank rows when you print, and you can use them later. If you delete them, and then use them later, you’ll be confused about why they’re not showing up.
The investment names that appear are exactly how you typed them in on the asset pages. This is where it matters if the name is too long (not where you type them in on the asset sheets). You can call an investment anything you want to, and even have duplicate names.
ASSET SUMMARY: CURRENT ASSET VALUE (COLUMN C)
The investment’s market value that appears here is the number you typed in as the investment’s current, or future, value on cell A6 of the asset sheets. If you are bringing an investment to life in a future year, then text should appear after the investment’s name showing what year it starts. You may have to make column A bigger to see this text.
ASSET SUMMARY: ASSET ANNUAL ADDITIONS
The annual additions that appear here are the monthly contributions that you entered into cell A12 of the asset sheets, multiplied by 12.
ASSET SUMMARY: AGE WHEN ADDITIONS BEGIN
The ages that appear here are the ages that you input into cell A14 of the asset sheets (or A132 on the Master Input sheet for Dual RWR).
ASSET SUMMARY: AGE WHEN PAYOUT BEGINS
The ages that appear here are the ages that you input into cell A8 of the asset sheets.
ASSET SUMMARY: PAYOUT METHOD
The payout method that you selected for each investment appears here. If the payout method is Lump Sum, then the age of lump sum payout will appear here too.
ASSET SUMMARY: THE FIRST NOTE (CELL B50 OR B30 ON DUAL RWR)
The first part of the note below the asset summary mentions what you should do if an asset has $0 in cell A6 of the asset sheet for market value, and $0 in cell A12 for monthly contribution. How could this happen? When the investment is brought to life by monthly contributions using the manual override column. In this scenario, both the numbers in the asset summary will be $0. You have 2 options here: 1) Enter data into that asset summary cell to show whatever amount you want to show (this will wipe out the formula, so be sure not to do it on the main template), or 2) print the asset sheet that shows how contributions are made to bring the investment to life to show to the client (if they care). You can always not use the manual override column, or you can change this text on this page, too.
NON-ASSET INCOME SUMMARY: SOURCES OF INCOME
This section starting in row 59 (or 39 on Dual RWR) lists the “non-asset” incomes, if any were entered, into any of the four automatic input areas of the Summing & Input sheet. If you used Social Security, earned income, or pension areas, these entries will be summarized here. The order of these incomes are as follows:
Oldest’s Social Security then Youngest’s Social SecurityOldest’s Earned Income then Youngest’s Earned IncomeOldest’s First Pension then Youngest’s First PensionOldest’s Second Pension then Youngest’s Second Pension
Copyright 1997 - 2009 Toolsformoney.com, All Rights Reserved Page 38 of 60
REAL WORLD RETIREMENT
If these incomes are not entered in this exact order, there will be blank rows where the empty ones are (just like the assets above). These can easily be hidden before printing.
The words “Earned Income” are automatically generated and added to whatever text you input into the earned income or pension areas. The oldest or youngest clients’ names are also automatically generated and added to this text too. The word “Pension” does not automatically show, however. You’ll need to type the work pension into the name of the pension on the Summing & Input sheet.
Earned income manual override amounts are not shown on this page.
NON-ASSET INCOME SUMMARY: ANNUAL PRETAX INCOME (COLUMN E)
The amounts shown are the first year’s monthly numbers you entered into the input areas, multiplied by 12. If you input “Y” for this income to be taxed, then this is ignored here.
NON-ASSET INCOME SUMMARY: BEGINNING AND ENDING AGES
The ages that appear here are the ages that you entered into these input areas. The text “n/a” will appear under Social Security and pensions because these income streams do not have an ending value while the client is alive. If you want to show Social Security or pension income stopping at death, you can manually calculate these numbers, and then enter them into the income goal manual overrides. This technique can be used for anything, not just Social Security or pensions.
NON-ASSET INCOME SUMMARY: ASSUMED ANNUAL INFLATION RATE
The values that appear here are the numbers that you entered into these annual inflation input areas.
ABOUT THE ANNUAL SUMMARY NUMBERS SHEET
This sheet is broken up into two sections to allow for nicer-looking printouts.
This sheet summarizes all the important numbers every year in the 70-year window. It will display numbers for every year until you tell it to stop by entering the oldest’s client’s age in cell A13 of the Summary & Input sheet (or A15 on Dual RWR).
Column B will be blank if there is only one client. You’ll probably want to hide this column to make it look better.
Column L (Annual Income Surplus or Deficit) has a “feature” that some like, and some don’t and wish to change. The formulas turn all annual surpluses/deficits to $0 if they are less than $1,000. This is because numbers smaller than this are not very relevant, and just cause people to ask questions.
If you want to get rid of this entirely, you can edit the formula starting in cell L9 (don’t mess with cell L8 unless you know what you’re doing). Change it from:
To: ='Summing & Input'!$DP20*12 Then drag the formula down (repeat for the next page starting in row 47). If you want to change the formula to not show number less than $10,000 instead of $1,000, then just change the 1000 to 10000 and so on.
COMBINED ANNUAL INCOME GOAL (INFLATED)
Copyright 1997 - 2009 Toolsformoney.com, All Rights Reserved Page 39 of 60
REAL WORLD RETIREMENT
The Combined Annual Income Goal (inflated) column starts to display numbers, other than zeros, when the first client retires. These are inflated numbers, so it will not be the same as the income goal number that you entered on the Summing & Input sheet (unless the income goal inflation amounts are all set to 0%).
When the second client retires, their inflated income goal amount will be added to the first client’s income goal amount. This is what is meant by “combined.”
These numbers come from column CE on the Summary & Input sheet, so it does account for income goal manual overrides you entered.
ANNUAL AFTER-TAX MISC. INCOME AND/OR EXPENSE (-)
This column shows the annual incomes and expenses in all of the 14 input areas (8 automatic and 6 manual) on the Summing & Input sheet. The amounts from all 14 input areas, which display in detail for every year on the Income & Expense Detail sheet, are summed together each year and displayed.
If the total amount of the 14 input areas in a certain year is negative (meaning there are more expenses than income in that year), a negative sign will appear before the displayed amount in that year. These amounts are after taxes have been subtracted.
COMBINED ANNUAL SOCIAL SECURITY
This column shows both clients’ annual Social Security income, after any manual overrides. These amounts are net, or after taxes have been subtracted.
COMBINED ANNUAL EARNED INCOME
This column shows both clients’ annual earned income. These amounts are net, or after taxes have been subtracted.
COMBINED ANNUAL PENSION INCOME
This column shows both clients’ annual pension income. These amounts are net, or after taxes have been subtracted. Only amounts entered into the automatic pension income input areas will appear here. If you want the word “pension” to show up here, you’ll need to include it in those input fields (cells Summing & Input U&W3 & U&W9).
COMBINED ANNUAL ASSET INCOME
This column shows both clients’ after-tax annual income from all retirement investment assets.
COMBINED ANNUAL INCOME SURPLUS OR DEFICIT
This column displays the total value of cash flow surpluses and/or deficits in each year. This is the amount of income from all sources (all sources on the Summing & Input sheet, and all assets, including Flexible Assets), less the combined income goals. In other words, if all generated income is less than the combined income goal (and miscellaneous expenses), there will a deficit in that year. More money is being spent than generated, so the result is a deficit in that year.
This can happen even if there is money left in investments because you can set an asset’s payout to only pay a certain amount of income each year, regardless if that will result in deficits or not. Only the Flexible Assets will pay out
Copyright 1997 - 2009 Toolsformoney.com, All Rights Reserved Page 40 of 60
REAL WORLD RETIREMENT
enough money needed to fund all income needs. If there isn’t enough money in the Flexible Assets to do that, then deficits will appear. This is the #1 support issue - so please use Flexible Assets more and the other payout methods only if investments really will pay out that way in the Real World.
It will display a positive number when there is a surplus in that year. A surplus in that year happens when income generated from all sources other than assets (Social Security, earned income, etc.) are more than the combined income goal. Non-flexible assets, and everything input into the Summing & Input sheet, “force” income into the picture, so if more is forced in than spent, a surplus will occur. This amount is added back to the active Flexible Assets on a pro-rated basis (if there is a non-zero balance in them). The only way a surplus can display is if there are no Flexible Assets to absorb the surplus (this should never happen), or if there is a manual income withdrawal from a Flexible Asset that force in too much retirement income.
It will display a negative number when all of the twenty assets’ capital are depleted, and income generated from sources other than assets (Social Security, earned income, etc.) are less than the combined income goal.
PERCENT OF INCOME GOAL BEING MET
If one had enough assets, and set them up right so that they’d pay out income that always met expenses perfectly, then these numbers will always be 100%. If, however, there is not enough income to meet expenses, this number will be lower. This column displays the percentage of the combined annual income goal that is being funded. If the combined income goal is $100,000 in a particular year, and incomes and assets are generating only $75,000, then that’s year’s number will display around 75%. If there is more income being forced into the picture than is needed (a forced surplus), then the number will display more than 100%. Strive for making every number here be 100%.
END-OF-YEAR BALANCE OF CAPITAL
This column displays the total value of all investments at the end of each year. This value is after all withdrawals, contributions, and growth has been accounted for. The program just adds all end-of-year asset values together here.
You can use this column to create a comparison from what actually occurred, to what the plan projected: Insert two columns next to this one. Title one “Actual” and the other “Change from Actual.” In the Actual column, input the actual total end-of-year balances of capital. In the next column, use standard Excel formulas to calculate the percentage change in each year.
AVERAGE WEIGHTED RATE OF RETURN ON ASSETS
This column shows the average weighted rate of return for all retirement assets at the end of each year. Another way to look at it: It’s the weighted combined return of an investment portfolio comprised of all assets. In other words, this answers the question, “What’s the rate of return on my whole portfolio expected to be in every year from now, through retirement, and until I’m 100?” It basically figures out the rate of return on all of the investments every year, after all of the cash flows, then it weights them according to size, and gives an average.
Example: If there are only two assets - a $100,000 stock fund input at 10%, and a $100,000 money market input at 5%, the average weighted rate of return would be 7.5% as long as the ending market values were equal at year end. This works with any number of investments, but only on the Real World assets. In other words, the investments have to have market values and be entered into one of asset sheets to be accounted for here.
PERCENT CHANGE IN ASSET BALANCE FROM PREVIOUS YEAR
Copyright 1997 - 2009 Toolsformoney.com, All Rights Reserved Page 41 of 60
REAL WORLD RETIREMENT
This column shows the change in total portfolio value from year to year. Said differently, it tells you how much money was gained or lost, after all cash flows, and spending on the income goal. For example, say you have a $100,000 portfolio (all twenty assets combined are worth $100,000) at the end of one year. $X is spent, and then after considering growth on what’s’ left, the portfolio is worth $90,000. In this case, -10% would display because you have 10% less money this year than you did the previous year.
ANNUAL PRESENT VALUES OF ADDITIONAL CAPITAL NEEDED
The two Present Value of Additional Money Needed columns display these present values on an annual basis. These values are cumulative, so you don’t have to add them up to see the annual increases.
Numbers displayed are the amounts of more money, or capital, that is needed to fully fund the income goals only up until the year you’re looking at. This is in addition to generated income amounts that are already input into the retirement plan.
Each year’s values are the same as the total amount needed displayed on the Assumptions & Additional Need sheet. So you could have set the age at which the oldest person is assumed to pass away in cell A11 of the Summing & Input sheet, and the total amount of more money needed would be the same as what displays on the Assumptions & Additional Need sheet. This just makes it so you don’t have to do that if you wanted to see these numbers in future years (but you don’t get the additional needs in monthly payments needed until the age the first person retires).
First, the Present Value of Additional Money Needed at Retirement: These numbers display how much more money is needed at the year when the first person retires, to fund retirement through that particular age. For example, say the first person retires in 2020. The number in the column for 2030 is $200,000. That means you’ll need an additional $200,000 in 2020 to fund retirement only up until 2030. After 2030, you’ll run out of money and/or have annual cash flow deficits. Then you can run Goal Seek to see how much of a change is needed to fund only through 2030.
The Present Value of Additional Money Needed Now is what people are more used to seeing. Using the example above, in 2030 the present value of how much more money is needed now will be less, say around $125,000. So it displays how much more money is needed now to fund retirement only up until 2030.
ABOUT THE GRAPHS / CHARTS PAGE
There are a couple dozen graphs/charts to show most of the useful information visually. You can also modify them, and make as many more as you want to (if you have Excel 2007, otherwise RWR has reached its memory limit).
The text that follows tells how to manipulate the data and graphs to help get what you want. Do not delete, hide, or change the data to the right of the graphs (starting in column Z) as this is where the chart data comes from. To sort of hide this data to avoid confusion, the font color is white so you won’t see it. Just don’t do anything in the area to the right of the charts. Graphs can’t get data from hidden cells, so you can’t hide them. Use the far right Presentation sheet to be safer if you’re going to be making new additions.
The data from column U to column DD comes from mostly the Summing & Input sheet (as you can see by the formulas). Some come from the Tax sheet.
All of the numbers will stop showing up in the year that you input the oldest’s person’s estimated life expectancy in cell A13 of the Summing & Input sheet (or A15 of the Master Input sheet of Dual RWR).For printing graphs, use Print Preview, and then tell it to print only the pages with the charts you want. If you just click Print, then a million useless pages will print out from the hidden chart data to the right. If you click on, and
Copyright 1997 - 2009 Toolsformoney.com, All Rights Reserved Page 42 of 60
REAL WORLD RETIREMENT
select, a graph before you click Print, then just that one graph will fill one printed page. Tips for printing in Excel to get exactly what you want are here: http://www.toolsformoney.com/printing_in_excel.htm
The first graph shows the combined end-of-year market values vs. the inflated combined income need. In other words, it just takes the total asset market values and income goal numbers from the two columns on the Annual Summary Numbers sheet, and makes a simple graph. The graph is just meant to portray the year-by-year market values in comparison to the income goals. Its main function is to show the client that their income need increases steadily over time, and their assets (most likely in the current version) will deplete if they don’t follow your brilliant advice ASAP.
The older the clients are, the more blank space will show on the right inside of the graph. The graph is set up to show the whole 70-year window, but the older the clients are, the sooner the years run out (because the user tells the presentation pages when to stop showing numbers on cell A13 of the Summing & Input sheet, and the graph gets the numbers from this data). There are many more charts, and most are hopefully self-explanatory. If not, you can click on the graph’s insides and look at the formulas. This tells where the data is coming from. From there you can trace it back to its source to determine what it’s trying to display. They’ll most likely be in the chart data area on the same sheet. To see that, highlight all of those columns, right click menu, then choose Font, and change the color back to Automatic.
Unfortunately, graph titles are not able to come from cell values, so they are input manually into the graph’s properties. So if you want to change them, the place to do it is in the graphs themselves (right click in the middle of the graphs and choose, Chart Options).
How to change the number of years shown in the charts: If you don’t want to show a lot of blank space, or meaningless data, on the right side of the charts, you can edit the graph’s formulas directly. Click the blue area inside the chart, and then look to see if a long formula appears in the Formula Bar. If not, press the up or down arrow until the formula appears, and the end of it has this: “),1)” This “1” means you are on the first series of the chart - or the blue area, the Combined Income Goal. As you can see, the data is coming from two ranges from the Annual Summary Numbers sheet. There are two ranges because of the printing page break.
Go to this sheet, and determine which row has the year in which you want to display the last set of data. Let’s say it’s John’s age 95, which is row 64, and you want to end it at age 80. All you have to do is edit the formula, changing the 64 to be 49. Click on the right of the end of the formula, “),1)” Press the <= arrow until you can delete the first 64 and change it to 49. Now repeat until you’ve changed the second 64, in the middle of the formula. This part of the range is for showing ages. That’s it.
You can do the same thing with any chart, but first you’ll need to turn the font color back to black so you can see it, as explained above. The bottom line is that now that you know the basics of how chart graphs do their thing, you can easily edit them to make them look like you want them to.
ABOUT THE INCOME & EXPENSE - DETAIL PAGE
This sheet is also broken up into two sections to allow for nicer-looking printouts.
This sheet summarizes all 14 miscellaneous incomes and/or expenses in year in the 70-year window. It will capture all of your manual override amounts.
Copyright 1997 - 2009 Toolsformoney.com, All Rights Reserved Page 43 of 60
It’s important to keep in mind that all expenses need to have a minus (-) sign in front of them, or the program will think it’s income, and vice versa. If you see “John’s New Car” at $37,020 instead of -$37,020 then you just added $37,020 to their assets, plus bought them a new car for free.
You probably won’t use all 14 areas, so you’ll need to hide the blank columns and format the sheet to print nice. Column B will be blank if there is only one client. You’ll probably want to hide this column to make it look better.
If you see “ ’s ” in row six, then you forgot to delete some numbers somewhere in columns AZ through BL on the Summing & Input sheet, or you forgot to give that income/expense a name in columns AZ - BL, row 17.
It’s also important to remember that any numbers on this page are in addition to, or subtracted from, the normal inflated income goals. The only way to change an income goal number is to use the income manual override column.
HOW TO MAKE A “CURRENT” REPORT
In case all of this financial software stuff is new to you, a “Current” version is a report designed to estimate the clients’ financial situation as if they never met you, and continued just doing what they are doing now. The “Proposed” version is where the planning professional makes various changes to the clients’ situation in order to safely accumulate enough capital to reach their goals. You can look at current as the ”old” version, and proposed as the “new” version. The point is to compare two different scenarios, and it doesn’t really matter what it’s called.
All this is for pros that run reports for clients; if you are using this for yourself, then choose “Neither” in cell E2 of the Summing & Input sheet. This hides all of the current and proposed text.
Most of the time, clients are not able to reach their goals in the current version. Sometimes they can, and we just tell them so, and that makes them very happy. It’s our opinion that if the current version is meeting their goals, you should just tell them so. This doesn’t mean you can’t do anything for them! You still have the rest of financial planning and investment management yet to do.
Creating a current version is much easier than the proposed version. Creating a current version is simply inputting the data the clients gave to you during the fact finding process. After checking your input, you just print the presentation pages.
SAVING YOUR WORK
Unfortunately, Excel being what it is, the program doesn’t have a neat way to save just the inputted client data. So there are three equally painful methods of saving your work. With all three methods, you’re basically saving a workbook as you would any other spreadsheet.
A tip is that when you want to save work you did for a client, choose Save As…, and then go the Options menu to the right. Now turn off the Read-only feature. This way that won’t annoy you when you open it the next time. Please do not turn Read-only off for the main program though, because it’s too easy to make a change you don’t want to save.
Tips for organizing and saving client data are here: http://www.toolsformoney.com/filesave.doc
HOW TO MAKE A “PROPOSED” REPORT
Copyright 1997 - 2009 Toolsformoney.com, All Rights Reserved Page 44 of 60
Making a proposed report is when professionals have to do some work to earn their keep. There is much more work involved here than in making a current retirement plan. This is the report that you will present to clients that show all of the great ideas you came up with to help them reach their goals. Proposed is where the action is!
Most of the text on how to input, print, and save reports that was covered in previous sections, is redundant, and won’t be covered again here.
Hopefully, you did not close the program with a client’s current retirement plan data yet. If you did, open it back up. First, make sure you’ve saved the current version so you can retrieve it intact later if needed. Now save the workbook under a new file name that designates it as a proposed version and distinguishes it from the current version.
There are numerous techniques used to tweak a current version, that doesn’t meet the clients’ goals, into a proposed version that does. A few of the most common techniques are listed below. Each method, and any others that you want to use, can be used together. Most of our plans use all of the following techniques, and then some.
SOLVING FOR CLIENTS’ INCOME GOALS
This retirement software in a nutshell sums expenses and incomes in every year and then compares the net amount to the client’s income goals. It will not automatically solve for income goals. In other words, it will not compute how much income the clients can have given their assets, incomes, and expenses. Fortunately, it’s pretty easy to do.
You basically manually lower the income goal(s) on an iterative basis to find the most money (income) your clients’ investments can generate without depleting at a certain age. In other words, you plug in one income goal(s), look at the additional need section of the Assumptions & Additional Need sheet; and if it’s still not what you wanted (most likely $0 in additional need), lower the income goal(s), and try again. This only takes a few seconds.
METHOD #1: ADDITIONAL FUNDING
First, let’s talk about reaching a financial goal the old fashioned way - by investing more money.
The two most common ways to do this is either a lump sum or by additional periodic investments. Both the lump sum and the monthly amounts are found on the Assumptions & Additional Need sheet of the current version. Once you have determined the amounts needed, you have nine basic choices on how to proceed using method #1:
1) Enter the whole additional lump sum amount into a new asset.2) Enter the whole additional lump sum amount into existing assets.3) Enter some of the additional lump sum amount into existing assets, and some into a new asset.4) Enter the whole additional monthly amount into a new asset.5) Enter the whole additional monthly amount into more than one existing assets.6) Enter some of the additional monthly amount into an existing asset, and some into new assets.7) Enter some combination of lump sum and monthly investments into a new asset.8) Enter some combination of lump sum and monthly investments into existing assets.9) Enter some combination of lump sum and monthly investments into both new and existing assets.
All this assumes that clients have these additional resources that were not input into the current plan.
As you may find out, the lump sum and monthly figures probably won’t be exact. In other words, if the plan says they need $100,000 lump sum at 10% to meet their goal, and you make a new asset for $100,000 at 10%, there still may be an additional need once you calculate the program. The biggest culprit here is the number rounder (see the section in this manual).
Copyright 1997 - 2009 Toolsformoney.com, All Rights Reserved Page 45 of 60
REAL WORLD RETIREMENT
Next, the difference is probably caused by the discount rate used to solve deficits (A11 of the Summing & Input sheet, or A13 on the Master Input sheet of Dual RWR) being different than what assets are growing at. If you make them the same, then this difference will be minimized. This is an after-tax rate, so if this rate equals the average rate of all of the investments, it’s still going to be off (because investment income is taxed and the discount rate ignores taxes).
To troubleshoot this, first, set the number rounder to 1, delete the market values and the monthly contributions on the new assets (the one you made to solve the deficits using one of the above nine methods). Check the new additional need amounts on the Assumptions & Additional Need sheet, and repeat. If it is still off, then it’s probably due to the complexity of your assets. It won’t be off by much, so just enter the amounts needed to make the additional need numbers read $0 on the Assumptions & Additional Need sheet. You can also try to increase the order of magnitude of the number rounder to get it work out right. In other words, make it 1000 instead of 100.
Last but not least, save using additional funding (method #1 of 9) until you have exhausted all of the other techniques below that you may want to try or use. In other words, use it last. Many times you can reach the clients’ goals in the proposed version without using additional funding. The less money you tell your clients they will need to invest, the more they will like you. Any salesperson can tell a client they need to invest massive amounts of money to reach their goals. Clients want to hear about strategies that will help reach their goals, without having to invest every last dollar.
METHOD #2: ASSET ALLOCATION
Asset allocation fits in well at this point in the retirement planning process. The basic idea is to somehow come up with a mix (between asset classes like cash, bonds, stock, etc.) that’s more appropriate for the clients than what they have now. Once you know the client’s current and proposed asset allocation, it’s just a matter of selling off amounts in asset classes that they have too much in, and buying into better-performing assets classes that they are deficient in.
Let’s say, for example, that the client has an asset allocation that looks like this in their current version, and you are recommending the following:
Rate of Return Current Proposed ChangesCash: 4% 80% 20% -60%Bonds: 6% 10% 30% +20%Stock: 9% 10% 50% +40%
Now let’s assume that the clients have $800,000 in cash owned by the oldest client, $100,000 in bonds owned by the youngest client, and $100,000 in stocks jointly owned. You are proposing the following: $200,000 in cash, $300,000 in bonds, and $500,000 in stocks. If these three assets were all they have to start out with, then you would have entered them like this in the current version:
Copyright 1997 - 2009 Toolsformoney.com, All Rights Reserved Page 46 of 60
REAL WORLD RETIREMENT
All you need to do is change the amounts in one of the assets, and make two new assets. They will have a much better chance of reaching their goals now, because $600,000 was put to work earning a higher rate of return. Please note that Toolsformoney.com offers the best asset allocation software: http://www.toolsformoney.com/asset_allocation.htm
METHOD #3: INCREASING THE RATE OF RETURN ON ASSETS
This is the easiest one, and sometimes it’s the only alternative (that and a better asset allocation) if the clients don’t have any more money to invest. Just increase the rates of return on some of the investments. If they currently have poorly performing investments, and you entered them generically as something like “mutual funds,” then just raise the rate of return and explain that you’ll probably get them better performing mutual funds going forward. We do it all the time, but we never ever go over 10% on anything, period. You’re just asking for trouble if you do.
METHOD #4: PROPER USE OF USE FLEXIBLE ASSETS
If clients have CDs, gold bars, real estate, individual bonds, annuities that have not yet annuitized, or any other type of asset that does not allow the client to withdraw any amount of funds at their whim, then propose selling it and put it all into an investment with a flexible payout method. The best investment vehicles to use as Flexible Assets are our old friends, mutual funds.
Be aware of two things when dealing with Flexible Assets:
1) Limitations on withdrawals due to legal restrictions (trusts), asset structure (annuities), tax penalties qualified plans), etc. Don’t propose a Flexible Asset unless its retirement withdrawal payout is truly flexible enough to allow the client to withdraw any amount, up to the asset’s balance, at any year. If there are any restrictions, don’t use the Flexible payout method. You can use the manual payout method to withdraw income according to any real schedule.
2) Flexible Assets run out of money once and for all when they run out of money!
Switching an investment’s payout to allow any amounts of withdrawals at any time will make a world of difference in a plan. Proper use of Flexible Assets is a great way to prove you’re a miracle worker.
METHOD #5: LOWER THE CLIENTS’ INCOME GOAL
This may sound hoaky, but clients expect additional proposed versions that, after all the tweaking possible, show what they can live off of. In other words, if their income goal was $100,000, and you’ve done all of the asset allocation, better investing, reconfiguring that you can possibly do, and they still need to invest another huge hunk of change to make it; try just reducing the retirement income goal. Sometimes as little as $5,000 will do the trick (to make the additional need numbers both be $0).
This works great when used in conjunction with the number rounder too. The less accuracy you choose to convey, the more chance the additional need numbers will show $0. Most of the time the client’s will look at each other and say, “Good job, we don’t really need $100,000, we can get by with $95,000.” And don’t forget that you can manually override their income goals on any year by entering amounts into columns BV & CB of the Summing & Input sheet.
In reality, people will probably downsize their big house and move into a condo when they get older. They also take fewer expensive vacations. This would reduce the income goals in those years, so you can do this using the income goal manual override. Also, people go into nursing homes. You may want to raise the income goal in their later years to account for these expenses too.
Copyright 1997 - 2009 Toolsformoney.com, All Rights Reserved Page 47 of 60
Warning! If you use this method, you will need to also print and present a current version (or an additional current version) showing the usage of this method! Failing to do so will result in an apples-to-oranges comparison and would not be acting in the clients’ best interest.
METHOD #6: RETIRE LATER
Another method of making the plan get as close as possible to meeting the clients’ goal is to raise one of the clients’ age of retirement. If the oldest client wants to retire at age 50, and the youngest at age 49, then raise either the oldest client’s retirement age to 51, and/or the youngest’s to 50. See what happens. Repeat if needed.
Warning! If you use this method, you will need to also print and present a current version (or an additional current version) showing the usage of this method! Failing to do so will result in an apples-to-oranges comparison and would not be acting in the clients’ best interest.
METHOD #7: LOWER THE AGE OF ACCEPTABLE ASSET DEPLETION
As a corollary to method #6, you can also lower the age that the client expects to stop needing retirement income. In other words, when they expect to pass away. If one of the clients wants to have his investments generate income until age 110, this will require substantially more capital than if the age was 105. You input this age into cell A12 on the Summing & Input sheet (A14 on the Master Input sheet for Dual RWR). Lower the life expectancy age of the oldest client until you get the results you want. To get the maximum benefit from this method, use asset payout method #3.
Warning! If you use this method, you will need to also print and present a current version (or an additional current version) showing the usage of this method! Failing to do so will result in an apples-to-oranges comparison and would not be acting in the clients’ best interest.
METHOD #8: RAISE THE RATE OF RETURN ON ADDITIONAL INVESTMENTS NEEDED
As another corollary to methods 6 & 7, you can tinker with the discount rate that the additional funding amounts will grow at. You input this rate of return into cell A11 on the Summing & Input sheet (or A13 on the Master Input sheet for Dual RWR). One would need a lower lump sum to fund a future goal if that lump sum grew over time at 10%, than if it were to grow at only 5%. Therefore, the higher this rate of return, the lower the amount of addition funding required to meet their goals, and vice versa. Again, for your safety, do not enter a rate of return over 10% in this field.
The red warning does not follow this paragraph because it’s okay to raise this rate of return in some cases. This is because you will, in theory, be working to raise the rate of return on additional investments to be higher than the current version with better investment management. Just ensure this is explained in the proposal meeting.
METHOD #9: LOWER THE INCOME GOAL INFLATION RATE(S)
By lowering these rates (cells E5 - E7 on the Summing & Input sheet, or A18 - A20 on the Master Input sheet for Dual RWR), you are decreasing the income amounts needed in the future by a large amount. Because of compounding, these numbers, although they may seem tiny, have a huge impact on the amount of capital needed to generate this growing income need each year. Even lowering the rates by 0.25% (one quarter of 1%) will make a huge difference on the total amount of capital needed.
Lowering the 1 - 20 year rate has more of an impact than lowering the 1 - 10 year rate or the 1 - 5 year rate. Lowering the 1 - 5 or 1 - 10 year rate has about the same affect. Our opinion is that the range of inflation rates should be between 2% and 5% unless something drastic is happening in the economy. And don’t forget that you can
Copyright 1997 - 2009 Toolsformoney.com, All Rights Reserved Page 48 of 60
REAL WORLD RETIREMENT
manually override their income goals (and thus the inflation rates) on any year by entering amounts into columns BV or CB of the Summing & Input sheet. If you use this feature, you’ll need to make the client aware of it.
Warning! If you use this method, you will need to also print and present a current version (or an additional current version) showing the usage of this method! Failing to do so will result in an apples-to-oranges comparison and would not be acting in the clients’ best interest.
METHOD #10: RAISE THE SOCIAL SECURITY INCOME AMOUNTS OR THE SOCIAL SECURITY INFLATION RATE
Unless the clients have had a recent determination statement done by the Social Security, the only way to determine their Social Security PIA is to calculate their earnings every year using some obscure formula. We have personally never seen any planner do this; so don’t feel bad about guessing. If guessing bothers you, go to the Social Security website and download their free PIA calculator at http://www.ssa.gov/
On the PIA, you can just guess higher to reduce the income deficits, up to the maximum benefit (which is updated into the program annually). You will get errors if you enter a monthly PIA more than the max, so you can’t do that.
You can also guess higher on the amount of annual PIA COLA (Primary Insurance Amount Cost Of Living Allowance). Nobody knows what inflation will be in the future; let alone what the Social Security COLA will be, so just guess. We would stay in the 0.5% to 3% range though depending on what they put in their Fact Finders. It’s best to not set this inflation rate be more than one percent less than the overall long-term inflation rate. In other words, if cell E7 is 3%, input 2% into cell E13. In 2009, Social Security’s COLA was 0% due to negative CPI in 2008.
Warning! If you use this method, you will need to also print and present a current version (or an additional current version) showing the usage of this method! Failing to do so will result in an apples-to-oranges comparison and would not be acting in the clients’ best interest.
METHOD #11: LOWER THE AGE THE CLIENTS WILL COLLECT SOCIAL SECURITY
You can always lower the age they will begin to collect Social Security. If they entered 65 on their Fact Finder, and they retire at 60, make an addition version trying age 62. Be sure to remember to explain to them what you did though.
An analysis on when to start collecting Social Security is here: http://www.toolsformoney.com/social_security.htm
Warning! If you use this method, you will need to also print and present a current version (or an additional current version) showing the usage of this method! Failing to do so will result in an apples-to-oranges comparison and would not be acting in the clients’ best interest.
METHOD #12: LOWER THE SOCIAL SECURITY TAX INCLUSION RATE
Lower the rate you inputted into cell E22 of the Summing & Input sheet. Nobody knows what rates will be, and it’s up to you to use realistic numbers and explain them to the clients. It’s either going to be 0%, 50%, or 85%.
Warning! If you use this method, you will need to also print and present a current version (or an additional current version) showing the usage of this method! Failing to do so will result in an apples-to-oranges comparison and would not be acting in the clients’ best interest.
METHOD #13: LOWER THE ASSUMED TAX RATE
Copyright 1997 - 2009 Toolsformoney.com, All Rights Reserved Page 49 of 60
Try lowering the tax rates you entered into cell E22 of the Summing & Input sheet, or on any of the assets. Nobody knows what rates will be, and it’s up to you to use realistic numbers and explain them. Be sure to make use of both Average Tax Bracket Calculators (the four sheets far right) and the tax rate manual override input areas. Most people will be in a much lower average tax bracket when retired, so accounting will save tons of money for this.
Warning! If you use this method, you will need to also print and present a current version (or an additional current version) showing the usage of this method! Failing to do so will result in an apples-to-oranges comparison and would not be acting in the clients’ best interest.
HOW TO USE FLEXIBLE ASSETS
This section explains how to use and control the critical Flexible Assets. There are three basic ways to use them:
1) Just have one Flexible Asset (other assets paying out in any other method but Flexible).2) Have all assets pay out income as Flexible Assets.3) Have more than one Flexible Asset, with other assets not set to pay out as a Flexible Asset.
USING JUST ONE FLEXIBLE ASSET, WITH OTHER ASSETS PAYING OUT NON-FLEXIBLE
Things are the simplest if you decide to just use one Flexible Asset. But remember that you give up significant control when you simplify. In this scenario, you can have any number of assets, but only one would be have its payout method set to be Flexible.
When the cash generated by all other sources of income is insufficient to meet the income goal in that year, and then the total amount of this income deficit is taken out of the Flexible Asset. This happens last - after all income from all sources on the Summing & Input sheet, and all assets with payout methods other than Flexible, are taken into account.
This amount is irrelevant until the Flexible Asset runs out of money. When the Flexible Asset runs out of money (depleted from paying out all of its value to fund deficits), income deficits will begin to appear on the Annual Summary Numbers sheet. This in turn generates the additional funding amounts needed on the Assumptions & Additional Need sheet.
The amounts needed to fund the deficits are taken out of the asset’s balance first, and then taxes are withdrawn at the inclusion rate that you specified in cell A10 of the asset sheet. If you’re curious, you’ll find that taxes are actually taken out of Flexible Assets on column BH of the asset sheets (this was explained in detail in a previous page).
HOW TO HAVE AN ASSET PAYOUT IRS REQUIRED MINIMUM DISTRIBUTION AMOUNTS AS A MINIMUM, AND THEN PAYOUT MORE (AS A FLEXIBLE ASSET) IF MORE IS NEEDED
The IRS will require you to make minimum distribution amounts from qualified plans starting in the year you turn 70 and a half. Just setting the asset’s payout method to #4 will only solve for these minimum amounts. So what do you do of these amounts are not enough to meet the income goals in some years?
First enter the asset as you would if it were to just payout the minimum distributions.
Make a new asset, with the same effective age, no current value, and using payout method #5.
Copyright 1997 - 2009 Toolsformoney.com, All Rights Reserved Page 50 of 60
REAL WORLD RETIREMENT
Copy all of the minimum distribution amounts from the original asset (column M), into the manual withdrawal column (BF or BC on Dual) of the new asset. Use Paste Special, Values, when pasting. Ignore errors and strange results for now.
Then make the current market value of the new asset be the amount that will deplete its value in the last year of the oldest’s person’s assumed life (keep lowering the current balance until it’s gone at the ending age you input). What you did on the new asset will account for the minimum amount of money needed to account for the minimum distributions.
Then take what’s left over (the difference between the current market values of the two assets), and enter this amount as the original asset’s new market value. Then set the payout to Flexible. Now the IRS will be happy with the new asset, and the balance can be used to fund income goals if needed by using the old asset.
HOW TO HAVE AN ASSET PAYOUT AS A FLEXIBLE ASSET UNTIL AGE 70.5, WHEN IRS REQUIRED MINIMUM DISTRIBUTION AMOUNTS ARE THEN NEEDED
You would do this when you want to keep the amount of withdrawals on an asset down to only what’s needed to fund the plan. Then when you turn 70.5, these amounts will have to increase to satisfy the IRS.
First, have the investment pay out using the Flexible payout method.
Using column AO on the asset sheet of RWR (and AM on Dual), highlight the range of annual payouts generated, up to age 69.
Copy and then paste them anywhere into the far left Presentation sheet. It’s better to use the Paste Special, and then Values command than just paste here.
Change the signs to be positive (they will all be negative because that’s the way there are on the asset sheet). If you have Excel 2007, then you can also use the Operation feature of Paste Special to save a step. If not, then the best way to save steps here is to do this: Highlight the whole list of numbers. Do a Find & Replace on them, like so: Find “-“ and change to “” (nothing, leave the Replace field blank. Save your work.
Now change the asset payout method to be #4, MRD.
Copy and paste the cash flows from the Presentation sheet back into the assets sheet’s annual income manual withdrawals column, so that the last year’s withdrawal amount ends at age 69. Ensure you input 100% into cell A11 as the tax rate for the manual withdrawals.
This way, the investment will pay out as much as it did, and what was needed, when it was paying out Flexible until age 69. The same amounts will be deducted in taxes. Then it will only pay out minimum distributions based on the account balance at age 70 from then on.
If this results in cash flow deficits, you can always change it back to paying out Flexible or you can use the annual income manual withdrawals column to have it pay out more money when needed.
If this results in cash flow surpluses, you can lower amounts the other non-flexible assets are paying out, increase the income goal, or spend more money somehow (having fun). This shouldn’t happen if you used the Flexible assets correctly, as they will automatically lower the amounts they pay out.
Copyright 1997 - 2009 Toolsformoney.com, All Rights Reserved Page 51 of 60
REAL WORLD RETIREMENT
In any case, by using this method of copying cash flows into the Presentation sheet, you can compare payouts between the different methods and see which works best for you.
HOW TO KEEP ASSETS INTACT AFTER LIFE EXPECTANCY
If a client wants to have so much capital left over after they pass away (or at any year), you can do that. Let’s assume that a client wants to have $500,000 left over at age 100. First try to put about $200,000 into an asset with payout method #5. Then don’t take any money out of it. It will grow at the rate of return you specified. This is easy, if it works (they have enough).
Next, try using payout method #2, yield only. Then the principal will stay intact if you use a yield rate lower than the growth rate.
You can also play around with payout method #3 by using a high depletion age (e.g., 110).
The point is that you can play around with how assets pay out, so the one asset you set aside, or a combination of assets, still have this much left at a certain age (as shown on column N of the Annual Summary Numbers sheet).
HOW TO USE THE MANUAL OVERRIDES AND OTHER MANUAL INPUT AREAS
There are many areas in the program that allow you override numbers on a year-by-year basis, or manually enter numbers to take unequal cash flows into account. This gives you total control over most every number in every year.
Most of the time, there will be a text note column next to the override column. Use this area to insert reminders as to why you used the overrides. This text does not affect any calculations (column N of the Summing & Input sheet).
Starting on the Summing & Input sheet, and going from left to right, the first manual input area is the earned income manual override column. This begins at cells M19 and R19. This area acts as a true Manual Override. This means that numbers inputted into the green-shaded cells actually override, or wipe out and replace, the numbers the retirement software automatically calculated.
For example if you were to input $100 into cell M19, this would be this year’s monthly earned income amount for the oldest client, regardless of the amount the program calculated and displayed in cell L19. These manually entered numbers are not subject to taxes, so be sure to enter them after taxes. You can find the average tax rate in cell E8.
The next manual input area is the six totally manual input income and expense area beginning at cell AZ17. Amounts entered here do not override any other amounts. In these columns, you’ll need to enter numbers for every year that you want an income or expense. You may use any formula you want to autofill in these areas. In this area, input a negative sign (-) in front of the number for expenses. These manually entered numbers are not subject to taxes, so be sure to enter them after taxes. This was discussed in detail in a previous section.
The last manual input area on the Summing & Input sheet is the monthly income goal manual override columns BV & CB. These are true manual override areas just like the earned income area discussed above. This is where you can manually override the oldest and/or youngest client’s income goal, and/or income goal inflation rate at any year. If you are using cash flow numbers generated by other financial software, this is where you would enter, or link to, them.
Keep in mind that if you don’t enter a non-zero value into the override column in a certain year, the program detect a zero, and then will use the automatically generated number. Be sure to divide any monthly-generated amounts by 12,
Copyright 1997 - 2009 Toolsformoney.com, All Rights Reserved Page 52 of 60
REAL WORLD RETIREMENT
as it’s expecting monthly amounts. Be sure to delete the spouse’s income goal by inputting a tiny number (e.g., 0.001) if your manual overrides are for both spouse’s combined.
The cost of living inflation rates you input will be ignored in years where there is an income goal manual override.
Go to the bottom of this page to see how to input the detailed year-by-year results of the Cash Flow Projector program into the income goal manual overrides: http://www.toolsformoney.com/budget_tool_directions.htm
The only other manual input areas are on the asset sheets. The rate of return and monthly contribution manual override columns (columns C & G) was discussed in detail previously in this manual, and are true override columns. The annual income manual withdrawal column (BF or BC on Dual)) is not an override column, meaning that these numbers are added to whatever the payout amounts are (in blue to the left on the asset sheets).
If the input area says manual override, then numbers entered will wipe out and replace the automatically generated numbers. If it doesn’t, then amounts entered will not replace automatically generated values, but will create new values, with the amounts input being added to the existing calculated amounts. Notice how things change when used.
HOW TO ACCOUNT FOR SOMEONE PASSING AWAY
If you want to project someone’s passing, you should account for what will happen to their assets, incomes, income goals, and everything else that will change.
First, stop Social Security from paying out in the program. Use the manual Social Security columns (F or I on the Summing & Input sheet) to back out their Social Security by inputting tiny non-zero amounts for those years (like 0.001). Inputting zeros here will be ignored, so an insignificant amount needs to be input.
If someone has an asset that will stop paying upon death, like a pension, then use this procedure: Use one of the manual income/expense columns (AZ - BL). Input the income amount as a negative number - if they were getting $1,000 per month in that year, then input -1000. These values will still be shown but they will cancel each other out.
If an investment changes hands, and leaves the picture, then you can eliminate it by entering -100 into the rate of return manual override column on the asset sheet (column C). If an asset changes hands, and stays in the picture, then you can just create a new one that becomes effective in that year (after you’ve eliminated it first, as described above).
HOW TO ACCOUNT FOR AN INHERITED IRA
The beneficiary of an inherited IRA is required to take minimum distributions from it beginning in the first year, which is subject to ordinary income taxes. Just make a new asset, and then use payout method #8.
How to open a discount brokerage account to manage your own money, and IRA rollovers, is here: http://toolsformoney.com/discount_brokers.htm
HOW TO ACCOUNT FOR RENTAL REAL ESTATE
It’s possible to simulate rental real estate fairly closely to the Real World using the manual input areas.
There are four main components in rental real estate - market values, taxes, net sales proceeds, and income. We suggest that you purchase our rental real estate IRR calculator to figure the market value and net income numbers in every year. If not, it’s best to use some sort of tool to generate these numbers for input into RWR. You can, of course, always guess or use the client’s guesses.
Copyright 1997 - 2009 Toolsformoney.com, All Rights Reserved Page 53 of 60
If you want to show the net equity as an asset on the presentation pages, the first step is to enter the property as another investment into one of the asset sheets. Then use the year-by-year Manual Override payout method (#5). Do not enter any income amounts into the asset’s column BF (BC on Dual) because this income will detract from the market value (and income from rentals do not detract from principal like in other types of assets). The above step will account for only the market value (or net equity if there is a mortgage), and net sale proceeds, aspects of the property.
Then just simply enter each year’s after-tax income values into one of the six manual income or expense areas on the Summing & Input sheet. If it’s not jointly held, be sure to use the same owner that you used in the step above.
Account for property’s sale by inputting the net after-tax proceeds from the sale as a manual income withdrawal in column BF (BC on Dual) of the asset sheet. Input zero into cell A11. If there is more money left in the asset after the sale, then input -100 into the rate of return manual override column in that year, which will wipe out the balance. If there isn’t enough money in the asset, then you can either increase the rate of return along the way until there is, or account for the difference on one of the manual income areas on the Summing & Input sheet.
Now you have accounted for the market value, and the income, and taxes (because you input only net after-tax income values). If you want to account for taxes, depreciation, and all of the other aspects of rental real estate, you can always purchase the real estate software.
How to account for a reverse mortgage: First of all, one would not input a personal residence, where one currently resides, into RWR as an retirement investment asset because it doesn’t produce income. If you were receiving rent from a room, then you’d just input the net monthly rent into a manual income or expense area.
However, reverse mortgages are the one scenario where one would use an asset slot to account for a personal residence. Then use the manual withdrawal payout method #5 to account for the income. Input the estimated total amount of money you will receive from the reverse mortgage, regardless of the value of the property. For example, if your contract calls for $100,000 in principal to be returned to you via payments of $1,000 per month for 100 months, then input $100,000 as the current market value. Use a rate of return of 0%. Then input $1,000 per month into the manual income withdrawal column until the market value turns to zero (ensure that it doesn’t show producing income after the 100-month period is over). When you started out, you had an asset worth $100,000, but over the next 100 months you got $1,000 per month in exchange for its market value turning into $0 value. If you used 0% as the rate of return, then is should have correctly simulated the ending of paying out $1,000 per month right on time. If it’s still showing a market value when it shouldn’t, then input -100% into the rate of return manual override column.
HOW TO RUN ROTH IRA CONVERSION SCENARIOS
You can analyze scenarios to see if converting your traditional IRA to a Roth IRA is in your best interest. There’s really no way of knowing what the long-term ramifications are until you run the numbers far out in the future.
The one and only true way to compare investments is the Investment Comparitor product on the site: http://www.toolsformoney.com/investment_comparator.htm But this is for comparing from the beginning of the asset’s life, not converting once it’s already living.
First, run your retirement report as if you were going to keep your traditional IRAs.
Next, save that scenario using a different file name to preserve the first scenario. Now you’re working on the scenario with the conversion, so Save As… again using something like, “After Roth Conversion.”
Copyright 1997 - 2009 Toolsformoney.com, All Rights Reserved Page 54 of 60
With this Roth version, take the balance of your old IRAs that you’re thinking of converting, and figure out how much tax you’ll owe on them. Change the beginning balance of this asset to reflect the new beginning balance after you’ve paid all of the conversion taxes (just subtract the estimated taxes paid from the current balance).
Then set the tax rate for this investment to 0% (cell A10) because withdrawals are not taxable.
Do not use the Age 70.5 Minimum Distribution payout method, nor 72t, because these rules don’t apply to Roth IRAs.
The bottom line is to compare the overall balance of assets over the long-term, after a decade or so of withdrawals from each version of IRAs, to see which scenario provides you with both the income you need to reach your goals, and the most money when you plan to expire. Using these techniques, you can run as many scenarios as you want to.
SOME ROTH IRA BASICS (USE IRS.GOV FOR MORE AND CURRENT INFORMATION)
A Roth Individual Retirement Arrangement (Roth IRA) allows taxpayers, subject to certain income limits, to save money for use in retirement while allowing the savings to grow tax-free. All of the tax benefits associated with a Roth IRA happen when withdrawals are made: Withdrawals, subject to certain rules, are not taxed at all. This is in sharp contrast to a traditional IRA. Stated differently, Roth IRAs convert investment income (dividends, interest, capital gains) into tax-free income. There are no tax benefits associated with contributions (no deductions on your federal tax return) because all contributions to a Roth IRA are made with after-tax monies.
A huge difference between Roth and ordinary IRA accounts involves the rules for withdrawals past age 70 1/2. There are no requirements that a holder of a Roth IRA ever make withdrawals (unlike a traditional IRA for which required minimum distribution rules apply). This provision makes it possible to use the Roth IRA as an estate-planning tool. You can pass on significant sums to your heirs if you choose; the account must be distributed if the holder dies.
What the Roth IRA allows you to do, in essence, is lock in the tax rate that you are currently paying. If you think rates are going nowhere but up, even in your retirement, the Roth IRA is a sensible choice. But if you think your tax rate after retirement will be less, perhaps much less, than your current tax rate, it might be wiser to stick with a conventional IRA. To be picky, you really need to think about the tax rate when you are eligible to take tax-free, penalty-free distributions, which is age 59 1/2.
If you are allowed to put money in a Roth IRA at all (i.e., if your income is below the limits), then making contributions to a Roth IRA is preferable over making contributions to a nondeductible IRA. You pay the same amount of taxes now in both cases, because neither is deductible, but you don't pay taxes on withdrawal from the Roth (unlike withdrawals from an ordinary IRA). The only exception here is if you're going to need to pull the money out before the minimum holding period of five years.
Conversions made in 1999 and subsequent years will be fully taxed in the year of the conversion. Deductible contributions and all earnings are taxed; non-deductible contributions are considered return of capital and are not.
If you are eligible to convert your ordinary IRA to a Roth IRA, should you? Again answering this question is non-trivial because each investor's circumstances are very different. There are some generalizations that are fairly safe. Young investors, who have many years for their investments to grow, could benefit handsomely by being able to withdraw all earnings free of tax. Older people who don't want to be forced to withdraw funds from their accounts at age 70 1/2 might find the Roth IRA helpful (this is the estate planning angle). On the other hand, for people who have significant IRA balances, the extra income could push them into a higher tax bracket for several years, cause them to lose tax breaks for some itemized deductions, or increase taxes on Social Security benefits.
Copyright 1997 - 2009 Toolsformoney.com, All Rights Reserved Page 55 of 60
REAL WORLD RETIREMENT
HOW TO ACCOUNT FOR TAXES DUE ON NON-INCOME-PRODUCING NON-QUALIFIED ACCOUNTS DURING RETIREMENT
Some people want to leave their non-tax-qualified accounts grow, by not taking any income from them when they retire.
As you probably know, with investments like mutual funds, there are annual dividend and capital gains taxes that need to be paid annually, even though you didn’t withdraw any money.
If you want to account for these taxes that will be an expense during retirement, you basically have to calculate these estimated taxes due yourself, and then use one of the manual income/expense columns on the Summing & Input sheet to account for them.
So just make a new expense called “Fund Taxes” (or whatever) and input the estimated annual taxes divided by 12, and input the numbers with a minus sign in front of them.
HOW TO ACCOUNT FOR EXPENSES FROM ASSETS BEFORE RETIREMENT
In some cases, one may want to use an asset to fund large expenses before the first person retires. Here is how to do that, using college funding as an example.
In general, expenses that are either deducted from an investment’s balance, or are added to the annual income goal using an input area on the Summing & Input sheet, after the first person retires are handled automatically. But if you want to deduct expenses from an asset before someone retires, it’s different. That’s what this is all about.
As mentioned previously, expenses input into the Summing & Input sheet that occur before someone retires will be ignored. These expenses are assumed to be funded via earned income (which the program does not account for) and so don’t affect anything input into the retirement software. RWR normally does not do anything with investment values but apply contributions and the annual rate or return, until the first person retires.
If you want to account for them, by reducing the balance of an investment input into one of the asset sheets, then all you need to do is use the annual withdrawal manual override column on the asset sheet. Just input the annual amounts to be withdrawn in the appropriate years (there’s no need to put a minus sign in front of the numbers). This will reduce the investment’s balance by these amounts.
You may want to consider reducing new contributions to investments during these years too, as that’s common.
Assume that the first person to retire is five years away. But you also have an investment input that you planned to withdraw money from to fund fours years of college for a child. This will start to occur in year three, two years before the first person retires. This will explain how to account for this correctly.
Take the end-of-year balance of year two. Let’s say it’s $250,000. The next year, year three, you expect $25,000 to come out of this investment, which will include any taxes due on the withdrawals. First, deduct the $25,000, for a new end-of-year balance of $225,000. Now apply the annual rate of return to it. Let’s say it is 10%. So the account value at the end-of-year three should be $247,500 ($225,000 + 10%).
The program will more than likely have calculated the end-of-year balance to be $275.000 ($250,000 + 10%). You need it to be $247,500.
Copyright 1997 - 2009 Toolsformoney.com, All Rights Reserved Page 56 of 60
REAL WORLD RETIREMENT
Use the rate of return manual override column in year three, and tinker with it until you get the end-of-year balance you want. In this case, it’s –1.00% $250,000 – 1% = $247,500 Repeat for every year this occurs.
When the first person retires, you can now use the manual withdrawal column to account for these withdrawals, using cell A11 to account for taxes.
USING EXCEL’S BUILT-IN GOAL SEEK FUNCTION TO DO “WHAT-IF” SCENARIOS
You can use Excel's built-in Goal Seek function to do your What-ifs in both the current and proposed versions (as usual, something that no other retirement planning software can do).
For example, just click on cell B35 of the Assumptions and Additional Need sheet, then go to Tools, Goal Seek, Change the To value: field to zero, then click on the bottom field, then on any other green-shaded input cell that will help make the retirement plan reach the goals better (like a rate of return input field of an asset sheet). Click OK, and Excel will automatically increase the rate of return until the amount of more money needed shown in cell B35 goes to zero. This scenario result is also shown automatically every time the Monte Carlo macro is run.
Then you'll know what rate of return you'd need to get to reach your retirement goals, assuming all other input stayed the same.
With this feature, you can do all of the What If? and Goal Seeking functions that any other retirement software can do, plus dozens more that they can't do (because it's not written in MS Excel). You can use both any result cell with any input cell with Goal Seek.
For example, if you wanted to Goal Seek to determine what the Social Security inflation rate needs to be to only fund retirement through the wife's age of 70, you can do that. Just click on cell R38 on the Annual Summary Numbers sheet (see demo), open Goal Seek, input 0 into the middle field, go to the bottom field, click on cell E13 of the Summing & Input sheet, click OK, and Excel will increase the Social Security inflation rate in cell E13 until there is no more money needed to fund retirement at the wife's age 70. You're going to get a crazy number like 75%, but you can do this, and any other crazy thing you can think of. You can use any of the dozens of input/result fields as the key variables in reaching your retirement goals.
USING THE MONTE CARLO SIMULATION FEATURE
First a caution: This may lock up your computer for up to a half an hour until it’s done processing.
Go to the far right Monte Carlo sheet. Press control M (hold the control key down and press the M key). If that doesn’t work, then go to Tools, Macro, Macros, Monte, Run. A macro runs (directions for Dual RWR are on the last page). Macros are on the far right side of the View ribbon in Excel 2007.
When it stops and asks you if it's okay to delete the temporary sheet, click OK. It then ends up on the cell with the resulting probability number, and the minimum rate of return needed on all investments to barely reach the goal of funding retirement through the ending age input without running out of money.
Note that these numbers will remain until you run the macro again, even when you subsequently change other input data. So as soon as you change something after the macro runs, it will be “wrong.”
The rates of return on all assets are incremented from getting an average rate of return from -10% to 10%. It then logs a true or false condition, based on if the amount of additional funding needed on the Assumptions and Additional Need sheet is zero or not. The proportion of times it’s true is then used to display the “probability of success” number.
Copyright 1997 - 2009 Toolsformoney.com, All Rights Reserved Page 57 of 60
REAL WORLD RETIREMENT
RWR increments inflation and taxes too. The first iteration, for example, uses a -10% average rate of return, a 2% inflation rate in all three input fields, and a 15% average tax bracket. The second uses -10% rate of return, 2% inflation, and 25% tax rate. The third uses -10%, 4% inflation, and 15% tax rate. The fourth uses -10%, 4% inflation, and 25% tax rate. The fifth uses -10%, 6% inflation, and 15% tax rate. The sixth uses -10%, 6% inflation, and 25% tax rate. Then it cycles in one half percent increments more rate of return until all combinations of the three variables are solved for. This is a total of 246 iterations. The maximum Excel 2003can handle is 251.
This bottom-line probability of success number displayed is just telling you the chances of not needing any more capital until the ending asset depletion age input on cell A12 of the Summing & Input sheet. If you end up not needing any more money assuming a certain average rate of return on assets, then the Amount of Additional Funding Needed shown on the Assumptions and Additional Need sheet will be zero, and it’s then logged as a success. The number of successes is then compared to the number of failures, and the proportion is the number displayed as the result.
The accompanying number, Minimum Rate of Return on All Assets Needed for Success, is the average of all of the minimum rates of return on iterations that were successful. We feel this is a superior methodology compared to what other vendors do. Others use average asset rates of return from -100% to 100%. In the Real World, the chances of losing all of your money in an investment portfolio in one year are just about as negligible as doubling your money. So RWR only iterates between the ranges that are most likely what’s going to happen in the Real World. We don’t use rates of return over 10% because this is a long-term average rate of return, and few can get such a high average over the long-term (ten years or more). Also, the chances of getting a negative 10% rate a return every year for over a decade is also just as unlikely.
Our Monte Carlo results will probably show a much lower probability of success. This is because it paints a much less rosy scenario than other vendors. Our numbers are more realistic relative to what will probably happen.
The inflation and tax iterations are also just three and two examples of good to worst-case scenarios.
So even though this is a different way of doing things, we feel that it makes the bottom line probability number much more meaningful, and projects what’s going to happen in the future, better than what everyone else is doing. Please note that all of these numbers are as good as computers can generate, but they will still all be wrong in the Real World. Things to keep in mind:
· This will take a long time, so please be sure you have the time to wait before you start the macro.
· You cannot insert or delete sheets in between the Macro sheet and the Assumptions and Additional Need sheet. Excel isn’t smart enough to account for this when it goes off and changes things on different sheets. So if you want to insert a sheet, you can only do it at the far left or right sheet.
· Rates of return input into the asset manual override columns will override simulated rates in those years.
· You’ll need to keep cells H37 & I38 on the Assumptions and Additional Need sheet unprotected so the macro can write the results to it (and T37 & U38 on Dual RWR). The whole workbook needs to be unprotected too, so the summary sheet can be added and then deleted.
· You need to be on the appropriate Monte Carlo sheet for the macro to run.
Copyright 1997 - 2009 Toolsformoney.com, All Rights Reserved Page 58 of 60
REAL WORLD RETIREMENT
· If you see 0% of #DIV0! On the minimum rate of return needed cells, this means that no scenario resulted in a positive outcome (goal being met) and that the rate of return needed is much greater than 10%.
You can read more about Monte Carlo here: http://www.toolsformoney.com/monte_carlo.htm
“HOW TO” AND TECHNICAL SUPPORT
If you bought the fully-supported version, “how to” support is provided free of charge (other than your phone call). Then you may send e-mail or call (800) 658-1824 for phone support.
If you bought the e-mail-only supported version, “how to” support is provided free of charge by e-mail to answer questions on how to enter data in order to achieve needed reports. Send an e-mail to [email protected]
Technical support does not expire. More information is on the support page: http://www.toolsformoney.com/financial_planning_software_support.htm
ALL ABOUT UPDATING
The site’s updating policy changes periodically, and can be found here: http://www.toolsformoney.com/financial_planning_software_updates.htm
ABOUT THE “DUAL RWR” RETIREMENT PLANNER
The Dual version of RWR is essentially the same as the regular single version. The differences are:
· It has a Master Input sheet to minimize switching back and forth between the sheet tabs. All input is done there except for the manual overrides. The regular input fields on the Summing & Input and asset sheets are not functional as they just reference the Master Input sheet. These input cells will display nothing until there is input into the Master Input sheet that is non-zero. Even though they are input cells, they are yellow, and not green, because you can’t input anything into them. We were thinking of making them both work but that would have made it be a 20MB spreadsheet. An odd thing is that the regular inputs (any input on the Master Input sheet) that’s not a manual override, are locked so you can’t input there anymore. What you’ll see here are zeros if there is no input into the Master Input sheet. This is the way it’s supposed to be, and can’t be “fixed.”
· A simplified explanation of the difference between Dual RWR and RWR is that everything was copied, the old data was renamed “Current” and new copied data was renamed “Proposed.” So all of the information in this manual, and the operation of Dual RWR, is the same as the single RWR version. Everything was copied so you can see two RWR scenarios at the same time (current vs. proposed retirement plans).
This might not sound too impressive, but it's a 14MB Excel spreadsheet in Excel 2003, which is by far the biggest we've ever seen. Because of the size and complexity, Excel may have a hard time with it (due to it not being able to use all of your computer’s memory, like Excel 2007 does). For example:
· Dual RWR only has ten assets (five each) because it reached the limitations of Excel. These are duplicated for current and proposed, so there’s still a total of 20 asset sheets.
· You'll need at least a 500MHz Pentium II, with 256Mb RAM to even get Excel to open it. Slow computers may open it, but every time you change an input field, it's going to take a few seconds to calculate.
Copyright 1997 - 2009 Toolsformoney.com, All Rights Reserved Page 59 of 60
· Even with a fast computer, it takes up to five seconds to calculate every time you change an input. So you may need to go to Tools, Options, Calculation, and change calculation to Manual. Then every time you want it to calculate numbers, press F9. Then you’ll have to remember to change it back for use with other spreadsheets.
· A second client (spouse) needs to be input for the second half of the Miscellaneous Income & Expense fields to be active. So it’s best to not input anything into Master Input sheet: cells A or D108-119, and A or D82-93, and A or D56-67, and A or D36-41.
· Be sure to check the error messages in cells D4 and D6 of the Master Input sheet, and then J18 on both the Current and Proposed Summing & Input sheets! And if there are any, look at the individual asset sheets for details.
Important! Microsoft made a huge design decision error when building Excel. They allow one to copy one cell’s validation into another cell, even when the sheet is protected. This allows you to copy input from the current side of the Master Input sheet (column A), to the Proposed section (column D). So if you just regular copy and paste, then when you change input in column D, the validation will be using data in column A as it’s point of reference. So if you lowered the age of retirement in the proposed plan, then you’ll get validation errors when you do things like change the last year of contributions to assets. The only way to fix this once you’ve done it, is to copy and paste data back from the original template.
How to avoid falling for this: When copying and pasting on the Master Input sheet, copy as normal. But this time when you paste, right click, and choose Paste Special. Then when the dialog box comes up, choose Values. This will copy only the data and will not overwrite the formats, nor the input validations. Most of the validation was eliminated on the Master Input sheet for this reason, but some people will still run into some of it if they’re not careful. If you get a validation screen that is illogical, then this is probably what happened. If it’s a problem, you’ll have to copy and paste it back using one of the original backup files.
If you get a dialog box saying that the range of values is from this to that, and your value is between these values, then the problem is you can’t input pennies into that field. The values have to be whole numbers without decimals/pennies.
· Monte Carlo: On Dual RWR, it runs on Current and Proposed versions separately. To run a simulation with the Current version, go to the Current Monte Carlo sheet, toward the very right, and press control M (hold the control key down and press the letter M). If you see 0% of #DIV0! On the Minimum Rate of Return Needed cells after running a Monte Carlo simulation, this means that no scenario resulted in a positive outcome (goal being met) and that the rate of return needed is much greater than 10%.
To run a simulation with the Proposed version, go to the Proposed Monte Carlo sheet, and press control N.
If it doesn’t run using the shortcut key, then go to Tools, Macro, Macros, choose either current or proposed, then Run. Macros are on the far right side of the View ribbon in Excel 2007.
Rates of return input into the manual override columns will override simulated rates in those years.
You can’t add nor delete sheets between the far left and far right sheets (you can only add before the far left or add after the far right sheet).
It will take about 20 minutes to complete on modern computer of average speed. If you have a new fast computer, and it takes more than half an hour, then you may want to read this page about removing parasitic programs.
Copyright 1997 - 2009 Toolsformoney.com, All Rights Reserved Page 60 of 60