42
Retro-Commissioning June 21, 2010 Ed Tinsley, PE TME, Inc
| Date post: | 16-Dec-2015 |
| Category: |
Documents |
| Upload: | oswald-carroll |
| View: | 220 times |
| Download: | 0 times |

Retro-Commissioning
June 21, 2010
Ed Tinsley, PETME, Inc
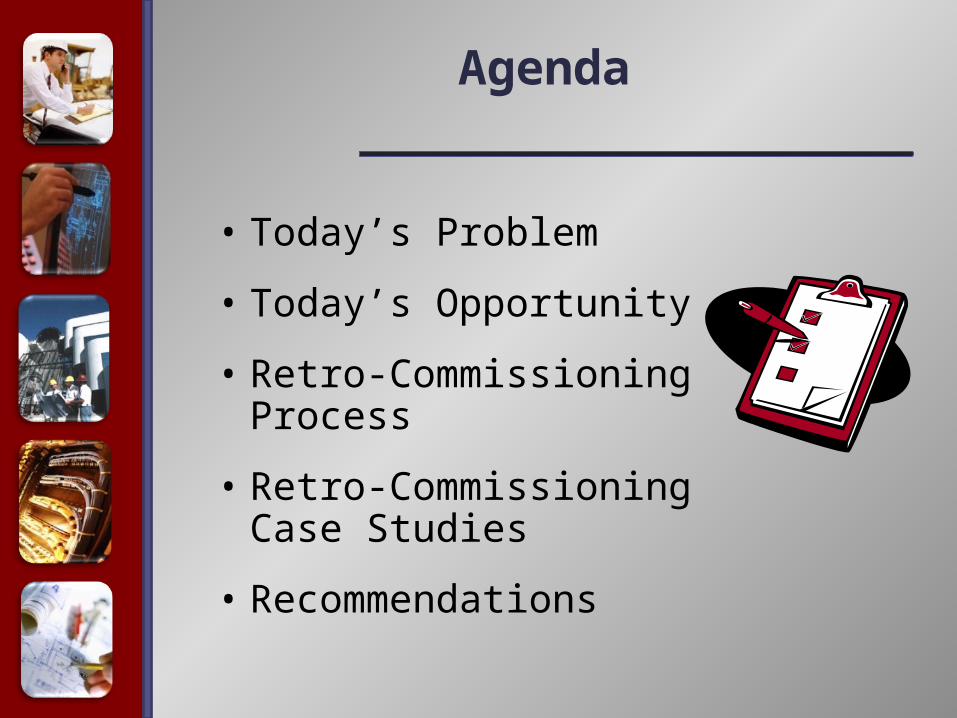
Agenda
• Today’s Problem
• Today’s Opportunity
• Retro-Commissioning Process
• Retro-Commissioning Case Studies
• Recommendations

Today’s Problem
• A Legislator’s Quandary
• LEED is not Enough
• Performance Contracting is not the Answer
• Act 1494 and Executive Order 09-07 are a Good Start

A Legislator’s Quandary
• Moral Obligation as a Human Being to Conserve Natural Resources
• Fiduciary Responsible as a Legislator to Conserve Taxpayer Funds
• Is there a Conflict?

• 25% of LEED Certified Buildings do not Achieve their Predicted Energy Savings
• In the Real World, LEED Certified Buildings are not more Energy Efficient than other Buildings
• 53% of LEED Certified Buildings do not Qualify for the Energy Star Label
• 15% of LEED Certified Buildings have Energy Star Ratings less than 30
“Some Buildings Not Living Up to Green Label”
August 31, 2009
LEED is not Enough

Performance Contracting is not the Answer
• Complex Legal Issues
• 35 to 70% Cost Premium
• “Fuzzy” Guarantees
– Weather
– Rates
– Utilization
• Not a Good Track Record
• May be Better than Doing Nothing
At least this is better than my last
job managing Performance
Contracts

Act 1494 and Executive Order 09-07 are a Good
Start• Act 1494
– Mandates Energy Efficient Design, Energy Modeling, Commissioning, and M&V
– 20% Reduction by 2014 and 30% Reduction by 2017
• Executive Order 09-07
– Strategic Energy Plans
– Promotes Operational Changes to Reduce Environmental Impact

Today’s Opportunity
• Natural Gas Rates
• Electricity Rates
• Projected 2010/2011 Surplus
• Spending our Gift Wisely

Natural Gas Rates

Entergy Rate Increase (Docket 090-084-U)
• UA System Intervened
• Other Participants (AEEC, FEA, Kroger, Hino, Audubon, Attorney General and Staff)
• 12.86% Increase in Base Rates (Large Commercial Class)
• Loss of CA Rider
• Indemnification Language Issue Referred to ATU Complaint
• Pilot Real Time Pricing (“RTP”) Program
• Securitization of Storm Damage Costs Referred to Separate Docket
• Formula Rate Plan Referred to Separate Docket

Electricity Rates
Item Change (%)% of Total
CostNet Change
(%)
Base Rates 12.86 40.50 5.21
PCA Rider (System Agreement) (84.82) 29.20 (24.77)
ECR Rider (Fuel and Purchased Power)
(26.78) 18.55 (4.97)
Capacity Acquisition Rider (Ouachita Plant)
(100.00) 1.09 (1.09)
Total Change (25.62)

Projected 2010/2011 Utility Budget Surplus
• Electricity - $9.75 Million• Natural Gas - $4.50 Million• Total - $14.25 Million

Spending the Gift Wisely
• Largely Due to Lower Natural Gas Costs
• The Surplus is Short Term
• Surplus can be Absorbed into General Funds or
• Surplus can be Converted to Recurring Savings by Investing in Energy Conservation

Retro-Commissioning
Retro-commissioning (RCx) is a systematic, documented process that identifies and implements low-cost operational and maintenance improvements in existing buildings intended to improve energy efficiency, indoor air quality, and thermal comfort.
RCx focuses on the major energy consuming systems (HVAC and lighting) and optimizes existing system performance, rather than relying on major equipment replacement or other items requiring large capital expenditures.
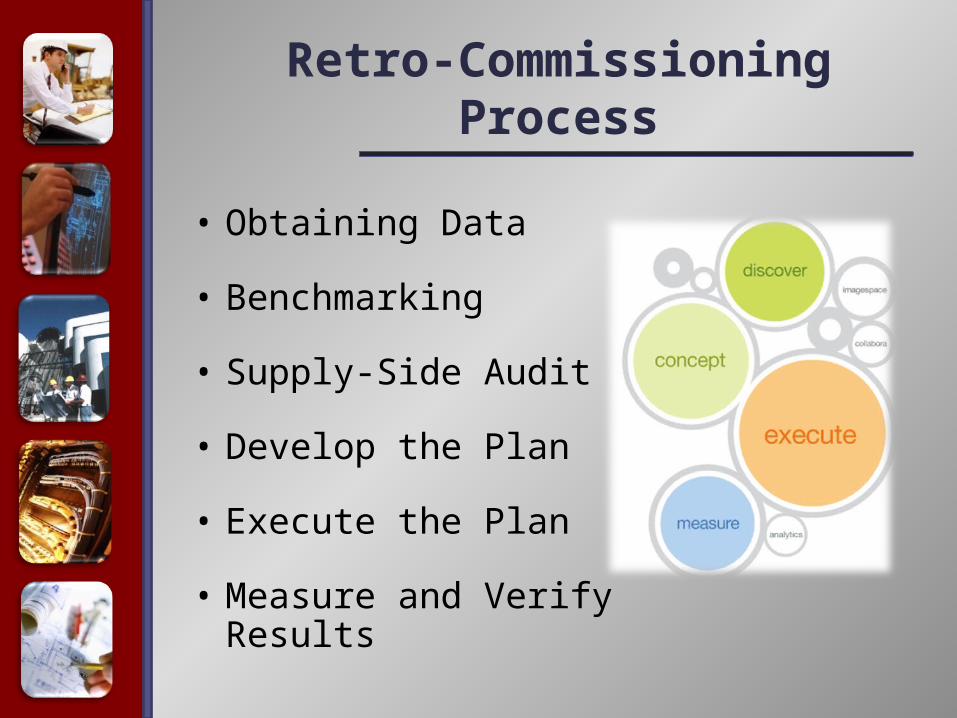
Retro-Commissioning Process
• Obtaining Data
• Benchmarking
• Supply-Side Audit
• Develop the Plan
• Execute the Plan
• Measure and Verify Results

Obtaining Data
• Utility Bills
• Record Drawings
• Site Inspections
• Equipment Testing
• Equipment Submittals
• Control Diagrams
• EMS Review
• TAB Report
• Maintenance Staff
• Data Harvesting Tool

Utility Bills
• Alternative Service Arrangements– Master Metering
– Combined Billing
• Alternative Rates– Time of Use
– Real Time Pricing (RTP) Rates
– Interruptible Rates
• Alternative Riders– Transformation Credit
• Demand Side Management Programs– Grants
– Rebates
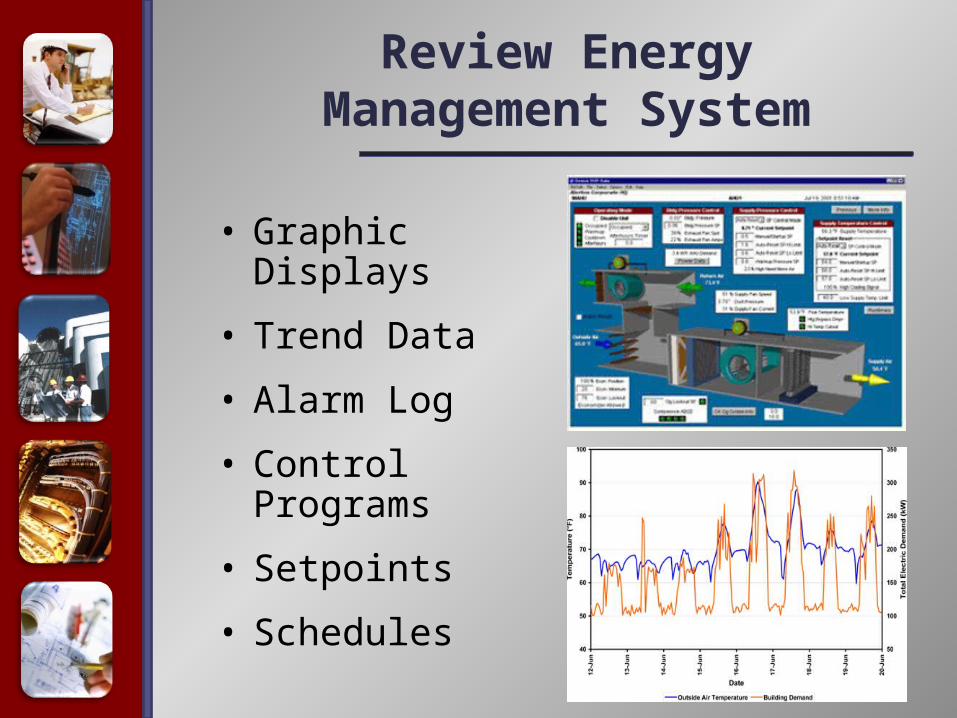
Review Energy Management System
• Graphic Displays
• Trend Data
• Alarm Log
• Control Programs
• Setpoints
• Schedules
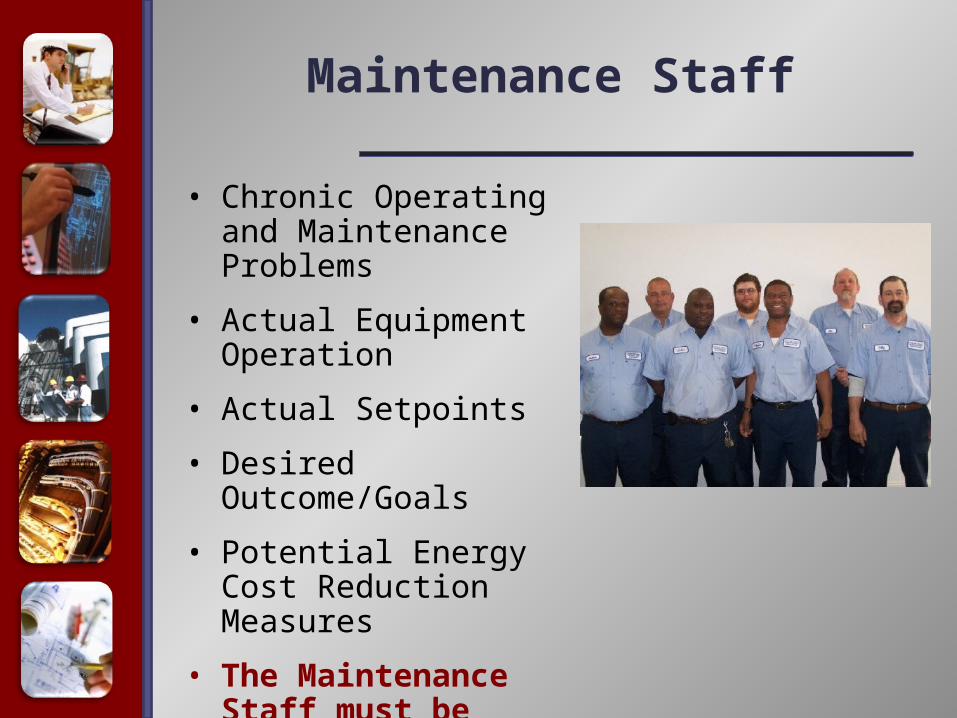
Maintenance Staff
• Chronic Operating and Maintenance Problems
• Actual Equipment Operation
• Actual Setpoints
• Desired Outcome/Goals
• Potential Energy Cost Reduction Measures
• The Maintenance Staff must be Stakeholders in the Process

Using a Commissioning Tool to Harvest Data and Find Opportunities
• Find all Air Terminals with Air Flow < 100 CFM and Damper Positions > 90%
−Air Terminals with Defective Air Flow Measurement Devices

Benchmarking Energy Consumption and Costs
• IFMA Handbooks
• ASHRAE Standard 90.1
• Leadership in Energy and Environmental Design (LEED)
• Performance Metrics
• EPA Energy Star
• ASHE E2C
• ASHE Benchmarking Program

Supply-Side Utility Audit
• Locate all Utility Meters (electricity, gas, & water) on a Site Plan
• Identify the Buildings Served by each Meter
• Check for Billing Errors
• Identify and Evaluate all Potential Metering Arrangements, Utility Rates, and Riders
• Implement the Procurement Strategy (Metering Arrangements, Rates, and Riders) that Yields the Lowest Unit Cost
• Update the Supply-Side Audit on an Annual Basis

Electricity Rate Analysis
• Alternative Rates and Riders
• Ratchet Clauses
• Delivery Voltage
• Meter Location
• Power Factor Penalties
• Combined Billing
• Master Metering
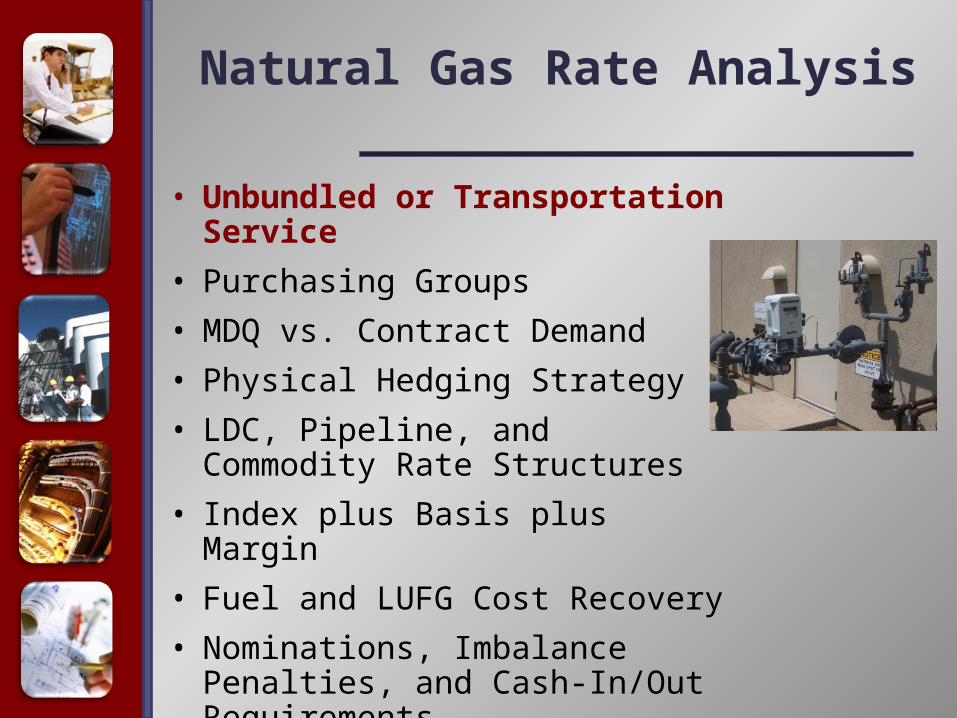
Natural Gas Rate Analysis
• Unbundled or Transportation Service
• Purchasing Groups
• MDQ vs. Contract Demand
• Physical Hedging Strategy
• LDC, Pipeline, and Commodity Rate Structures
• Index plus Basis plus Margin
• Fuel and LUFG Cost Recovery
• Nominations, Imbalance Penalties, and Cash-In/Out Requirements

Developing the Retro-Cx Plan
• Set a Primary Objective
• Identifying Available Resources
• Identifying and Evaluating Potential Energy Cost Reduction Measures
• Prioritize and Select Potential Energy Cost Reduction Measures
• Obtain Capital Funding
• Set Intermediate Goals

Developing the Retro-Commissioning Plan
(continued)
• Establish a Timetable
• Implement Energy Cost Reduction Measures
• Measure and Verify Progress
• Mid-Course Corrections
• Acknowledge and Celebrate Success
• Update and Extend the Plan


Identifying and Evaluating Potential Energy Cost Reduction Measures
• Comprehensive Review of Entire Facility
• Consider all Available Data
• Consider New and Proven Technology
• Computer Simulation Programs
• Conceptual Designs• Conceptual Cost
Estimates• ECRM Interdependencies• Simple Payback (cost to
benefit ratio)

ECRM Summary
ECRM Number ECRM Name
ECRM Values
Savings($/year)
Cost($)
Payback(years)
1 Lighting Retrofit 390,663 1,537,836 3.9
2 SRC Boiler Replacement 30,000 277,000 9.2
3 Vacuum Pump Replacement 14,000 35,000 2.5
4 CVOR Chiller Bypass 191,114 1,000,000 5.2
5 NW AHU Modification 122,810 982,483 8.0
6 HVAC Modifications 542,757 225,000 0.4
7 Electricity Tiime Of Use Rate Change 446,779 0 0.0
8 Power Factor Correction 19,996 118,798 5.9
9 Natural Gas Negotiated Distribution Rate 425,000 0 0.0
10 Eliminate Steam Take or Pay Contract Provision 350,000 0 0.0
11 SWT AHU-1 & 2 Modification 46,732 600,000 12.8
12 SWT VAV Retrofit 182,969 800,000 4.4
13 JT & SW VAV Retrofit 44,733 222,593 5.0

Obtain Capital Funding
• Promote Energy Conservation within Department and Organization
• Capture Savings from Gas Hedging Activities and Electricity Rate Savings in Same Budget Year
• Participate in Utility Energy Efficiency Programs
• Participate in Revolving Loan Fund
• Capture Savings from Prior Energy Conservation Projects and Reinvest in new Projects

Set Intermediate Goals
E2CE2C
E2C
BaselineCurrent
Energy Star
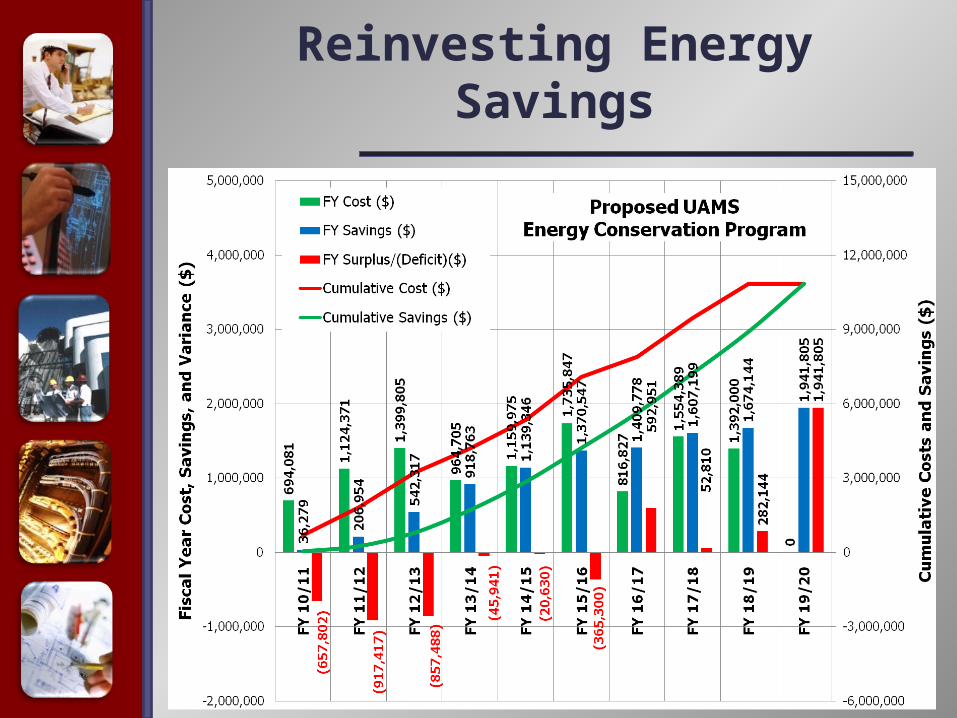
Reinvesting Energy Savings

• Lighting• Air Terminals• Fan Coil Units• Chilled Water
System• Heating Water
System• Steam System• Operating Rooms
• Cath Labs• AII Rooms• Exhaust Fans• Kitchen Hoods• DHW System• Air Handling Units
Executing the Retro-Commissioning Plan

Air Terminals
• Occupied Air Flow Setpoints– Cooling Minimum and Maximum
– Heating Minimum and Maximum
• Unoccupied Air Flow Setpoints– Cooling Minimum and Maximum
– Heating Minimum and Maximum
• Temperature Setpoints– Occupied Minimum and Maximum (68 to 75
deg. F)
– Unoccupied Cooling and Heating Setpoints
• Occupancy Sensors and/or Weekly Schedule
• Reheat Valve opens before Air Flow is Increased
• Most Significant Energy Conservation Opportunity in a Healthcare Facility!
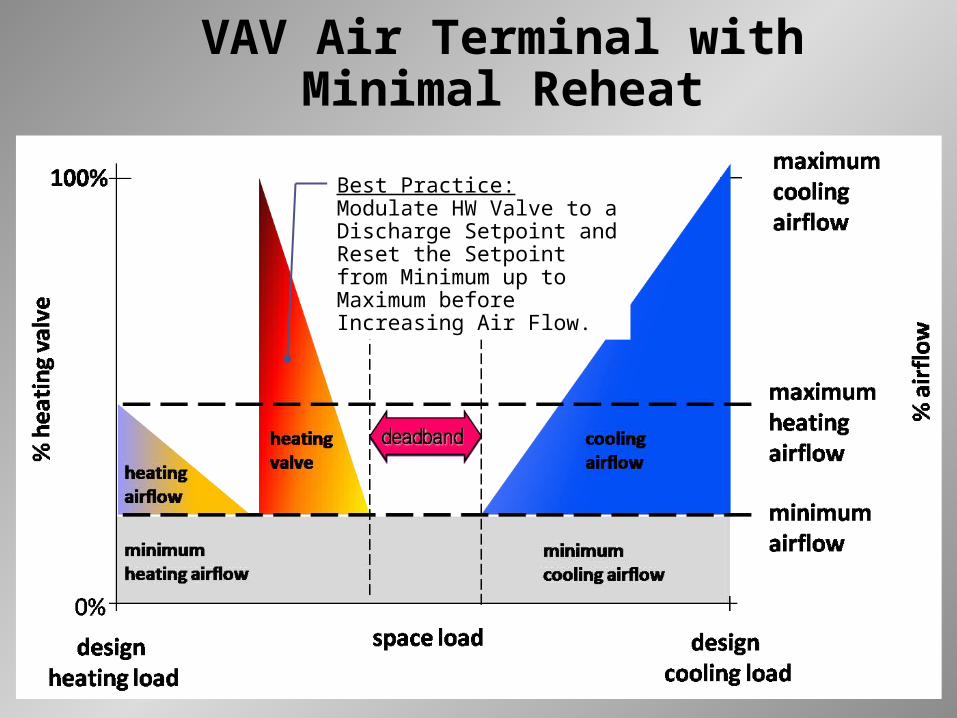
VAV Air Terminal with Minimal Reheat
Best Practice: Modulate HW Valve to a Discharge Setpoint and Reset the Setpoint from Minimum up to Maximum before Increasing Air Flow.

Measuring and Verifying Retro-Commissioning
Results

Case Study Results
Item Before AfterSavings
(%)
Electricity Consumption (kWh) 7,808,800 5,249,800 32.8
Average Peak Demand (kW) 1,230 929 24.5
Electricity Consumption (kWh/SF/year)
44.0 29.6 32.8
Average Peak Demand (watts/SF) 6.93 5.23 24.5
Natural Gas Consumption (MMBtu) 43,114 23,523 45.4
Natural Gas Consumption (Therms/SF/year)
2.43 1.33 45.4
Total Energy Consumption (MMBTU)
70,137 41,457 40.9
Energy Utilization Index (kBTU per SF)
393 233 40.6
Total Energy Cost ($/year) 916,182 540,058 41.1
Energy Cost Index ($/SF/year) 5.16 3.04 41.1

Case Study Retro-Cx Costs
Preliminary Energy Audit $8,350
Phase 1A and 1B $199,439
Total Cost ($) $207,789

Case Study Pump Balancing
• Triple Duty Valves at Pump Discharge Nearly Closed
• VFD’s Operating at Full Speed
• Bulk of Motor Energy Wasted at Balancing Valve
Triple Duty Valve
VFD
100%

Recommendations
• Do not Stop with LEED
• Performance Contracting should be a Last Resort
• Develop an Act 1494 Compliance Handbook for State Agencies (stress LCC based decision making)
• Spend Your Gift Wisely
• Develop a State Facility Energy Consumption and Cost Reporting System
• Benchmark all State Facilities
Recommendations
• Open the Revolving Loan Fund to Higher Education
• Increase Participation in Utility Energy Efficiency Programs
• Implement Supply-Side Audits
• Increase Participation in Utility Purchasing Group
• Implement Lighting Audits and Lighting Retrofits
• Implement Retro-Commissioning
Recommendations
• Reinvest Energy Savings
• Increase State Facility Participation in the Utility Rate Making Process
– Entergy System Agreement
– Real Time Pricing Program
– Indemnification Clauses
– Combined Billing and Master Metering
– Cost of Service Based Cost Allocation and Rate Designs


