6. Performing Organization Code Retrofit Methods for Distortion Cracking Problems in Plate Girder Bridges
7. Author(s) 8. Performing Organization Report No. T.J. Wipf, L.F. Greimann, D.L. Wood, B.M. Phares, and D. Tarries 99-50 9. Performing Organization Name and Address 10. Work Unit No. (TRAIS)
11. Contract or Grant No.
Center for Transportation Research and Education Iowa State University 2901 South Loop Drive, Suite 3100 Ames, IA 50010-8634
12. Sponsoring Organization Name and Address 13. Type of Report and Period Covered Final Report
14. Sponsoring Agency Code Iowa Highway Research Board 800 Lincoln Way Ames, IA 50010
15. Supplementary Notes
16. Abstract
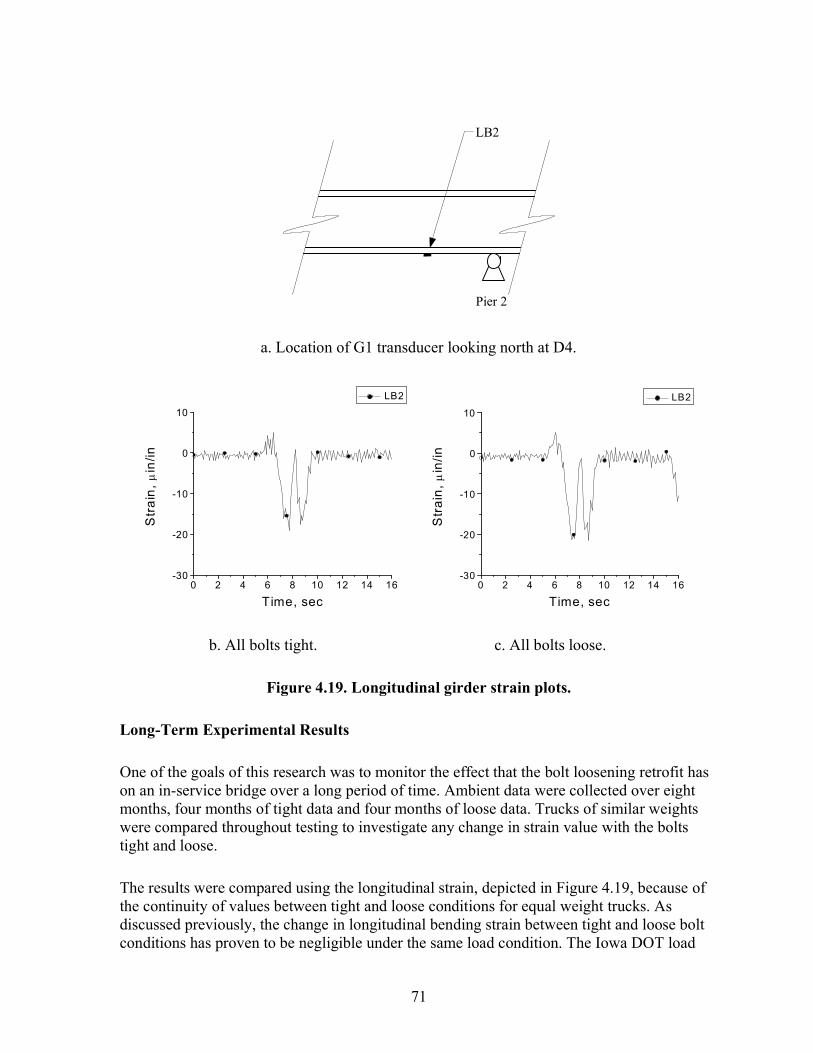
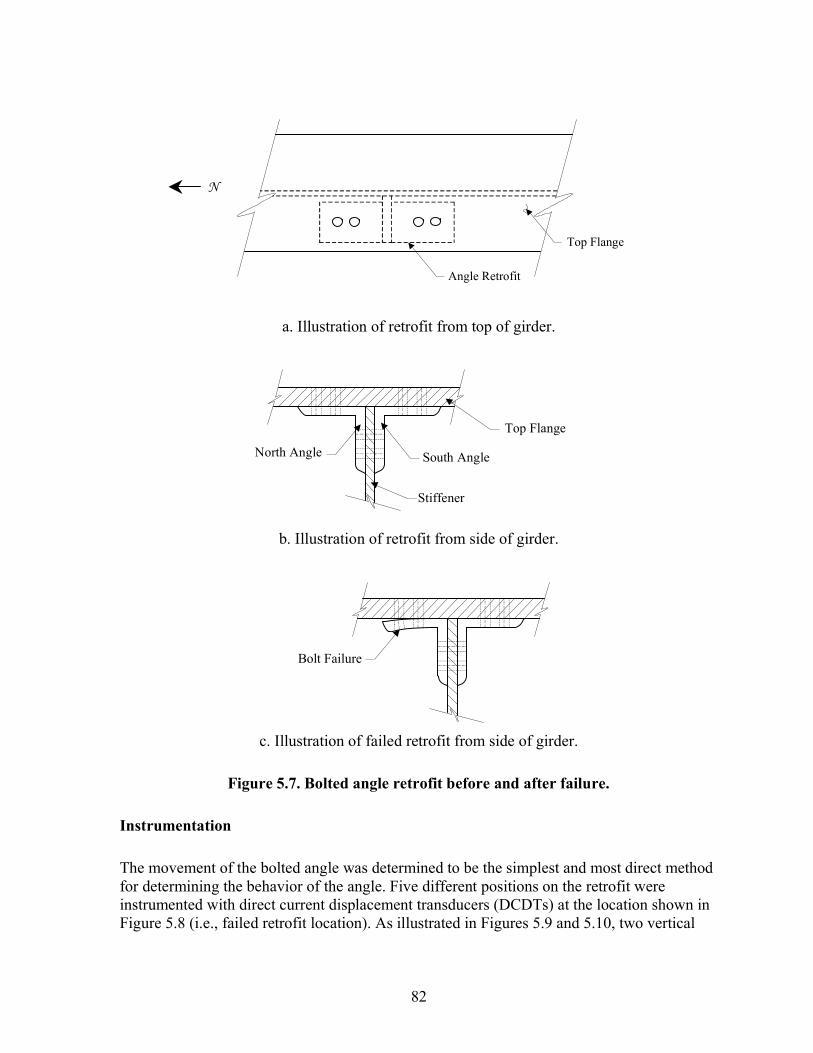
This report is formatted to independently present four individual investigations related to similar web gap fatigue problems. Multiple steel girder bridges commonly exhibit fatigue cracking due to out-of-plane displacement of the web near the diaphragm connections. This fatigue-prone web gap area is typically located in negative moment regions of the girders where the diaphragm stiffener is not attached to the top flange. In the past, the Iowa Department of Transportation has attempted to stop fatigue crack propagation in these steel girder bridges by drilling holes at the crack tips. Other nondestructive retrofits have been tried; in a particular case on a two-girder bridge with floor beams, angles were bolted between the stiffener and top flange. The bolted angle retrofit has failed in the past and may not be a viable solution for diaphragm bridges. The drilled hole retrofit is often only a temporary solution, so a more permanent and effective retrofit is required. A new field retrofit has been developed that involves loosening the bolts in the connection between the diaphragm and the girders. Research on the retrofit has been initiated; however, no long-term studies of the effects of bolt loosening have been performed.
The intent of this research is to study the short-term effects of the bolt loosening retrofit on I-beam and channel diaphragm bridges. The research also addressed the development of a continuous remote monitoring system to investigate the bolt loosening retrofit on an X-type diaphragm bridge over a number of months, ensuring that the measured strain and displacement reductions are not affected by time and continuous traffic loading on the bridge.
The testing for the first three investigations is based on instrumentation of web gaps in a negative moment region on Iowa Department of Transportation bridges with I-beam, channel, and X-type diaphragms. One bridge of each type was instrumented with strain gages and deflection transducers. Field tests, using loaded trucks of known weight and configuration, were conducted on the bridges with the bolts in the tight condition and after implementing the bolt loosening retrofit to measure the effects of loosening the diaphragm bolts. Long-term data were also collected on the X-diaphragm bridge by a data acquisition system that collected the data continuously under ambient truck loading. The collected data were retrievable by an off-site modem connection to the remote data acquisition system. The data collection features and ruggedness of this system for remote bridge monitoring make it viable as a pilot system for future monitoring projects in Iowa.
Results indicate that loosening the diaphragm bolts reduces strain and out-of-plane displacement in the web gap, and that the reduction is not affected over time by traffic or environmental loading on the bridge. Reducing the strain in the web gap allows the bridge to support more cycles of loading before experiencing fatigue, thus increase the service life of the bridge.
Two-girder floor beam bridges may also exhibit fatigue cracking in girder webs. The fourth investigation describes a bridge that was retrofitted with bolted angles at the connection between the top flange and the web stiffener. The retrofit failed and was repaired. A short-term load test was completed to determine the behavior and effectiveness of the repaired retrofit. Testing indicated large displacements, and data suggest the retrofit was ineffective. The study concluded that the bridge should be inspected frequently for signs of failure in the retrofit and cracking in the web.
17. Key Words 18. Distribution Statement diaphragm bolt, distortion cracking, retrofit method, steel girder bridge, web gap fatigue No restrictions.
19. Security Classification (of this report) 20. Security Classification (of this page) 21. No. of Pages 22. Price Unclassified. Unclassified. 125 N/A
CHAPTER 1. GENERAL INTRODUCTION ..........................................................................1 Overview..............................................................................................................................1 Literature Review.................................................................................................................2
Steel Girder Bridge Literature Review ..........................................................................2 Health Monitoring Literature Review............................................................................4
CHAPTER 2. BOLT LOOSENING RETROFIT FOR FATIGUE CRACKING IN STEEL GIRDER BRIDGES WITH I-BEAM DIAPHRAGMS ............................................................7
Abstract ................................................................................................................................7 Introduction..........................................................................................................................7 Previous Research................................................................................................................8 Bridge Description ...............................................................................................................9 Bridge Behavior and Condition .........................................................................................12 Instrumentation ..................................................................................................................15 Field Test Description........................................................................................................19 Experimental Results .........................................................................................................21Conclusions........................................................................................................................26 Implementation Issues .......................................................................................................27 References..........................................................................................................................27
CHAPTER 3. BOLT LOOSENING RETROFIT FOR FATIGUE CRACKING IN STEEL GIRDER BRIDGES WITH CHANNEL DIAPHRAGMS......................................................29
CHAPTER 5. TESTING OF BOLTED STIFFENER RETROFIT ON I-29 FLOOR BEAM STEEL GIRDER BRIDGE......................................................................................................76
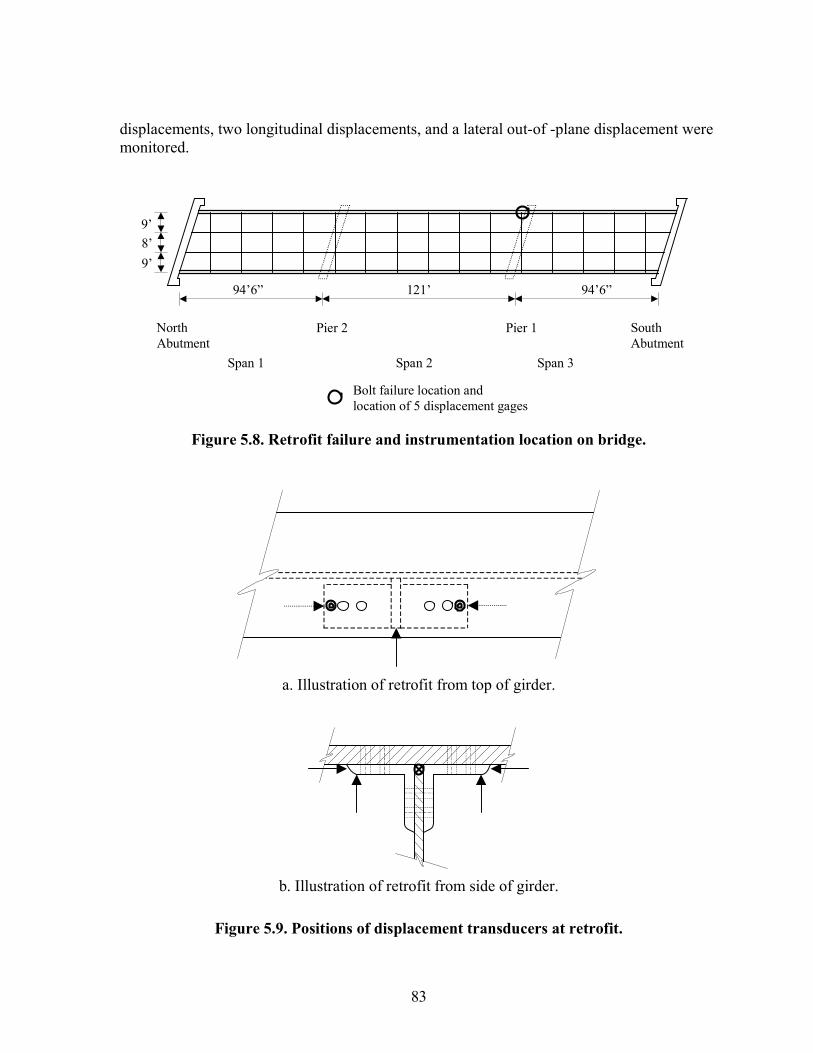
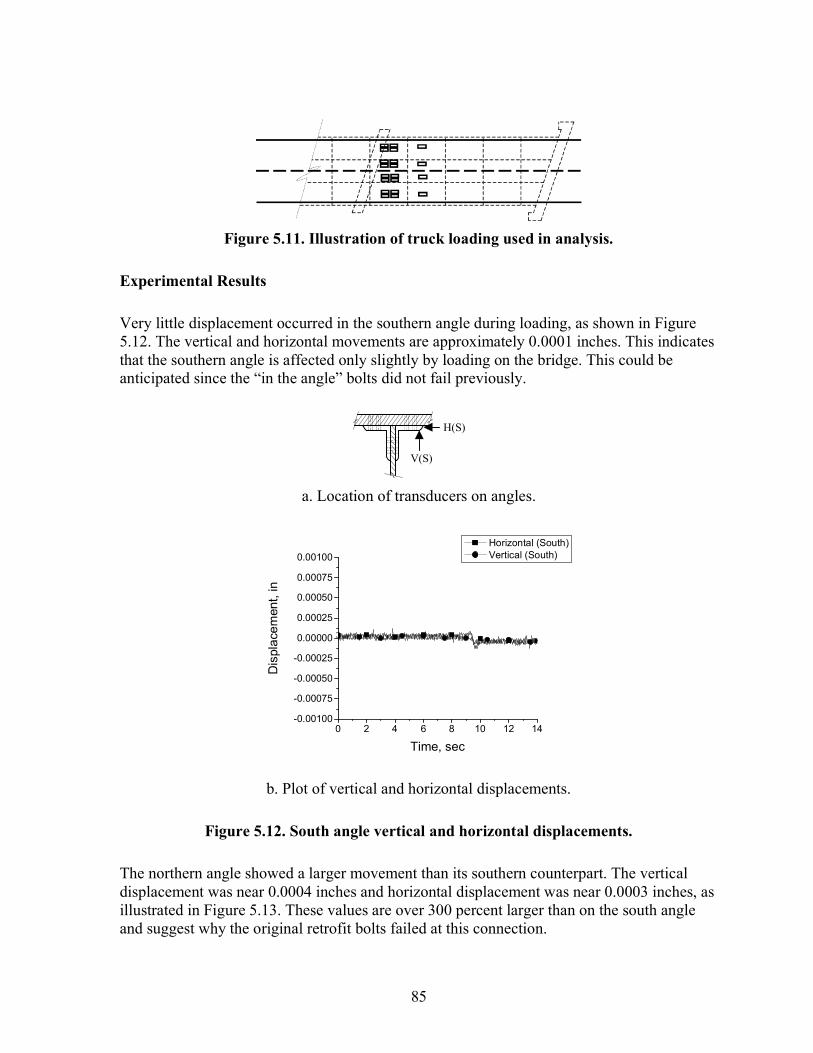
Abstract ..............................................................................................................................76 Introduction........................................................................................................................76 Bridge Description .............................................................................................................77 Bridge Behavior and Condition .........................................................................................81 Instrumentation ..................................................................................................................82 Field Test Description........................................................................................................84 Experimental Results .........................................................................................................85Conclusions........................................................................................................................87
CHAPTER 6. GENERAL CONCLUSIONS...........................................................................88 Summary and Discussion...................................................................................................88 Recommendations for Future Research .............................................................................89
APPENDIX A. AASHTO STABILITY CALCULATIONS FOR LATERAL BRACING ADEQUACY OF I-80 BRIDGE ASSUMING DIAPHRAGMS REMOVED .......................91
APPENDIX B. AASHTO STABILITY CALCULATIONS FOR LATERAL BRACING ADEQUACY OF I-35 BRIDGE ASSUMING DIAPHRAGMS REMOVED .....................103
APPENDIX C. AASHTO STABILITY CALCULATIONS FOR LATERAL BRACING ADEQUACY OF IA-17 BRIDGE ASSUMING DIAPHRAGMS REMOVED ..................113
Figure 2.1. Photograph of test bridge looking northwest.......................................................... 9 Figure 2.2. Bridge cross section looking toward direction of traffic. ..................................... 10 Figure 2.3. Plan view of bridge superstructure. ...................................................................... 10 Figure 2.4. Profile illustration of original interior girder........................................................ 11 Figure 2.5. Photograph of underside of the bridge looking northwest. .................................. 11 Figure 2.6. Diagram of typical diaphragm/girder connection in negative moment region..... 12 Figure 2.7. Photograph of typical web gap. ............................................................................ 12 Figure 2.8. Exaggerated illustration of diaphragm bending due to differential deflection..... 13 Figure 2.9. Depiction of web gap double bending.................................................................. 13 Figure 2.10. Locations of confirmed cracks and drilled hole retrofits.................................... 14 Figure 2.11. Photograph of typical drilled hole retrofit in a web. .......................................... 14 Figure 2.12. Plan view of gage placement. ............................................................................. 15 Figure 2.13. Web gap gradient instrumentation...................................................................... 16 Figure 2.14. D1 strain instrumentation looking east and south. ............................................. 17 Figure 2.15. Out-of-plane displacement instrumentation. ...................................................... 18 Figure 2.16. Test truck configuration. .................................................................................... 19 Figure 2.17. Test truck placement on bridge deck.................................................................. 20 Figure 2.18. Illustration of bolt loosening condition with bottom row tight. ......................... 21 Figure 2.19. G1 south gradient strain plots............................................................................. 22 Figure 2.20. G2 north gradient strain plots. ............................................................................ 23 Figure 2.21. D1 bending strain plots....................................................................................... 24 Figure 2.22. G1 and G2 out-of-plane displacement plots....................................................... 25 Figure 3.1. Photograph of test bridge looking northeast......................................................... 31 Figure 3.2. Plan view of bridge superstructure. ...................................................................... 32 Figure 3.3. Cross section of bridge looking in direction of traffic. ........................................ 32 Figure 3.4. Negative and positive moment region cross section of a girder........................... 33 Figure 3.5. Underside view of diaphragm and girders............................................................ 34 Figure 3.6. Diaphragm/girder connection in negative moment region................................... 34 Figure 3.7. Typical web gap in negative moment region. ...................................................... 35 Figure 3.8. Exaggerated illustration of diaphragm double bending........................................ 36 Figure 3.9. Web gap double bending due to diaphragm rotation............................................ 36 Figure 3.10. Confirmed crack and drilled hole retrofit locations. .......................................... 37 Figure 3.11. Typical drilled hole retrofit in web with continued cracking. ............................ 38 Figure 3.12. Plan view of gage placement. ............................................................................. 38 Figure 3.13. Web gap gradient instrumentation...................................................................... 39 Figure 3.14. Diaphragm strain instrumentation looking northeast and southeast................... 40 Figure 3.15. Out-of-plane displacement instrumentation ....................................................... 41 Figure 3.16. Test truck configurations. ................................................................................... 42 Figure 3.17. Middle row tight diaphragm bolt condition........................................................ 42 Figure 3.18. Test truck placement on bridge in lanes. ............................................................ 43 Figure 3.19. G1 gradient gage strain plots.............................................................................. 45 Figure 3.20. G2 gradient gage strain plots.............................................................................. 46 Figure 3.21. D3 bending strain plots....................................................................................... 47
vi
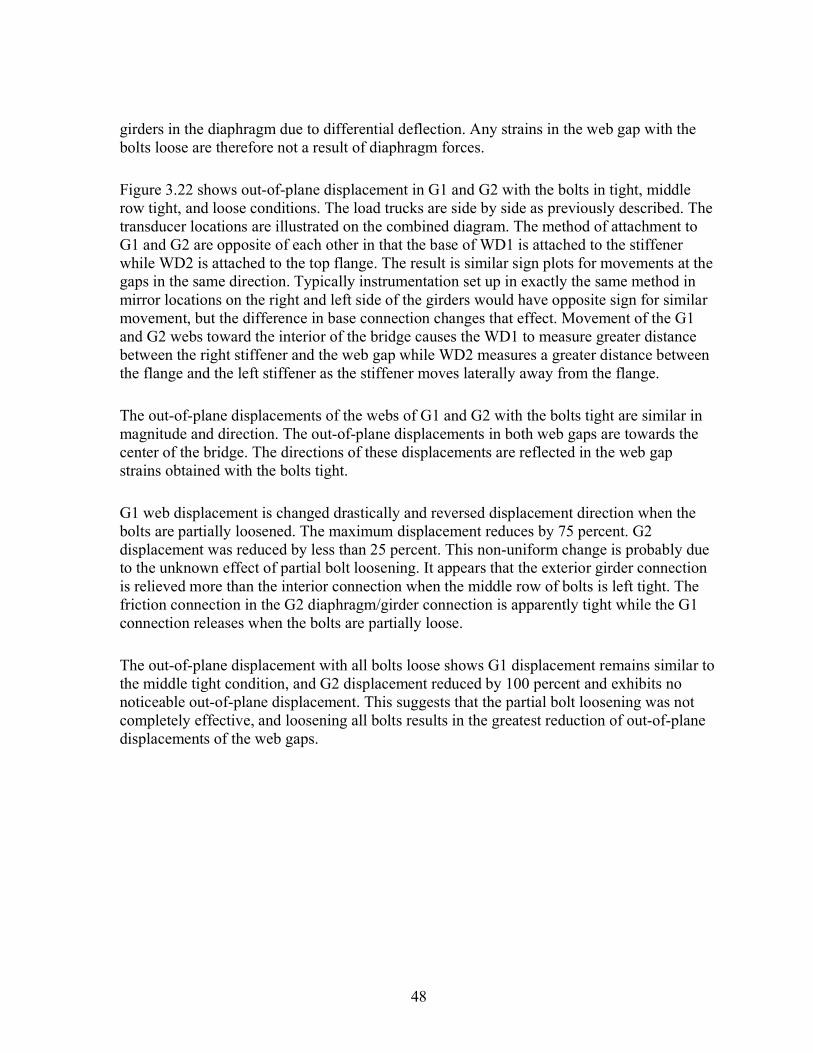
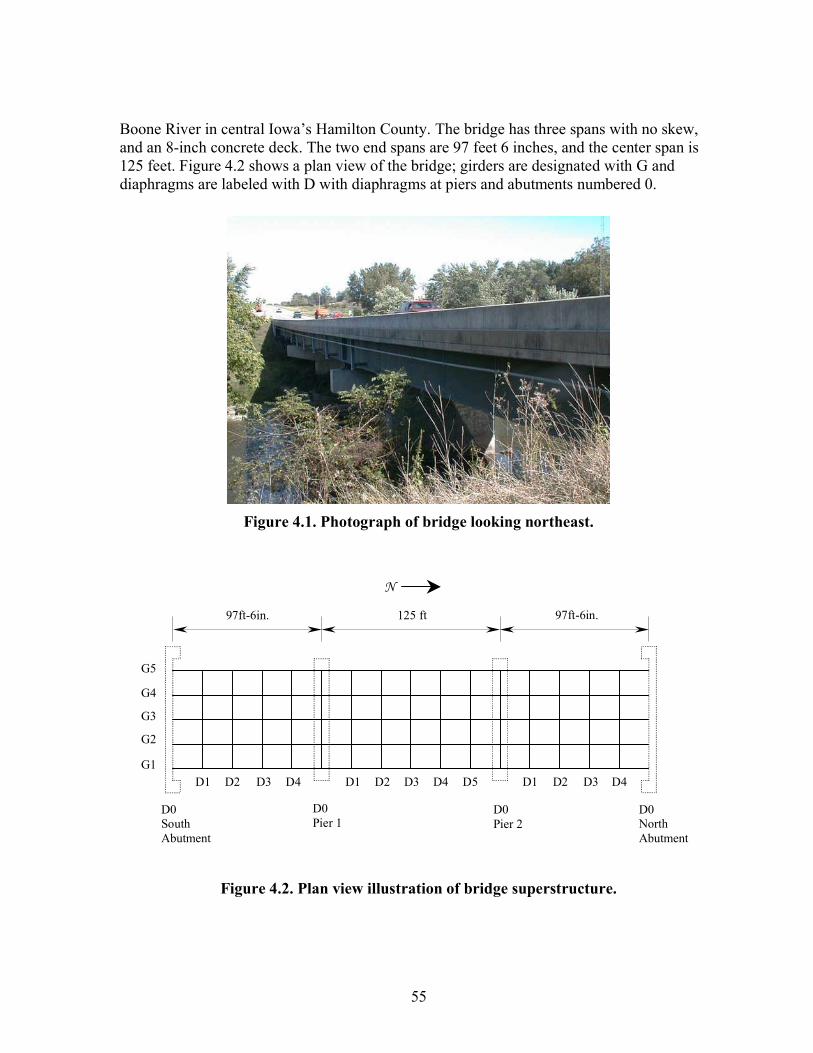
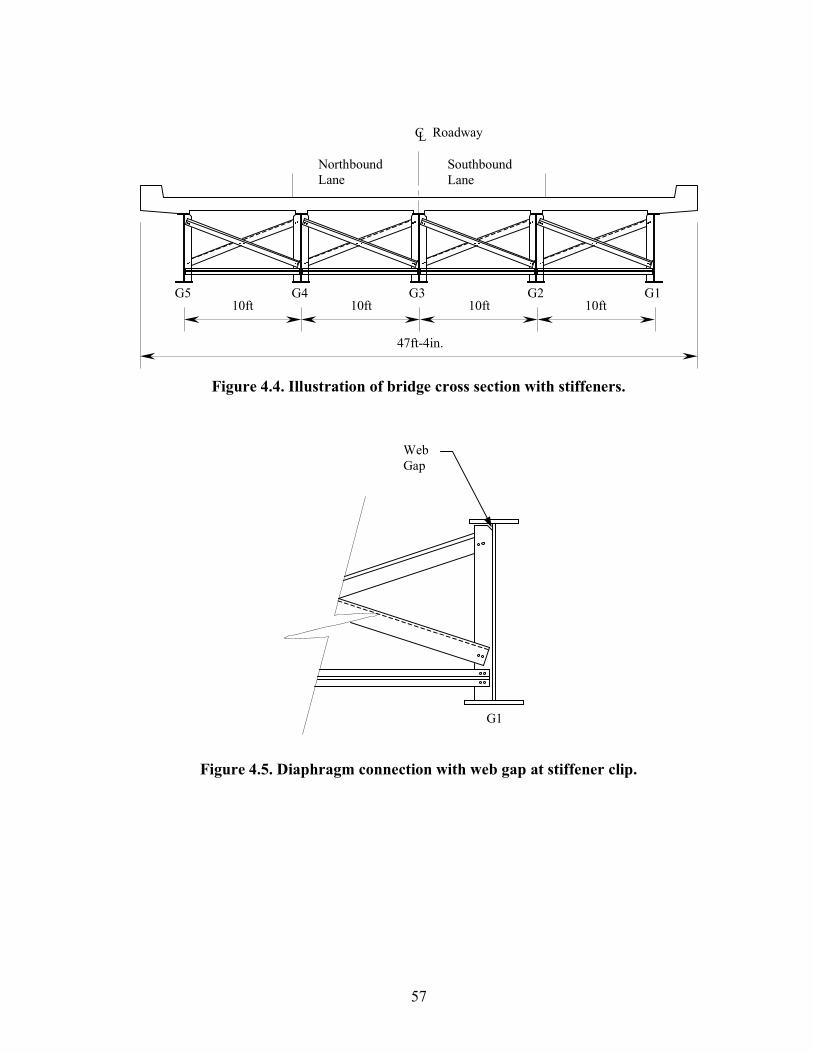
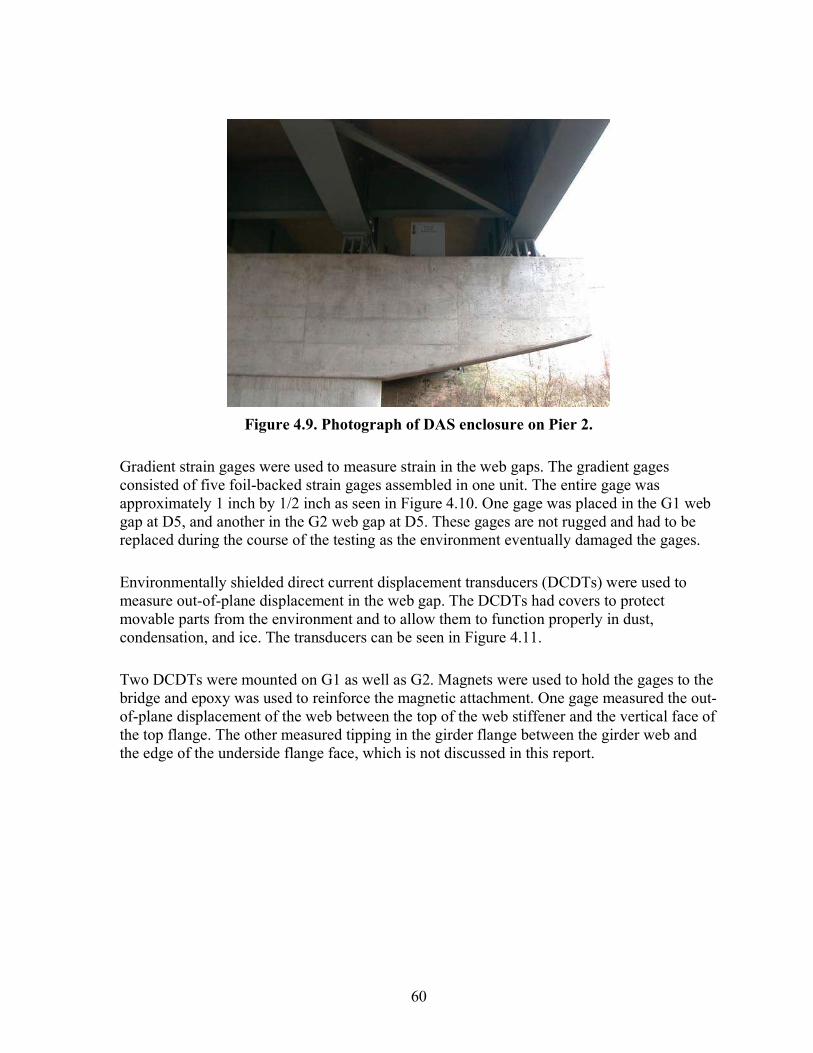
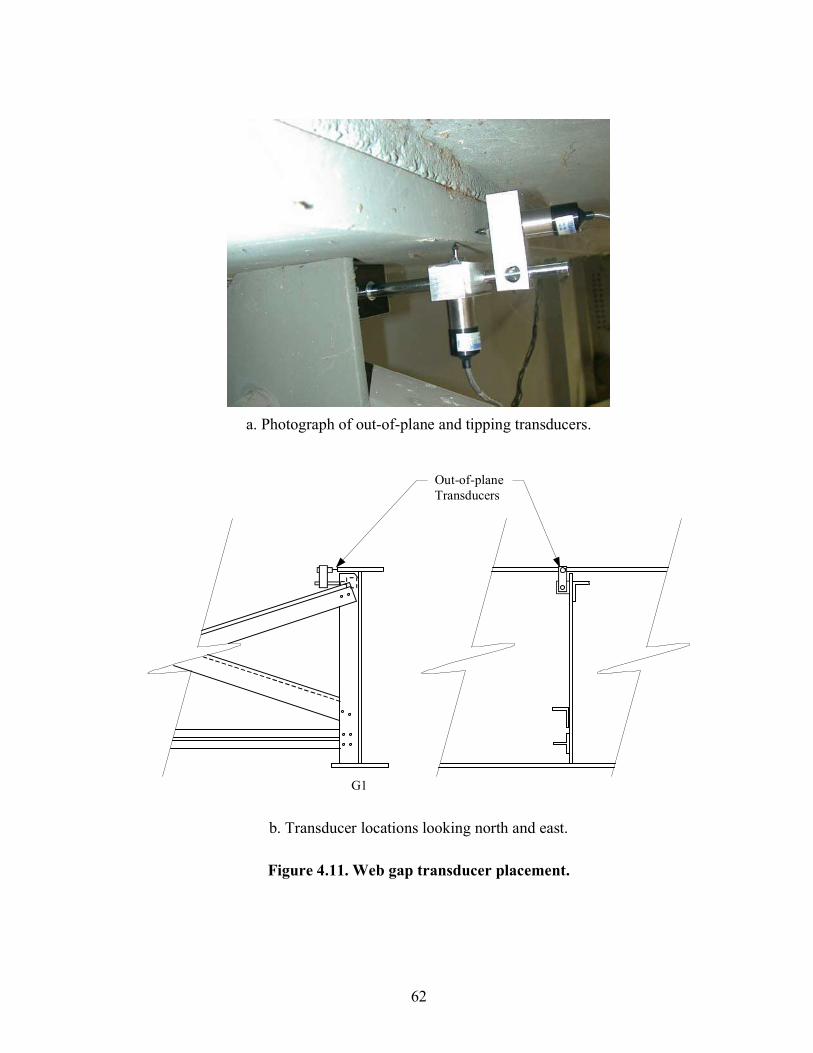
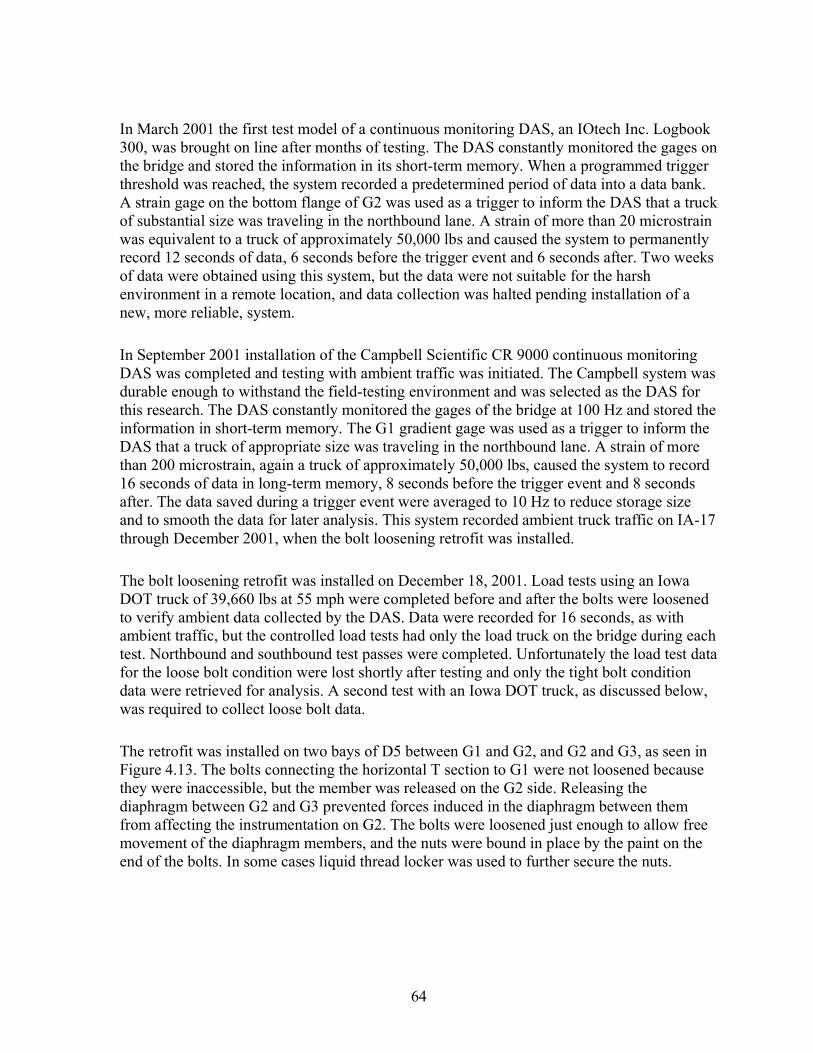
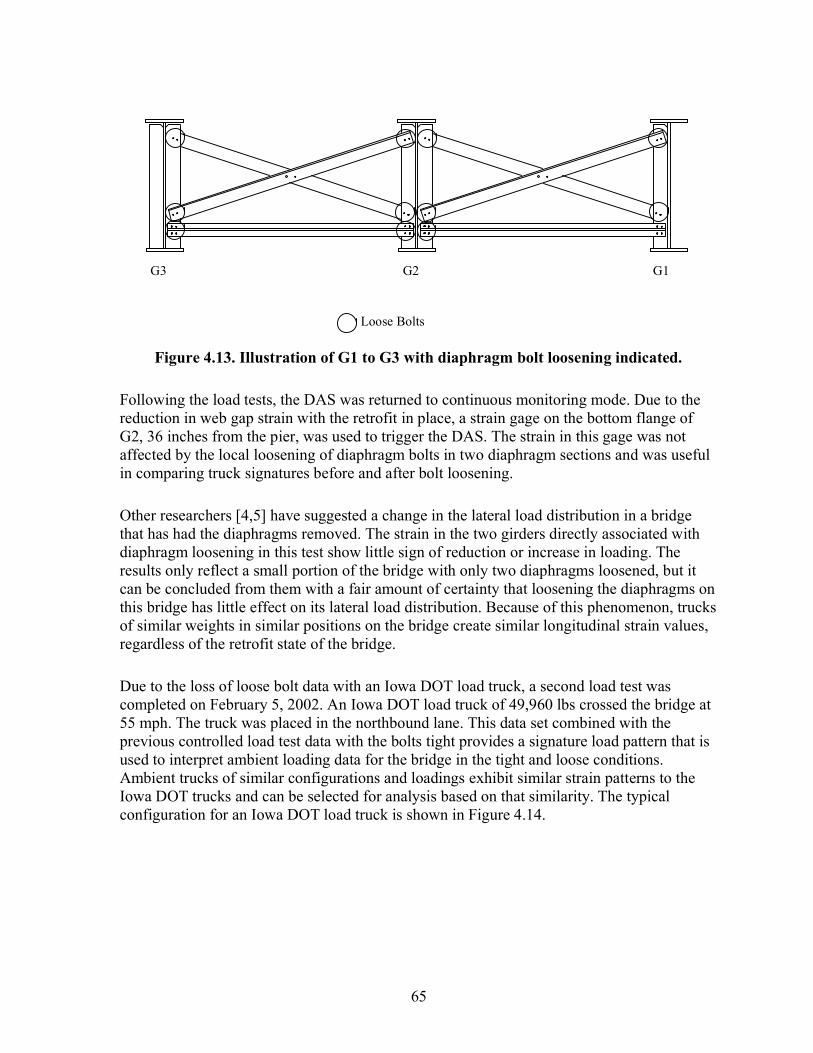
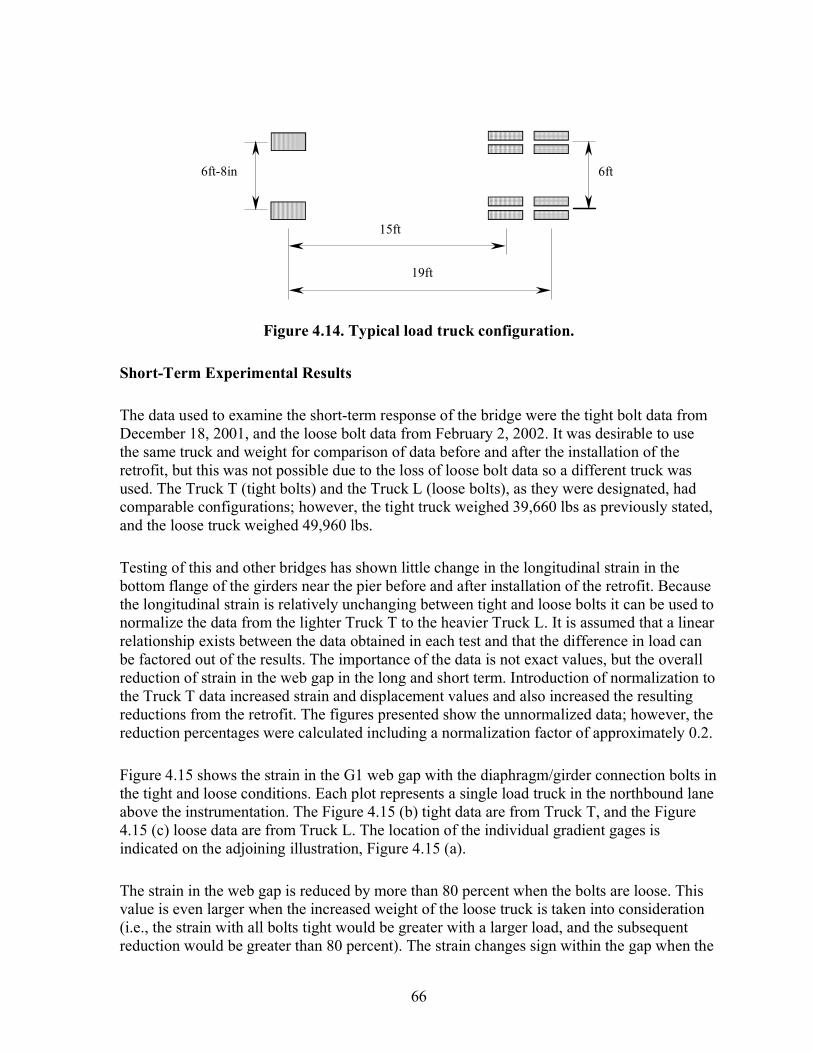
Figure 3.22. G1 and G2 out-of-plane displacement plots....................................................... 49 Figure 4.1. Photograph of bridge looking northeast. .............................................................. 55 Figure 4.2. Plan view illustration of bridge superstructure..................................................... 55 Figure 4.3. Profile illustration of exterior girder with plates labeled...................................... 56 Figure 4.4. Illustration of bridge cross section with stiffeners. .............................................. 57 Figure 4.5. Diaphragm connection with web gap at stiffener clip.......................................... 57 Figure 4.6. Photograph of typical web gap. ............................................................................ 58 Figure 4.7. Web gap bending from diaphragm rotation.......................................................... 58 Figure 4.8. Instrumentation locations on superstructure......................................................... 59 Figure 4.9. Photograph of DAS enclosure on Pier 2............................................................... 60 Figure 4.10. Web gap gradient gage location. ........................................................................ 61 Figure 4.11. Web gap transducer placement........................................................................... 62 Figure 4.12. Diaphragm gage location looking north and east. .............................................. 63 Figure 4.13. Illustration of G1 to G3 with diaphragm bolt loosening indicated..................... 65 Figure 4.14. Typical load truck configuration. ....................................................................... 66 Figure 4.15. G1 gradient strain plots. ..................................................................................... 67 Figure 4.16. G2 gradient strain plots. ..................................................................................... 68 Figure 4.17. D4 strain plots..................................................................................................... 69 Figure 4.18. Web Gap out-of-plane displacement plots. ........................................................ 70 Figure 4.19. Longitudinal girder strain plots. ......................................................................... 71 Figure 4.20. Maximum G1 web gap strains and G2 longitudinal strains for individual truck
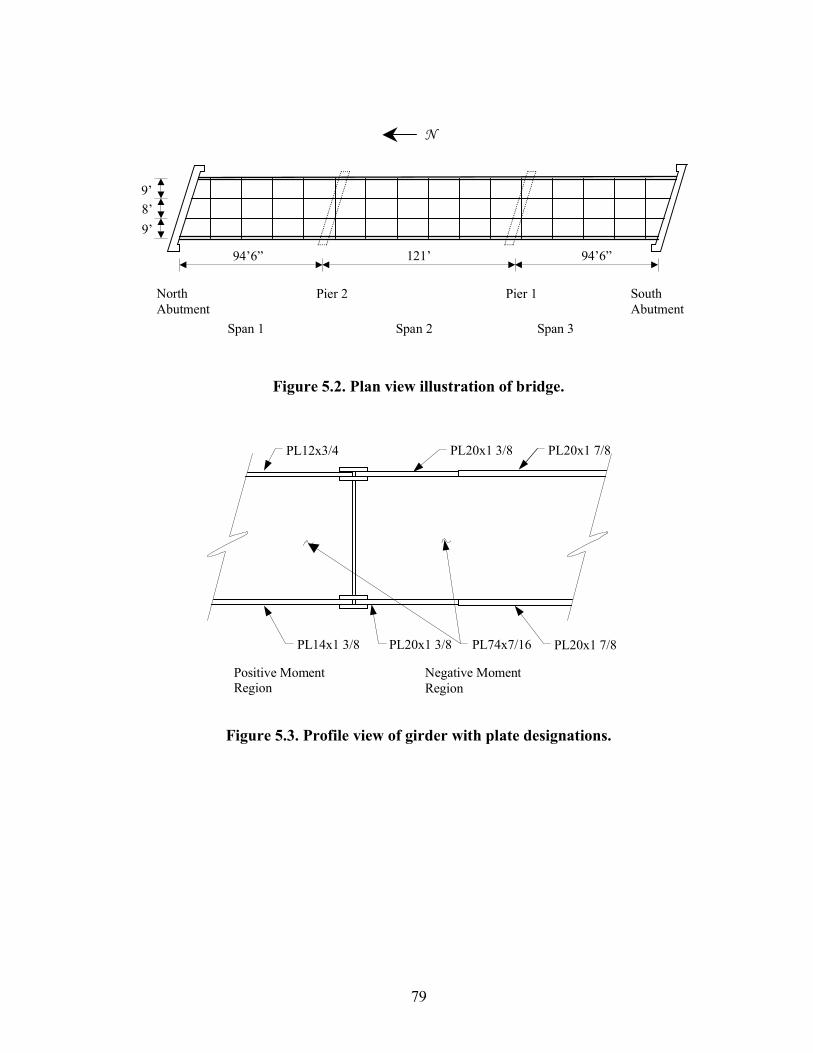
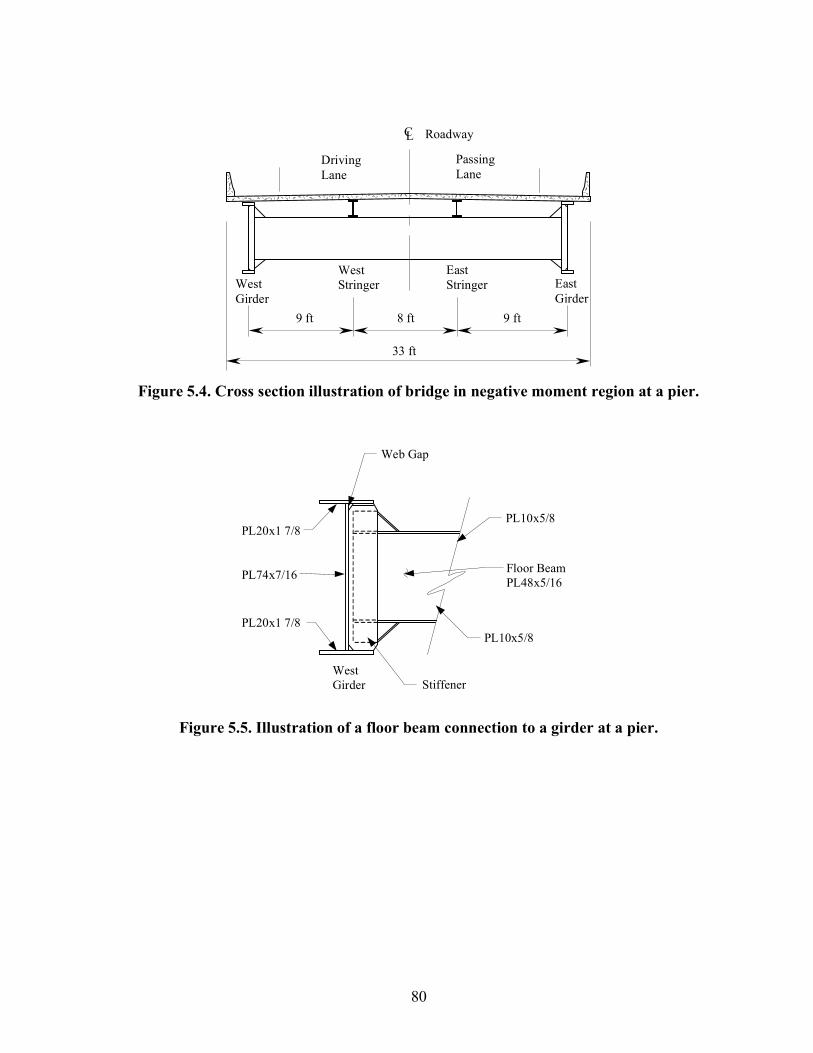
loadings. .......................................................................................................................... 72 Figure 5.1. Photographs of bridge........................................................................................... 78 Figure 5.2. Plan view illustration of bridge. ........................................................................... 79 Figure 5.3. Profile view of girder with plate designations...................................................... 79 Figure 5.4. Cross section illustration of bridge in negative moment region at a pier............. 80 Figure 5.5. Illustration of a floor beam connection to a girder at a pier. ................................ 80 Figure 5.6. Photograph of repaired retrofit at floor beam connection. ................................... 81 Figure 5.7. Bolted angle retrofit before and after failure. ....................................................... 82 Figure 5.8. Retrofit failure and instrumentation location on bridge. ...................................... 83 Figure 5.9. Positions of displacement transducers at retrofit.................................................. 83 Figure 5.10. Photograph of displacement transducers at retrofit. ........................................... 84 Figure 5.11. Illustration of truck loading used in analysis...................................................... 85 Figure 5.12. South angle vertical and horizontal displacements. ........................................... 85 Figure 5.13. North angle vertical and horizontal displacements. ........................................... 86 Figure 5.14. Out-of-plane displacement at retrofit. ................................................................ 87
vii
ACKNOWLEDGMENTS
This project, “Retrofit Methods for Distortion Cracking Problems in Plate Girder Bridges,” was sponsored by the Iowa Highway Research Board (TR-436).
The authors would like to acknowledge the efforts of numerous Iowa Department of Transportation personnel who helped with the field testing. In particular, the authors are appreciative of the comments and technical input provided by the staff within the Office of Bridges and Structures. The authors would like to provide special mention to Bruce Brakke, who provided numerous technical information and assistance. Other personnel within maintenance and inspection are also thanked for their assistance.
1
CHAPTER 1. GENERAL INTRODUCTION
Overview
The Iowa Department of Transportation (Iowa DOT) has struggled with the problem of fatigue in steel girder bridges for many years. Many of Iowa’s 908 steel girder bridges have been in service for more than 30 years and signs of age are beginning to appear. Sixty-three of those bridges are considered by the Iowa DOT to be fracture critical. Approximately 55 percent of the fracture critical bridges have been developing fatigue cracks in the girder webs at connections with the diaphragms, especially in interstate bridges. Engineers are most concerned about bridges with large average daily traffic loads, such as interstates, because of the large loads and frequency of load cycles. In the 1980s, the Iowa DOT began installing a drilled hole retrofit at the terminus of the fatigue cracks in an attempt to slow the propagation of the cracking by changing the stress concentration at the crack tips. This retrofit has not always been successful in controlling fatigue cracking. The failure could be the result of two scenarios. The hole may not have been drilled at the actual crack terminus due to difficulty in visually locating this point or the stress cycles created in the web may be too great to be controlled by the drilled hole retrofit. The result for both is continued crack growth.
Regardless of the cause of continued cracking in steel girder bridges, the Iowa DOT sanctioned research on a different retrofit to replace drilling. In the 1990s, research was conducted at Iowa State University on a new retrofit based on reducing the cause of the fatigue cracking in the webs of multiple steel girder bridges, rather than controlling the symptom by drilling. This retrofit was based on an understanding of the response of the bridge superstructure to traffic loading. Researchers concluded that cracking in the webs near the diaphragms is primarily the result of forces transferred to the girders by the diaphragms. Differential deflection of the girders with varying traffic loads creates a resisting force in the diaphragms because of the rigid connection with the girders. This force acts directly on the girder webs and causes out-of-plane displacement. Over time, the out-of-plane displacement results in fatigue cracking, especially in bridges with greater and heavier traffic loading.
Given this information, the new retrofit consisted of loosening the bolts at diaphragm/girder connections to relieve the force generated by the diaphragms and differential deflection of the girders. Loosening the bolts in the diaphragm/girder connection allows the diaphragms to rotate with the differential deflection instead of bending the web. Two-girder bridges with floor beams experience the same type of web cracking; however, the bolt loosening retrofit is not a suitable solution. In anticipation of fatigue cracking, in the early 1980s a bolted angle retrofit was used on a bridge on Interstate 80. Two angle pieces were used to connect the stiffener to the top flange at a floor beam connection in a negative moment region where fatigue cracking had occurred. This retrofit was tested as a portion of the retrofit research; however, the bulk of the study involves multiple steel girder bridges with diaphragms.
Testing of the retrofit was carried out through short-term field testing of K-type and X-type diaphragm bridges [1,2]. Test bridges were instrumented with strain gages and displacement
2
gages. Load tests were completed on the bridge before and after the bolts were loosened in a sample diaphragm area. Following testing, the bolts were returned to the tight condition.
The results from these tests showed that the bolt loosening retrofit reduced strain and displacement in the web gap a considerable amount; however, several questions were raised about the implementation of this retrofit on in-service bridges. These include how effective the retrofit is on other types of diaphragm bridges, what the long-term effects of the retrofit on the superstructure are, and how the stability of the girders is affected by loosening the diaphragms. These questions led to the current research at Iowa State University involving the bolt loosening retrofit. This research focused on determining the viability of implementing bolt loosening as a practically applicable retrofit for web gap fatigue cracking. This report presents the changes in bridge response before and after the retrofit was installed, highlighting the cause and effect of the retrofit on strain and displacement of the girder webs.
Field testing was performed on an I-beam diaphragm bridge and a channel diaphragm bridge to study the effect of the retrofit on other types of diaphragm bridges. Long-term field testing was completed on an X-type diaphragm bridge, which was part of the 1990s research to study the effect of the retrofit over time. In addition to the retrofit data, new methods of continuous remote monitoring were developed as a result of the long-term research. These new methods will prove to be important in Iowa’s future endeavors into health monitoring of bridges.
Stability of the loose bolt bridges was not directly addressed by field test in this research. However, American Association of State Highway and Transportation Officials (AASHTO) design specifications were consulted regarding girder stability on the bridges and were found to be sufficiently stable without the diaphragms. However, further research should be performed on this subject. The data collected will be used by other researchers at Iowa State University in the future to prepare in-depth finite element models (FEMs) of the bridges, which will be used to further support the effectiveness and safety of this retrofit.
Literature Review
Each chapter of this report contains a discussion of relevant previous research and related references. A general review of steel girder bridge literature and heath monitoring literature is included here.
Steel Girder Bridge Literature Review
A literature review of past research involving steel girder bridges was completed prior to field testing. This provided insight into the cause and location of fatigue cracking investigated by other researchers, as well as retrofit methods in use. Bridge health monitoring and remote monitoring were also reviewed to prepare for the long-term testing.
3
Wipf et al. and Khalil performed the initial research on the bolt loosening retrofit at Iowa State University in 1998 [1,2]. The investigation was based on loosening the bolts in sample bridges across the state of Iowa. Bridges with K-type and X-type diaphragms, or cross frames, were used in load testing of the retrofit. Field test data were collected with trucks of known weights before and after a portion of the diaphragms were released. Data from these tests showed a reduction in the strain in the web gap fatigue area following implementation of the retrofit. Data from these tests were also used to calibrate FEMs created for the bridges. These models were used to study the global effects of cracking in the webs on the bridge. The results of this research demonstrated that the retrofit reduced strain and displacement in the fatigue-prone exterior web gaps by at least 48 percent. The bolt loosening retrofit was found to be an effective method of reducing the out-of-plane displacement and strain in the web gap, thus reducing or eliminating fatigue cracking in web gaps.
Fisher et al. [3-7] developed the retrofit currently in use by the Iowa DOT. Fisher’s work on steel bridge fatigue addresses many typical failure locations, including the web gap due to out-of-plane deformation. Fisher, in conjunction with Keating [8], suggests that holes approximately 1 inch in diameter drilled at the terminus of each fatigue crack will control further cracking. In some cases this retrofit is sufficient to stop cracking, as long as the hole is properly drilled at the crack terminus and the web is provided enough flexibility following cracking to relieve strain in the web gap. If the web does not have enough movement other methods are suggested for permanent repair. These can range from a bolted stiffener/top flange connection to a removal of the diaphragms in cases where AASHTO permits.
Cousins and Stallings et al. [9-14] have conducted considerable research in the area of diaphragm removal in cases involving fatigue in the web gaps. New requirements in the AASHTO bridge design manual allow for more freedom in lateral bracing, which has permitted this type of research. The primary scope of the research focused on load distribution factors. Tests were completed to determine the magnitude of load distribution performed by the diaphragms. Results revealed that the girder with the highest strain during load tests with the diaphragms in place increased 5 to 15 percent when the diaphragms were removed. Cousins and Stallings suggested that this was an insignificant amount when compared to conservative bridge rating calculations.
Azizinamini et al. [15,16] completed calculations involving stability of multiple girder bridges with the diaphragms removed. Removal of the diaphragms in the negative moment region removes lateral torsional buckling support of the compression flange. The positive moment region has continuous support from the integral concrete deck. Azizinamini’s work determined the strength of the girders without the lateral bracing using the AASHTO design manual. Bridges with three spans of between 100 and 200 feet with no skew were studied. Calculations showed that the bridges under consideration had sufficient stability in the negative moment region so that compression flange bracing could be removed. Azizinamini’s research focused on common dimension multiple girder bridges. The results suggest that calculations on other similar bridges will verify that the diaphragms in the negative moment region are not necessarily needed for stability of the structure.
4
Miki et al. [17] and Zwerneman et al. [18], as well as Stallings, have studied fatigue cracking in locations outside the web gaps due to forces in the diaphragms. Cracking can occur in the stiffener plate, the diaphragm, connector plates, and welds. The location of the cracks discussed in their research outline other fatigue problems that can develop relative to diaphragm connections. For example, Miki’s work evaluated stiffeners that are welded to the top flange, which typically protects the web gap from fatigue damage. Numerous other crack locations have developed in the stiffener plate in response to this welded connection.
Health Monitoring Literature Review
Chajes and Shenton et al. [19,20] completed research on bridge condition assessment. Data were collected from bridges under normal traffic loading to develop an accurate strain history. This information was then used to develop a predicted fatigue life of the structure. To collect behavioral data, a bridge monitoring system was installed on site. Instrument Sensors Technologies produced the data acquisition system (DAS), and Intelliducer strain transducers from Bridge Diagnostics, Inc., were used to instrument the bridge. A NEMA 4 enclosure was installed at the bridge to protect the system from weather and vandalism. The battery power source used was ideal for use in remote locations, and a data record trigger allowed the system to monitor inputs and record a burst of data when the selected trigger channel exceeded a preset threshold.
Aktan et al. [21] also performed research featuring a remote monitoring system. The research was based on the structural identification of a truss bridge; however, the data acquisition method used is applicable in many situations. The monitoring system was installed at the bridge site in a powered environmental enclosure and continuously monitored the bridge. The bridge was instrumented with anemometers, accelerometers, strain gages, and inclinometers. Small portions of data were acquired at different times of the day, and as data were collected from instrumentation, a video camera collected visual data to help in interpreting results. This system was connected to a laboratory by a modem. Future plans feature installing a high-speed internet connection. The remote location of the system with telephone connection to the laboratory is a great benefit of this system.
References
1. Wipf, T.J., and L.F. Greimann, A. Khalil. Preventing Cracking at Diaphragm/Plate Girder Connections in Steel Bridges. Iowa DOT Project HR-393. Ames, Iowa: Center for Transportation Research and Education, Iowa State University, 1998.
2. Khalil, A. Aspects in Nondestructive Evaluation of Steel Plate Girder Bridges.Dissertation. Ames, Iowa: Iowa State University, 1998.
3. Fisher, J.W. Fatigue and Fracture in Steel Bridges, Case Studies. New York: John Wiley and Sons, 1984.
5
4. Fisher, J.W., B.T. Yen, and D.C. Wagner. “Review of Field Measurements for Distortion Induced Fatigue Cracking in Steel Bridges.” Transportation Research Record, No. 1118, 1987, pp. 49-55.
5. Fisher, J.W., and P.B. Keating. “Distortion-Induced Fatigue Cracking of Bridge Details with Web Gaps.” Journal of Constructional Steel Research, Vol. 12, 1989, pp. 215-228.
6. Fisher, J.W. Fatigue Cracking in Steel Bridge Structures: Executive Summary. Advanced Technology for Large Structural Systems, Report No. 89-03. Bethlehem, Pennsylvania: Lehigh University, 1989.
7. Demers, C.E., and J.W. Fisher. A Survey of Localized Cracking in Steel Bridges 1981 to 1988. Advanced Technology for Large Structural Systems, Report No. 89-01. Bethlehem, Pennsylvania: Lehigh University, 1989.
8. Keating, P.B. “Focusing on Fatigue.” Civil Engineering, Vol. 64, No. 11, 1994, pp. 54-57.
9. Cousins, T.E., and J.M. Stallings. “Calculation of Steel Diaphragm Behavior.” Journal of the Structural Division, Vol. 102, No. ST7, July 1976, pp. 1411-1430.
10. Stallings, J.M., and T.E. Cousins, and T.E. Stafford. “Effects of Removing Diaphragms from Steel Girder Bridge.” Transportation Research Record, Vol. 1541, 1996, pp. 183-188.
11. Stallings, J.M., and T.E. Cousins. “Fatigue Cracking in Bolted Diaphragm Connections.” Proceedings of the 15th Structures Congress 1997 Portland, Vol. 1. New York: ASCE, 1997, pp. 36-40.
12. Stallings, J.M., and T.E. Cousins. “Evaluation of Diaphragm Requirements in Existing Bridges.” Proceedings of the 15th Structures Congress 1997 Portland, Vol. 2. New York: ASCE, 1997, pp. 1494-1498.
13. Cousins, T.E., and J.M. Stallings. “Laboratory Tests of Bolted Diaphragm-Girder Connection.” Journal of Bridge Engineering, Vol. 3, No. 2, May 1998, pp. 56-63.
14. Cousins, T.E., J.M. Stallings, and T.E. Stafford. “Removal of Diaphragms from 3-Span Steel Girder Bridge.” Journal of Bridge Engineering, Vol. 4, No. 1, February 1999, pp. 63-70.
15. Azizinamini, A. “Steel Bridge Design Using AASHTO LRFD Bridge Design Specifications (1999 Interim).” Proceedings of National Bridge Research Organization Short Course. Kansas City: NaBRO, November 1999.
16. Azizinamini, A., S. Kathol, and M. Beachman. “Effects of Cross Frames on Behavior of Steel Girder Bridges.” 4th International Bridge Engineering Conference Proceedings.Washington, D.C.: Transportation Research Board, 1995, pp. 117-124.
6
17. Miki, C., H. Takenouchi, T. Mori, and S. Ohkawa. “Repair of Fatigue Damage in Cross Bracing Connections in Steel Girder Bridges.” Structural Engineering/Earthquake Engineering, Vol. 6, No. 1, April 1989, pp. 31s-39s.
18. Zwerneman, F.S., A.B. West, and K.S. Lim. “Fatigue Damage to Steel Bridge Diaphragms.” Journal of Performance of Constructed Facilities, Vol. 7, No. 4, November 1993, pp. 207-225.
19. Chajes, M.J., H.W. Shenton III, and D. O’Shea. “Bridge-Condition Assessment and Load Rating Using Nondestructive Evaluation Methods.” Transportation Research Record,Vol. 2, No. 1969, 1998, pp. 83-91.
20. Shenton, H.W. III, M.J. Chajes, and E.S. Holloway. “A System for Monitoring Live Load Strain in Bridges.” Structural Materials Technology IV Conference Proceedings. Atlantic City, New Jersey: Federal Highway Administration, 2000, pp. 89-94.
21. Aktan, A.E., K.A. Grimmelsman, and R.A. Barrish. “Structural Identification of a Long-Span Truss Bridge.” Transportation Research Record, Vol. 2, No. 1696, 2000, pp. 210-218.
7
CHAPTER 2. BOLT LOOSENING RETROFIT FOR FATIGUE CRACKING IN STEEL GIRDER BRIDGES WITH I-BEAM DIAPHRAGMS
Abstract
Many of Iowa’s multiple steel girder bridges have shown signs of fatigue cracking due to out-of-plane deflection of the web in the region of the diaphragm connections. This fatigue-prone web gap area is located in the negative moment regions where the diaphragm stiffener is not attached to the top flange. The Iowa Department of Transportation (Iowa DOT) has attempted to stop fatigue crack propagation but with limited success. For this reason, the Iowa DOT has requested research on a field retrofit that involves loosening the bolts in the connection between the diaphragm and the girders. The intent of this research is to show that loosening the bolts at the diaphragm/girder connection in steel girder bridges with I-beam diaphragms is effective in reducing strain in the web gap.
Select web gaps in the negative moment region on an interstate bridge were instrumented with strain gages and deflection transducers to measure out-of-plane displacement. Field tests, using loaded trucks of known weight and configuration, were conducted on the bridge before and after implementing the bolt loosening retrofit.
Results indicate that loosening the diaphragm bolts reduces out-of-plane deflection and strain in the web gap. The reduction in strain correlates to less fatigue in the web gaps and an increase of in-service life of the bridge.
Introduction
Multiple steel girder bridges are common in many portions of the United States. Many states have adopted the steel girder and reinforced concrete deck design as a standard bridge style. Over the past few decades the Iowa DOT and other state departments of transportation have noted a common fatigue problem among multiple steel girder bridges subjected to heavy traffic volumes: fatigue cracking has been occurring in the girder webs of older bridges at diaphragm connections. Differential deflection between girders is the main catalyst for this fatigue. As the girders deflect, forces are transferred through the diaphragms to the girder webs. Data shows that the web gap (the area between the web stiffener weld and the top flange fillet) is susceptible to fatigue from these forces. This susceptibility is the focus of this investigation.
Engineers have proposed many solutions for this problem, ranging from stiffener bracing to local web removal. A new retrofit to prevent this cracking has been developed by the Iowa DOT [1,2] that involves loosening the bolts in the diaphragm/girder connections. The diaphragms in multiple girder bridges are primarily intended to transfer wind loads and distribute live load as well as bracing the compression flange of the girders. These are functions that the deck, when hardened, is capable of performing in most cases. Concerns
8
involving adjustment or removal of diaphragms stem from proper bracing of the compression flange in the negative moment region and sufficient distribution of load between girders. Other researchers have demonstrated that these concerns are not always a determining factor in diaphragm placement. Diaphragms, in many cases, can be removed with negligible effects on bridge response. The bolt loosening retrofit allows the diaphragms to remain in position to apply lateral support if required. This allows differential deflection between girders to rotate the diaphragms instead of developing forces that cause fatigue. The objective of this chapter is to discuss the application of the bolt loosening retrofit to multiple girder bridges with I-beam diaphragms and to document strain and displacement reductions in the web gaps. This chapter presents supporting data that illustrate that this method is an effective retrofit for bridges experiencing fatigue in the web gap.
Previous Research
Khalil et al [1,2] researched a bolt loosening retrofit on multiple steel girder bridges with K-type and X-type diaphragms. The study concluded that the bolts in diaphragm/girder connections could be loosened to reduce strain and deflection in the web gaps. The X-type diaphragms exhibited more effective results than the K-type diaphragms when the retrofit was implemented on a number of test bridges in Iowa. Data revealed that the strain and displacement typically reduced by a minimum of 48 percent in exterior girders.
Many researchers have studied fatigue in web gaps and tested retrofits. Stallings and Cousins et al. [3-6] studied the effects of removing diaphragms completely from multiple girder steel bridges. Their research focused on load distribution between girders through the diaphragms and the importance of the diaphragms in this role. They found that stress in the maximum stress girder increased from 5 to 17 percent when the diaphragms were removed. Their work proposes that removing the diaphragms has minimal impact on the distribution of load between girders and has little effect on design parameters.
Azizinamini [7] studied the effects of removing diaphragms in accordance with the American Association of State Highway and Transportation Officials (AASHTO) bridge design specifications. Azizinamini calculated the lateral torsional buckling stability for multiple girder steel bridges following removal of the diaphragms. Calculations supported safe removal of diaphragms in the particular multiple steel girder bridges documented. Azizinamini’s bridges were similar to those found in Iowa and suggest that similar calculations could support removal of diaphragms there as well.
Fisher et al. [8,9] has done extensive research on steel bridges. Much of Fisher’s work has focused on the source of cracking in steel bridge members and techniques for repairing/retrofitting known problems. Fisher states that out-of-plane deflection of the web gap due to differential deflection of the girders is a major contributor to web gap fatigue. Bridges with a skew tend to have greater girder differential deflection and therefore more fatigue cracking. The work has led to the development of a retrofit for use on cracks that run perpendicular to the main stress in the girder. This retrofit consists of drilling holes at the
9
terminus of these cracks to limit their propagation and, in some cases, to stop cracking altogether. The Iowa DOT has been utilizing this technique to repair its damaged web gaps for the past 20 years.
Bridge Description
Bridge 5075.5R080, shown in Figure 2.1, is a two-lane, three-span, multiple steel girder bridge crossing the North Skunk River near Kellogg, Iowa. It was built in 1960 and carries eastbound traffic on I-80 in central Iowa. The bridge cross section, with diaphragms, is shown in Figure 2.2. The original structure was built with four welded A36 steel plate girders, but in 1978 a fifth plate girder (G5) was added to widen the driving lane shoulder. I-shaped diaphragms support all the girders laterally at a spacing of approximately 20 feet. The bridge has multiple examples of web gap fatigue cracking near diaphragm connections in the negative moment region. The webs with cracks have had holes drilled in the web following crack discovery. Cracking occurs in the new girder as well as the original girders, especially in the exterior girders. The high occurrence of fatigue cracking in this bridge makes it a critical bridge for fatigue and a prime specimen for retrofit testing.
Figure 2.1. Photograph of test bridge looking northwest.
Figure 2.2 shows the two 12-foot traffic lanes centered between the four original girders (G1-G4). Figure 2.3 shows a plan view of the bridge superstructure, which has a 10-degree skew with the substructure. The western span, Span 1, is 82 feet 6 inches; the center span, Span 2, is 105 feet; and the eastern span, Span 3, is 80 feet 6 inches. The five welded plate girders support an 8-inch concrete deck integral with the top flange.
10
G1 G3 G4 G2 G5
C L Roadway
9ft-8in. 9ft-8in. 9ft-8in. 6ft-3in.
42ft-2in.
Passing Lane
Driving Lane
Figure 2.2. Bridge cross section looking toward direction of traffic.
D0 Pier 2
D0 Pier 1
D0 West Abutment
D0 East Abutment
D3 D2 D1 D4 D3 D2 D1 D3 D2 D1
Span 3 Span 2 Span 1
G1 G2 G3 G4 G5
N
10-deg
105ft 80ft-6in. 82ft-6in.
Figure 2.3. Plan view of bridge superstructure.
Girders G1 to G4 are spaced at 9 feet 8 inches, and girder G5 is spaced at 6 feet 3 inches. As depicted in Figure 2.4, the original girders have PL46x3/8 webs with flanges between PL10x1 1/4 to PL16x1 3/4. The interior and exterior girders have different cross sections with similar plate sections. The new girder has PL44x3/8 webs with flanges between PL10x1 3/4 to PL16x1 1/2. Splices in the girders are located 18 feet on either side of the piers. Each girder has shear angles to form a composite connection between the steel girders and reinforced concrete deck.
11
PL46x3/8 PL12x1 1/2
PL12x1 1/2 PL10x1 1/4 PL16x2
PL16x2
Negative Moment Region
Positive Moment Region
PL46x3/8
Figure 2.4. Profile illustration of original interior girder.
Figure 2.5 shows a photograph of typical diaphragms and girders. The diaphragms are rolled W18x50 sections in the spans, W21x68 at the abutments, and W24x76 at the piers. The diaphragms are spaced at 21 feet in the center span and 20 feet 7 inches in the end spans. They are bolted to vertical stiffeners as illustrated in Figure 2.6. The vertical stiffeners are welded to the web and the girder compression flange. In the negative moment region above the piers the top flange is in tension and is not welded to the stiffeners. Figure 2.7 shows a photograph of a typical web gap in a negative moment region. A web gap of about 1 inch in the vertical direction exists between the top of the stiffener weld and the bottom of the girder top flange where the stiffener is clipped. As noted previously, fatigue cracks have been found to occur in this region.
Figure 2.5. Photograph of underside of the bridge looking northwest.
12
Diaphragm W18x50
G1
Bolts
Stiffener
Web Gap
PL10x1 1/4
PL46x3/8
PL12x1 1/2
Figure 2.6. Diagram of typical diaphragm/girder connection in negative moment region.
Figure 2.7. Photograph of typical web gap.
Bridge Behavior and Condition
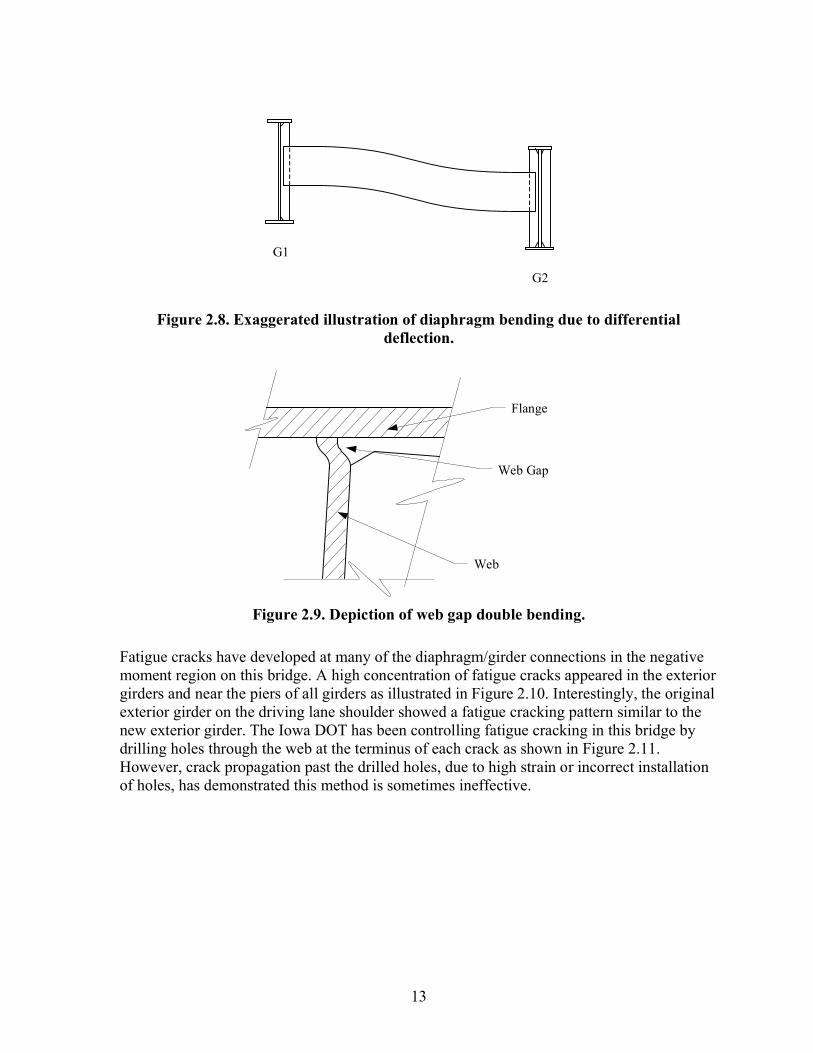
Differential deflection of the girders causes bending of the diaphragms, which is then transferred to the girder webs. This behavior is shown in Figure 2.8. The girder webs do not effectively resist this type of behavior, and this results in the double bending of the web gap as illustrated in Figure 2.9. Each vehicle crossing the bridge creates a load cycle on the girder webs. Over time, fatigue cracks may develop in the web gaps. Due to the heavier loads and the greater number of cycles inherent in a large volume roadway, fatigue is more prevalent in interstate bridges.
13
G2
G1
Figure 2.8. Exaggerated illustration of diaphragm bending due to differential deflection.
Web
Web Gap
Flange
Figure 2.9. Depiction of web gap double bending.
Fatigue cracks have developed at many of the diaphragm/girder connections in the negative moment region on this bridge. A high concentration of fatigue cracks appeared in the exterior girders and near the piers of all girders as illustrated in Figure 2.10. Interestingly, the original exterior girder on the driving lane shoulder showed a fatigue cracking pattern similar to the new exterior girder. The Iowa DOT has been controlling fatigue cracking in this bridge by drilling holes through the web at the terminus of each crack as shown in Figure 2.11. However, crack propagation past the drilled holes, due to high strain or incorrect installation of holes, has demonstrated this method is sometimes ineffective.
14
Span 1
D0 Pier 2
D0 Pier 1
D0 West Abutment
D0 East Abutment
D3 D2 D1 D4 D3 D2 D1 D3 D2 D1
Span 3 Span 2
G1 G2 G3 G4 G5
Confirmed crack with drilled hole
Figure 2.10. Locations of confirmed cracks and drilled hole retrofits.
Figure 2.11. Photograph of typical drilled hole retrofit in a web.
Since out-of-plane displacement of the web is caused by resistance to rotation in the diaphragms relative to the girders, the rigidity at the diaphragm connection directly correlates to the level of out-of-plane displacement. Therefore, a reduction in the rigidity of the connection would, in theory, allow rotation of the diaphragm and reduce out-of-plane bending of the web. Loosening the bolted connection between the diaphragms and the girders would reduce this rigidity by changing the bolted rigid connection, which transfers moment to the web gap, to more of a pinned connection, which does not.
15
Instrumentation
A location between G1 and G2 in the negative moment region of Span 3 was selected for testing. Gages were set up at D1 in Span 3 as seen in Figure 2.12. This location had fatigue damage in the G1 web gap but none in the adjacent G2 web gap. The retrofit holes in the web gap at damaged locations made mounting strain gages difficult and the resulting data less accurate; however, the location had the least damage of similar negative moment locations.
Web Gap Bending Strain Out-of-plane DisplacementDiaphragm Bending Strain
D3 D2 D1 D0 East Abutment
D0 Pier 2
Span 3
G1
G2
G3
G4
G5
Figure 2.12. Plan view of gage placement.
Bondable 120-Ohm gradient strain gages were used to measure web gap bending strain and to show the strain distribution in the web gap, which is important in determining the effectiveness of the diaphragm connection retrofit. The gradient gages consisted of five small foil backed strain gages factory assembled in a very small unit. They were mounted in, or as close to, the web gab as possible as seen in Figure 2.13.
As mentioned previously, the web gap on this bridge was approximately 1 inch deep. This made it difficult to place the gradient gages directly in the gap. In this investigation only the top three gages of the gradient were used for data interpretation because the other gages were too far from the web gap to produce reliable data. It is also important to note that the G1 web gap has a drilled retrofit, which forced the gradient gage to be mounted outside the web gap.
16
a. Close-up of typical gradient gage.
G2
½ in.
Diaphragm 7/16 in.
3 Active Strain Gages
b. G2 gradient gage illustration looking east and south (typical).
Figure 2.13. Web gap gradient instrumentation.
Strain gages were also used to measure diaphragm bending strain to further study the change in force transfer due to implementation of the retrofit. Gages were placed at the mid and quarter points of one section of D1 on the top and bottom flanges as shown in Figure 2.14. The middle gages were 57 inches from the G1 centerline. The outer gages were 31 inches from the centerline of the nearest girder.
17
1 ½ in. Diaphragm
Web Gap
57 in.
31 in. 31 in.
G1 G2
Figure 2.14. D1 strain instrumentation looking east and south.
Direct current displacement transducers (DCDTs) were used to measure displacement of the web gaps. They were attached by magnetic stands to the girder webs and flanges at the connections with D1 as shown in Figure 2.15. G1 and G2 each had a DCDT for out-of-plane displacement measurement. The transducer measured out-of-plane displacement of the web by measuring the horizontal displacement of the web stiffener relative to the top flange, which was restrained from movement by the bridge deck.
Data from all gages were collected using a data acquisition system (DAS) at a sampling rate of 30 hertz. A total of 31 channels were used. Data were taken as load trucks approached the bridge and continued until both trucks had completely crossed the structure. The data collected from the DAS were imported into a spreadsheet program for analysis. The data set from each test was plotted with initial offset removed and noise filtered to facilitate analysis.
18
a. G2 out-of-plane displacement transducer looking west.
b. G2 transducer illustration looking east and south (typical).
Information on the standard Iowa DOT three-axle dump trucks used to load test the bridge is shown in Figure 2.16. The average width of a load truck was 6 feet between the rear duals, and the length was approximately 18 feet between the front and rear axles. The trucks were loaded with sand to near 50,000 lbs. Truck 1 weighed 49,300 lbs and Truck 2 weighed 49,120 lbs.
14ft-5in.
18ft-11in.
6ft6ft-9in.
16,340 lbs 32,960 lbs
14ft-6 1/2in.
18ft-11in.
6ft6ft-10in.
33,220 lbs 15,900 lbs
a. Truck 1 b. Truck 2
Figure 2.16. Test truck configuration.
Since the bridge is on an interstate with heavy, high-speed traffic, static tests were determined to be unsafe. Therefore, the test trucks crossed the bridge at speeds of approximately 60 mph. The test vehicles were separated from ambient traffic by a slow pace vehicle, which held back traffic. This allowed for data acquisition with only the load trucks on the bridge.
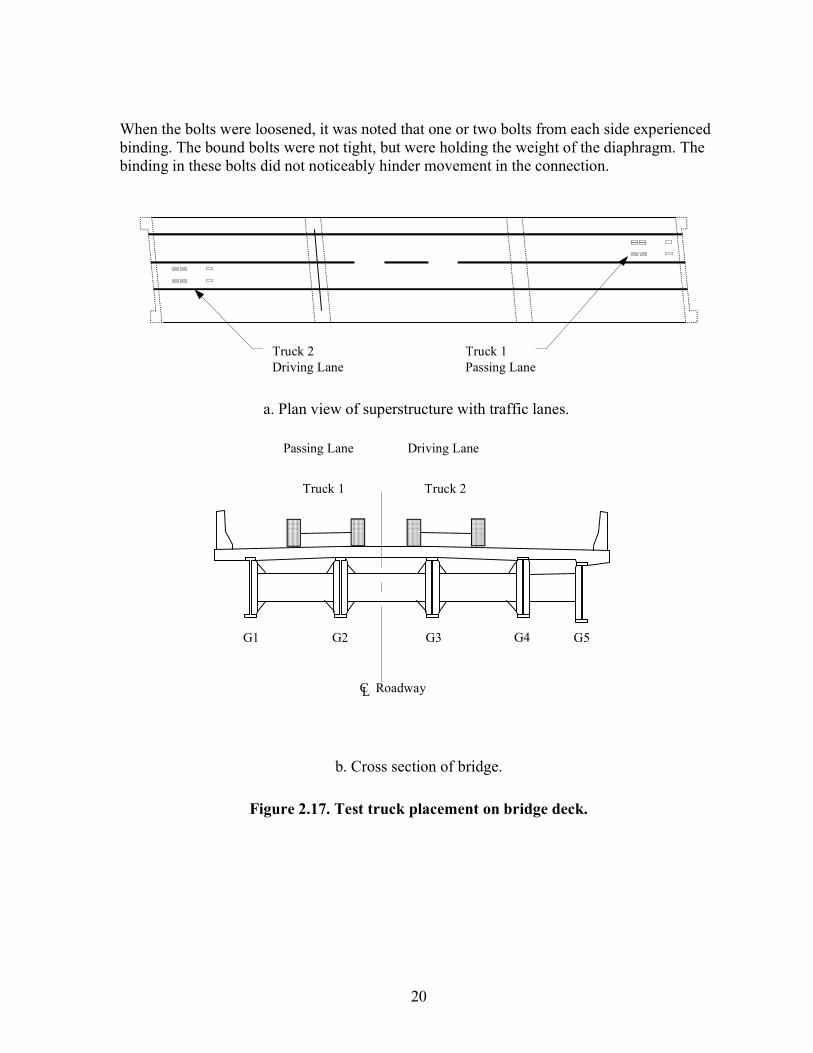
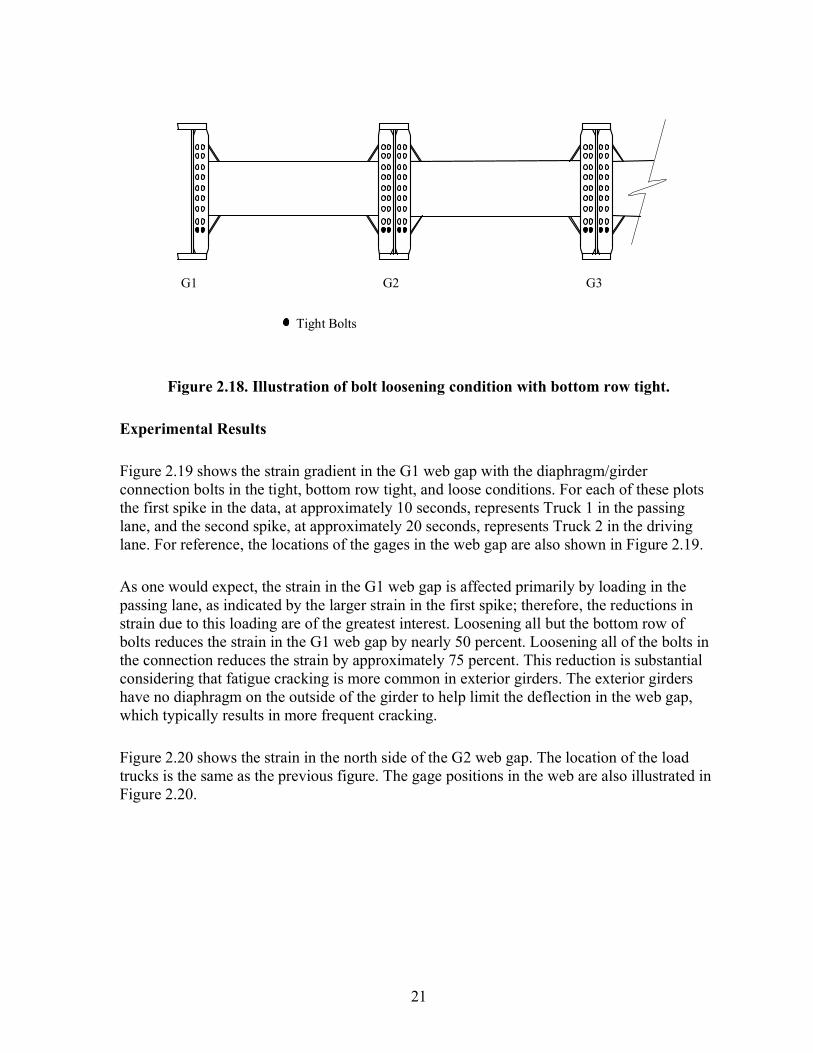
The data presented herein represents driving lane loading and passing lane loading, reflecting the typical loading pattern on the bridge. Two trucks crossed the bridge in staggered positions separated by approximately five vehicle lengths. Truck 1 traveled the passing lane and Truck 2 traveled the driving lane, with Truck 1 in the lead as illustrated by Figure 2.17. The distance between test vehicles allowed individual data to be acquired for each lane, while running one test pass and minimizing ambient traffic delays. Tests were run with the diaphragm/girder connection bolts in three different bolt conditions: all bolts tight, only bottom row bolts tight, and all bolts loose. The only bottom row tight condition is illustrated in Figure 2.18. Bolts were loosened in the instrumented diaphragm as well as the adjacent diaphragm to prevent differential displacement between G2 and G3 from affecting the data.
20
When the bolts were loosened, it was noted that one or two bolts from each side experienced binding. The bound bolts were not tight, but were holding the weight of the diaphragm. The binding in these bolts did not noticeably hinder movement in the connection.
Truck 2 Driving Lane
Truck 1 Passing Lane
a. Plan view of superstructure with traffic lanes.
L
G1 G3 G4 G2 G5
C Roadway
Truck 1 Truck 2
Driving Lane Passing Lane
b. Cross section of bridge.
Figure 2.17. Test truck placement on bridge deck.
21
G1 G3 G2
Tight Bolts
Figure 2.18. Illustration of bolt loosening condition with bottom row tight.
Experimental Results
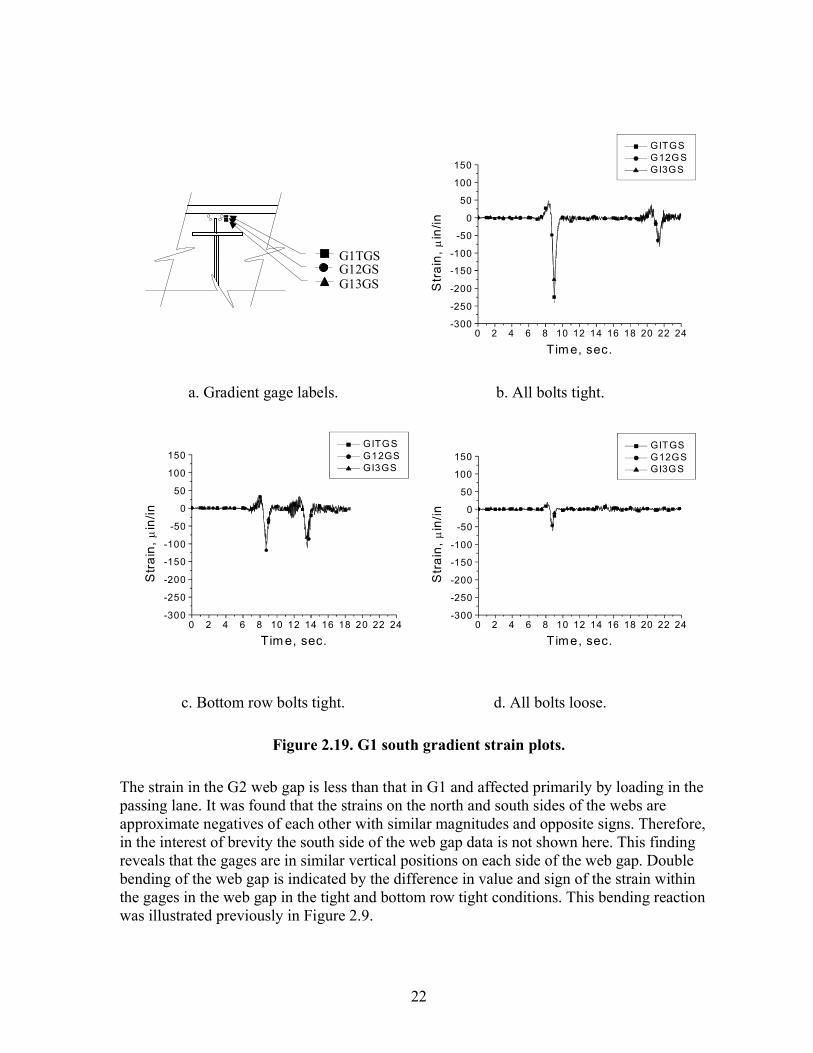
Figure 2.19 shows the strain gradient in the G1 web gap with the diaphragm/girder connection bolts in the tight, bottom row tight, and loose conditions. For each of these plots the first spike in the data, at approximately 10 seconds, represents Truck 1 in the passing lane, and the second spike, at approximately 20 seconds, represents Truck 2 in the driving lane. For reference, the locations of the gages in the web gap are also shown in Figure 2.19.
As one would expect, the strain in the G1 web gap is affected primarily by loading in the passing lane, as indicated by the larger strain in the first spike; therefore, the reductions in strain due to this loading are of the greatest interest. Loosening all but the bottom row of bolts reduces the strain in the G1 web gap by nearly 50 percent. Loosening all of the bolts in the connection reduces the strain by approximately 75 percent. This reduction is substantial considering that fatigue cracking is more common in exterior girders. The exterior girders have no diaphragm on the outside of the girder to help limit the deflection in the web gap, which typically results in more frequent cracking.
Figure 2.20 shows the strain in the north side of the G2 web gap. The location of the load trucks is the same as the previous figure. The gage positions in the web are also illustrated in Figure 2.20.
22
G1TGSG12GSG13GS
0 2 4 6 8 10 12 14 16 18 20 22 24-300
-250
-200
-150
-100
-50
0
50
100
150
Tim e, sec.
GITGS G12G S GI3GS
a. Gradient gage labels. b. All bolts tight.
0 2 4 6 8 10 12 14 16 18 20 22 24-300
-250
-200
-150
-100
-50
0
50
100
150
Tim e, sec.
GITG S G12GS GI3GS
0 2 4 6 8 10 12 14 16 18 20 22 24-300
-250
-200
-150
-100
-50
0
50
100
150
Time, sec.
GITGS G12GS GI3G S
c. Bottom row bolts tight. d. All bolts loose.
Figure 2.19. G1 south gradient strain plots.
The strain in the G2 web gap is less than that in G1 and affected primarily by loading in the passing lane. It was found that the strains on the north and south sides of the webs are approximate negatives of each other with similar magnitudes and opposite signs. Therefore, in the interest of brevity the south side of the web gap data is not shown here. This finding reveals that the gages are in similar vertical positions on each side of the web gap. Double bending of the web gap is indicated by the difference in value and sign of the strain within the gages in the web gap in the tight and bottom row tight conditions. This bending reaction was illustrated previously in Figure 2.9.
23
G2TGS G22GS G23GS
0 2 4 6 8 10 12 14 16 18 20 22 24-200
-150
-100
-50
0
50
100
150
200
250
Time, sec.
G 2TGN G 22G N G 23G N
a. Gradient gage labels. b. All bolts tight.
0 2 4 6 8 10 12 14 16 18 20 22 24-200
-150
-100
-50
0
50
100
150
200
250
Tim e, sec.
G 2TGN G 22GN G 23GN
0 2 4 6 8 10 12 14 16 18 20 22 24-200
-150
-100
-50
0
50
100
150
200
250
Time, sec.
G 2TGN G 22GN G 23GN
c. Bottom row bolts tight. d. All bolts loose.
Figure 2.20. G2 north gradient strain plots.
The strain in the gap is reduced by 50 percent when all but the bottom row of bolts are loose, but the gages have residual strain following loading in the driving lane. This suggests that forces remain in the gap, resulting from slippage of the bottom row of tight bolts. This is in contrast to no residual strain with all the bolts loose and the strain is reduced by approximately 90 percent.
Figure 2.21 shows the strains in D1 between G1 and G2 with the bolts in the tight, bottom tight, and loose conditions. The first spike is due to Truck 1 traveling in the passing lane and the second spike is Truck 2 traveling in the driving lane. An illustration of D1 between G1 and G2 shows the location of the gages on the flanges.
24
DB1 DB3 DB5
DB6 DB4 DB2
0 2 4 6 8 10 12 14 16 18 20 22 24
-20
-10
0
10
20
30
Time, sec.
DB1 DB2 DB3 DB4 DB5 DB6
a. Diaphragm gage labels. b. All bolts tight.
0 2 4 6 8 10 12 14 16 18 20 22 24
-20
-10
0
10
20
30
Time, sec.
DB1 DB2 DB3 DB4 DB5 DB6
0 2 4 6 8 10 12 14 16 18 20 22 24
-20
-10
0
10
20
30
Time, sec.
DB1 DB2 DB3 DB4 DB5 DB6
c. Bottom row bolts tight. d. All bolts loose.
Figure 2.21. D1 bending strain plots.
From these data it can be seen that the strain in the diaphragm is greater when the loading is in the passing lane than in the driving lane. Greater deflection of G1 relative to G2 when loading is in the passing lane is interpreted as the cause of this reaction. The positive and negative strains in the top and bottom flanges of the diaphragm show that it exhibits double bending between G1 and G2. This response, which was illustrated in Figure 2.8, supports that bending forces are transferred through the diaphragms to the girder webs. A correlation can be seen between the strain in D1 and the strain in the G1 web gap. Peak strains in the web gap occur under the same condition as high peak strains in D1. That is, the relative strain magnitudes in the diaphragm under both lane loadings are proportional to those in the G1 web gap shown in Figure 2.19.
25
The strain in the diaphragm with the bottom row of bolts tight is reduced by nearly 75 percent for loading in the passing lane but is reduced little for driving lane loading (i.e., the second peak). However, there is a complete reduction of strain in the diaphragm with all bolts loose. No noticeable change in strain is exhibited in the diaphragm above ambient noise when the bolts are loose. This illustrates that the bolt loosening retrofit effectively releases the force in the diaphragm due to differential deflection.
Figure 2.22 shows the out-of-plane displacement at webs of G1 and G2 with the bolts in the tight, bottom tight, and loose conditions. The data spikes represent the same truck loading as in the web gap figures. A typical illustration depicts the G1 transducer. The G2 transducer is a mirror of G1.
WD1
0 2 4 6 8 10 12 14 16 18 20 22 24-0.006
-0.005
-0.004
-0.003
-0.002
-0.001
0.000
0.001
0.002
Time, sec.
WD2 WD1
a. Out-of-plane transducer label (typical). b. Bottom row bolts tight.
0 2 4 6 8 10 12 14 16 18 20 22 24-0.006
-0.005
-0.004
-0.003
-0.002
-0.001
0.000
0.001
0.002
Time, sec.
WD2 WD1
0 2 4 6 8 10 12 14 16 18 20 22 24-0.006
-0.005
-0.004
-0.003
-0.002
-0.001
0.000
0.001
0.002
Time, sec.
WD2 WD1
c. All bolts tight. d. All bolts loose.
Figure 2.22. G1 and G2 out-of-plane displacement plots.
26
The out-of-plane displacement of the G1 web gap is much greater than the deflection in the G2 web gap when the load is in the passing lane with the bolts tight. The displacement of the G1 web gap is only slightly greater than the G2 web gap when the loading is in the driving lane. These values of displacement can be compared qualitatively to the strains in the web gaps in G1 and G2 that were given in Figures 2.19 and 2.20. The bending implied by the strain in the web gaps is in the same direction as the recorded displacement of the web stiffener. The magnitude of the out-of-plane displacement also directly relates with the web gap strain, which reveals greater deflection and strains in the exterior girder web gap than in the interior girder web gap when the driving lane is loaded.
A reduction of approximately 75 percent occurs in G1 between the tight and only bottom bolt tight conditions for passing lane loading. Virtually no reduction occurs in the G1 web gap due to driving lane loading. There is also residual deflection in the G2 gap, similar to the strain gage results previously discussed. The effect of the bottom row tight connection on the transfer of forces in the diaphragm was not studied in depth. However, the data imply that the connection may be responsible for residual strain in the web gap and diaphragm.
Following bolt loosening, the displacement of the G2 web gap is nearly eliminated and the displacement in the G1 web gap is reduced by more than 80 percent, which correlates with the reduction in web gap strains in G1 and G2.
Conclusions
The results of the field tests demonstrate that the retrofit reduces the strain and displacement in the web gap. The data illustrate that the strain in the diaphragm is also eliminated by the retrofit. The forces in the diaphragm are the catalyst for web gap fatigue cracking, and loosening the bolts effectively eliminates those forces.
As suggested by the data, partial loosening of the bolts is not nearly as effective at reducing strain and deflection in the web gap and diaphragms as is full loosening of the bolts. The remaining tight bolts in the partially loose condition are capable of transferring force through the girders and continue to displace the web gap out-of-plane.
Removal of the out-of-plane force in the web gap will significantly reduce bending in the web gap. Bending in the web following bolt loosening is uniform along the length of the girder, including the web gap. Bending has occurred in the webs at the top flange connections between the diaphragms since the bridge entered service and cracking has not initiated. Thus, the bolt loosening retrofit increases the fatigue life of the web gap significantly and fatigue cracking is effectively eliminated.
27
Implementation Issues
The bolt loosening retrofit provides an inexpensive solution to web gap fatigue cracking and is also effective in preventing cracking in bridges that have not yet developed cracks. The service life of the bridges will increase when the force causing fatigue cracking in the web is removed. Before this retrofit is installed in in-service bridges, a few key points need to be addressed on an individual bridge basis.
Lateral support for the girders and stability of the structure without the diaphragms may be a concern. Bracing for lateral torsional buckling is only important in the negative moment region, and the larger girder cross sections in the negative moment region generally provide adequate support over the unbraced length. Calculations completed for the I-80 bridge based on AASHTO load and resistance factor design (LRFD) requirements, indicate that adequate lateral support exists if the diaphragms are removed. The stability results will differ for each bridge so individual checks need to be performed for each bridge retrofitted to ensure stability.
Lateral load distribution caused by diaphragms must also be addressed. The change in lateral load distribution of the bridge was not thoroughly tested in this research, but other researchers have found that most bridges are conservatively designed for lateral load distribution and show little change in lateral load distribution with the diaphragms removed. The bolt loosening retrofit relieves the force in the diaphragms and is equivalent to diaphragm removal in terms of lateral load distribution.
A system must be devised to ensure that the loosened bolts remain in place over time so that the diaphragms are not at risk of falling due to nut loosening under vibrations of traffic loading. The method of connection was not researched, but a lock nut or double nut technique may be a solution. Any solution implemented should be periodically inspected to insure that it is functioning properly, and the bolts are secure but loose.
A bridge may be retrofitted if the particular design meets the listed requirements and any other requirements the engineer determines pertinent for each individual situation. Following installation of the retrofit, the bridge must be monitored closely until the engineer is convinced the bridge is stable and the diaphragms are safely secured to the stiffeners in a loose manner.
References
1. Wipf, T.J., and L.F. Greimann, A. Khalil. Preventing Cracking at Diaphragm/Plate Girder Connections in Steel Bridges. Iowa DOT Project HR-393. Ames, Iowa: Center for Transportation Research and Education, Iowa State University, 1998.
28
2. Khalil, A. Aspects in Nondestructive Evaluation of Steel Plate Girder Bridges.Dissertation. Ames, Iowa: Iowa State University, 1998.
3. Cousins, T.E., and J.M. Stallings. “Calculation of Steel Diaphragm Behavior.” Journal of the Structural Division, Vol. 102, No. ST7, July 1976, pp. 1411-1430.
4. Stallings, J.M., and T.E. Cousins, and T.E. Stafford. “Effects of Removing Diaphragms from Steel Girder Bridge. Transportation Research Record, Vol. 1541, 1996, pp. 183-188.
5. Cousins, T.E., and J.M. Stallings. “Laboratory Tests of Bolted Diaphragm-Girder Connection.” Journal of Bridge Engineering, Vol. 3, No. 2, May 1998, pp. 56-63.
6. Cousins, T.E., J.M. Stallings, and T.E. Stafford. “Removal of Diaphragms from 3-Span Steel Girder Bridge.” Journal of Bridge Engineering, Vol. 4, No. 1, February 1999, pp. 63-70.
7. Azizinamini, A. “Steel Bridge Design Using AASHTO LRFD Bridge Design Specifications (1999 Interim).” Proceedings of National Bridge Research Organization Short Course, Kansas City: NaBRO, November 1999.
8. Fisher, J.W. Fatigue Cracking in Steel Bridge Structures: Executive Summary. Advanced Technology for Large Structural Systems, Report No. 89-03. Bethlehem, Pennsylvania: Lehigh University, 1989.
9. Demers, C.E., and J.W. Fisher. A Survey of Localized Cracking in Steel Bridges 1981 to 1988. Advanced Technology for Large Structural Systems, Report No. 89-01. Bethlehem, Pennsylvania: Lehigh University, 1989.
29
CHAPTER 3. BOLT LOOSENING RETROFIT FOR FATIGUE CRACKING IN STEEL GIRDER BRIDGES WITH CHANNEL DIAPHRAGMS
Abstract
Multiple steel girder bridges commonly exhibit fatigue cracking due to out-of-plane displacement of the web near the diaphragm connections. The fatigue-prone web gap area is typically located in negative moment regions of the girders where the diaphragm stiffener is not attached to the top flange. In the past, the Iowa Department of Transportation (Iowa DOT) has attempted to stop fatigue crack propagation in these steel girder bridges by drilling holes at the crack tips. This retrofit is often only a temporary solution and a more permanent retrofit is required. A field retrofit has been developed that involves loosening the bolts in the connection between the diaphragm and the girders. The intent of this research is to demonstrate that loosening the bolts at the diaphragm/girder connection is an efficient method of preventing web gap fatigue cracking in steel girder bridges with channel diaphragms.
The web gaps in a negative moment region on an interstate bridge were instrumented with strain gages and deflection transducers. Field tests, using loaded trucks of known weight and configuration, were conducted on the bridges with the bolts in both the existing tight condition and after implementing the retrofit to measure the effects of loosening the diaphragm bolts.
Results indicate that loosening the diaphragm bolts reduces out-of-plane displacement and strain in the web gap. Reducing the strain in the web gap allows the bridge to support more cycles of loading before experiencing critical fatigue levels, thus increasing the service life of the bridge.
Introduction
Many of Iowa’s aging multiple girder bridges are experiencing fatigue cracking. In multiple steel girder bridges, cracking is most often associated with webs at diaphragms between the main girders. These bridges consist of multiple steel girders spanning longitudinally in the direction of traffic flow with perpendicular steel diaphragms and a concrete deck. Diaphragms in these bridges are intended to laterally support the girders as required by the American Association of State Highway and Transportation Officials (AASHTO). They consist of crossing angles in an X-type or K-type pattern, I-beam sections, or channel beam sections connected to web stiffener plates. Fatigue cracks can form on the diaphragm itself or on the girder webs near the diaphragm attachments. In Iowa bridges, cracking in girder webs in negative moment regions is prevalent. Fatigue occurs in the web gap of the girders above diaphragm connections (the web gap is the area between the top flange fillet weld and stiffener weld and is generally only an inch or two in depth).
30
Many retrofit possibilities have been explored, ranging from stiffening the diaphragm/girder connections to drilling holes in the girder web. The Iowa DOT developed a retrofit solution that is intended to reduce the force causing the fatigue in the web gap. This retrofit consists of loosening the bolts in the diaphragm/girder connection, allowing the diaphragms to rotate under differential deflection of the girders. The Iowa DOT recently supported research involving loosening the bolts of the diaphragm/girder connection of K-type and X-type diaphragms with positive results [1]. The research presented here features the same bolt loosening retrofit applied to bridges with channel diaphragms. The objective of this study was to install the bolt loosening retrofit to a section of a multiple steel girder bridge with channel diaphragms and document the behavioral changes.
Previous Research
Khalil and Wipf et al. [1,2] performed the initial research on the bolt loosening retrofit for the Iowa DOT. The bridges tested had K-type and X-type diaphragms. The focus of the research was on the web gaps in negative moment regions. Strain and displacement instrumentation was arranged in web gaps adjacent to a test diaphragm, which was evaluated before and after bolt loosening. Load trucks crossed the bridge in the original and retrofitted state. Results showed a minimum reduction of 48 percent of strains in the exterior negative moment region web gaps with maximum reductions nearing 85 percent. The bolt loosening retrofit proved to be more effective in X-type diaphragm bridges.
Many researchers have published papers on fatigue in steel girder bridges. Fisher et al. [3,4] has studied fatigue cracking in steel bridges in a number of common locations, including the web gap of multiple steel girder bridges. He suggested that a temporary retrofit be implemented as soon as a crack is discovered. A hole ranging from 3/4 to 1 inch in diameter should be drilled at the terminus of each crack. This procedure will change the stress concentration pattern around the end of the crack and is intended to stop crack propagation until a permanent retrofit can be implemented, and in some cases stop crack propagation altogether.
Stallings and Cousins et al. [5-8] have done research involving removal of the diaphragms to eliminate fatigue cracking caused by diaphragm live load reactions in multiple steel girder bridges. Load tests were performed on three-span bridges in which the diaphragms were removed and the lateral load distribution was investigated. An increase in stress in the maximum stress girder from 6 to 15 percent was noted. According to the researchers, this stress increase is acceptable in most cases and will not affect a bridge’s load rating. Wind loading and other lateral loads may not require the support of all diaphragms. They have determined that in many cases the diaphragm can be removed from a constructed steel girder bridge. In general the integral concrete deck performs the main function of the diaphragms, distributing lateral load, supporting the girders from lateral loading, and preventing lateral torsional buckling. Using these criteria it was determined that some or all of a bridge’s diaphragms could be removed safely on a case-by-case basis. Each bridge needs to be evaluated for lateral load and lateral support before diaphragms are removed.
31
Azizinamini et al. [9] has also evaluated the possibility of removing diaphragms from multiple steel girder bridges. Theoretical calculations were carried out using the AASHTO bridge design specifications to determine the effect of diaphragm removal on lateral torsional buckling. On the bridges Azizinamini tested, the calculations determined that removal of the diaphragms would not affect lateral torsional stability. Lab tests were performed on a constructed portion of a steel girder bridge to test lateral load distribution. Diaphragms were found to affect load distribution a small amount, but not a significant amount. Azizinamini concluded that diaphragms could be removed in some conditions at the discretion of the bridge owner.
Bridge Description
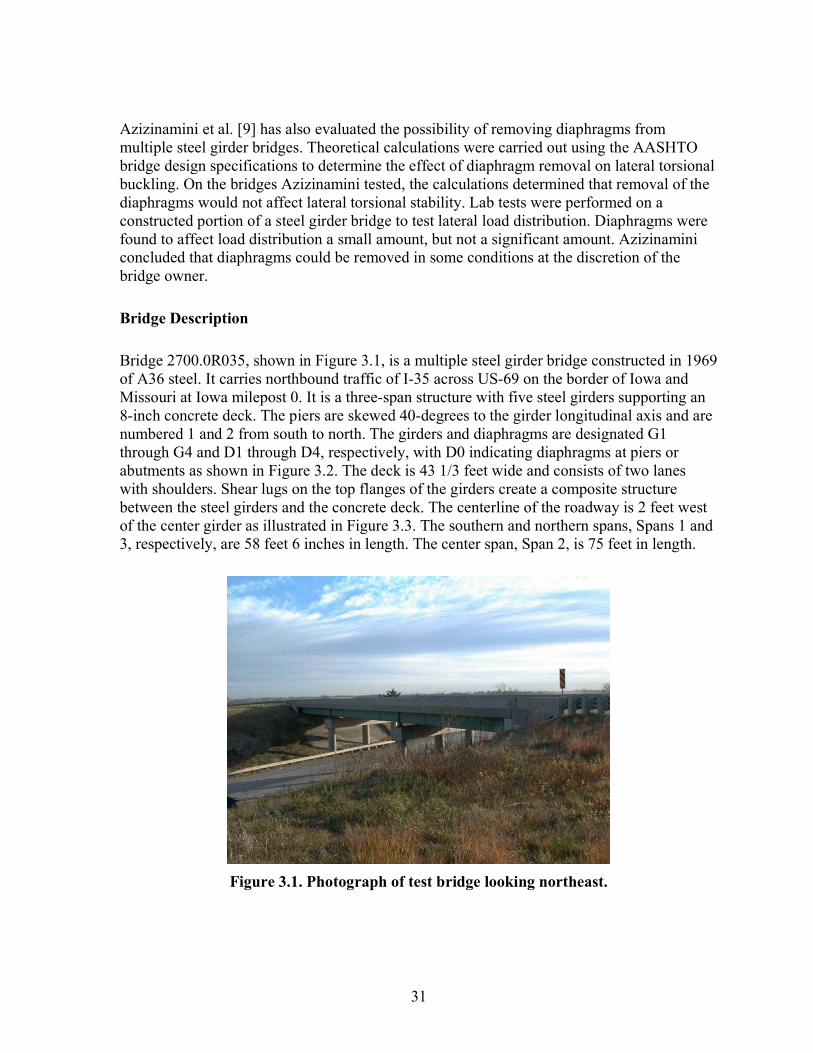
Bridge 2700.0R035, shown in Figure 3.1, is a multiple steel girder bridge constructed in 1969 of A36 steel. It carries northbound traffic of I-35 across US-69 on the border of Iowa and Missouri at Iowa milepost 0. It is a three-span structure with five steel girders supporting an 8-inch concrete deck. The piers are skewed 40-degrees to the girder longitudinal axis and are numbered 1 and 2 from south to north. The girders and diaphragms are designated G1 through G4 and D1 through D4, respectively, with D0 indicating diaphragms at piers or abutments as shown in Figure 3.2. The deck is 43 1/3 feet wide and consists of two lanes with shoulders. Shear lugs on the top flanges of the girders create a composite structure between the steel girders and the concrete deck. The centerline of the roadway is 2 feet west of the center girder as illustrated in Figure 3.3. The southern and northern spans, Spans 1 and 3, respectively, are 58 feet 6 inches in length. The center span, Span 2, is 75 feet in length.
Figure 3.1. Photograph of test bridge looking northeast.
32
G1
G2
G3
G4
G5
D0 North Abutment
D0 South Abutment
D0 Pier 1
D0 Pier 2
D3 D2 D4 D3 D2
D1 D1 D1
D3 D2
Span 1 Span 3 Span 2
N 58 ft-6 in 75 ft 58 ft-6 in
40-deg
Figure 3.2. Plan view of bridge superstructure.
G1 G3 G4 G2 G5
9ft-6in. 9ft-6in. 9ft-6in. 9ft-6in.
40 ft
C L Roadway
Passing Lane
Driving Lane
Figure 3.3. Cross section of bridge looking in direction of traffic.
The girders are spaced at 9 feet 6 inches and have varying cross sections in the negative and positive moment regions. The negative moment region has plate girders with PL36x1/2 webs, and PL12x1 3/4 top and bottom flanges. The plate girders are spliced 17 feet from the piers, at the dead load point of inflection. The positive moment midspan girders are 36WF135 wide flange rolled sections as illustrated in Figure 3.4.
33
PL12x1 ¾
17 ft 17 ft
36 WF 135 PL32x ½ 36 WF 135
C L Pier
Figure 3.4. Negative and positive moment region cross section of a girder.
The bridge has channel diaphragms connecting the five girders. The channel diaphragms are rolled 18C42.7 sections and are bolted to girder web stiffeners at varying spacings from 12 to 22 feet as shown in Figure 3.5. A typical diaphragm/girder connection is illustrated in Figure 3.6. The web stiffeners are welded to the web with small gaps at the top and bottom corners of the girder (i.e., the web gap). The web stiffeners are not connected to the top flange of the girders in the negative moment region. The web gap is 3/4 inches between the stiffener and the top flange as pictured in Figures 3.6 and 3.7. Fatigue cracks, subsequently described, in the web gap are typically parallel to the girder flange and are a couple of inches long extending on both sides of the stiffener.
34
Figure 3.5. Underside view of diaphragm and girders.
G1
Bolts
Stiffener
Diaphragm 18C42.7
Web Gap
PL12x1 3/4
PL32x1/2
PL12x1 3/4
Figure 3.6. Diaphragm/girder connection in negative moment region.
35
Figure 3.7. Typical web gap in negative moment region.
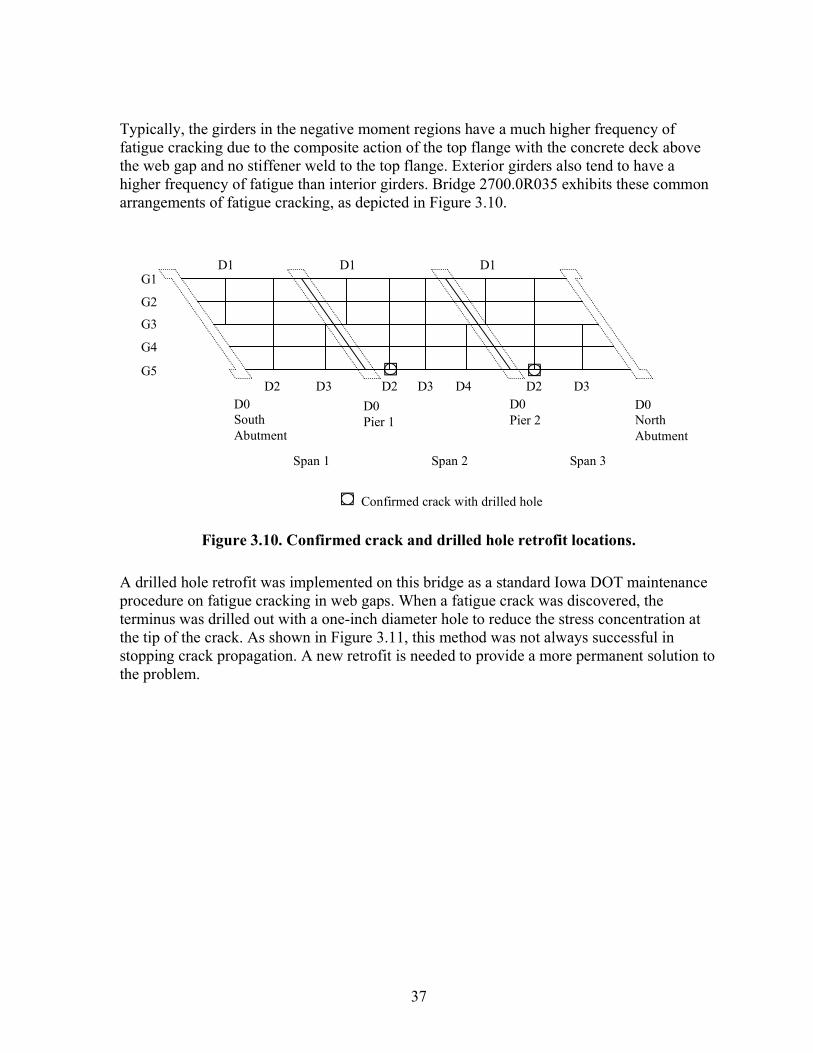
Bridge Behavior and Condition
Research has shown that the cause of fatigue cracking in diaphragms is differential deflection of the girders. Traffic placement on the deck and stiffness differences between interior and exterior girders result in the varying deflection of each girder. The diaphragms are essentially fixed at each girder and displaced with the girders. When differential deflection occurs, the diaphragms between adjacent girders behave as shown in Figure 3.8. The resulting rotational forces in the diaphragms create rotational forces in the girder webs. The webs deflect under the load in the weakest area, the web gap.
Double bending of the web gap is illustrated in Figure 3.9 exaggerated to highlight the behavior. Fatigue cracks are created in the web gap as cycles reach the limit of the steel. For this reason, high volume bridges are at a greater risk for fatigue cracking. Retrofitting the diaphragm/girder connection to create a pinned instead of a rigid connection allows the diaphragms to rotate with the differential deflection without introducing bending into the web gap and causing fatigue.
36
G2
G1
Figure 3.8. Exaggerated illustration of diaphragm double bending.
Web
Web Gap
Flange
Figure 3.9. Web gap double bending due to diaphragm rotation.
The 40-degree skew of the piers also plays a role in web gap fatigue. Greater differential deflection is created between girders when axle loads are dispersed between girders at different distances from the support pier. Loading girders at different distances from the skewed pier creates different bending moments and different deflections. The resulting larger differential deflection can cause greater out-of-plane displacement than would occur in the same bridge with no skew.
37
Typically, the girders in the negative moment regions have a much higher frequency of fatigue cracking due to the composite action of the top flange with the concrete deck above the web gap and no stiffener weld to the top flange. Exterior girders also tend to have a higher frequency of fatigue than interior girders. Bridge 2700.0R035 exhibits these common arrangements of fatigue cracking, as depicted in Figure 3.10.
Confirmed crack with drilled hole
G1
G2
G3
G4
G5
D0 North Abutment
D0 South Abutment
D0 Pier 1
D0 Pier 2
D3 D2 D4 D3 D2
D1 D1 D1
D3 D2
Span 1 Span 3 Span 2
Figure 3.10. Confirmed crack and drilled hole retrofit locations.
A drilled hole retrofit was implemented on this bridge as a standard Iowa DOT maintenance procedure on fatigue cracking in web gaps. When a fatigue crack was discovered, the terminus was drilled out with a one-inch diameter hole to reduce the stress concentration at the tip of the crack. As shown in Figure 3.11, this method was not always successful in stopping crack propagation. A new retrofit is needed to provide a more permanent solution to the problem.
38
Figure 3.11. Typical drilled hole retrofit in web with continued cracking.
Instrumentation
A negative moment region on an exterior and interior girder was selected for testing. A location adjacent to Pier 2, with minimum existing fatigue damage, was used. A combination of strain gages and displacement transducers were installed to determine the behavior of the bridge. Figure 3.12 shows the instrumentation installed at D3 in Span 2. The data from these gages were collected by an Optim Electronics Megadac data acquisition system (DAS) at a sampling rate of 30 hertz.
Web Gap Strain Gages Out-of-Plane Displacement Transducers Diaphragm Bending Strain Gages
G1 G2 G3 G4 G5
D0 North Abutment
D0 South Abutment
D0 Pier 1
D0 Pier 2
D3 D2 D4 D3 D2
D1 D1 D1
D3 D2
Span 1 Span 3 Span 2
Figure 3.12. Plan view of gage placement.
39
Bondable 120-Ohm gradient strain gages were used to measure web gap strain. The gradient gages consisted of five small foil-backed strain gages in a factory assembled unit. They were mounted in, or as close to, the web gap as possible as shown in Figure 3.13. The gages were oriented to measure web strain in the vertical direction in the web gaps of G1 and G2.
a. Photograph of gradient strain gage in web.
½ in.
1 in.
5 Active Strain Gages
Diaphragm
G2
½ in.
b. G2 gradient gage illustration looking northeast and southeast.
Figure 3.13. Web gap gradient instrumentation.
40
120-Ohm foil-backed strain gages were used to measure bending strain in the diaphragm. The gages were placed at the mid and quarter points of D3 in Span 2 on the top and bottom flanges of the channel to record the maximum bending strain in each position. The middle strain gages were 56 inches from the centerline of G1, and the quarter point gages were 26 inches from the nearest girder centerline as depicted in Figure 3.14.
Diaphragm
Web Gap
56 in.
26 in. 26 in.
1 ½ in.
G2 G1
Figure 3.14. Diaphragm strain instrumentation looking northeast and southeast.
Direct current displacement transducers (DCDTs) were used to measure displacement of the web gaps. Magnets were used to attach the gages to G1 and G2 near the connection with D3. G2 had an out-of-plane transducer measuring the displacement of the stiffener relative to the bottom side of the top flange where the magnet was connected. Figure 3.15 shows the connection of the transducer on G2. G1 is not pictured and is connected to the girder in an opposite manner. It measured out-of-plane displacement of the web by connecting to the stiffener and measuring the displacement of the top flange. The two gages measured the same type of out-of-plane displacement from different positions on the girder.
41
a. Photograph of out-of-plane and tipping transducers (not discussed) on G2.
Out-of-Plane Displacement Transducers
G2
2 in.
b. Illustration of G2 out-of-plane transducer locations.
Load tests were run on the bridge using the Iowa DOT tandem rear axle dump trucks illustrated in Figure 3.16. The average width of these trucks was 6 feet between the rear duals, and the length is approximately 18 feet from front axle to rear axle. The trucks were loaded with sand to simulate heavy trucks during testing. Truck 1 weighed 53,340 lbs and Truck 2 weighed 50,080 lbs.
42
6ft-10in.
14ft-6in.
18ft-11in.
6ft
34,300 lbs 15,780 lbs
6ft-8in.
14ft-9in.
19ft-2in.
6ft
14,100 lbs 39,240 lbs
a. Truck 1. b. Truck 2.
Figure 3.16. Test truck configurations.
Bolts were loosened on only two diaphragms. The D3 bolts between G1 and G2 were loosened. The adjacent section between G2 and G3 was also loosened to eliminate strain created by differential deflection between G2 and G3. Tests were run with the bolts in the tight, only middle row tight, and loose conditions. The middle row tight condition is illustrated in Figure 3.17. These bolt patterns were tested to see how the web gap strain changed as the diaphragm end condition changed. When all bolts were loosened, one or two on each side were held tight in the hole. These bolts were supporting the weight of the diaphragm and did not rotate in place; however, the diaphragm was free to rotate.
Tests were performed to find which lateral placement caused the largest strains in the instrumented area. Many truck lateral position combinations were tested. A single truck, Truck 1, was driven down the center of the passing lane similar to typical traffic. Tests were also run with the truck straddling G2 and with a wheel path directly on G2. In the end, a two-truck side-by-side arrangement was found to be the largest practical loading configuration and is illustrated in Figure 3.18. This represented the maximum load occurring when two large vehicles pass each other on the bridge. Truck 1 was in the center of the passing lane, and Truck 2 was in the center of the driving lane.
43
Truck 2
Truck 1
a. Plan view of trucks in side-by-side position.
Driving Lane Passing Lane
C L Roadway
G1 G2 G3 G4 G5
Truck 2 Truck 1
b. Cross section of bridge with trucks
Figure 3.18. Test truck placement on bridge in lanes.
Due to heavy interstate traffic, load tests were run at near interstate speeds. Static tests were determined to be too dangerous under the traffic load on I-35. The load trucks crossed the bridge at approximately 60 mph to maintain the flow of traffic. Running the test at interstate speeds produced results that were similar to the typical response of the bridge under ambient truck loading. A pace vehicle was used to slow traffic behind the load trucks. This created a gap in traffic during which the test data were retrieved without any interference from ambient vehicles on the bridge. Test data recording was initiated as the load trucks approached the bridge and continued until both trucks had crossed completely over the structure.
44
Experimental Results
Figure 3.19 shows the strains in the G1 web gap with the diaphragm connection bolts in the (b) tight condition, (c) only middle row tight condition, and (d) loose condition with the load trucks side-by-side as previously described. For reference, Figure 3.19 (a) shows the position of the gages in the gap.
The strain in the G1 web gap when both lanes are loaded is large, about 600 microstrain. The variation in strain and change in sign within the gap indicates double bending of the web. The force in the diaphragm rotates the connection as indicated previously in Figure 3.9 caused by greater deflection at G2 than G1. As G2 deflects below G1, the diaphragm rotates and pulls down on the web. The large magnitude of strain in the web gap can be attributed to its location on an exterior girder, girder stiffness, and the 40-degree skew of the piers, which increases differential deflection.
Partial loosening of the bolts reduces the strain in the gap by over 30 percent, but double bending is still distinguishable by the strain variations in the gap at peak loading. Loosening all the bolts reduces the strain in the gap by more than 80 percent. All the gages in the gap have approximately the same strain value, suggesting that double bending in the gap has been eliminated. The remaining strain in the web gap suggests a slight uniform bending of the web gap, which is not bending caused by forces in the diaphragms.
Figure 3.20 shows the strain in the G2 web gap. The bolt conditions and load placements are the same as in Figure 3.19. The positions of the gages in the web gap are indicated in the adjoining illustration.
The strain in the G2 web gap with the bolts tight is much smaller than the strain in the exterior web gap. The strain variations in the web gap suggest double bending is occurring at this connection as well. Partial loosening of the bolts is not very effective at reducing the strain in the web. After loosening all but the middle row of bolts, the strain is only reduced by approximately 20 percent, and double bending is still present. Full installation of the retrofit causes a strain reversal in the gap. The overall strain reduces by nearly 40 percent, but the sign is changed. Double bending is also no longer present in the gap when all bolts are loose. This suggests that the web gap is no longer being displaced out-of-plane by the diaphragm.
45
G1TG
G15G
G12G G13G G14G
0 2 4 6 8 10
-600
-500
-400
-300
-200
-100
0
100
Time, sec.
G1TG G12G G13G G14G G15G
a. Gage placement looking southeast. b. All bolts tight.
0 2 4 6 8 10
-600
-500
-400
-300
-200
-100
0
100
Time, sec.
G1TG G12G G13G G14G G15G
0 2 4 6 8 10
-600
-500
-400
-300
-200
-100
0
100
Time, sec.
G1TG G12G G13G G14G G15G
c. Middle row bolts tight. d. All bolts loose.
Figure 3.19. G1 gradient gage strain plots.
46
G25G
G2TG G22G G23G G24G
0 2 4 6 8 10-100
-50
0
50
100
Time, sec.
G2TG G22G G23G G24G G25G
a. Gage placement looking northwest. b. All bolts tight.
0 2 4 6 8 10-100
-50
0
50
100
Time, sec.
G2TG G22G G23G G24G G25G
0 2 4 6 8 10-100
-50
0
50
100
Time, sec.
G2TG G22G G23G G24G G25G
c. Middle row bolts tight. d. All bolts loose.
Figure 3.20. G2 gradient gage strain plots.
Figure 3.21 shows the strain in D3 resulting from loading in both lanes with bolts in the tight, only middle row tight, and loose positions. The trucks are located in the same location as in previous figures. The positions of the gages on the diaphragm are indicated on the adjoining illustration. Gages DB1 and DB2 were damaged during installation so no data are plotted for the exterior girder side of the diaphragm. The top gages are in compression and the bottom gages are in tension, which suggests positive bending of the diaphragm on the interior girder side. Because Gages DB1 and DB2 were damaged during installation, the strain behavior near G1, the exterior side, can only be speculated to show negative bending so that double bending of the diaphragm is occurring, as shown earlier in Figure 3.8. The strains in the diaphragm suggest the interior girder deflected more than the exterior girder.
47
DB6 DB4
DB3 DB5
0 2 4 6 8 10-20
-15
-10
-5
0
5
10
15
20
Time, sec.
DB3 DB4 DB5 DB6
a. Gage placement looking northeast. b. All bolts tight.
0 2 4 6 8 10-20
-15
-10
-5
0
5
10
15
20
Time, sec.
DB3 DB4 DB5 DB6
0 2 4 6 8 10-20
-15
-10
-5
0
5
10
15
20
Time, sec.
DB3 DB4 DB5 DB6
c. Middle row bolts tight. d. All bolts loose.
Figure 3.21. D3 bending strain plots.
The strain in the diaphragm, with only the middle row of bolts tight, exhibits a near 60 percent strain reduction. This is a larger reduction than the G1 web gap experienced with partial loosening. The strain in the diaphragm exhibits double bending, as with the tight bolt condition, but to a smaller degree due to the reduction of stiffness in the diaphragm/girder connection.
Following loosening of all bolts in the diaphragm connection, strain in the diaphragm was reduced 100 percent. This suggests that no measurable force is being transferred between
48
girders in the diaphragm due to differential deflection. Any strains in the web gap with the bolts loose are therefore not a result of diaphragm forces.
Figure 3.22 shows out-of-plane displacement in G1 and G2 with the bolts in tight, middle row tight, and loose conditions. The load trucks are side by side as previously described. The transducer locations are illustrated on the combined diagram. The method of attachment to G1 and G2 are opposite of each other in that the base of WD1 is attached to the stiffener while WD2 is attached to the top flange. The result is similar sign plots for movements at the gaps in the same direction. Typically instrumentation set up in exactly the same method in mirror locations on the right and left side of the girders would have opposite sign for similar movement, but the difference in base connection changes that effect. Movement of the G1 and G2 webs toward the interior of the bridge causes the WD1 to measure greater distance between the right stiffener and the web gap while WD2 measures a greater distance between the flange and the left stiffener as the stiffener moves laterally away from the flange.
The out-of-plane displacements of the webs of G1 and G2 with the bolts tight are similar in magnitude and direction. The out-of-plane displacements in both web gaps are towards the center of the bridge. The directions of these displacements are reflected in the web gap strains obtained with the bolts tight.
G1 web displacement is changed drastically and reversed displacement direction when the bolts are partially loosened. The maximum displacement reduces by 75 percent. G2 displacement was reduced by less than 25 percent. This non-uniform change is probably due to the unknown effect of partial bolt loosening. It appears that the exterior girder connection is relieved more than the interior connection when the middle row of bolts is left tight. The friction connection in the G2 diaphragm/girder connection is apparently tight while the G1 connection releases when the bolts are partially loose.
The out-of-plane displacement with all bolts loose shows G1 displacement remains similar to the middle tight condition, and G2 displacement reduced by 100 percent and exhibits no noticeable out-of-plane displacement. This suggests that the partial bolt loosening was not completely effective, and loosening all bolts results in the greatest reduction of out-of-plane displacements of the web gaps.
49
0 2 4 6 8 10-0.0010
-0.0005
0.0000
0.0005
0.0010
0.0015
0.0020
Time, sec.
WD1 WD2
WD2
WD1
+
+
G1 G2
a. Transducer placements looking northeast. b. All bolts tight.
0 2 4 6 8 10-0.0010
-0.0005
0.0000
0.0005
0.0010
0.0015
0.0020
Time, sec.
WD1 WD2
0 2 4 6 8 10-0.0010
-0.0005
0.0000
0.0005
0.0010
0.0015
0.0020
Time, sec.
WD1 WD2
c. Middle row bolts tight. d. All bolts loose.
Figure 3.22. G1 and G2 out-of-plane displacement plots.
Conclusions
The results of the field tests show that the retrofit does reduce strain and displacement in the web gaps of a channel diaphragm bridge. Removing all but one row of bolts created little decrease in strain in the diaphragm and the gap, suggesting that all bolts should be loosened to effectively eliminate diaphragm forces contributing to the strain in the web. Comparing the tight and loose conditions highlights the positive results of the retrofit.
50
Implementation Issues
Results have shown that implementing the bolt loosening retrofit on multiple steel girder bridges with channel diaphragms is a viable solution to web gap fatigue cracking. However, before this retrofit is installed in in-service bridges, a few key points need to be addressed on an individual bridge basis.
Lateral support for the girders and stability of the structure with the diaphragms loosened is a concern when installing the retrofit. Bracing for lateral torsional buckling is only important in the negative moment region, and the larger girders in the negative moment region generally provide adequate support for the unbraced length. ASSHTO design manual calculations indicate adequate lateral support for the I-35 bridge if the diaphragms are completely removed. The retrofit should not jeopardize the integrity of the structure because the diaphragms are still in place to provide lateral support between girders after only a small amount of lateral movement engages the bolts. Each bridge should have individual calculations performed to ensure stability assuming the diaphragms are completely removed.
Lateral load distribution regarding diaphragms must also be addressed. The change in lateral load distribution of the bridge was not thoroughly tested in this research, but other researchers have found that most bridges are conservatively designed for lateral load distribution and show little change in lateral load distribution with the diaphragms removed. Loosening the bolts in the diaphragm/girder connections is equivalent to removing the diaphragms all together when considering lateral load distribution. Both relieve the distribution of force in the diaphragms during loading.
A system must be devised to ensure that the loose bolts remain in place. The bolts must be secured so that they do not inadvertently fall out due to nut vibration under traffic load. The method of connection was not researched, but a lock nut or double nut technique may be a solution. Any solution implemented should be periodically inspected to ensure that it is functioning properly.
Prior to installation of the retrofit each particular bridge must meet the listed requirements and any other requirements determined by the engineer of record. Following installation of the retrofit, the bridge must be monitored closely until the engineer is convinced the bridge is stable and the diaphragms are safely secured to the stiffeners.
References
1. Wipf, T.J., and L.F. Greimann, A. Khalil. Preventing Cracking at Diaphragm/Plate Girder Connections in Steel Bridges. Iowa DOT Project HR-393. Ames, Iowa: Center for Transportation Research and Education, Iowa State University, 1998.
51
2. Khalil, A. Aspects in Nondestructive Evaluation of Steel Plate Girder Bridges.Dissertation. Ames, Iowa: Iowa State University, 1998.
3. Fisher, J.W., and P.B. Keating. “Distortion-Induced Fatigue Cracking of Bridge Details with Web Gaps.” Journal of Constructional Steel Research, Vol. 12, 1989, pp. 215-228.
4. Fisher, J.W. Fatigue Cracking in Steel Bridge Structures: Executive Summary. Advanced Technology for Large Structural Systems, Report No. 89-03. Bethlehem, Pennsylvania: Lehigh University, 1989.
5. Stallings, J.M., and T.E. Cousins, and T.E. Stafford. “Effects of Removing Diaphragms from Steel Girder Bridge. Transportation Research Record, Vol. 1541, 1996, pp. 183-188.
6. Stallings, J.M., and T.E. Cousins. “Fatigue Cracking in Bolted Diaphragm Connections.” Proceedings of the 15th Structures Congress 1997 Portland, Vol. 1. New York: ASCE, 1997, pp. 36-40.
7. Cousins, T.E., and J.M. Stallings. “Laboratory Tests of Bolted Diaphragm-Girder Connection.” Journal of Bridge Engineering, Vol. 3, No. 2, May 1998, pp. 56-63.
8. Cousins, T.E., J.M. Stallings, and T.E. Stafford. “Removal of Diaphragms from 3-Span Steel Girder Bridge.” Journal of Bridge Engineering, Vol. 4, No. 1, February 1999, pp. 63-70.
9. Azizinamini, A., S. Kathol, and M. Beachman. “Effects of Cross Frames on Behavior of Steel Girder Bridges.” 4th International Bridge Engineering Conference Proceedings.Washington, D.C.: TRB, 1995, pp. 117-124.
52
CHAPTER 4. IA-17 CONTINUOUS REMOTE MONITORING OF BOLT LOOSENING IN AN X-TYPE DIAPHRAGM STEEL BRIDGE
Abstract
Multiple steel girder bridges frequently experience fatigue cracking due to out-of-plane displacement of the web in the region of the diaphragm connections, especially in the negative moment regions of the girders. The web gaps are located at diaphragm connections where the stiffeners are not attached to the web or top flange near the fillet of the girder. In the past, the Iowa Department of Transportation (Iowa DOT) has drilled holes at the crack tips in an attempt to stop fatigue crack propagation in steel girder bridges. This retrofit was designed as a temporary solution in most cases and a more permanent retrofit for Iowa bridges is required. A field retrofit has been developed that involves loosening the bolts in the connections between the diaphragms and girders. Research on the retrofit has been initiated; however, no long-term studies of the effects of bolt loosening have been performed. The intent of this research is to develop a continuous remote monitoring system to investigate the bolt loosening retrofit over a number of months, ensuring that the measured strain and displacement reductions are not affected by time and repeated traffic loading. This will provide further evidence that the retrofit is an effective method of preventing web gap fatigue cracking in steel girder bridges.
Web gaps in a negative moment region on an Iowa DOT highway bridge with X-type diaphragms were instrumented with strain gages and deflection transducers. Controlled field tests, using loaded trucks of known weight and configuration, were conducted on the bridges with the bolts in the tight condition and after implementing the retrofit to measure the effects of loosening the diaphragm bolts. Long-term data were also collected to evaluate the response of the bridge to ambient truck loading a number of months before and after the retrofit was installed. The health-monitoring program continuously monitored the bridge and saved only significant data useful for analysis. The collected data were retrievable by a modem connection to the remote system. The features and ruggedness of this system reveal its usefulness in remote bridge monitoring, so the system will be used as a pilot system for future monitoring projects in Iowa.
Results indicate that loosening the diaphragm bolts reduces strain and out-of-plane displacement in the web gap, and that the reduction is not affected over time by traffic or environmental loading on the bridge. Reducing the strain in the web gap allows the bridge to support more cycles of loading before experiencing critical fatigue, thus increasing the service life of the bridge.
Introduction
Fatigue cracking is a common problem in multiple steel girder bridges with long service lives. The Iowa DOT has been dealing with this problem for years. Fifty-five percent of the
53
Iowa’s fatigue critical steel girder bridges exhibit fatigue cracking, fifteen percent of the structures overall. In almost all cases, these cracks occur in the web gaps at diaphragm connections with girders in the negative moment region. The web gap is approximately one inch of girder web not welded to the stiffener between the top flange and web stiffener welds. The stiffener plates in bridges are not welded to the tension flange as required by specifications for steel bridge design, allowing the potential for movement in the web gap. Forces created in the diaphragms by differential deflection of the girders apply force to the web gaps causing them to displace out-of-plane, which can result in fatigue cracking over time.
The Iowa DOT has been implementing a retrofit by drilling holes at the terminus of each crack to change the stress concentrations. The hole drilling method is not always effective either by design or installation, and the Iowa DOT has initiated a study of a new retrofit method. The new retrofit consisted of loosening the bolts that connect the diaphragms to the girders so the rotational freedom created allows the diaphragms movement independent of the girders while still supporting lateral load when needed.
The effects of loosening bolts at diaphragm/girder connections over an extended period of time are unknown. The stability of the retrofit directly after installation has been previously studied, but no research has focused on the long-term effects of the retrofit. A test documenting the stability of the retrofit months after installation is required to ensure the retrofit can be implemented safely. The objective of this research is to document the results of a long-term monitoring study of the bolt loosening retrofit on a bridge in Iowa to demonstrate that the behavior of the bridge is constant over time with traffic loading. In order to achieve this objective, a data acquisition system (DAS) was assembled that monitored the bridge continuously from an on-site location. The system was well suited for long-term studies and could not only distinguish and record important data, but could also be controlled remotely by a modem connection. Real-time displays of the instrumentation on the bridge provided practically instant indications of the condition of the bridge without a site visit. The system was developed not only for this project, but also as a model for future remote bridge monitoring applications. Its adaptability and rugged design make it useful in many monitoring situations.
Previous Research
Khalil and Wipf et al. [1,2] have studied the effects of loosening the bolts of K-type and X-type diaphragms in multiple steel girder bridges. Research for the Iowa DOT included field testing of the retrofit in select bridges in Iowa. The test bridges were instrumented, and load test data were collected prior to bolt loosening. The bolts in a small portion of the bridge, around the instrumentation, were loosened and more load test data were collected. The results of this testing showed that the retrofit was more effective in X-type diaphragm bridges and that a reduction in strain and displacement in the exterior web gap of at least 48 percent occurred following installation.
54
Fisher et al. [3] has spent many years researching a hole drilling retrofit for fatigue cracking in steel bridges. Holes can be drilled at the terminus of cracks parallel to the primary stress in a member to change the stress concentration at the crack tip. This retrofit was applied to many types of cracking but was specifically applied to cracking in the web gaps of girders. This retrofit will stop the propagation of the crack in situations where the web is cracked enough to allow adequate rotation of the diaphragm during differential deflection. In most cases, however, this retrofit is a temporary repair and other action needs to be taken to repair the problem. A bolted connection between the stiffener plate and the top flange is suggested.
Other research has been conducted to determine the effectiveness of removing the diaphragms altogether. Cousins and Stallings et al. [4,5] and Azizinamini et al. [6] studied this possibility. Cousins and Stallings field-tested bridges with the diaphragms removed to determine the effect this had in lateral load distribution factors. The bridges tested were typical three-span multiple girder bridges. The results demonstrated that the girder experiencing maximum strain could be expected to increase by 5 to 15 percent following removal of the diaphragms. They concluded that this value is not significant to affect most bridges as the load ratings are generally conservative enough to handle a 15 percent change. Thus, the bridges tested did not experience a change in service load capacity following removal of the diaphragms. Azizinamini et al. studied the diaphragm removal option from the bridge stability standpoint. Calculations using the American Association of State Highway and Transportation Officials (AASHTO) design manual on select three-span multiple girder bridges demonstrated that the diaphragms were not required for lateral torsional support. This research suggests that on typical three-span bridges, the diaphragms may not be required for load distribution or stability.
A number of researchers have collected data on bridges using remote monitoring systems. Chajes et al. [7] and Aktan et al. [8] designed and implemented remote monitoring systems on bridges involved in their studies. Chajes set up a battery-powered system that could be triggered by a monitored channel reaching a threshold. The system conserved data space by collecting only data that exceeded a predetermined trigger value. The battery power of the system also allowed for remote installation without connection to a power source. Aktan’s system was connected to external utilities that allowed the system to be powered continuously and contacted from a secure location. A video camera and many gages were installed to monitor the bridge and data was collected at certain times of the day. The data from the remote tests were easily accessible and downloadable to a computer in the laboratory. The system is planned to be upgraded to a high-speed internet connection in the future, allowing real-time display of data and pictures and efficient downloads.
Bridge Description
Bridge 4048.2S017, pictured in Figure 4.1, was selected for testing because it is an X-type diaphragm multiple girder steel bridge with no existing fatigue cracking in the web gaps. It was also used in previous bolt loosening retrofit research for the Iowa DOT [1,2]. It is a five-girder bridge built in 1970 and carries north and south Iowa Highway 17 traffic across the
55
Boone River in central Iowa’s Hamilton County. The bridge has three spans with no skew, and an 8-inch concrete deck. The two end spans are 97 feet 6 inches, and the center span is 125 feet. Figure 4.2 shows a plan view of the bridge; girders are designated with G and diaphragms are labeled with D with diaphragms at piers and abutments numbered 0.
Figure 4.1. Photograph of bridge looking northeast.
97ft-6in. 125 ft 97ft-6in.
D0 Pier 1
D0 Pier 2
D0 South Abutment
D0 North Abutment
D2 D3 D4 D1 D2 D3 D5 D4 D1 D2 D3 D4 D1
G5
G4
G3
G2
G1
N
Figure 4.2. Plan view illustration of bridge superstructure.
56
The girders in this bridge are spaced at 10 feet on center and are not a uniform cross section throughout the length of the bridge. The negative and positive moment regions of the girders as well as interior and exterior girders have varying cross sections. The negative moment regions have two different sections, and the positive regions have one. The interior girders are slightly larger than the exterior girders. Interior girders webs are PL59 1/2x3/8. The section 11 feet either side of the pier bearings has PL21x1 1/2 flanges. The remaining negative moment region, 30 feet either side of the bearing, has PL15x1 1/2 flanges. The interior girders’ positive moment sections consist of PL60 3/4x3/8 webs with PL15x1 bottom flanges and PL12x3/4 top flanges as shown in Figure 4.3. The exterior girders have very similar cross sections except that plates are typically 1/8-inch thinner in dimension than the interior girders.
PL21x1 1/2
PL60 3/4x3/8
PL15x1 1/2 PL12x3/4
PL15x7/8 PL59 1/2x3/8
Positive Moment Negative Moment
Figure 4.3. Profile illustration of exterior girder with plates labeled.
The diaphragms in this bridge are an X-type diaphragm made up of angles and a horizontal T section as illustrated in Figure 4.4. The exception is that diaphragms at the abutments and piers, D0, are wide flange sections. The diaphragms are spaced at 20 feet along the length of the bridge. The angles are L4x3x5/16 and the T is an ST5WF10.5 and they are bolted to web stiffeners on the main girders as shown in Figure 4.5. The connection of the stiffener to the web stops short of the fillet weld of the top flange where clips in the stiffener do not touch the girder web. The area of the web between the stiffener weld and the top flange, pictured in Figure 4.6, is the web gap.
57
G1 G2 G3 G4 G5 10ft 10ft 10ft 10ft
47ft-4in.
C L Roadway
Southbound Lane
Northbound Lane
Figure 4.4. Illustration of bridge cross section with stiffeners.
Web Gap
G1
Figure 4.5. Diaphragm connection with web gap at stiffener clip.
58
Figure 4.6. Photograph of typical web gap.
Fatigue cracking in Iowa bridges is typically associated with the web gap region. Traffic crossing the bridge causes the girders to deflect relative to each other. Bending forces are created in the diaphragms between girders, as the diaphragm/girder connection does not allow rotation of the diaphragm to occur. The rotation of the diaphragms causes a force on the girder web, which results in out-of-plane displacement of the web gap, as illustrated in Figure 4.7. Repeated cycles of out-of-plane displacement can lead to fatigue cracking. Typically fatigue cracking occurs in the negative moment region web gaps and more commonly in the exterior diaphragm/girder connection due to the stiffness of the integral deck and top flange and the diaphragm force in the exterior girder. The IA-17 bridge was selected because it has no fatigue cracking in the web gaps. Instrumenting web gaps with no cracks and drilled holes provides a better environment for accurate strain readings in the web gap because strain gages are more easily applied near the web gap in gaps without cracking. It also ensures that the out-of-plane displacement of the web gap is not increased by a discontinuity in the web gap.
Web Gap
Figure 4.7. Web gap bending from diaphragm rotation.
59
Experimental Approach
A negative moment region at an exterior and interior girder was selected for instrumentation because this region is most commonly associated with web gap fatigue cracking. A combination of strain gages and displacement transducers were installed to determine the behavior of the bridge with and without the retrofit. An area below the northbound lane in Span 2 between G1 and G2 was used for the majority of instrumentation as shown Figure 4.8.
Web Gap Strain and Displacement Gages Longitudinal Bending Strain Gages
Diaphragm Bending Strain Gages
97ft-6in. 125 ft 97ft-6in.
D0 Pier 1
D0 Pier 2
D0 South Abutment
D0 North Abutment
D2 D3 D4 D1 D2 D3 D5 D4 D1 D2 D3 D4 D1
G5 G4 G3 G2
G1
Figure 4.8. Instrumentation locations on superstructure.
Due the long-term nature of this test, a remote monitoring DAS was used. The system requirements for an on-site application include the capability of stand-alone data collection so that no supervision of the system is required, ability to withstand the harsh environment of remote deployment, and ability to be controlled and monitored by modem or radio connection. The system selected after product testing was a Campbell Scientific CR 9000 DAS. It possessed a high scan rate and had a modem connection for upload, download, and real-time viewing of data. Initially a system with 28 channels was purchased, and the instrumentation for the test was designed with that limit. An enclosure for the unit was attached to the top of Pier 2 between G1 and G2 as shown in Figure 4.9. The enclosure provided protection for the DAS from the elements and vandalism during the test period. Instrument cables were wired into the box through electrical conduit to limit the environmental access to the DAS electrical systems. Electrical power and telephone utilities were installed at the site and routed to the enclosure to power and control the system. The same instrumentation was used for both the short-term and long-term tests.
60
Figure 4.9. Photograph of DAS enclosure on Pier 2.
Gradient strain gages were used to measure strain in the web gaps. The gradient gages consisted of five foil-backed strain gages assembled in one unit. The entire gage was approximately 1 inch by 1/2 inch as seen in Figure 4.10. One gage was placed in the G1 web gap at D5, and another in the G2 web gap at D5. These gages are not rugged and had to be replaced during the course of the testing as the environment eventually damaged the gages.
Environmentally shielded direct current displacement transducers (DCDTs) were used to measure out-of-plane displacement in the web gap. The DCDTs had covers to protect movable parts from the environment and to allow them to function properly in dust, condensation, and ice. The transducers can be seen in Figure 4.11.
Two DCDTs were mounted on G1 as well as G2. Magnets were used to hold the gages to the bridge and epoxy was used to reinforce the magnetic attachment. One gage measured the out-of-plane displacement of the web between the top of the web stiffener and the vertical face of the top flange. The other measured tipping in the girder flange between the girder web and the edge of the underside flange face, which is not discussed in this report.
61
a. Photograph of G1 gradient gage.
G1
Gradient Gages
b. G1 web gap gradient gage position looking north and east.
Figure 4.10. Web gap gradient gage location.
62
a. Photograph of out-of-plane and tipping transducers.
G1
Out-of-plane Transducers
b. Transducer locations looking north and east.
Figure 4.11. Web gap transducer placement.
63
Durable 120-Ohm weldable strain gages were used on the diaphragm and girders to measure strain. These gages are manufactured for outdoor use and are hermetically sealed from the environment. The welded bond between the bridge and the gage also ensures a long life for the gage because the gage is less likely to delaminate from the bridge or develop electrical shorts over time. Three gages were placed on the diaphragm as shown in Figure 4.12. One gage was welded to each member of the diaphragm to monitor the forces transferred between girders. Five gages were welded to the girders near the pier and at midspan. G1 and G2 had a gage mounted on the top and bottom flanges 36 inches from the pier. The fifth gage was placed in the center of Span 2 on G2 and was added after long-term testing had started as a possible alternative control trigger for the DAS.
G1
Diaphragm Gages
Figure 4.12. Diaphragm gage location looking north and east.
Test Procedure
Load testing the bridge occurred in several phases before and after the retrofit was installed. An initial load test was performed on September 6, 2000, with the bridge in its original state, without the retrofit installed. An Optim Electronics Megadac DAS was used to collect data from this initial test. The Megadac had been used frequently by researchers at Iowa State University and was known to provide accurate measurements. It was important to collect reliable initial data to provide a basis for evaluation of subsequent continuous monitoring data. A standard Iowa DOT dump truck was used for the load testing of the bridge. The truck weighed 49,560 lbs and crossed the bridge at different speeds in the northbound lane. A similar truck, weighing 45,980 lbs, was used to load the southbound lane to document the effect of traffic not directly over the instrumented area.
64
In March 2001 the first test model of a continuous monitoring DAS, an IOtech Inc. Logbook 300, was brought on line after months of testing. The DAS constantly monitored the gages on the bridge and stored the information in its short-term memory. When a programmed trigger threshold was reached, the system recorded a predetermined period of data into a data bank. A strain gage on the bottom flange of G2 was used as a trigger to inform the DAS that a truck of substantial size was traveling in the northbound lane. A strain of more than 20 microstrain was equivalent to a truck of approximately 50,000 lbs and caused the system to permanently record 12 seconds of data, 6 seconds before the trigger event and 6 seconds after. Two weeks of data were obtained using this system, but the data were not suitable for the harsh environment in a remote location, and data collection was halted pending installation of a new, more reliable, system.
In September 2001 installation of the Campbell Scientific CR 9000 continuous monitoring DAS was completed and testing with ambient traffic was initiated. The Campbell system was durable enough to withstand the field-testing environment and was selected as the DAS for this research. The DAS constantly monitored the gages of the bridge at 100 Hz and stored the information in short-term memory. The G1 gradient gage was used as a trigger to inform the DAS that a truck of appropriate size was traveling in the northbound lane. A strain of more than 200 microstrain, again a truck of approximately 50,000 lbs, caused the system to record 16 seconds of data in long-term memory, 8 seconds before the trigger event and 8 seconds after. The data saved during a trigger event were averaged to 10 Hz to reduce storage size and to smooth the data for later analysis. This system recorded ambient truck traffic on IA-17 through December 2001, when the bolt loosening retrofit was installed.
The bolt loosening retrofit was installed on December 18, 2001. Load tests using an Iowa DOT truck of 39,660 lbs at 55 mph were completed before and after the bolts were loosened to verify ambient data collected by the DAS. Data were recorded for 16 seconds, as with ambient traffic, but the controlled load tests had only the load truck on the bridge during each test. Northbound and southbound test passes were completed. Unfortunately the load test data for the loose bolt condition were lost shortly after testing and only the tight bolt condition data were retrieved for analysis. A second test with an Iowa DOT truck, as discussed below, was required to collect loose bolt data.
The retrofit was installed on two bays of D5 between G1 and G2, and G2 and G3, as seen in Figure 4.13. The bolts connecting the horizontal T section to G1 were not loosened because they were inaccessible, but the member was released on the G2 side. Releasing the diaphragm between G2 and G3 prevented forces induced in the diaphragm between them from affecting the instrumentation on G2. The bolts were loosened just enough to allow free movement of the diaphragm members, and the nuts were bound in place by the paint on the end of the bolts. In some cases liquid thread locker was used to further secure the nuts.
65
Loose Bolts
G3 G2 G1
Figure 4.13. Illustration of G1 to G3 with diaphragm bolt loosening indicated.
Following the load tests, the DAS was returned to continuous monitoring mode. Due to the reduction in web gap strain with the retrofit in place, a strain gage on the bottom flange of G2, 36 inches from the pier, was used to trigger the DAS. The strain in this gage was not affected by the local loosening of diaphragm bolts in two diaphragm sections and was useful in comparing truck signatures before and after bolt loosening.
Other researchers [4,5] have suggested a change in the lateral load distribution in a bridge that has had the diaphragms removed. The strain in the two girders directly associated with diaphragm loosening in this test show little sign of reduction or increase in loading. The results only reflect a small portion of the bridge with only two diaphragms loosened, but it can be concluded from them with a fair amount of certainty that loosening the diaphragms on this bridge has little effect on its lateral load distribution. Because of this phenomenon, trucks of similar weights in similar positions on the bridge create similar longitudinal strain values, regardless of the retrofit state of the bridge.
Due to the loss of loose bolt data with an Iowa DOT load truck, a second load test was completed on February 5, 2002. An Iowa DOT load truck of 49,960 lbs crossed the bridge at 55 mph. The truck was placed in the northbound lane. This data set combined with the previous controlled load test data with the bolts tight provides a signature load pattern that is used to interpret ambient loading data for the bridge in the tight and loose conditions. Ambient trucks of similar configurations and loadings exhibit similar strain patterns to the Iowa DOT trucks and can be selected for analysis based on that similarity. The typical configuration for an Iowa DOT load truck is shown in Figure 4.14.
66
6ft-8in
15ft
19ft
6ft
Figure 4.14. Typical load truck configuration.
Short-Term Experimental Results
The data used to examine the short-term response of the bridge were the tight bolt data from December 18, 2001, and the loose bolt data from February 2, 2002. It was desirable to use the same truck and weight for comparison of data before and after the installation of the retrofit, but this was not possible due to the loss of loose bolt data so a different truck was used. The Truck T (tight bolts) and the Truck L (loose bolts), as they were designated, had comparable configurations; however, the tight truck weighed 39,660 lbs as previously stated, and the loose truck weighed 49,960 lbs.
Testing of this and other bridges has shown little change in the longitudinal strain in the bottom flange of the girders near the pier before and after installation of the retrofit. Because the longitudinal strain is relatively unchanging between tight and loose bolts it can be used to normalize the data from the lighter Truck T to the heavier Truck L. It is assumed that a linear relationship exists between the data obtained in each test and that the difference in load can be factored out of the results. The importance of the data is not exact values, but the overall reduction of strain in the web gap in the long and short term. Introduction of normalization to the Truck T data increased strain and displacement values and also increased the resulting reductions from the retrofit. The figures presented show the unnormalized data; however, the reduction percentages were calculated including a normalization factor of approximately 0.2.
Figure 4.15 shows the strain in the G1 web gap with the diaphragm/girder connection bolts in the tight and loose conditions. Each plot represents a single load truck in the northbound lane above the instrumentation. The Figure 4.15 (b) tight data are from Truck T, and the Figure 4.15 (c) loose data are from Truck L. The location of the individual gradient gages is indicated on the adjoining illustration, Figure 4.15 (a).
The strain in the web gap is reduced by more than 80 percent when the bolts are loose. This value is even larger when the increased weight of the loose truck is taken into consideration (i.e., the strain with all bolts tight would be greater with a larger load, and the subsequent reduction would be greater than 80 percent). The strain changes sign within the gap when the
67
bolts are tight, indicating double bending of the web gap, shown previously in Figure 4.7. A small amount of strain remains in the web gap following loosening of the bolts; however, the double bending is removed from the web gap as suggested by the uniform strain throughout the gap. This suggests that the diaphragm is no longer creating the displacement in the web gap.
G1TG
G15G
G12G G13G G14G
a. Location of gradient gage looking east at G1.
0 2 4 6 8 10 12 14 16-250
-200
-150
-100
-50
0
50
100
Time, sec
G1TG G12G G13G G14G G15G
0 2 4 6 8 10 12 14 16-250
-200
-150
-100
-50
0
50
100
Time, sec
G1TG G12G G13G G14G G15G
b. All bolts tight. c. All bolts loose.
Figure 4.15. G1 gradient strain plots.
Figure 4.16 shows the gradient gage strain in the G2 web gap. The gage is located on the east side of G2 as illustrated in the figure. The loading is from Truck T and Truck L as in the previous figure. All gages are not shown in each plot because two of the gages suffered environmental damage between tests. Extended exposure to the elements occasionally damages the gages mounted on the bridge. The maximum strain in the G2 web gap is in the G2TG location, which was functioning during both tests. The plots show a reduction of strain in the gap at that gage of approximately 50 percent. Double bending is noticeable in the G2 web gap as well as the G1 web gap as illustrated in Figure 4.7. Loosening the bolts does not eliminate the double bending in the G2 web gap. The strain values of each gage are not equal, which indicates uniform bending; however, they are all the same sign and of similar values, suggesting a near uniform bending of the gap.
68
G1TG
G15G
G12G G13G G14G
a. Location of gradient gage looking west at G2.
0 2 4 6 8 10 12 14 16-20
-10
0
10
20
30
40
Tim e, sec
G 2TG G 23G G 24G G 25G
0 2 4 6 8 10 12 14 16-20
-10
0
10
20
30
40
Time, sec
G2TG G23G G25G
b. All bolts tight. c. All bolts loose.
Figure 4.16. G2 gradient strain plots.
Figure 4.17 shows the strain in D4 between G1 and G2 before and after the bolt loosening retrofit. The gages were located on the G1 side of the diaphragm as indicated. Gage DB1 was inoperable at the time of the test and is omitted from the plots. The tight and loose truck loadings were different as presented above.
The strain in the diaphragm members was not completely eliminated by the bolt loosening retrofit, but the values are significantly reduced, only slightly less than 100 percent. The remaining strain in the diaphragm may be a result of the tight bolts at G1 on the bottom T as is also suggested by slight double bending of web gap G2 with the bolts loose, as discussed above.
69
DB1
DB2
DB3
G1
a. Location of strain gages looking north at D4.
0 2 4 6 8 10 12 14 16-40
-30
-20
-10
0
10
20
Time, sec
DB2 DB3
0 2 4 6 8 10 12 14 16-40
-30
-20
-10
0
10
20
Time, sec
DB2 DB3
b. All bolts tight. c. All bolts loose.
Figure 4.17. D4 strain plots.
Figure 4.18 shows the out-of-plane displacement in the G1 and G2 web gaps at D4. The location of WD1 on the web stiffener is illustrated. Transducer WD2 is in a similar location to WD1 except it is mounted on G2 between G1 and G2. Truck T and Truck L are the loads for the plots as above.
Out-of-plane displacement of the web gaps is reduced, but not eliminated by the bolt loosening retrofit. The displacement in the web gaps is reduced by at least 50 percent. The reduction of peak displacement in the web gaps corresponds in a similar manner to the reduction of peak strains in the web gaps, which verifies a relationship between the strain and displacement in the gaps.
70
WD1
G1
a. Location of G1 transducer looking north at D4.
0 2 4 6 8 10 12 14 16-0.0010
-0.0005
0.0000
0.0005
0.0010
Time, sec
WD1 WD2
0 2 4 6 8 10 12 14 16-0.0010
-0.0005
0.0000
0.0005
0.0010
Time, sec
WD1 WD2
b. All bolts tight. c. All bolts loose.
Figure 4.18. Web Gap out-of-plane displacement plots.
Figure 4.19 shows the longitudinal strain in the bottom flange of G2 near Pier 2 in the negative moment region. The loading during the plots is the same as previous figures. The gage position is 36 inches from the Pier 2 bearing.
Longitudinal strain in the girders is not affected by the loosening of bolts on such a small scale. Because of this, the longitudinal strain is effective in determining the general truck weight and for triggering the DAS. Figure 4.19 reflects this fact by depicting similar strain patterns for each test, before and after loosening bolts. The loose bolt plot indicates an increase in maximum strain of approximately 20 percent, which correlates directly to the 20 percent increase in load of the tight truck compared to the loose truck. This is the basis of the normalization of data discussed previously.
71
LB2
Pier 2
a. Location of G1 transducer looking north at D4.
0 2 4 6 8 10 12 14 16-30
-20
-10
0
10
Time, sec
LB2
0 2 4 6 8 10 12 14 16-30
-20
-10
0
10
Time, sec
LB2
b. All bolts tight. c. All bolts loose.
Figure 4.19. Longitudinal girder strain plots.
Long-Term Experimental Results
One of the goals of this research was to monitor the effect that the bolt loosening retrofit has on an in-service bridge over a long period of time. Ambient data were collected over eight months, four months of tight data and four months of loose data. Trucks of similar weights were compared throughout testing to investigate any change in strain value with the bolts tight and loose.
The results were compared using the longitudinal strain, depicted in Figure 4.19, because of the continuity of values between tight and loose conditions for equal weight trucks. As discussed previously, the change in longitudinal bending strain between tight and loose bolt conditions has proven to be negligible under the same load condition. The Iowa DOT load
72
trucks exhibited a longitudinal strain of approximately 20 microstrain in LB2 so that value was used to distinguish trucks of similar weight. Figure 4.20 shows the maximum strain in the G1 web gap of selected vehicles collected during testing with the bolts tight and loose. One vehicle for each month is presented along with the Iowa DOT load test trucks. The maximum longitudinal strain reveals similarity in loadings, and the web gap strain reveals similar responses of the web gap for those loadings.
DO T Dec. Jan. Feb. M ar.0
-20
-160
-180
-200
Load Truck
LB2 G 12G
DOT Sep. Oct. Nov. Dec.0
-20
-160
-180
-200
Load Truck
LB2 G12G
a. All bolts tight. b. All bolts loose.
Figure 4.20. Maximum G1 web gap strains and G2 longitudinal strains for individual truck loadings.
The maximum strains in the G1 web gap are approximately 200 microstrain with the bolts tight. The four months following bolt loosening show approximately 20 microstrain, and show no signs of changing over time. Slight variations in the web gap values are partially due to slightly different weights of the ambient truck loadings. The correlation between load and gap strain is illustrated in Figure 4.20. Occasionally the value of the longitudinal strain and web gap strain did not match the general trend; this can be accounted to unknown truck type and small variations that occur from test to test. No two trucks had exactly the same longitudinal strain value. Regardless of slight variations in the strain data, the overall strain reduction was effective and strain in the web gaps had no tendency to change over time following retrofit installation.
Conclusions
The test results show that the bolt loosening retrofit reduces the strain in the web gap and the diaphragms. The near complete reduction of strain in the web gap indicates that the force in the diaphragms caused by differential deflection is nearly eliminated. The forces in these diaphragms cause the out-of-plane displacement in the web gaps, which results in fatigue
73
cracking. The lack of diaphragm force, which results in the illustrated reduction of strain and displacement in the web gaps, proves that this retrofit is effective in stopping fatigue cracking.
Long-term testing of an in-service bridge with the bolt loosening retrofit installed on a small scale show that the retrofit remains effective after months of use. Settlement or binding of the connection does not occur over time and the reduced strain results remain stable. This further promotes the suitability of this retrofit for the elimination of web gap fatigue cracking in in-service bridges.
The Campbell Scientific DAS in these test performed well. It was rugged and capable of withstanding the harsh environment associated with remote installation. The system recorded only data of importance and reduced storage space and data manipulation time. The remote connection to the system allowed data to be downloaded from a remote computer and also provides real-time plots of sensor values. Important gages can be plotted for quick review of key aspects of a bridges performance. The triggered data storage also makes collection of peak events possible. General statistical information about response to ambient loading could be collected from the data obtained with this system. Improvements in technology and continued research could lead to combined video and graphical output from a bridge available real-time or collected from peak values. The system could also be programmed to set off alarms if safe thresholds are exceeded, which be especially useful in large, heavily used bridges where inspection is difficult and hazardous.
Implementation Issues
The bolt loosening retrofit provides an inexpensive solution to web gap fatigue cracking provided diaphragm adjustments are acceptable on the bridge in question. Before this retrofit is installed on in-service bridges, a few key points need to be addressed on an individual bridge basis.
Lateral support for the girders and stability of the structure with the diaphragms need to be addressed for each bridge retrofitted. Bracing for lateral torsional buckling is important in the negative moment region and the larger girders in the negative moment region generally provide adequate strength over the unbraced length. This usually allows for removal of diaphragms in the negative moment region, but the engineer must determine the girders are satisfactorily braced before implementing the retrofit. A check of stability was performed on this bridge using AASHTO load and resistance factor design (LRFD) specifications. It was calculated that the diaphragms could be removed from the negative moment regions of the bridge without affecting the moment capacity of the girders.
Lateral load distribution regarding diaphragms is also a concern. The change in lateral load distribution of the bridge was not thoroughly tested in this research, but other researchers have found that most bridges show little change in lateral load distribution with the
74
diaphragms removed. The bolt loosening retrofit relieves the force in the diaphragms and is equivalent to diaphragm removal concerning lateral load distribution. The engineer should determine that the bridge has a satisfactory rating to safely carry up to 15 percent more strain in the maximum strain girder.
A system must be devised to ensure that the bolts remain in place so that the diaphragms are not at risk of falling. The nuts on the bolts may reverse due to bolt vibration under traffic load allowing the bolts to fall out. The method of connection was not researched, but a lock nut or double nut technique may be a solution. It was noted during long-term testing of the retrofit that longer bolts might need to be installed to provide room for nut locking techniques. A liquid thread locker was used in this research and may be another option. Any solution implemented should be periodically inspected to insure that it is functioning properly.
Each bridge must meet the listed requirements and any other requirements determined by the engineer before the retrofit is installed. The effects of the retrofit must be monitored closely until the engineer is convinced the bridge is stable and the diaphragms are safely secured to the stiffeners.
References
1. Wipf, T.J., L.F. Greimann, and A. Khalil. Preventing Cracking at Diaphragm/Plate Girder Connections in Steel Bridges. Iowa DOT Project HR-393. Ames, Iowa: Center for Transportation Research and Education, Iowa State University, 1998.
2. Khalil, A. Aspects in Nondestructive Evaluation of Steel Plate Girder Bridges.Dissertation. Ames, Iowa: Iowa State University, 1998.
3. Fisher, J.W., and P.B. Keating. “Distortion-Induced Fatigue Cracking of Bridge Details with Web Gaps.” Journal of Constructional Steel Research, Vol. 12, 1989, pp. 215-228.
4. Stallings, J.M., and T.E. Cousins. “Fatigue Cracking in Bolted Diaphragm Connections.” Proceedings of the 15th Structures Congress 1997 Portland, Vol. 1. New York: ASCE, 1997, pp. 36-40.
5. Cousins, T.E., J.M. Stallings, and T.E. Stafford. “Removal of Diaphragms from 3-Span Steel Girder Bridge.” Journal of Bridge Engineering, Vol. 4, No. 1, February 1999, pp. 63-70.
6. Azizinamini, A., S. Kathol, and M. Beachman. “Effects of Cross Frames on Behavior of Steel Girder Bridges.” 4th International Bridge Engineering Conference Proceedings.Washington, D.C.: Transportation Research Board, 1995, pp. 117-124.
75
7. Chajes, M.J., H.W. Shenton III, and D. O’Shea. “Bridge-Condition Assessment and Load Rating Using Nondestructive Evaluation Methods.” Transportation Research Record,Vol. 2, No. 1969, 1998, pp. 83-91.
8. Aktan, A.E., K.A. Grimmelsman, and R.A. Barrish. “Structural Identification of a Long-Span Truss Bridge.” Transportation Research Record, Vol. 2, No. 1696, 2000, pp. 210-218.
76
CHAPTER 5. TESTING OF BOLTED STIFFENER RETROFIT ON I-29 FLOOR BEAM STEEL GIRDER BRIDGE
Abstract
Steel girder bridges with two girders and floor beams and stringers can exhibit a similar fatigue cracking phenomena as found in multiple steel girder bridges. Specifically, cracking can form in the web near the connection of the floor beam to the girder.
A web stiffener is present on the girder at all connections to the girders, similar to diaphragm connections, and the floor beam has a bolted connection to the stiffener. Loading on the floor beam creates a rotational force on the end of the floor beam at the connection to the girder. The rotation causes out-of-plane rotation in the web, which results in fatigue cracking.
The Iowa Department of Transportation (Iowa DOT) installed a bolted angle retrofit to a number of stiffeners in the negative moment region of an I-29 bridge that were experiencing fatigue cracking. The angles were bolted to the top flange of the girder and to each side of the stiffener in question. The retrofit was intended to transfer forces directly to the top flange and concrete deck and avoid displacing the web.
The bolted angle retrofit failed at one connection a decade after installation. The bolts fractured and one of the angles deformed at the top flange. The retrofit failure was discovered and the failed bolts and angle were replaced. This chapter describes the load test completed on the angle retrofit following repair to determine the effectiveness of the retrofit.
The tests concluded that there is still considerable displacement in the failed angle and the web. Based on these results, the fatigue failure in the web gap could occur again and cracking in the web could continue regardless of the angle retrofit. The connection studied is determined to be a critical connection and it should be monitored frequently for signs of impending failure.
Introduction
Steel girder bridges are common throughout Iowa. Multiple steel girder bridges with a number of designs are a staple for the Iowa DOT. The large number of steel bridges in Iowa increases the odds that problems will be discovered. A common problem has been discovered-fatigue cracking in the webs of the girders. This cracking is associated with diaphragm and floor beam connections to the girders and is almost exclusively located in negative moment regions of bridges.
The Iowa DOT has dealt with the fatigue problem in the past by drilling holes at the crack terminus to limit propagation. A retrofit attempted in the negative moment regions of a two-
77
girder floor beam bridge was an angle connection bolted between the top flange and the stiffener at the crack location. The research associated with this chapter involves the testing of the bolted angle retrofit on a two-girder bridge with fatigue cracking.
Bridge Description
Bridge 4397.3L029 is a three-span steel girder bridge with two main girders with stringers and floor beams supporting the deck, as pictured in Figure 5.1. The end spans are 94 feet 6 inches and the center span is 121 feet as illustrated in Figure 5.2. The bridge carries northbound traffic on I-29 in northwest Iowa north of Missouri Valley. The piers are skewed approximately 10 degrees and the deck has a variable thickness between 7 and 8 inches.
The two main longitudinal girders are larger in the negative moment region as shown in Figure 5.3. These girders support the floor beams, which are plate girders with 48-inch depths, and are spaced every 20 feet 2 inches throughout the bridge. The ends of the floor beams are connected to web stiffeners on the main girders. The floor beam connections with the main girders at the piers have angular wing sections that reach to the top and bottom of the web stiffener as illustrated in Figure 5.4. Two stringer beams are supported by the floor beam and are located 9 feet from the centerline of the main girders. The stringer beams run longitudinally over the length of the bridge and are 18WF50 standard sections.
The web stiffeners on the main girders in the negative moment region are touching, but not welded to, the top flange. The corners of the stiffener are clipped to provide clearance for the fillet weld between the girder top flange and web. The area between the weld on the stiffener and the fillet weld on the girder, shown in Figure 5.5, is called the web gap. This is the region of the web most prone to fatigue cracking. Cracks were discovered in a number of the web gaps near the bridge piers. In 1980, the Iowa DOT retrofitted the cracked web gaps by bolting the web stiffener to the top flange with angles, as well drilling holes in the terminus of the cracks.
78
a. Photograph of bridge looking northeast.
b. Photograph of floor beams and stringers under bridge deck.
Figure 5.1. Photographs of bridge.
79
Span 3 Span 2Span 1
N
94’6” 121’ 94’6”
9’ 8’ 9’
Pier 1 Pier 2 South Abutment
North Abutment
Figure 5.2. Plan view illustration of bridge.
PL74x7/16 PL20x1 3/8
PL20x1 3/8 PL12x3/4 PL20x1 7/8
PL20x1 7/8
Negative Moment Region
Positive Moment Region
PL14x1 3/8
Figure 5.3. Profile view of girder with plate designations.
80
West Girder
East Stringer
West Stringer East
Girder 9 ft 8 ft 9 ft
33 ft
C L Roadway
Driving Lane
Passing Lane
Figure 5.4. Cross section illustration of bridge in negative moment region at a pier.
Floor Beam PL48x5/16
West Girder Stiffener
Web Gap
PL20x1 7/8
PL74x7/16
PL20x1 7/8 PL10x5/8
PL10x5/8
Figure 5.5. Illustration of a floor beam connection to a girder at a pier.
81
Bridge Behavior and Condition
In 1988 the bolts in the retrofit at Pier 1 on the east girder were replaced due to failure of the connection as shown in Figure 5.6. The angle on north side of the connection was bent away from the top flange and the bolts were fractured as illustrated in Figure 5.7. The failure was a result of forces created in the floor beams by traffic loading. The bending of the floor beams creates a moment at the connection to the main girders. The forces pulling on the web gap caused the fatigue cracking in both the web and the bolts from repeated cycles of loading.
The failure of the retrofit raised questions about the feasibility of the bolted angle retrofit. The forces and reactions of the retrofit may be large enough that failure will occur again. A study of the bridge was commissioned to determine the behavior of the repaired retrofit to help determine its effectiveness.
Figure 5.6. Photograph of repaired retrofit at floor beam connection.
82
Angle Retrofit
Top Flange
N
a. Illustration of retrofit from top of girder.
Stiffener
North Angle South Angle
Top Flange
b. Illustration of retrofit from side of girder.
Bolt Failure
c. Illustration of failed retrofit from side of girder.
Figure 5.7. Bolted angle retrofit before and after failure.
Instrumentation
The movement of the bolted angle was determined to be the simplest and most direct method for determining the behavior of the angle. Five different positions on the retrofit were instrumented with direct current displacement transducers (DCDTs) at the location shown in Figure 5.8 (i.e., failed retrofit location). As illustrated in Figures 5.9 and 5.10, two vertical
83
displacements, two longitudinal displacements, and a lateral out-of -plane displacement were monitored.
Span 3 Span 2Span 1
94’6” 121’ 94’6”
9’ 8’ 9’
Pier 1 Pier 2 South Abutment
North Abutment
Bolt failure location and location of 5 displacement gages
Figure 5.8. Retrofit failure and instrumentation location on bridge.
a. Illustration of retrofit from top of girder.
b. Illustration of retrofit from side of girder.
Figure 5.9. Positions of displacement transducers at retrofit.
84
Figure 5.10. Photograph of displacement transducers at retrofit.
The vertical transducers measured the movement of each flange of the angle relative to the flange of the main girder. This movement suggests similar forces that resulted in the previous failure and vertical deformation of the angle flange are present in the connection. Displacement in this direction may imply that the previous bolts failed in tension.
The lateral transducers measured movement of each angle in the longitudinal direction along the main girder flange. Displacement in this direction would suggest that the previous bolts failed in shear. Displacement in both directions would show that both forces were at work in the bolt failure.
The lateral out-of-plane displacement transducer shows the effectiveness of the bolted angle retrofit by showing the movement, or lack of movement, in the stiffener in the lateral direction. The web emulates the movement of the stiffener and therefore movement in the lateral direction suggests that web gap fatigue cracking may continue even with the retrofit.
Field Test Description
Iowa DOT standard maintenance trucks were used for load testing. Two trucks were used in three different positions on the bridge to maximize movement in the floor beam connection. Both trucks weighed approximately 53,000 lbs. The trucks crossed the bridge staggered (in the passing then driving lane), back to back in the passing lane, and side by side in the passing and driving lane. The most significant results (approximately double other tests) were obtained with the trucks side by side in the passing and driving lanes, as shown in Figure 5.11; therefore the analysis presented herein focuses on that loading condition.
85
Figure 5.11. Illustration of truck loading used in analysis.
Experimental Results
Very little displacement occurred in the southern angle during loading, as shown in Figure 5.12. The vertical and horizontal movements are approximately 0.0001 inches. This indicates that the southern angle is affected only slightly by loading on the bridge. This could be anticipated since the “in the angle” bolts did not fail previously.
H(S)
V(S)
a. Location of transducers on angles.
0 2 4 6 8 10 12 14-0.00100
-0.00075
-0.00050
-0.00025
0.00000
0.00025
0.00050
0.00075
0.00100
Time, sec
Horizontal (South) Vertical (South)
b. Plot of vertical and horizontal displacements.
Figure 5.12. South angle vertical and horizontal displacements.
The northern angle showed a larger movement than its southern counterpart. The vertical displacement was near 0.0004 inches and horizontal displacement was near 0.0003 inches, as illustrated in Figure 5.13. These values are over 300 percent larger than on the south angle and suggest why the original retrofit bolts failed at this connection.
86
V(N)
H(N)
a. Location of transducers on angles.
0 2 4 6 8 10 12 14-0.00100
-0.00075
-0.00050
-0.00025
0.00000
0.00025
0.00050
0.00075
0.00100
Time, sec
Vertical (North) Horizontal (North)
b. Plot of vertical and horizontal displacements.
Figure 5.13. North angle vertical and horizontal displacements.
The out-of-plane displacement measurements were large for this connection. Figure 5.14 shows that the stiffener (and web) move approximately 0.007 inches when the bridge is loaded. For reference, this large of a displacement is associated with fatigue cracking in multiple steel girder bridges without floor beams.
87
O-O-P
a. Location of transducer on stiffener.
0 2 4 6 8 10 12 14-0.001
0.000
0.001
0.002
0.003
0.004
0.005
0.006
0.007
Time, sec
Out-of-Plane (Distortion)
b. Plot of out-of plane displacement.
Figure 5.14. Out-of-plane displacement at retrofit.
Conclusions
The displacements in the south angle are small and are a minor concern to the bridge engineer. However, the out-of-plane displacement and movement in the north angle could suggest a problem with the retrofit. The large out-of-plane displacements are common in multiple girder bridges with fatigue cracking in the web gap. This could imply that even with the bolted angle retrofit the web gap cracking in this bridge could continue to propagate. The large movement in the north angle suggests that future fatigue failure may occur in the bolts and is assumed to be similar to the actions that caused the initial failure of the bolts in the angle.
Data obtained from this field test support that this bridge is fatigue critical and should be inspected frequently by the Iowa DOT. The bridge may also be a candidate for a continuous remote monitoring system study, especially as the loading cycles on the bolts get nearer to fatigue limits. The displacements could be monitored with the system and any changes in displacement, either instantaneous or gradual, could be recognized as a possible or impending failure in the retrofit. Using these data, the appropriate bridge repair office could use its resources on other bridge projects until the monitoring system suggested a repair be performed.
88
CHAPTER 6. GENERAL CONCLUSIONS
Summary and Discussion
This report describes extensive testing on the bolt loosening retrofit. Bridges with I-beam, channel, and X-type diaphragms were tested for the effectiveness of the retrofit and the results were positive.
Loosening the bolts in the diaphragm/girder connection reduced the strain in the girder web gaps by more than 70 percent in most cases. The exterior girders showed the largest reductions in strain in the web gap. The out-of-plane displacement of these web gaps was reduced almost as much as the web gap strain, approximately 50 percent. The strain in the diaphragms also reduced significantly, nearly 100 percent in the bridges tested, suggesting that the forces created in the diaphragms by differential deflection of the girders had been eliminated by the retrofit. The forces in the diaphragms have been linked directly to out-of-plane displacement of the web gap, and the elimination of these forces suggests the retrofit was effective.
Long-term testing of the X-type diaphragm bridge also showed promising results. A bridge was monitored for eight months, four months without the retrofit and four months with the retrofit. The strain and displacement values recorded from the bridge showed no indication of changing over time. The results acquired from short-term testing of the bolt loosening retrofit can therefore be applied to bridges with confidence that traffic loading effects over time will not have adverse affects on strain and displacement in the web gaps.
As a result of the long-term testing, a remote monitoring system was developed for use by the Iowa Department of Transportation (Iowa DOT). The system is capable of monitoring strain, displacement, temperature, and many other sensor types in a remote location over a long period of time. The data acquisition system (DAS) can be programmed to collect continuously or only peak data, as selected by a designated trigger gage, for a predetermined period of time. This allows useful data to be collected, while the remainder of the ambient data is discarded. Another essential component of the DAS is its communication abilities. Engineers can collect data from the unit without physically being in the field. No site visit is necessary to download data from the DAS memory as modem communication allows office computers to access the system. This communication ability also provides for real-time monitoring of instrumentation at the site. Readings can be viewed at the time they are collected. This system has many possible applications in future department of transportation bridge monitoring programs.
Implementation of the retrofit will need to be monitored closely on test bridges. A bolt “securing” technique was not researched and will need to be devised to ensure that the bolts and diaphragms stay in place after the bolts are loosened. Strain in the girders indicating lateral load distribution and lateral torsional buckling should also be investigated on any
89
bridge considered for the retrofit. Essentially, bridges selected for retrofit should be monitored after all bolts are loose and should be periodically checked for diaphragm fastening and girder strain.
In the case of the I-29 two-girder bridge angle retrofit monitoring test, some important information about the behavior of the bridge was collected. The displacement in the angle with the previously failed bolts is considerably larger than that of its counterpart retrofit angle. The displacement in the out-of-plane direction is also large when compared to standard multiple girder bridges. The displacement of the stiffener reflects upon the displacement of the web gap, where fatigue cracking has already occurred. The results of this testing revealed that the retrofit bolts are still fatigue critical and the connection should be watched closely. The results also show that retrofit may prove to be ineffective in eliminating future fatigue cracking in the web gap since the out-of-plane displacement is large enough to be a concern. The connections in the negative moment on this bridge have the potential to have problems in the angle retrofit as well as the web gaps, and the bridge should be regularly inspected in these areas.
Recommendations for Future Research
A thorough investigation of the bridge behavior could be conducted using finite element models (FEMs). Bridges that have undergone field testing of the retrofit should be modeled with the diaphragm bolts loose or removed to better understand the behavior of the structure. Both global and local results of the FEM analysis are of interest. The global deflection of each span and the tendency towards lateral torsional buckling should be investigated. The response of the bridge to high winds or a lateral impact should also be reviewed. The local deflection of the web gap and diaphragm in the area of the fatigue cracking is important. A comprehensive model of the strains and deflections in the web gap would be helpful in understanding web gap fatigue cracking and the strain results obtained from field testing. Strain and deflection data acquired from field tests could also be used to calibrate the FEM.
More comprehensive stability calculations should be performed on the effects of lateral torsional buckling of the girders following installation of the retrofit. General calculations were completed using American Association of State Highway and Transportation Officials (AASHTO) criteria, but a more accurate calculation should be completed that accounts for small movements in the girders before the diaphragms begin to support the girders. FEM could also be used to model this behavior.
A full-scale test of the retrofit on an in-service bridge should also be performed. A test bridge should have all the diaphragms retrofitted and many aspects of the bridge monitored to ensure that the retrofit is functioning properly. Strain and displacement in individual web gaps should be documented, and strains and displacements in the girders, vertical and horizontal, should also be monitored. Initial load tests should be run after installation of the retrofit; however, testing should continue on the bridge with ambient loading until the stability of the structure is ensured.
90
Many have researched the effects of diaphragms on lateral load distribution; however, the effects of lateral load distribution were not investigated in the bridges tested. Instrumentation on a full-scale retrofit could focus on the deflection or strains of individual girders before and after the retrofit, showing changes due to loosening the diaphragms and lateral load distribution.
The DAS used in the long-term testing could be very useful in future bridge monitoring research. Sensors could be set up to monitor a critical joint or member on a bridge expected to experience distress. The system can monitor the critical point 24 hours a day, seven days a week, and record the slightest change in behavior, alerting maintenance crews when there may be a problem. This type of system would be especially useful for bridges that are difficult to inspect at regular intervals. An example would be a critical connection in the middle of a busy span crossing the Mississippi River. Conventional inspection can only be done with the aid of a snooper and traffic control. This disruption in traffic and resources may be in vain if no problem is discovered.
Another useful situation for the DAS is the bridge 4397.3L029 on I-29 described in Chapter 5. The bridge has a fracture critical connection in the angle retrofit. Continuous monitoring would allow researchers to watch for changes in the displacement of the angles as the bolt fatigue is reached and deformations occur in the plate and bolts. More important, it would provide bridge maintenance crews with a way to determine if a failure has suddenly occurred in the connection that requires repair.
In both cases it would reduce the number of human operated inspection trips and would alert proper personnel in the event of any significant change in the bridge. In the future, after some upgrading, visual data could also be collected by the system using digital cameras. As more technology becomes available the perceivable uses of this system will grow. This system, and those like it, is the future of remote bridge monitoring.
91
APPENDIX A. AASHTO STABILITY CALCULATIONS FOR LATERAL BRACING ADEQUACY OF I-80 BRIDGE ASSUMING DIAPHRAGMS REMOVED
American Association of State Highway and Transportation Officials (AASHTO) calculations on the I-80 bridge were performed using the maximum live plus dead load moment in the negative moment region. All girder shape properties calculated assuming composite structure with the bridge deck. Some tests had factored maximum moment calculated prior to insertion into the calculation spreadsheet, while others included summing and factoring of individual moment components.
Maximum Loading: Dead Load of Superstructure and Deck Live Load Lane Loading, 0.64 kips Live Load Truck Loading, 2 trucks 50 ft apart centered over pier
Modeling: STAAD computer analysis performed on a single girder using AASHTO load distribution factors QConBridge1 computer analysis used to double check particular calculations Moment data used in mathematical checks labeled as Tests 1 to 11 below
Test 1: Span 2 near Pier 2 considered Calculations considering large girder cross section (see attached table) the entire length to the splice Lb is considered to the splice, conservative assumption for zero moment under maximum moment shown The section passes AASHTO buckling checks
Test 2: Span 2 near Pier 2 considered Calculations considering medium girder cross section (see attached table) the entire length to the splice Lb is considered to the splice, conservative assumption for zero moment under maximum moment shown The section fails AASHTO buckling, use Tests 3 and 4 instead
Test 3: Span 2 near Pier 2 considered Calculations considering large cross section to the section change distance from the pier Cb value is affected, as the moment at the end is no longer considered zero as shown in the on the moment diagram at the splice location Lb is considered to the live and dead load inflection point on the plot The section passes AASHTO buckling checks
92
Test 4: Span 2 near Pier 2 considered Calculations considering medium cross section from the section change to the inflection point on the plot Cb value is maximum in this case as moment is zero at one end Lb is considered to the live and dead load inflection point on the plot The section passes AASHTO buckling checks
Test 5: Span 3 near Pier 2 considered Calculations considering large girder cross section the entire length to the splice Lb is considered to the splice, conservative assumption for zero moment under maximum moment shown The section passes AASHTO buckling checks
Test 6: Span 3 near Pier 2 considered Calculations considering medium girder cross section the entire length to the splice Lb is considered to the splice, conservative assumption for zero moment under maximum moment shown The section fails AASHTO buckling, use Tests 7 and 8 instead
Test 7: Span 3 near Pier 2 considered Calculations considering large cross section to the section change distance from the pier Cb value is affected, as the moment at the end is no longer considered zero as shown in the on the moment diagram at the splice location (M1 and M2 on plot) Lb is considered to the live and dead load inflection point on the plot The section passes AASHTO buckling checks
Test 8: Span 3 near Pier 2 considered Calculations considering medium cross section from the section change to the inflection point on the plot Cb value is maximum in this case as moment is zero at one end (M2 and M3 on plot) Lb is considered to the live and dead load inflection point on the plot The section passes AASHTO buckling checks
Test 9: Span 1 near Pier 1 considered Calculations considering large cross section to the section change distance from the pier Cb value is affected, as the moment at the end is no longer considered zero as shown in the on the moment diagram at the splice location
93
Lb is considered to the live and dead load inflection point on the plot The section passes AASHTO buckling checks
Test 10: Span 1 near Pier 1 considered Calculations considering medium cross section to the section change distance from the pier Cb value is affected, as the moment at the end is no longer considered zero as shown in the on the moment diagram at the splice location Lb is considered to the live and dead load inflection point on the plot The section passes AASHTO buckling checks
Test 11: Span 1 near Pier 1 considered Calculations considering small cross section to the section change distance from the pier Cb value is affected, as the moment at the end is no longer considered zero as shown in the on the moment diagram at the splice location Lb is considered to the live and dead load inflection point on the plot The section passes AASHTO buckling checks
1 QConBridge is an AASHTO bridge analysis program created by the Washington Department of Transportation. It can be downloaded at http://www.wsdot.wa.gov/eesc/bridge/software/index.cfm?fuseaction=download&software_id=48
94
AASHTO Strength I Live and Dead LoadI-80
-30000
-20000
-10000
0
10000
20000
30000
40000
50000
0 25 50 75 100 125 150 175 200 225 250
Location, ft
Moment
Pier 1
Pier 2
splice
splice
splice
splice
sect ion change
sect ion change
sect ion change
sect ion change
M1
M2
M3
Lb
Stability Tests run for I-80 bridge
Test specifics and results
Test Number Span Unbraced Length (Lb) Cross Section Section Length Section Type Maximum Moment Minimum Moment Resultft in ft in*kips in*kips
1 2 25.5 306 Large 25.5 Non-compact 44431 0 PASS2 2 25.5 306 Medium 25.5 Non-compact 43406 0 FAIL3 2 21.5 258 Large 16 Non-compact 45200 5620 PASS4 2 21.5 258 Medium 9.5 Non-compact 5620 0 PASS5 3 25.5 306 Large 25.5 Non-compact 44431 0 PASS6 3 25.5 306 Medium 25.5 Non-compact 43406 0 FAIL7 3 25.5 306 Large 16 Non-compact 45200 17200 PASS8 3 25.5 306 Medium 9.5 Non-compact 17200 0 PASS9 1 36.67 440.04 Large 36.67 Non-compact 26088 0 PASS
10 1 36.67 440.04 Medium 36.67 Non-compact 26088 0 PASS11 1 36.67 440.04 Small 36.67 Non-compact 26088 0 PASS
Cross Section Dimensions
Cross Section Bottom Flange (in) Web (in) Top Flange (in)thickness length thickness length thickness length
use largest span and estimate the effective span between dead loadinflection points
L L2 .8 L 84 ft
Average girder spacing
sg 9.67 ft
Deck
ts 8 in
Section Dimensions: (b is base dimension and h is height dimention)
if cross section is not double symmetric then check calcs
Cut beam into 3 sections: bottom flange (1), web (2), and top flange (3)
units : INCHES
section 1bottom flan
section 2web
section 3top flange
TEST 1
AASHTO CALCS FOR STABILITY OF GIRDERS4/15/02 DAVID TARRIES
3 cross section dimensions are available for the interior and exterior girderthe interior girder is checked here
Large girder section, span 2, composite with 8 inch deck. Consider stability with wholegirder same size.
Fy 36 ksi f'c 3.5 ksi Es 29000 ksi Ec 3375 ksi
Limit state
6.5.4
f 1
assume Lb is to the dead load inflection point (splice)
Lb 306 in
Spans
L1 80.5 ft
96
a513
.01 beff tsa423
.01 beff ts
a5 2.57 in2a4 5.14 in2
d5 52.5 ind4 55.5 in
Centroid Calculation
from bottom of girder
yc
b1 h1h1
2b2 h2
h2
2h1 b3 h3
h3
2h2 h1 a4 d4 a5 d5
b1 h1 b2 h2 b3 h3 a4 a5
yc 27.557 in
Ac h1 b1 h2 b2 h3 b3 a4 a5 Ac 88.96 in2
b1 16 b238
b3 16
h1 2 h2 46 h3 2
4.6.2.6.1
one .25 L 12 one 252
two 12 ts .5 h3 .5 h3 b2if
b2 otherwise
two 96.375
three sg 12 three 116.04
beff one one two
one three
if
two two threeif
three otherwise
beff 96.375 in
slab top steel slab bottom steel
6.10.1.2
97
inrt 4.404rtIrtAT
in2AT 35.195AT wd b2 h1 b1
in4Irt 682.704Irt112
wd b23 1
12h1 b1
3
inwd 8.519wdDc
3
Radius of gyration for compression T
in3S 1671.848
SIxx
yc
in4Ixx 46070.619727
Ixx112
b1 h13 b1 h1 yc
h1
2
2112
b3 h33 b3 h3 yc h1 h2
h3
2
2
112
b2 h23 b2 h2
h2
2h1 yc
2
a4 d4 yc2 a5 d5 yc
2
Moment of Inertia Calculations (Second Moment of Area)
inDc 25.557
Dc yc h1
Elastic moment compression web depth
inDcp 33.28
Dcph2
2 Fy h2 b2Fy b3 h3 Fy b2 h2 Fy a4 a5 Fy b1 h1
6.10.5.1.4b-2
Plastic moment compression web depth
98
Qcon live load
Live load distribution factor
4.6.2.2.1-1
sg 9.67 3.5<=s<=16 ft
ts 8 4.5<=ts<=12 in
L2 105 20<=L<=240 ft
nEs
Ecn 8.593
eg sg 12 eg 116.04 in
Ac 88.96 in2
Kg n Ixx Ac eg2
Kg 10688687.424 in4
AASTO factored moments
Assume Strength I determines max negative moments
Table 3.4.1-1 Strength I load factors
DC 1.25
DW 1.5
LL 1.75
Dynamic load allowance
3.6.2.1-1
DA .33
elastic analysis moments with AASHTO loading (STAAD)2 trucks 50 ft apart over pier
MDC1 1957.64 in*kips steel dead load
MDC2 9867.07 in kips deck dead load
MDW 525.17 in*kips wearing surface
MLL 23484 in*kips
99
My Fy S
Load shedding factorRb 1
Rb 12 Dc
b2b
Es
Fyif
"use 6.10.5.4.2a-2" otherwise
since comp flange>= tens flangeb 5.76
6.10.5.3.3a
Nominal Flexural Resistance
Non composite beam so use section 6.10.5.3.3 for negative flexure
compact "no"
compact "yes"2 Dcp
b23.76
Es
Fyif
"no" otherwise
Table 6.10.5.2.1-1
Composite section check
in kipsMu 44431.121
Mu .9 Muu
6.10.2.2
Moment redistribution
in kipsMuu 49367.912
Muu DC MDC1 MDC2 DW MDW LL MLL LDF 1 DA( )
Final factored moment
LDF 0.618
LDF .06sg
14
.4 sg
L2
.3 Kg
12 L2 ts3
.1
100
compbrace "okay" Lb 1.76 rtEs
Fyif
"check" otherwise
6.10.5.3.3d
Compression flange Bracing
So Fn1 is okaycompslend "okay"
compslend "okay"b1
2 h11.38
Es
Fy2 Dc
b2
if
"check" otherwise
Compression flange slenderness
So Fn1 is okaywebslend "okay"
webslend "okay"2 Dc
b26.77
Es
Fyif
"check" otherwise
6.10.5.3.3b
Web Slenderness
ksiFn1 36
Fn1 Rb Rh Fy
Hybrid FactorRh 1
RhMyr
My
since not hybridMyr My
in kipsMy 60186.512
101
ksiFn2 36
Fn2 Rb Rh Fy Rb Rh Fy Fncif
Fnc otherwise
ksiFnc 54.951 4.44 rtEs
Fy555.021
Fnc Cb Rb Rh Fy 1.33 .187Lb
rt
Fy
EsLb 4.44 rt
Es
Fyif
Cb Rb Rh9.86 Es
Lb
rt
2Lb 4.44 rt
Es
Fyif
Cb 1.75
Cb 1.75 1.05Pl
Ph.3
Pl
Ph
3
Ph 0.8
Ph b1 h1
25.612
average stress in comp flange
Mu
S
Mu
S1
h1
yc
2
Pl is 0 because it is at an inflection pointPl 0
6.10.5.5
Lateral torsional bending
therefore use 6.10.5.5compbrace "check"
102
Failure check
check "lat tors" Fn2 Fn1if
"other" otherwise
check "other"
Final nominal stress
Fn Fn2 Fn2 Fn1if
Fn1 otherwise
Fn 36 ksi
Fr Fn f
Fr 36 ksi
FuMu
S
Fu 26.576 ksi
stability "Fail" Fu Frif
"Pass" otherwise
stability "Pass"
Therefore the girder is stable considering the large cross section from the bearing to the splice.
103
APPENDIX B. AASHTO STABILITY CALCULATIONS FOR LATERAL BRACING ADEQUACY OF I-35 BRIDGE ASSUMING DIAPHRAGMS REMOVED
American Association of State Highway and Transportation Officials (AASHTO) calculations on the I-35 bridge were performed using the maximum live plus dead load moment in the negative moment region. All girder shape properties calculated assuming composite structure with the bridge deck. Some tests had factored maximum moment calculated prior to insertion into the calculation spreadsheet, while others included summing and factoring of individual moment components.
Maximum Loading: Dead Load of Superstructure and Deck Live Load Lane Loading, 0.64 kips Live Load Truck Loading, 2 trucks 50 ft apart centered over pier
Modeling: STAAD computer analysis performed on a single girder using AASHTO load distribution factors QConBridge1 computer analysis used to double check particular calculations Moment data used in mathematical checks labeled as Tests 1 to 3 below
Test 1: Span 2 near Pier 2 considered Calculations considering large girder cross section (see attached table) the entire length to the splice (there is no section change here) Lb is considered to the splice, conservative assumption for zero moment under maximum moment shown The section passes AASHTO buckling checks
Test 2: Span 1 near Pier 1 considered Calculations considering large cross section to the section change (the splice in this case) distance from the pier Cb value is affected, as the moment at the end is no longer considered zero as shown in the on the moment diagram at the splice location Lb is considered to the live and dead load inflection point on the plot The section passes AASHTO buckling checks
Test 3: Span 1 near Pier 1 considered Calculations considering small cross section from the section change (the splice in this case) to the inflection point on the plot Cb value is maximum in this case as moment is zero at one end Lb is considered to the live and dead load inflection point on the plot
104
The section passes AASHTO buckling checks
1 QConBridge is an AASHTO bridge analysis program created by the Washington Department of Transportation. It can be downloaded at http://www.wsdot.wa.gov/eesc/bridge/software/index.cfm?fuseaction=download&software_id=48
AASHTO Strength I Live and Dead LoadI-35
-20000
-15000
-10000
-5000
0
5000
10000
15000
20000
25000
30000
35000
0 50 100 150
Location, ft
Moment
Pier 1
Pier 2
Splice
Splice
Splice
Splice
Lb
Stability Tests run for I-35 bridge
Test specifics and results
Test Number Span Unbraced Length (Lb) Cross Section Section Length Section Type Maximum Moment Minimum Moment Resultft in ft in*kips in*kips
1 2 17 204 Large 17 Compact 32000 0 PASS2 1 29.4 352.8 Large 17 Non-compact 15100 4500 PASS3 1 29.4 352.8 Small 12.4 Non-compact 4500 0 PASS
Cross Section Dimensions
Cross Section Bottom Flange (in) Web (in) Top Flange (in)thickness length thickness length thickness length
use largest span and estimate the effective span between dead loadinflection points
L L2 .8 L 60 ft
Average girder spacing
sg 9.5 ft
Deck
ts 8 in
Section Dimensions: (b is base dimension and h is height dimention)
if cross section is not double symmetric then check calcs
Cut beam into 3 sections: bottom flange (1), web (2), and top flange (3)
units : INCHES
section 1bottom flan
section 2web
section 3top flange
TEST 1
AASHTO CALCS FOR STABILITY OF GIRDERS4/15/02 DAVID TARRIES
2 cross section dimensions are available for the interior and exterior girderthe interior girder is checked here
large cross section, mid span section, composite with 8 inch deck, consider the large section for the whole unbraced length (which is how the bridge was designed and built).
Fy 36 f'c 3 ksi Es 29000 Ec57000 f'c 1000
1000Ec 3122.019
Limit state
6.5.4
f 1
assume Lb is to inflection point of dead loaded beam (splice)
Lb 204 in
Spans
L1 58.5 ft L2 75
106
slab bottom steel
6.10.1.2 a5
13
.01 beff tsa423
.01 beff ts
a5 2.573 in2a4 5.147 in2
d5 41.55 ind4 37.55 in
Centroid Calculation
from bottom of girder
yc
b1 h1h1
2b2 h2
h2
2h1 b3 h3
h3
2h2 h1 a4 d4 a5 d5
b1 h1 b2 h2 b3 h3 a4 a5
yc 20.232 in
Ac h1 b1 h2 b2 h3 b3 a4 a5 Ac 65.72 in2
b1 12 b2 .5 b3 12
h1 1.75 h2 32 h3 1.75
4.6.2.6.1
one .25 L 12 one 180 in
two 12 ts .5 h3 .5 h3 b2if
b2 otherwise
two 96.5 in
three sg 12 three 114 in
beff one one two
one three
if
two two threeif
three otherwise
beff 96.5 in
slab top steel
107
inrt 3.235rtIrtAT
in2AT 24.08AT wd b2 h1 b1
in4Irt 252.064Irt112
wd b23 1
12h1 b1
3
inwd 6.161wdDc
3
Radius of gyration for compression Tin3S 810.9
SIxx
yc
in4Ixx 16406.529653
Ixx112
b1 h13 b1 h1 yc
h1
2
2112
b3 h33 b3 h3 yc h1 h2
h3
2
2
112
b2 h23 b2 h2
h2
2h1 yc
2
a4 d4 yc2 a5 d5 yc
2
Moment of Inertia Calculations (Second Moment of Area)
inDc 18.482
Dc yc h1
Elastic moment compression web depth
inDcp 23.72
Dcph2
2 Fy h2 b2Fy b3 h3 Fy b2 h2 Fy a4 a5 Fy b1 h1
6.10.5.1.4b-2
Plastic moment compression web depth
108
in*kips Live load (2 trucks)
Live load distribution factor
4.6.2.2.1-1
sg 9.5 3.5<=s<=16
ts 8 4.5<=ts<=12
L2 75 20<=L<=240
nEs
Ecn 9.289
eg sg 12 eg 114 in
Ac 65.72 in2
Kg n Ixx Ac eg2
Kg 8085988.347 in4
AASHTO factored moments
Assume Strength I determines max negative moments
Table 3.4.1-1 Strength I load factors
DC 1.25
DW 1.5
LL 1.75
Dynamic load allowance
3.6.2.1-1
DA .33
elastic analysis moments with AASHTO loading (STAAD)2 trucks 50 ft apart over pier
MDC1 735.214 in*kips steel dead load
MDC2 5100 in kips deck dead load
MDW 294.1 in*kips wearing surface
MLL 14250
109
xc
h1 b1b1
2h3 b3
b1
2h2 b2
b1
2h1 b1 h2 b2 h3 b3
weak axis moment of intertia
composite beam so use section 6.10.5.3.2 for negative flexure
compact2 "yes"
compact2 "yes"b1
2 h1.382
Es
Fyif
"no" otherwise
compact "yes"
compact "yes"2 Dcp
b23.76
Es
Fyif
"no" otherwise
Table 6.10.5.2.1-1
Composite section check
Mu 32334.31
Mu .9 Muu
6.10.2.2
Moment redistribution
Muu 35927.011
Muu DC MDC1 MDC2 DW MDW LL MLL LDF 1 DA( )
Final factored momentLDF .85
LDF 0.674
LDF .06sg
14
.4 sg
L2
.3 Kg
12 L2 ts3
.1
110
dc 24.595dch1
2h2 Y
drt 16.08drt h1 h2 Y d5
drb 12.08drb h1 h2 Y d4
Yh2
2
Fy h1 b1 Fy h3 b3 Fy a4 Fy a5
Fy b2 h216.10.5.1.3
Teble A6.1-2
since other end of Lb is an inflection pointMl 0
in3Zy 126
Zy 2b1
4
b1
2h1 2
b3
4
b3
2h3
in3Zx 745.738
Zx b1 h1 ych1
2b3 h3 h2 yc h1
h3
2
h2 yc h1 b2h2 yc h1
2yc h1 b2
yc h1
2
inry 2.77
ryIyy
Ac
in4Iyy 504.33
Iyy112
h1 b13 b1 h1
b1
2xc
2112
h3 b33 b3 h3
b1
2xc
2
112
h2 b23 h2 b2
b1
2xc
2
inxc 6
111
compslend "okay"
compslend "okay"b1
2 h1.382
Es
Fyif
"check" otherwise
Compression flange slenderness
So Mp is okaywebslend "okay"
webslend "okay"2 Dcp
b23.76
Es
Fyif
"check" otherwise
6.10.5.2.3b
Web Slenderness
in kipsMn 34923.605
Mn Mp
6.10.5.2.3a
Nominal Flexural Resistance
compact3 "yes"
compact3 "yes" Lb .124 .0759Ml
Mp
ry Es
Fyif
"no" otherwise
in kipsMp 34923.605
MpFy b2 h2
2 h2Y2 h2 Y 2
Fy h1 b1 dc Fy h3 b3 dt Fy a4 drb Fy a5 drt
Fy h1 b1 Fy b2 h2 Fy h3 b3 Fy a4 Fy a5if
"bad" otherwise
dt 9.155dth3
2Y
112
Compression flange Bracing
6.10.5.3.3d
compbrace "okay" Lb .124 .0759Ml
Mp
ry Es
Fyif
"check" otherwise
compbrace "okay"
Lateral torsional bending
Final nominal stress
Mr Mn f
Mr 34923.605 in kips
Mu 32334.31 in kips
stability "Fail" Mu Mrif
"Pass" otherwise
stability "Pass"
Therefore the large section is capable of supporting maximum AASHTO Strength I loadingwithout the diaphragms in the negative moment region.
113
APPENDIX C. AASHTO STABILITY CALCULATIONS FOR LATERAL BRACING ADEQUACY OF IA-17 BRIDGE ASSUMING DIAPHRAGMS REMOVED
American Association of State Highway and Transportation Officials (AASHTO) calculations on the IA-17 bridge were performed using the maximum live plus dead load moment in the negative moment region. All girder shape properties calculated assuming composite structure with the bridge deck. Some tests had factored maximum moment calculated prior to insertion into the calculation spreadsheet, while others included summing and factoring of individual moment components.
Maximum Loading: Dead Load of Superstructure and Deck Live Load Lane Loading, 0.64 kips Live Load Truck Loading, 2 trucks 50 ft apart centered over pier
Modeling: STAAD computer analysis performed on a single girder using AASHTO load distribution factors QConBridge1 computer analysis used to double check particular calculations Moment data used in mathematical checks labeled as Tests 1 to 7 below
Test 1: Span 2 near Pier 2 considered Calculations considering large girder cross section (see attached table) the entire length to the splice Lb is considered to the splice, conservative assumption for zero moment under maximum moment shown The section passes AASHTO buckling checks
Test 2: Span 2 near Pier 2 considered Calculations considering medium girder cross section (see attached table) the entire length to the splice Lb is considered to the splice, conservative assumption for zero moment under maximum moment shown The section fails AASHTO buckling, use Tests 3 and 4 instead
Test 3: Span 2 near Pier 2 considered Calculations considering large cross section to the section change distance from the pier Cb value is affected, as the moment at the end is no longer considered zero as shown in the on the moment diagram at the splice location (M1 and M2 on plot) Lb is considered to the live and dead load inflection point on the plot The section passes AASHTO buckling checks
114
Test 4: Span 2 near Pier 2 considered Calculations considering medium cross section from the section change to the inflection point on the plot Cb value is maximum in this case as moment is zero at one end (M2 and M3 on plot) Lb is considered to the live and dead load inflection point on the plot The section passes AASHTO buckling checks
Test 5: Span 1 near Pier 1 considered Calculations considering large cross section to the section change distance from the pier Cb value is affected, as the moment at the end is no longer considered zero as shown in the on the moment diagram at the splice location Lb is considered to the live and dead load inflection point on the plot The section passes AASHTO buckling checks
Test 6: Span 1 near Pier 1 considered Calculations considering medium cross section to the section change distance from the pier Cb value is affected, as the moment at the end is no longer considered zero as shown in the on the moment diagram at the splice location Lb is considered to the live and dead load inflection point on the plot The section passes AASHTO buckling checks
Test 7: Span 1 near Pier 1 considered Calculations considering small cross section to the section change distance from the pier Cb value is affected, as the moment at the end is no longer considered zero as shown in the on the moment diagram at the splice location Lb is considered to the live and dead load inflection point on the plot The section passes AASHTO buckling checks
1 QConBridge is an AASHTO bridge analysis program created by the Washington Department of Transportation. It can be downloaded at http://www.wsdot.wa.gov/eesc/bridge/software/index.cfm?fuseaction=download&software_id=48
115
AASHTO Strength I Live and Dead LoadIA-17
-60000
-40000
-20000
0
20000
40000
60000
80000
0 50 100 150 200 250 300
Location, ft
Moment
splice
splice
splice
splice
section change
section change
section change
section change
Pier 1
Pier 2
M1
Lb
M3
M2
Stability Tests run for IA-17 bridge
Test specifics and results
Span Unbraced Length (Lb) Cross Section Section Length Section Type Maximum Moment Minimum Moment ResultTest Number ft in ft in*kips in*kips
1 2 31.5 378 Large 31.5 Non-compact 64998 0 PASS2 2 31.5 378 Medium 31.5 Non-compact 64076 0 FAIL3 2 25 300 Large 11 Non-compact 67738 37300 PASS4 2 25 300 Medium 20.5 Non-compact 37300 0 PASS5 1 41 492 Large 11 Non-compact 41136 29000 PASS6 1 41 492 Medium 19 Non-compact 29000 9500 PASS7 1 41 492 Small 11 Non-compact 9500 0 PASS
Cross Section Dimension
Cross Section Bottom Flange (in) Web (in) Top Flange (in)thickness length thickness length thickness length
use largest span and estimate the effective span between dead loadinflection points
L L2 .8 L 100 ft
Average girder spacing
sg 10 ft
Deck
ts 8 in
Section Dimensions: (b is base dimension and h is height dimention)
if cross section is not double symmetric then check calcs
Cut beam into 3 sections: bottom flange (1), web (2), and top flange (3)
units : INCHES
section 1bottom flan
section 2web
section 3top flange
TEST 1
AASHTO CALCS FOR STABILITY OF GIRDERS4/15/02 DAVID TARRIES
3 cross section dimensions are available for the interior and exterior girderthe interior girder is checked here
Section 1 (large) at maximum moment side of span 2 considering only one cross section ofgirder
Fy 36 f'c 3.5 ksi Es 29000 Ec57000 f'c 1000
1000Ec 3372.165
Limit state
6.5.4
f 1
assume Lb is to inflection point of dead loaded beam, splice point
Lb 378 in
Spans
L1 97.5 ft L2 125
117
6.10.1.2 a5
13
.01 beff tsa423
.01 beff ts
a5 2.57 in2a4 5.14 in2
d5 69.5 ind4 65.5 in
Centroid Calculation
from bottom of girder
yc
b1 h1h1
2b2 h2
h2
2h1 b3 h3
h3
2h2 h1 a4 d4 a5 d5
b1 h1 b2 h2 b3 h3 a4 a5
yc 34.107 in
Ac h1 b1 h2 b2 h3 b3 a4 a5 Ac 96.022 in2
b1 22 b2 .375 b3 22girder dimensions in inches
h1 1.5 h2 59.5 h3 1.5
4.6.2.6.1
one .25 L 12 one 300
two 12 ts .5 h3 .5 h3 b2if
b2 otherwise
two 96.375
three sg 12 three 120
beff one one two
one three
if
two two threeif
three otherwise
beff 96.375 in
slab top steel slab bottom steel
118
inrt 5.992rtIrtAT
in2AT 37.076AT wd b2 h1 b1
in4Irt 1331.048Irt112
wd b23 1
12h1 b1
3
inwd 10.869wdDc
3
Radius of gyration for compression T
in3S 2257.514
SIxx
yc
in4Ixx 76997.296362
Ixx112
b1 h13 b1 h1 yc
h1
2
2112
b3 h33 b3 h3 yc h1 h2
h3
2
2
112
b2 h23 b2 h2
h2
2h1 yc
2
a4 d4 yc2 a5 d5 yc
2
Moment of Inertia Calculations (Second Moment of Area)
inDc 32.607
Dc yc h1
Elastic moment compression web depth
inDcp 40.03
Dcph2
2 Fy h2 b2Fy b3 h3 Fy b2 h2 Fy a4 a5 Fy b1 h1
6.10.5.1.4b-2
Plastic moment compression web depth
119
wearing surface
MLL 32964 in*kips Live load (QCON Program AASHTO Live Load
Live load distribution factor
4.6.2.2.1-1
sg 10 3.5<=s<=16
ts 8 4.5<=ts<=12
L2 125 20<=L<=240
nEs
Ecn 8.6
eg sg 12 eg 120
Ac 96.022
Kg n Ixx Ac eg2
Kg 12553333.427
AASTO factored moments
Assume Strength I determines max negative moments
Table 3.4.1-1 Strength I load factors
DC 1.25
DW 1.5
LL 1.75
Dynamic load allowance
3.6.2.1-1
DA .33
elastic analysis moments with AASHTO loading (STAAD)2 trucks 50 ft apart over pier
MDC1 4540 in*kips steel dead load
MDC2 15300 in kips deck dead load
MDW 833 in*kips
120
ar2 Dc b2
Afc
Afc h3 b2
ksifc 28.792fcMu
S
since comp flange>= tens flangeb 5.76
6.10.5.3.3a
Nominal Flexural Resistance
Non composite beam so use section 6.10.5.3.3 for negative flexure
compact "no"
compact "yes"2 Dcp
b23.76
Es
Fyif
"no" otherwise
Table 6.10.5.2.1-1
Composite section check
in kipMu 64997.627
Mu .9 Muu
6.10.2.2
Moment redistribution
in kipMuu 72219.586
Muu DC MDC1 MDC2 DW MDW LL MLL LDF 1 DA( )
Final factored moment
LDF 0.602
LDF .06sg
14
.4 sg
L2
.3 Kg
12 L2 ts3
.1
121
compslend "okay"b1
2 h11.38
Es
Fy2 Dc
b2
if
"check" otherwise
Compression flange slenderness
So Fn1 is okaywebslend "okay"
webslend "okay"2 Dc
b26.77
Es
Fyif
"check" otherwise
6.10.5.3.3b
Web Slenderness
ksiFn1 36
Fn1 Rb Rh Fy
Hybrid FactorRh 1
RhMyr
My
since not hybridMyr My
ksiMy 81270.507
My Fy S
Load shedding factorRb 1
Rb 12 Dc
b2b
Es
fcif
1ar
1200 300 ar
2 Dc
b2b
Es
fcotherwise
122
Fnc Cb Rb Rh Fy 1.33 .187Lb
rt
Fy
EsLb 4.44 rt
Es
Fyif
Cb Rb Rh9.86 Es
Lb
rt
2Lb 4.44 rt
Es
Fyif
Cb 1.75
Cb 1.75 1.05Pl
Ph.3
Pl
Ph
3
kipPh 0.853
Ph b1 h1
ksi28.159
average stress in comp flange
Mu
S
Mu
S1
h1
yc
2
Pl is 0 because it is at an inflection pointPl 0
6.10.5.5
Lateral torsional bending
therefore use 6.10.5.5compbrace "check"
compbrace "okay" Lb 1.76 rtEs
Fyif
"check" otherwise
6.10.5.3.3d
Compression flange Bracing
So Fn1 okaycompslend "okay"
123
Therefore structure is capable of having negative moment diaphragms removedwithout affecting stability when only the large section is considered.
stability "Pass"
stability "Fail" Fu Frif
"Pass" otherwise
ksiFu 28.792
FuMu
S
ksiFr 36
Fr Fn f
ksiFn 36
Fn Fn2 Fn2 Fn1if
Fn1 otherwise
Final nominal stress
check "other"
check "lat tors" Fn2 Fn1if
"other" otherwise
Failure check
ksiFn2 36
Fn2 Rb Rh Fy Rb Rh Fy Fncif
Fnc otherwise
ksiFnc 57.604 4.44 rtEs
Fy755.06
124
BIBLIOGRAPHY
Aktan, A.E., K.A. Grimmelsman, and R.A. Barrish. “Structural Identification of a Long-Span Truss Bridge.” Transportation Research Record, Vol. 2, No. 1696, 2000, pp. 210-218.
Azizinamini, A. “Steel Bridge Design Using AASHTO LRFD Bridge Design Specifications (1999 Interim).” Proceedings of National Bridge Research Organization Short Course.Kansas City: NaBRO, November 1999.
Azizinamini, A., S. Kathol, and M. Beachman. “Effects of Cross Frames on Behavior of Steel Girder Bridges.” 4th International Bridge Engineering Conference Proceedings.Washington, D.C.: Transportation Research Board, 1995, pp. 117-124.
Chajes, M.J., H.W. Shenton III, and D. O’Shea. “Bridge-Condition Assessment and Load Rating Using Nondestructive Evaluation Methods.” Transportation Research Record,Vol. 2, No. 1969, 1998, pp. 83-91.
Cousins, T.E., and J.M. Stallings. “Calculation of Steel Diaphragm Behavior.” Journal of the Structural Division, Vol. 102, No. ST7, July 1976, pp. 1411-1430.
Cousins, T.E., and J.M. Stallings. “Laboratory Tests of Bolted Diaphragm-Girder Connection.” Journal of Bridge Engineering, Vol. 3, No. 2, May 1998, pp. 56-63.
Cousins, T.E., J.M. Stallings, and T.E. Stafford. “Removal of Diaphragms from 3-Span Steel Girder Bridge.” Journal of Bridge Engineering, Vol. 4, No. 1, February 1999, pp. 63-70.
Demers, C.E., and J.W. Fisher. A Survey of Localized Cracking in Steel Bridges 1981 to 1988. Advanced Technology for Large Structural Systems, Report No. 89-01. Bethlehem, Pennsylvania: Lehigh University, 1989.
Fisher, J.W. Fatigue and Fracture in Steel Bridges, Case Studies. New York: John Wiley and Sons, 1984.
Fisher, J.W. Fatigue Cracking in Steel Bridge Structures: Executive Summary. Advanced Technology for Large Structural Systems, Report No. 89-03. Bethlehem, Pennsylvania: Lehigh University, 1989.
Fisher, J.W., and P.B. Keating. “Distortion-Induced Fatigue Cracking of Bridge Details with Web Gaps.” Journal of Constructional Steel Research, Vol. 12, 1989, pp. 215-228.
Fisher, J.W., B.T. Yen, and D.C. Wagner. “Review of Field Measurements for Distortion Induced Fatigue Cracking in Steel Bridges.” Transportation Research Record, No. 1118, 1987, pp. 49-55.
Keating, P.B. “Focusing on Fatigue.” Civil Engineering, Vol. 64, No. 11, 1994, pp. 54-57.
125
Khalil, A. Aspects in Nondestructive Evaluation of Steel Plate Girder Bridges. Dissertation. Ames, Iowa: Iowa State University, 1998.
Miki, C., H. Takenouchi, T. Mori, and S. Ohkawa. “Repair of Fatigue Damage in Cross Bracing Connections in Steel Girder Bridges.” Structural Engineering/Earthquake Engineering, Vol. 6, No. 1, April 1989, pp. 31s-39s.
Shenton, H.W. III, M.J. Chajes, and E.S. Holloway. “A System for Monitoring Live Load Strain in Bridges.” Structural Materials Technology IV Conference Proceedings. Atlantic City, New Jersey: Federal Highway Administration, 2000, pp. 89-94.
Stallings, J.M., and T.E. Cousins. “Evaluation of Diaphragm Requirements in Existing Bridges.” Proceedings of the 15th Structures Congress 1997 Portland, Vol. 2. New York: ASCE, 1997, pp. 1494-1498.
Stallings, J.M., and T.E. Cousins. “Fatigue Cracking in Bolted Diaphragm Connections.” Proceedings of the 15th Structures Congress 1997 Portland, Vol. 1. New York: ASCE, 1997, pp. 36-40.
Stallings, J.M., and T.E. Cousins, and T.E. Stafford. “Effects of Removing Diaphragms from Steel Girder Bridge.” Transportation Research Record, Vol. 1541, 1996, pp. 183-188.
Wipf, T.J., and L.F. Greimann, A. Khalil. Preventing Cracking at Diaphragm/Plate Girder Connections in Steel Bridges. Iowa DOT Project HR-393. Ames, Iowa: Center for Transportation Research and Education, Iowa State University, 1998.
Zwerneman, F.S., A.B. West, and K.S. Lim. “Fatigue Damage to Steel Bridge Diaphragms.” Journal of Performance of Constructed Facilities, Vol. 7, No. 4, November 1993, pp. 207-225.