45
RETROFITTING CCS TO COAL: ENHANCING AUSTRALIA’S ENERGY SECURITY
RETROFITTING CCS TO COAL: ENHANCING AUSTRALIA’S ENERGY SECURITY

RETROFITTING CCS TO COAL: ENHANCING AUSTRALIA’S ENERGY SECURITY
Disclaimer This report was completed on 2 March 2017 and therefore the Report does not take into account events or circumstances arising after that time. The Report’s authors take no responsibility to update the Report.
The Report’s modelling considers only a single set of input assumptions which should not be considered entirely exhaustive. Modelling inherently requires assumptions about future behaviours and market interactions, which may result in forecasts that deviate from actual events. There will usually be differences between estimated and actual results, because events and circumstances frequently do not occur as expected, and those differences may be material. The authors of the Report take no responsibility for the modelling presented to be considered as a definitive account.
The authors of the Report highlight that the Report, does not constitute investment advice or a recommendation to you on your future course of action. The authors provide no assurance that the scenarios modelled will be accepted by any relevant authority or third party.
Conclusions in the report are based, in part, on the assumptions stated and on information which is publicly available. No listed author, company or supporter of this report, nor any member or employee thereof undertakes responsibility in any way whatsoever to any person in respect of errors in this Report arising from information that may be later be proven to be incorrect.
In the preparation of this Report the authors have considered and relied upon information sourced from a range of sources believed after due enquiry to be reliable and accurate. The authors have no reason to believe that any information supplied, or obtained from public sources, was false or that any material information has been withheld.
The authors do not imply and it should not be construed that they have verified any of the information provided, or that the author’s enquiries could have identified any matter which a more extensive examination might disclose.
While every effort is made by the authors to ensure that the facts and opinions contained in this document are accurate, the authors do not make
any representation about the content and suitability of this information for any particular purpose. The document is not intended to comprise advice, and is provided “as is” without express or implied warranty. Readers should form their own conclusion as to its applicability and suitability. The authors reserve the right to alter or amend this document without prior notice.
Authors: Geoff Bongers, Gamma Energy Technology Stephanie Byrom, Gamma Energy Technology Tania Constable, CO2CRC Limited
About CO2CRC Limited:
CO2CRC Limited is Australia’s leading CCS research organisation, having invested $100m in CCS research over the past decade. CO2CRC is the first organisation in Australia to have demonstrated CCS end-to-end, and has successfully stored more than 80,000 tonnes of CO2 at its renowned Otway Research Facility in Victoria. CO2CRC engages the world’s leading researchers to collaborate on benchtop and in-field research in Australia, delivering improvements and cost efficiencies in CCS to industry. www.co2crc.com.au
About Gamma Energy Technology:
Gamma Energy Technology is an independent energy consulting service, offering a range of technical and support services, including but not limited to power generation technology.
Gamma Energy Technology are proud to contribute to the ongoing discussions on energy in Australia as we seek to solve the trilemma of energy supply - to assure energy system security and affordability so that emissions reduction targets are delivered. www.gamma-energy-technology.com.au
Acknowledgements The authors would like to thank EPRI for their support as an extension to the APGT and for their advice and data. Confidential soundings were taken from Industry. We would like to thank ACALET and CarbonNet for their advice for this report. The CCS transport and storage chapter from the APGT has been recreated for this document. The authors acknowledge chapter authors Prof. D. Wiley and Dr M.Ho (University of Sydney), Dr P. Neal and Dr G Fimbres Weihs (UNSW) and peer reviewers named in the Chapter.

RETROFITTING CCS TO COAL: ENHANCING AUSTRALIA’S ENERGY SECURITY
Page iii
Table of Contents Key Messages ..........................................................................................................................................v
Executive Briefing .................................................................................................................................. vi International Climate Change Commitments................................................................................................. vi Diversity of Electricity Supply....................................................................................................................... vii New Technologies Will Cost More ................................................................................................................ vii CCS is Not Experimental ................................................................................................................................ ix Enhancing Energy Security ............................................................................................................................. ix Retrofit Costs are Comparable with Solar PV ................................................................................................. ix Benefits to Other Industries........................................................................................................................... x Jobs in Regions ............................................................................................................................................... xi Planning for a Sustainable Energy Future ...................................................................................................... xi Conclusion ..................................................................................................................................................... xi
1.0 Introduction ................................................................................................................................... 1 1.1. What is Post-Combustion Capture and Retrofitting ............................................................................. 1 1.2. Plant equipment and layout................................................................................................................. 3 1.3. Integration of PCC into existing Coal Plant ........................................................................................... 4
2.0 Case studies ................................................................................................................................... 6 2.1. Key CCS projects to date in Australia ................................................................................................ 6 2.2. Opportunities for Australia ............................................................................................................... 7 2.3. Key International Commercial CCS projects to date ......................................................................... 8 2.3.1. SaskPower Boundary Dam, Canada - CCS Project ........................................................................... 8 2.3.2. Petra Nova, USA - Carbon Capture Project .................................................................................. 10
3.0 PCC Retrofit ................................................................................................................................. 12 3.1. Brown Coal PCC Retrofit Cost and Performance ............................................................................. 12 3.2. Brown Coal PCC Retrofit Cost of Electricity ..................................................................................... 13 3.3. Black Coal PCC Retrofit Cost and Performance ............................................................................... 16 3.4. Black Coal PCC Retrofit Cost of Electricity ....................................................................................... 17 3.5. Retrofit Summary ............................................................................................................................ 20
Appendix 1 – CO2 Transport and Storage Case Studies ............................................................................. 22
Tables and Figures List of Figures Figure 1: PCC simplified process ......................................................................................................................... 2
Figure 2: Chemical solvent scrubbing process .................................................................................................... 2
Figure 3: MEA PCC unit (excluding flue gas desulphurisation and selective catalytic reduction and cooling towers) ............................................................................................................................................................... 3
Figure 4: Typical pulverised coal plant layout before and after PCC retrofit ...................................................... 4
Figure 5: Schematic of turbine and feedwater heater circuit for plant without CO2 capture ............................. 5

RETROFITTING CCS TO COAL: ENHANCING AUSTRALIA’S ENERGY SECURITY
Page iv
Figure 6: Schematic of pulverised coal plant integration with PCC plant ........................................................... 5
Figure 7: Capacity of existing or withdrawn generation, and committed or proposed generation projects for the NEM ............................................................................................................................................................. 7
Figure 8: SaskPower's Boundary Dam ................................................................................................................ 9
Figure 9: W.A Parish’s Petra Nova .................................................................................................................... 10
Figure 10: A brown coal LCOE comparison of potential PCC improvements .................................................... 14
Figure 11: Total capital plant cost – PCC retrofit comparison .......................................................................... 15
Figure 12: Household power supplied (yearly basis) after a PCC retrofit ......................................................... 16
Figure 13: An LCOE comparison a new build and retrofit black coal plant. ...................................................... 18
Figure 14: An LCOE comparison of potential PCC improvements on an ‘average’ black coal plant.................. 18
Figure 15: Total capital plant cost – PCC retrofit comparison for single boilers in NSW and Qld ..................... 19
Figure 16: Household power supplied (yearly basis) after a PCC retrofit for single boilers in NSW and Qld .... 20
Figure 17: Electricity technology comparisons ................................................................................................. 21
Figure 18: East coast emissions, storage basins and pipelines evaluated ........................................................ 24
Figure 19: West coast emissions, storage basins and pipelines evaluated ....................................................... 24
Figure 20: Thickness–permeability cross-plot for storage horizons considered in this study, along with existing projects under development and operation ....................................................................................... 25
Figure 21: Average total plant cost over 30 years for single-source to single-sink cases ................................. 26
Figure 22: Average total plant cost over 30 years for multiple-source to single-sink cases ............................. 28
Figure 23: Average total plant cost over 30 years for all case studies .............................................................. 29
Figure 24: Effects of trade-offs between pipeline diameter and number of wells on the average total plant cost over 30 years for the south NSW to Darling Pondie Range (core) case .................................................... 30
Figure 25: Changes in the average total plant cost over 30 years due to variations in the number of wells, capital costs and on-costs ................................................................................................................................ 32
List of Tables Table 1: Key CCS projects in Australia ................................................................................................................ 6
Table 2: Brown Coal Post Combustion Capture Costs ...................................................................................... 12
Table 3: Existing high efficiency brown coal retrofit analysis ........................................................................... 13
Table 4: Black Coal Post Combustion Capture Costs ........................................................................................ 16
Table 5: “Average black coal retrofit analysis ................................................................................................... 17
Table 6: Existing high efficiency black coal retrofit analysis ............................................................................. 19
Table 7: Source hubs and storage sites for case studies ................................................................................... 23
Key Messages
As a signatory to the Paris Agreement, Australia has agreed to hold the increase in global average temperature to well below 2 degrees. This can only be done through the inclusion of CCS (CCS).
Australia’s energy production has traditionally been some of the cheapest in the world. Any new or replacement low emissions technology will be more expensive than the current fleet in use.
Retrofit coal with CCS must be available on its merits to assure energy security and affordability, and to guarantee future emissions reduction targets are delivered at the lowest cost.
A brown or black coal single boiler that has been retrofitted with CCS costs the same (or less for black coal) to build as comparable solar PV. The plant captures almost 90 percent of CO2 and is available 24/7.
The conservative cost of retrofitting in Australia is $2.45b for a single 500MWe boiler to as little as $1.48b with learning by doing benefits and advanced solvents used.
Commercial scale CCS is expanding rapidly, with learning by doing reducing costs by 20 – 30 percent.
New build baseload coal with CCS can use existing infrastructure.
Oil, gas and manufacturing can be retrofitted to CCS and utilise existing transport hub and storage infrastructure.
High value direct and indirect jobs will be created in some regions Latrobe Valley VIC, Central Coast NSW, North QLD and new jobs created for transport and storage.
Immediate decisions need to be made now to facilitate grid scale, 24/7, reliable and available transition to clean energy.
CCS retrofit is suitable for some coal plants and regions, but not all.
RETROFITTING CCS TO COAL: ENHANCING AUSTRALIA’S ENERGY SECURITY
Page v
RETROFITTING CCS TO COAL: ENHANCING AUSTRALIA’S ENERGY SECURITY
Page vi
Executive Briefing There is an urgent need to address Australia’s energy trilemma of clean, reliable and affordable energy.1 Retrofitting CCS to Coal- Enhancing Australia’s Energy Security is a supplementary report to the 2015 Australian Power Generation Technology Report (APGT). The retrofitting report responds to the opportunities for retrofitting brown and black coal plants in Victoria, New South Wales and Queensland and provides an analysis of retrofitting coal fired power stations with carbon capture and storage (CCS).
The 2015 APGT resulted from the combined efforts of 45 organisations representing a broad range of government, researchers and industry participants, including project developers, technology experts and international consultants. The APGT stands as the most up to date, unbiased, technology neutral review of a broad range of generation technologies, their capabilities and costs for 2015, looking out to 2030.2
1 Prime Minister of Australia 2017, Address to the National
Press Club, 1 February 2017, https://www.pm.gov.au
2 CO2CRC 2015, Australian Power Generation TechnologyReport, http://www.co2crc.com.au/wp-content/uploads/2016/04/LCOE_Report_final_web.pdf
3 International Energy Agency 2016, 20 years of carbon
capture and storage Accelerating future deployment,
https://www.iea.org/publications/freepublications/publication/ 20YearsofCarbonCaptureandStorage_WEB.pdf
International Climate Change Commitments As a signatory to the Paris Agreement, Australia has agreed to hold the increase in the global average temperature to well below 2°C above pre-industrial levels and pursue efforts to limit the temperature increase to 1.5°C.
The International Energy Agency (IEA) estimates that a total of 94 gigatonnes of CO2 emissions reductions will be required in the period through to 2050. This amounts to 12 per cent of the cumulative emissions reduction task in the energy sector.3 The Intergovernmental Panel on Climate Change has also determined that without CCS, the cost of achieving a 2°C world more than doubles (138%) by 2100.4
As the international community, including Australia transition to a low carbon future, resource and system diversity will be required to achieve a sustainable long-term energy outcome. Australia is fortunate to have an abundance of natural resources with the ability to take advantage of numerous technologies: we have exceptional renewable resources including hydro, gas and coal with low cost fuel infrastructure established for CCS, and the option of nuclear energy5.
4 Intergovernmental Panel on Climate Change 2014, IPCC 5th
Assessment Report, http://www.ipcc.ch/pdf/assessment-
report/ar5/syr/SYR_AR5_FINAL_full_wcover.pdf
5 CO2CRC 2015, Australian Power Generation Technology Report, http://www.co2crc.com.au/wp-content/
uploads/2016/04/LCOE_Report_final_web.pdf

RETROFITTING CCS TO COAL: ENHANCING AUSTRALIA’S ENERGY SECURITY
Page vii
Diversity of Electricity Supply The generation sources, how they feed into Australia’s electricity grids and how are managed continues to develop and change. This rapid change is placing pressure on the reliability of national electricity systems. Australia is responding to the challenges of climate change requiring the wide deployment of low and zero carbon emissions technologies.
Diverse low and zero emissions technologies add to Australia’s ability to meet the biggest challenge of the decade: to achieve energy security through reliable and available 24/7, clean, affordable energy. No single technology can achieve this challenge by itself.2 All of the large-scale power generation technologies available have significant capabilities and limitations. Combined use of these large-scale, firm power generation technologies can place Australia at the forefront of energy and climate change world-wide.
6 Country Rankings, International Energy Agency, Energy Prices and Taxes 2016.
New Technologies Will Cost More Australia has for over a century experienced amongst the lowest cost energy in the OECD. During recent years, electricity prices have risen significantly and Australia has slipped in OECD rankings from consistently one of the lowest to number 25 (based on US market exchange rates)6. Taking into account purchasing parity Australia would rank 13th lowest. A variety of factors have contributed to this change, including primary driver network investments, however like all other OECD countries diversification of our energy technology mix has contributed to higher prices for consumers.
Simplified post combustion carbon capture schematic

RETROFITTING CCS TO COAL: ENHANCING AUSTRALIA’S ENERGY SECURITY
Page viii
The cost of some technologies has declined significantly over the last few years, particularly wind and solar PV, and these particular technologies continue to drop. We celebrate these achievements for wind and solar, however, success has taken time with the realisation of policy support including financial assistance for the renewables sector. Retrofitting coal or gas with CCS will also take time. It will be necessary to gain public support for CCS through access to current policy instruments such as enhancing the renewable energy target to include low emissions technology options, lifting prohibitions within the Clean Energy Finance Corporation (CEFC) and expanding ARENA’s mandate to include low emissions technology options. Extending policy instruments such as the renewable energy target to CCS will also provide clarity and investment incentives to business, providing encouragement to move towards commercial projects. The figure below is taken from the 2015 APGT and updated to include brown and black coal retrofit with CCS. The LCOE range for full brown coal retrofit with CCS is $122 - $164 and $103 - $154 for full black coal retrofit with CCS. Utility 1 PV axis tracking has been updated to reflect learnings and shows a range of $95 to $121.
Levelised cost of electricity – adapted from APGT to include retrofit costs and 2017 Solar PV

RETROFITTING CCS TO COAL: ENHANCING AUSTRALIA’S ENERGY SECURITY
Page ix
CCS is Not Experimental CCS is proven and in use around the world. There are 21 large-scale CCS projects in operation or under construction globally. The combined CO2 capture capacity of these 21 projects is around 40 million tonnes per annum (Mtpa). All projects presently in construction (5 as of January 2017) are anticipated to be operational by the end of 2017, widening the range of countries, industries and technologies represented. This compares with less than 10 large-scale operational projects at the beginning of this decade.
Enhancing Energy Security Once in place, retrofitting baseload with CCS is cost competitive in the delivery of electricity. When considering the total cost of delivered electricity into the national electricity market, CCS can be applied to baseload plants, making it available when needed.
Retrofitting baseload power with CCS does not require the generator or grid operator (or customer) to incur the costs of energy storage. Further, coal with CCS does not require the availability of additional dispatchable back-up generation capacity that may be uneconomic to operate. CCS is applied to rotating synchronous generators and thus provide the frequency and voltage control essential to maintain a stable grid.
Retrofit Costs are Comparable with Solar PV The capital costs for post combustion capture retrofit for brown coal and solar PV are similar in costs. Retrofitting 2100 megawatts of an existing efficient brown coal power station would achieve 1500 megawatts of low carbon electricity and cost just over $10 billion. This would power just under 2 million households per annum and would be equivalent to 4800 megawatts of solar PV at the same cost.
W.A Parish’s Petra Nova post combustion retrofit
Electricity technology comparisons
W.A Parish’s Petra Nova post combustion retrofit

RETROFITTING CCS TO COAL: ENHANCING AUSTRALIA’S ENERGY SECURITY
Page x
Retrofitting a single boiler on a brown coal power plant would cost less than a fully retrofitted brown coal power station. For a single boiler the cost is conservatively $2.45 billion. In application, there are avenues to lower costs further, due to the reduced need for SOx and NOx controls due to quality brown coal (low ash, low sulphur) in the Latrobe Valley.
The capital costs for post combustion capture retrofit for black coal are lower than the comparable scale of solar PV. Since black coal is cheaper per kilowatt than brown coal per kilowatt, a total retrofit of a black coal power station will cost less than the equivalent in solar PV.
A single boiler retrofit on 450 megawatts on an average black coal power station would cost $1.8 billion powering 430,000 households and would be equivalent to 1050 megawatts of solar PV. The optimistic scenario on a single boiler retrofit taking into account use of advanced solvent capture technologies and learning by doing at a capital rate of 20 per cent, would cost $1.4billion. This would power around 440,000 households.
Using the non-optimistic case for brown coal the levelised cost of electricity is 14% cheaper than new build coal and 18% cheaper for black coal.
Benefits to Other Industries Vital industries such as steel, cement, plastics, chemicals, and fertiliser production emit large amounts of carbon dioxide. Currently, only coal and gas with CCS attached can produce the clean, uninterrupted and abundant energy required for these vital industries. Through establishing a CCS system early through retrofitting some coal fired power generation, there is potential for other industries to leverage off new pipeline infrastructure and storage capacity.
Brown coal post combustion capture retrofit improvements on existing high efficiency plant
RETROFITTING CCS TO COAL: ENHANCING AUSTRALIA’S ENERGY SECURITY
Page xi
Jobs in Regions The Committee for Gippsland in their report Our Region our Future, Securing an Economic Future for Gippsland and the Latrobe Valley, the Committee argue through strong analytics that “there are thousands of Gippslanders who rely on Latrobe Valley power stations for their living and livelihoods”. More broadly there are tens of thousands of Victorians who rely on low cost reliable electricity for their livelihoods in manufacturing and industry. This equally applies in NSW and Queensland. There is a strong correlation between high value jobs and the opportunity to retrofit some current coal fired power stations with CCS to retain high value jobs in regional areas. Whilst no current coal fired power station is currently retrofitted in Australia, the Gippsland Committee estimate that 3000 jobs would be saved if all of the current power stations in the Latrobe Valley were to remain in operation. Further, there are significant opportunities through capital construction of pipelines for transport and long-term storage.7
Planning for a Sustainable Energy Future There is a particular issue with respect to electricity generation on the east coast, home to greater than 86 per cent of total power demand and where typically 85 per cent of this demand is consistently met through coal and gas. While there has been an oversupply of electricity in the market over the last few years this has turned around rapidly. Announced and planned closures of coal-fired power plants have recently seen a tightening of the national electricity market.
The lead times for all substantial electricity infrastructure development are long and unlikely to be less than five to six years for coal with CCS. Assessment and approval processes including public consultation, financing, feasibility and front-end engineering design is required leading up to a decision to begin construction on a power plant. Significant cracks have already emerged in the electricity system and decisions need to be made now to meet Australia’s future energy needs.
Conclusion Australia cannot afford to compromise energy security, however, retrofitting base load coal power with CCS will help achieve reliable 24/7, lowest cost and a clean energy future for Australia on some plants.
7 Our Region Our Future: Securing an Economic Future for Gippsland and Latrobe Valley (Our Region Our Future) report, Committee for Gippsland.
RETROFITTING CCS TO COAL: ENHANCING AUSTRALIA’S ENERGY SECURITY
Page 1
1. IntroductionThis report examines the cost and performance of retrofitting post-combustion capture (PCC) technology to existing brown coal-fired plants. It also presents various options for both brown and black coal-fired plants in Australia. It aims to update the Post Combustion Retrofit chapter in the Australian Power Generation Technology5 report. In summary we seek to highlight the technical and economic issues associated with retrofitting existing plants with an amine-based PCC technology.
Achieving carbon dioxide (CO2) emissions control, while keeping electricity prices competitive and sustaining economic growth, presents society with unprecedented economic and technical challenges. CO2 capture retrofit technologies are considered one of the important means of reducing coal-derived CO2 emissions. As such progressing the commercialisation of PCC is important to society’s economic wellbeing in a carbon-constrained future.
With the majority of Australia’s power generation coming from fossil-fuel based generation, CO2 will need to be removed from existing and future fossil-fuelled plant flue gases to significantly reduce CO2 emissions. However, retrofitting PCC to an existing plant presents significant challenges, such as the following:
• Limited space for new plant equipment
• Limited heat available for process integration
• Limitations of the existing steam turbine
• Cooling water limitations
• Replacement power considerations
• Complicated pipe routings
• Current economics within the power generation sector
The current suite of CO2 capture technologies significantly decreases plant power output and increases the cost of electricity. The challenge is to continually improve these processes to reduce the capture penalties in both efficiency and cost of electricity.
1.1. What is Post-Combustion Capture and Retrofitting Post combustion capture or PCC refers to the separation of CO2 from flue gas derived from the combustion of fossil fuel – typically coal but the technology is also applicable to natural gas and oil based systems. For a coal based pulverised fuel power system, coal is combusted in air and the liberated heat is converted to steam and then into electricity.
The combustion of coal results in a flue gas mixture consisting of particulate matter, nitrogen, carbon dioxide, water and a range of minor gases. Depending on the post combustion capture technology many of the minor elements must be removed before the removal of CO2 from the flue gas.
8 Gamma Energy Technology 2017, Power Factbook, www.powerfactbook.com

RETROFITTING CCS TO COAL: ENHANCING AUSTRALIA’S ENERGY SECURITY
Page 2
Figure 1: PCC simplified process8
To retrofit an existing coal and combined cycle gas plant with a post combustion process would require significant modifications to the steam cycle. While for an existing plant the combustion and power generation systems are not significantly affected modifications will be required in the steam cycle due to a diversion of steam to the post combustion capture system.
The primary separation task for post combustion capture is the separation of carbon dioxide from nitrogen. The currently preferred technology is chemical solvent scrubbing - typically an amine based solvent. While there are a range of PCC technologies,9 the only one covered in this report is the amine based.
Figure 2: Chemical solvent scrubbing process8

RETROFITTING CCS TO COAL: ENHANCING AUSTRALIA’S ENERGY SECURITY
Page 3
1.2. Plant equipment and layout The PCC design used for a typical coal-fired power station consists of:
• 2 absorber trains
• 1 regenerator per absorber train (2 in total)
• 1 compression train per regenerator (2 trains in total)
• 8 reboilers per regenerator (16 reboilers in total).
The typical layout of key PCC components is shown in Figure 3.8
Figure 3: MEA PCC unit (excluding flue gas desulphurisation and selective catalytic reduction and cooling towers)
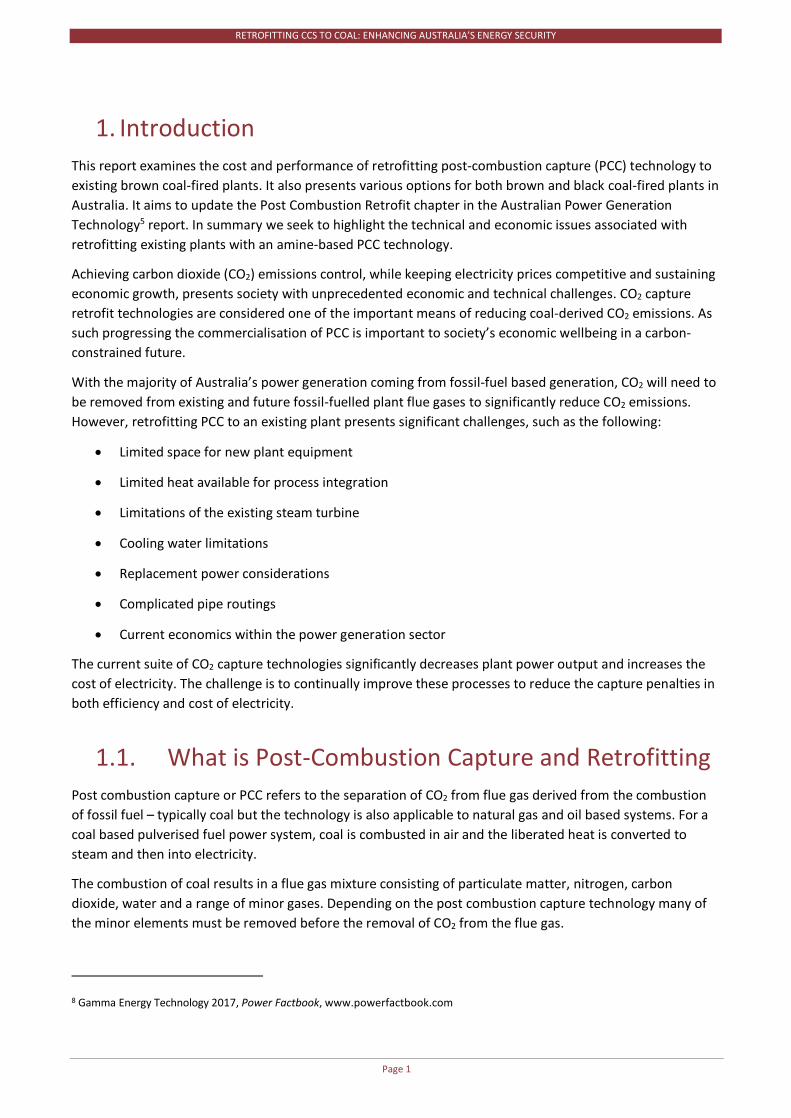
Layouts for a “typical” coal power plant, before and after an MEA PCC retrofit, are shown in Figure 4.8 They include as part of the refit the addition of flue gas desulphurisation (FGD) and selective catalytic reduction (SCR) equipment not currently found in Australian units, as well as all additional cooling equipment required for the capture equipment. FGD and SCR systems are needed because sulphur compounds and nitrogen dioxide in the flue gas will react with the MEA solvent to form degradation products and increase the cost of solvent make-up. The FGD system typically removes sulphur compounds to below 10ppmv.9
RETROFITTING CCS TO COAL: ENHANCING AUSTRALIA’S ENERGY SECURITY
Page 4
Figure 4: Typical pulverised coal plant layout before and after PCC retrofit
In a best-case scenario, in which space is available near the plant, about 4 hectares is needed for the new PCC plant (including the additional cooling tower, FGD and SCR). Space required is dependent on the plant layout and the size of the unit/s undergoing a retrofit.9
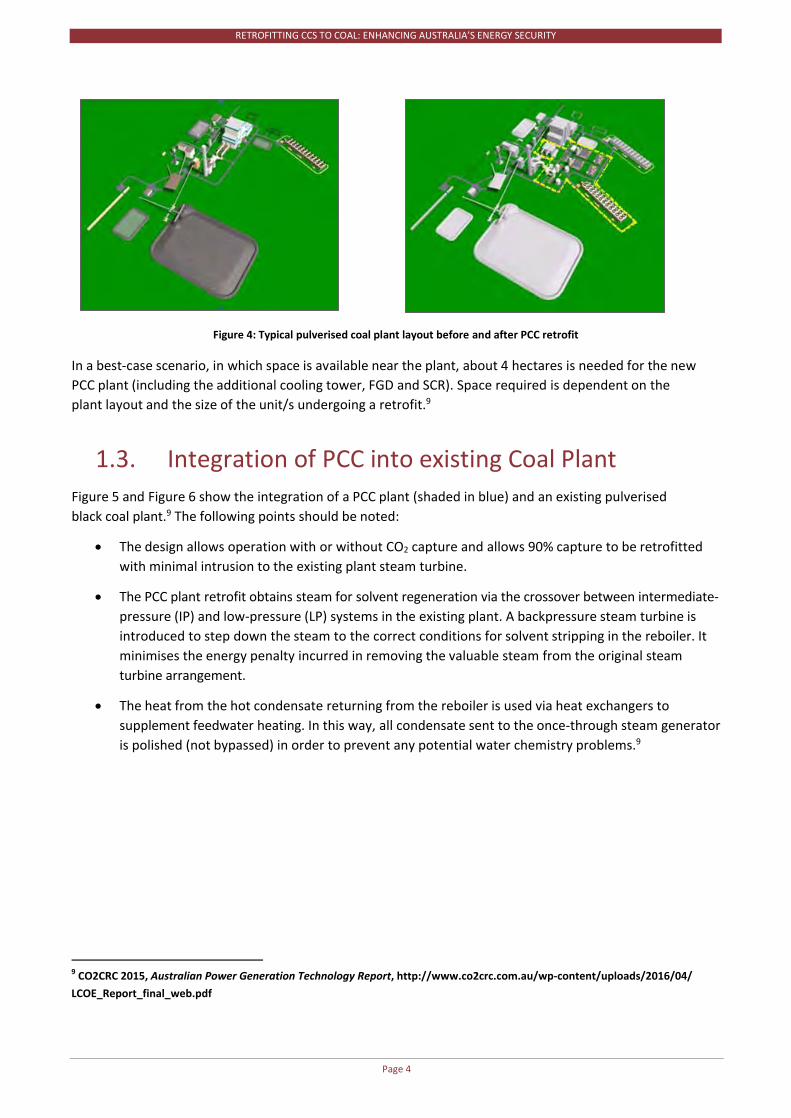
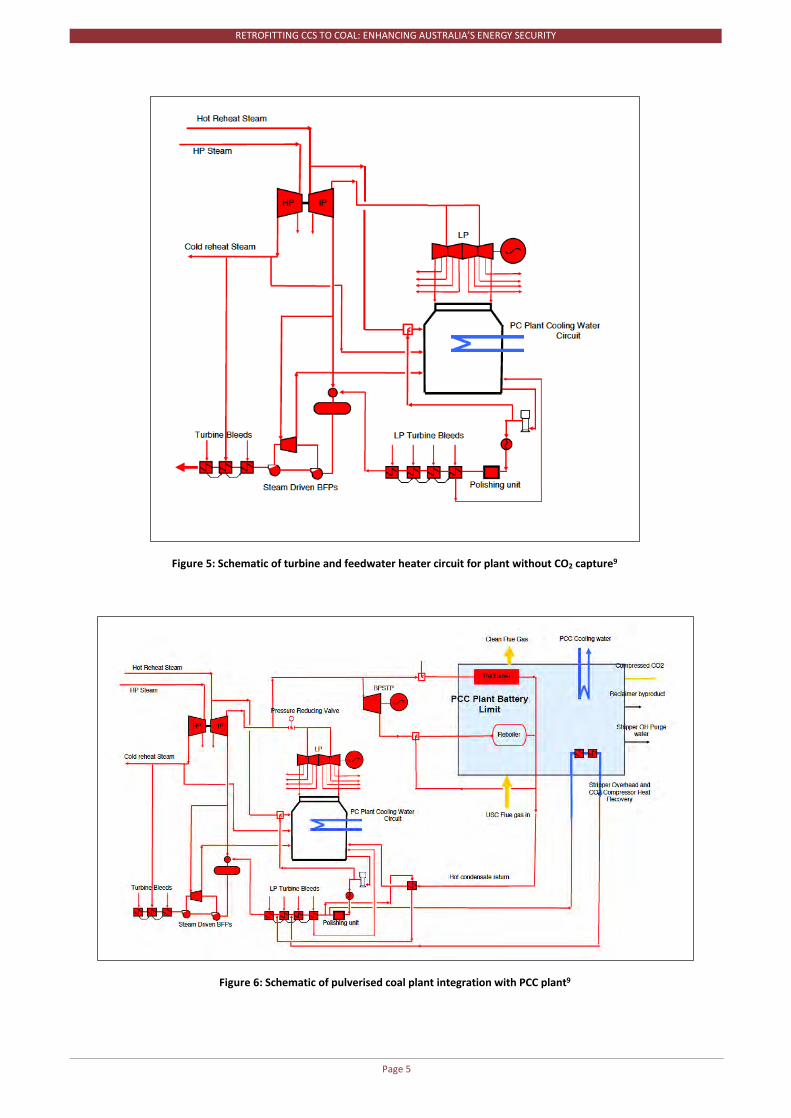
1.3. Integration of PCC into existing Coal Plant Figure 5 and Figure 6 show the integration of a PCC plant (shaded in blue) and an existing pulverised black coal plant.9 The following points should be noted:
• The design allows operation with or without CO2 capture and allows 90% capture to be retrofittedwith minimal intrusion to the existing plant steam turbine.
• The PCC plant retrofit obtains steam for solvent regeneration via the crossover between intermediate-pressure (IP) and low-pressure (LP) systems in the existing plant. A backpressure steam turbine isintroduced to step down the steam to the correct conditions for solvent stripping in the reboiler. Itminimises the energy penalty incurred in removing the valuable steam from the original steamturbine arrangement.
• The heat from the hot condensate returning from the reboiler is used via heat exchangers tosupplement feedwater heating. In this way, all condensate sent to the once-through steam generatoris polished (not bypassed) in order to prevent any potential water chemistry problems.9
9 CO2CRC 2015, Australian Power Generation Technology Report, http://www.co2crc.com.au/wp-content/uploads/2016/04/LCOE_Report_final_web.pdf
RETROFITTING CCS TO COAL: ENHANCING AUSTRALIA’S ENERGY SECURITY
Page 5
Figure 5: Schematic of turbine and feedwater heater circuit for plant without CO2 capture9
Figure 6: Schematic of pulverised coal plant integration with PCC plant9
RETROFITTING CCS TO COAL: ENHANCING AUSTRALIA’S ENERGY SECURITY
Page 6
2.0 Case studies The technologies involved in CCS are not inherently new, having been applied in various forms for decades in the oil and gas industry. Despite their relatively recent application to emissions reductions in the power sector, there are already several projects in Australia.
2.1. Key CCS projects to date in Australia
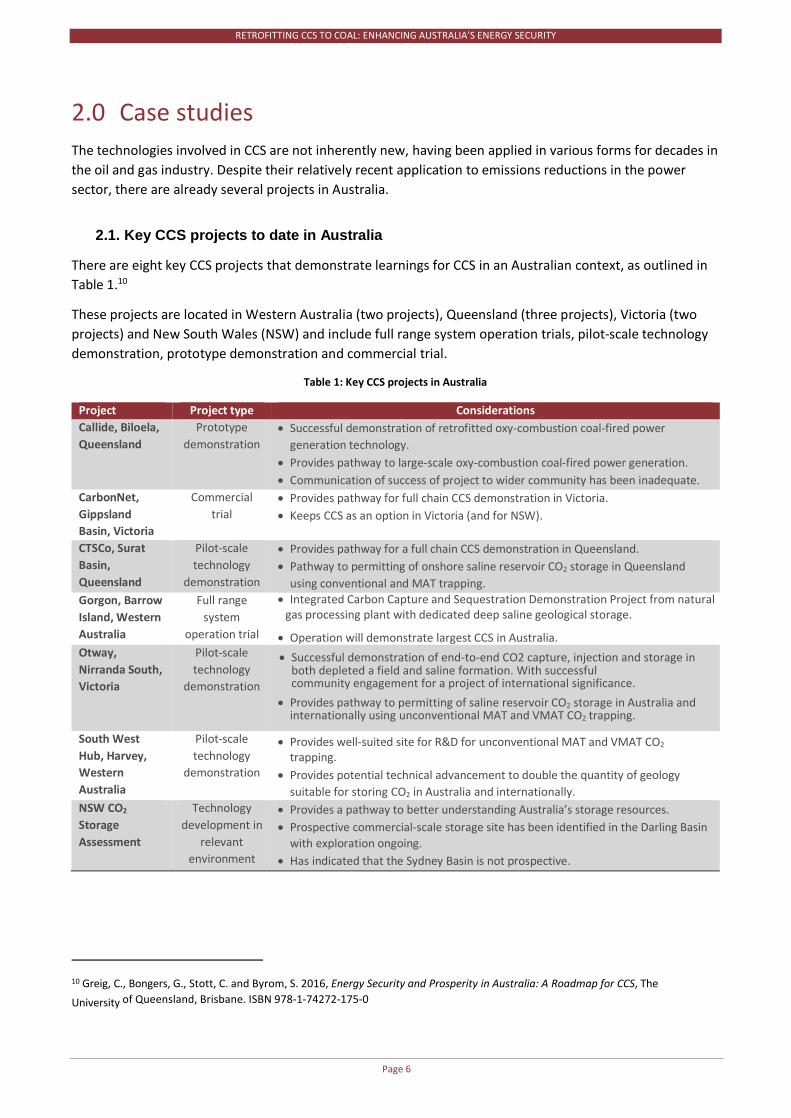
There are eight key CCS projects that demonstrate learnings for CCS in an Australian context, as outlined in Table 1.10
These projects are located in Western Australia (two projects), Queensland (three projects), Victoria (two projects) and New South Wales (NSW) and include full range system operation trials, pilot-scale technology demonstration, prototype demonstration and commercial trial.
Table 1: Key CCS projects in Australia
Project Project type Considerations Callide, Biloela, Queensland
Prototype demonstration
• Successful demonstration of retrofitted oxy-combustion coal-fired powergeneration technology.
• Provides pathway to large-scale oxy-combustion coal-fired power generation. • Communication of success of project to wider community has been inadequate.
CarbonNet, Gippsland Basin, Victoria
Commercial trial
• Provides pathway for full chain CCS demonstration in Victoria. • Keeps CCS as an option in Victoria (and for NSW).
CTSCo, Surat Basin, Queensland
Pilot-scale technology
demonstration
• Provides pathway for a full chain CCS demonstration in Queensland. • Pathway to permitting of onshore saline reservoir CO2 storage in Queensland
using conventional and MAT trapping. Gorgon, Barrow Island, Western Australia
Full range system
operation trial Otway, Nirranda South, Victoria
Pilot-scale technology
demonstration
• Integrated Carbon Capture and Sequestration Demonstration Project from naturalgas processing plant with dedicated deep saline geological storage.
• Operation will demonstrate largest CCS in Australia.
South West Hub, Harvey, Western Australia
Pilot-scale technology
demonstration
NSW CO2 Storage Assessment
Technology development in
relevant environment
• Provides pathway to permitting of saline reservoir CO2 storage in Australia andinternationally using unconventional MAT and VMAT CO2 trapping.
• Provides well-suited site for R&D for unconventional MAT and VMAT CO2
trapping.• Provides potential technical advancement to double the quantity of geology
suitable for storing CO2 in Australia and internationally.• Provides a pathway to better understanding Australia’s storage resources.• Prospective commercial-scale storage site has been identified in the Darling Basin
with exploration ongoing. • Has indicated that the Sydney Basin is not prospective.
10 Greig, C., Bongers, G., Stott, C. and Byrom, S. 2016, Energy Security and Prosperity in Australia: A Roadmap for CCS, The
University of Queensland, Brisbane. ISBN 978-1-74272-175-0
• Successful demonstration of end-to-end CO2 capture, injection and storage inboth depleted a field and saline formation. With successful community engagement for a project of international significance.
RETROFITTING CCS TO COAL: ENHANCING AUSTRALIA’S ENERGY SECURITY
Page 7
2.2. Opportunities for Australia
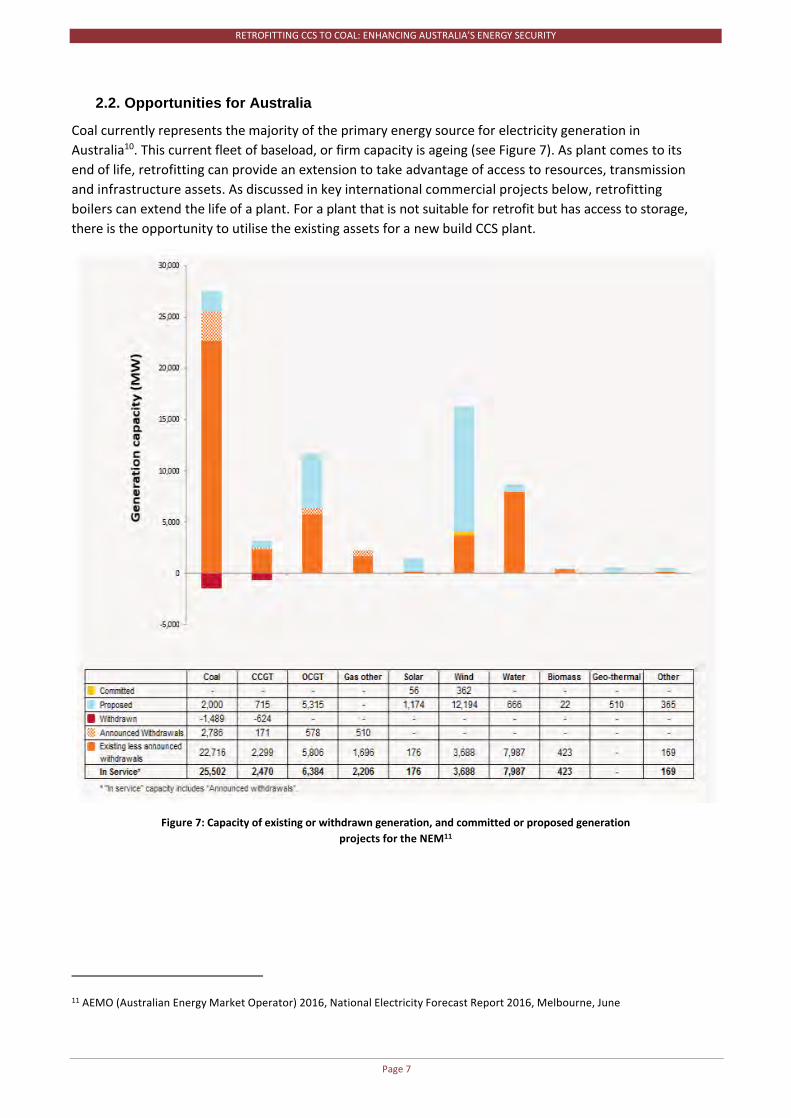
Coal currently represents the majority of the primary energy source for electricity generation in Australia10. This current fleet of baseload, or firm capacity is ageing (see Figure 7). As plant comes to its end of life, retrofitting can provide an extension to take advantage of access to resources, transmission and infrastructure assets. As discussed in key international commercial projects below, retrofitting boilers can extend the life of a plant. For a plant that is not suitable for retrofit but has access to storage, there is the opportunity to utilise the existing assets for a new build CCS plant.
Figure 7: Capacity of existing or withdrawn generation, and committed or proposed generation projects for the NEM11
11 AEMO (Australian Energy Market Operator) 2016, National Electricity Forecast Report 2016, Melbourne, June
RETROFITTING CCS TO COAL: ENHANCING AUSTRALIA’S ENERGY SECURITY
Page 8
2.3. Key International Commercial CCS projects to date
CCS technology is proven and in use around the world. There are 21 large-scale CCS projects in operation or under construction globally. The combined CO2 capture capacity of these 21 projects is around 40 million tonnes per annum (Mtpa). All projects presently in construction (five as of January 2017) are anticipated to be operational by the end of 2017, widening the range of countries, industries and technologies represented. This compares with less than 10 large-scale operational projects at the beginning of this decade.
There are another six large-scale CCS projects at the most advanced stage of development planning, the Concept Definition (or Define) stage, with a total CO2 capture capacity of around 8 Mtpa. A further 11 large-scale CCS projects are in earlier stages of development planning (the Evaluate and Identify stages) and have a total CO2 capture capacity of around 21 Mtpa.12
2.3.1. SaskPower Boundary Dam, Canada - CCS Project
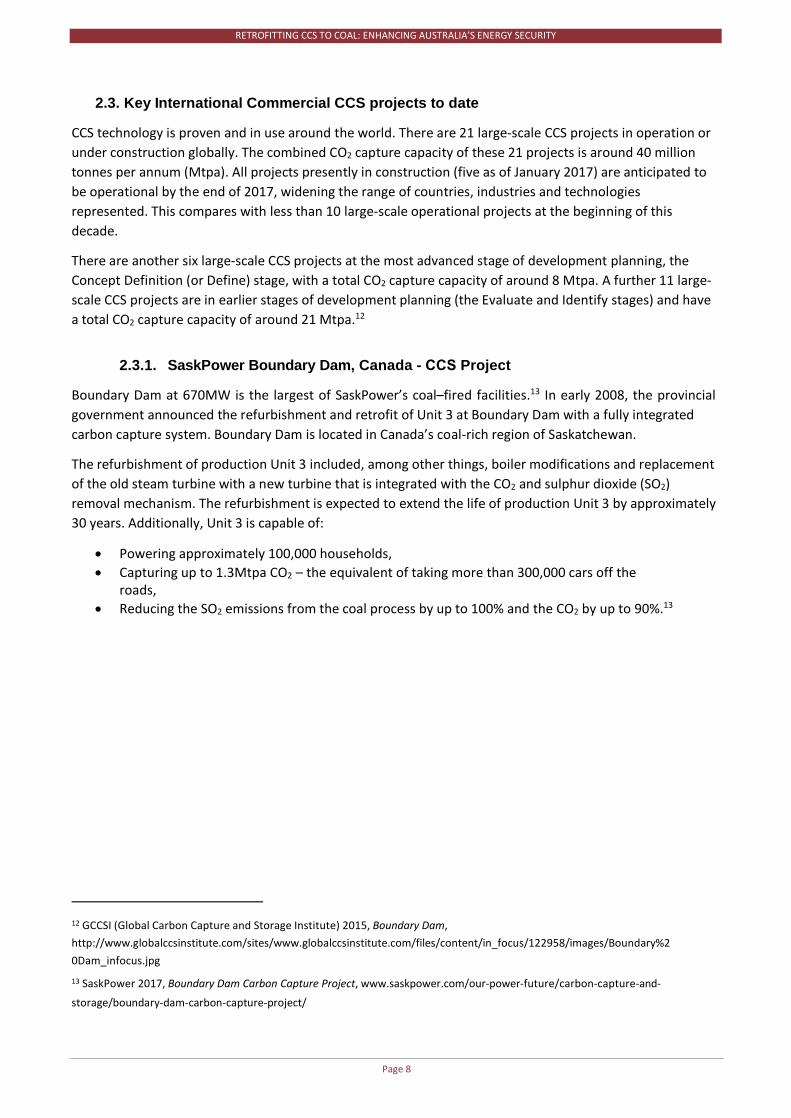
Boundary Dam at 670MW is the largest of SaskPower’s coal–fired facilities.13 In early 2008, the provincial government announced the refurbishment and retrofit of Unit 3 at Boundary Dam with a fully integrated carbon capture system. Boundary Dam is located in Canada’s coal-rich region of Saskatchewan.
The refurbishment of production Unit 3 included, among other things, boiler modifications and replacement of the old steam turbine with a new turbine that is integrated with the CO2 and sulphur dioxide (SO2) removal mechanism. The refurbishment is expected to extend the life of production Unit 3 by approximately 30 years. Additionally, Unit 3 is capable of:
• Powering approximately 100,000 households,• Capturing up to 1.3Mtpa CO2 – the equivalent of taking more than 300,000 cars off the
roads,• Reducing the SO2 emissions from the coal process by up to 100% and the CO2 by up to 90%.13
12 GCCSI (Global Carbon Capture and Storage Institute) 2015, Boundary Dam, http://www.globalccsinstitute.com/sites/www.globalccsinstitute.com/files/content/in_focus/122958/images/Boundary%2 0Dam_infocus.jpg
13 SaskPower 2017, Boundary Dam Carbon Capture Project, www.saskpower.com/our-power-future/carbon-capture-and-
storage/boundary-dam-carbon-capture-project/
RETROFITTING CCS TO COAL: ENHANCING AUSTRALIA’S ENERGY SECURITY
Page 9
Figure 8: SaskPower's Boundary Dam14
The refurbishment of production Unit 3 included, among other things, boiler modifications and replacement of the old steam turbine with a new turbine that is integrated with the CO2 and SO2 removal mechanism. The refurbishment is expected to extend the life of production Unit 3 by approximately 30 years.
Removal of the SO2 and CO2 streams uses the commercially available Shell Cansolv post-combustion capture amine technologies and takes place in a two-stage process. Firstly, the flue gas is desulphurised, releasing a pure stream of SO2 that is further processed on site and provides feedstock to a 60 tonnes per day sulphuric acid plant, which is to be sold as a byproduct. The CO2 removal process follows after the flue gas has been desulphurised.14
Unit 3 is a 139 MWe gross conventional pulverised coal power plant, with a net output of 110 MWe. The capture process has a 21% auxiliary load and brings the plant to approximately 26% HHV thermal efficiency. Unit 3 is designed for 85% plant availability, with approximately 45% in the first year following the retrofit. The PCC is estimated to capture 1 Mtpa at a 90% capture rate.10
Mechanical completion of the carbon capture facilities was in December 2013 with commissioning activities beginning thereafter. The completion of the power plant refurbishment occurred in the second quarter of 2014. Operation of the project commenced in October 2014.
The CO2 captured from production unit 3 is used primarily for EOR at the Weyburn Oil Unit and supplements the existing CO2 supply to the Weyburn–Midale fields delivered by the 330 km / 205 mile Souris Valley pipeline from a gasification facility in North Dakota, with an agreement in place to purchase approximately 1 Mtpa of CO2.
A portion of the CO2 captured from the Boundary Dam plant will be injected into a deep saline formation through SaskPower’s Carbon Storage and Research Centre (CSRC). The CSRC hosts the Aquistore project,
14 GCCSI (Global Carbon Capture and Storage Institute) 2015, Boundary Dam, http://www.globalccsinstitute.com/sites/www.globalccsinstitute.com/files/content/in_focus/122958/images/Boundary%2 0Dam_infocus.jpg
15 Massachusetts Institute of Technology, 2016, CCS Project Database, https://sequestration.mit.edu/tools/projects/index.html

RETROFITTING CCS TO COAL: ENHANCING AUSTRALIA’S ENERGY SECURITY
Page 10
which is currently administered by the Petroleum Technology Research Centre. The Aquistore project, located around 3km from the Boundary Dam facility, Aquistore an independent research and monitoring project. The project works to show that storing CO2 deep underground is a safe way to reduce greenhouse gas emissions16.
In April 2015 it was announced that CO2 injection had begun at the Aquistore Project, which by late 2016 had reached the milestone of over 100,000 tonnes injected and stored (and which included an extensive seismic monitoring program).
2.3.2. Petra Nova, USA - Carbon Capture Project
At 240 MW, Petra Nova is the world's largest post-combustion carbon capture facility installed on an existing coal-fuelled power plant. The project was selected by the United States Department of Energy (DOE) to receive up to $190 million as part of the Clean Coal Power Initiative Program (CCPI), a cost-shared collaboration between the federal government and private industry.17
The W.A. Parish power plant is one of the largest generation facilities in the United States with four coal-fired units totalling 2,475 MW and six gas-fired units totalling 1,270 MW. Unit 8 of the W.A. Parish plant was retrofitted with a post combustion CO2 capture system constructed within the existing site.18
Figure 9: W.A Parish’s Petra Nova19
The Petra Nova Project utilises a proven carbon capture process, which was jointly developed by Mitsubishi Heavy Industries, Ltd. (MHI) and the Kansai Electric Power Co., that uses a high-performance solvent for CO2 absorption and desorption.16
16 SaskPower 2017, Carbon Storage Research Centre, http://www.saskpower.com/our-power-future/carbon-capture-and-
storage/carbon-storage-research-centre/
17 NRG, 2016, Petra Nova, http://www.nrg.com/generation/projects/petra-nova/
18 GCCSI (Global Carbon Capture and Storage Institute) 2017, Petra Nova Carbon Capture Project,
https://www.globalccsinstitute.com/projects/petra-nova-carbon-capture-project
19 EE News, 2014, Petra Nova, http://www.eenews.net/image_assets/2014/09/image_asset_789.jpg 36

RETROFITTING CCS TO COAL: ENHANCING AUSTRALIA’S ENERGY SECURITY
Page 11
The amine-based solvent will capture at least 90% (or approximately 1.4 Mtpa) of CO2 from a 240 MW flue gas slipstream of the 610 MWnet pulverized coal-fired generating unit. NRG Energy initially contemplated a smaller-scale proposal at the Parish plant, capturing approximately 375,000 tonnes of CO2 per annum from a 60 MW flue gas slipstream, but the project was subsequently expanded to its current form to provide larger volumes of CO2 for EOR purposes. A new 75 MWnet gas-fired cogeneration plant commenced operation in June 2103 to provide peaking power for the electric grid in Texas. The cogeneration facility provides steam and power to operate the capture plant (with any remaining MWhs of electric energy to be sold into the grid).
The purity of the CO2 put into the pipeline for transport is designed to be greater than 99%. The captured CO2 is transported via a new 132 km underground pipeline to the West Ranch oil field in Jackson County. Texas Coastal Ventures (TCV) owns and operates the pipeline.20
The transported CO2 is injected approximately 1,640 – 2,060 meters below ground surface to the West Ranch oil field for enhanced oil recovery (EOR). Nine injection wells and 16 production wells are being used initially for EOR operations. Over the 20-year project life, as many as 130 injection wells and 130 production wells may be used. It is expected that oil production will be boosted from around 300 barrels per day today to up to 15,000 barrels per day while also sequestering CO2 underground. This field is currently estimated to hold approximately 60 million barrels of oil recoverable from EOR operations.17
Texas Coastal Ventures, in cooperation with the Texas Bureau of Economic Geology, has developed a CO2 monitoring plan to track the injection and migration of CO2 within the geologic formations at the EOR site.18
20 NRG, 2016, Petra Nova, http://www.nrg.com/generation/projects/petra-nova/
RETROFITTING CCS TO COAL: ENHANCING AUSTRALIA’S ENERGY SECURITY
Page 12
3.0 PCC Retrofit
3.1. Brown Coal PCC Retrofit Cost and Performance
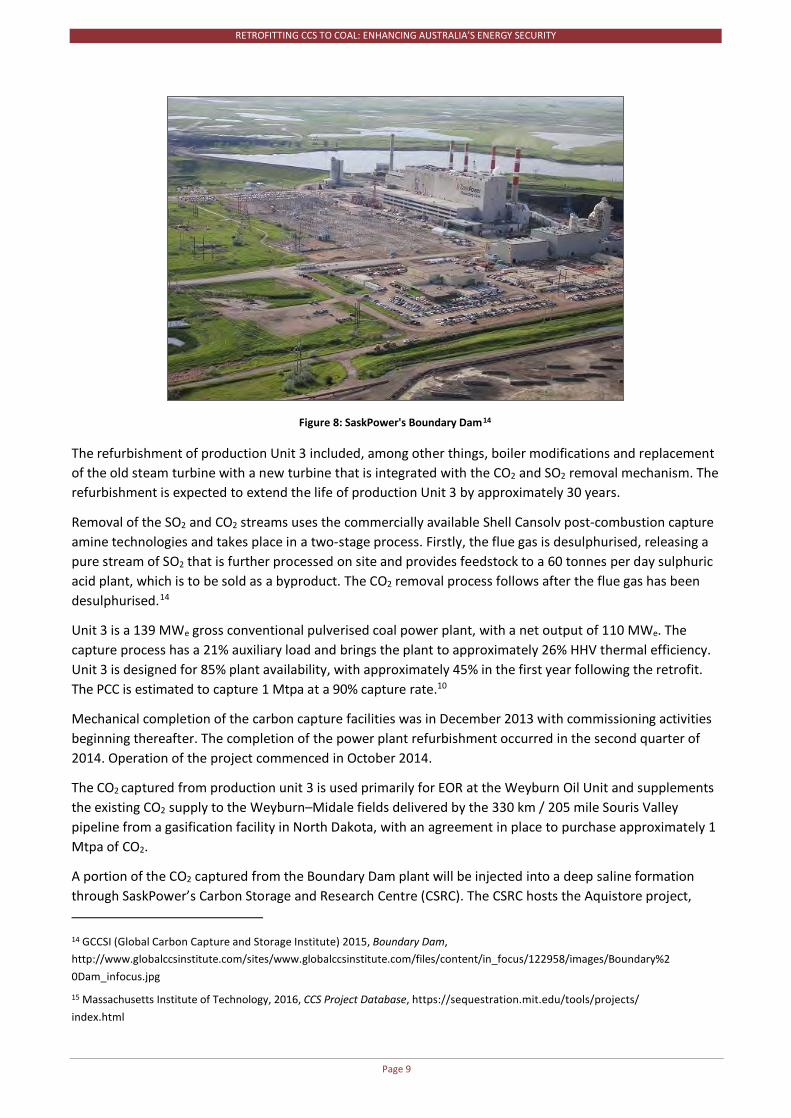
Table 2 shows the total plant cost on a $/kWe basis for various brown coal retrofit scenarios, alongside the costs of a new build super critical plant with and without PCC. All the retrofit cases assume wet cooling is available and that its existing pulverised coal base plant without capture is a fully paid-off asset, in good condition with a suitably long life. Unlike Boundary Dam,14 no base plant upgrades are included in this analysis.
Table 2: Brown Coal Post Combustion Capture Costs21
New Super Critical Brown Coal9
Brown Coal Retrofit
No PCC With PCC Base Case Advanced Solvent
Minimal FGD/SCR
Total plant cost (A$/kW sent out)
3,850 8,250 4,900 4,700 3,900
Fixed O&M (A$/kW-year) 55 65 70 65 60
Variable (A$/MWh) 3.0 12 14 14 12
Efficiency (% HHV) 36 25 -11.5 -9.5 -9.5
The base case PCC brown coal retrofit case is a fully integrated MEA solvent facility. The gross power output drops significantly as a result of the considerable portion of steam generation diverted to the capture system. The auxiliary load also increases from the base plant due to the demands of the capture system, including solvent pumps, booster fans, and CO2 compression trains.
The advanced solvent case benefits from an improvement in the solvents regeneration energy, and a resulting decrease in diverted steam and auxiliary loads. Although not proven at scale, EPRI believes these will be commercially available in the near term.9
The PCC brown coal studies used as a basis for this study are USA based.22 There is a marked difference in coal quality between the brown coal available in the USA and that available in the Latrobe Valley. Given the lower levels of sulphur in the Latrobe Valley in particular, it is likely that the resultant lower levels SOx and NOx in the flue gas may facilitate minimal FGD and SCR plant. This is reflected in the ‘minimal FGD/SCR’ case.
21 The design basis, capital cost estimating basis and cost of electricity (levelised cost of electricity or LCOE) methodologies are
consistent with those used in the Australian Power Generation Technology report.
22 EPRI 2012, A Summary of EPRI’s Pulveriszed Coal (PC) and Circulating Fluidized Bed (CFB) Post Combustion CO2 Capture Retrofit
Studies: The Five North American Plant Retrofit PCC Cases. EPRI, Palo Alto, CA: 2012.1026864.
RETROFITTING CCS TO COAL: ENHANCING AUSTRALIA’S ENERGY SECURITY
Page 13
3.2. Brown Coal PCC Retrofit Cost of Electricity
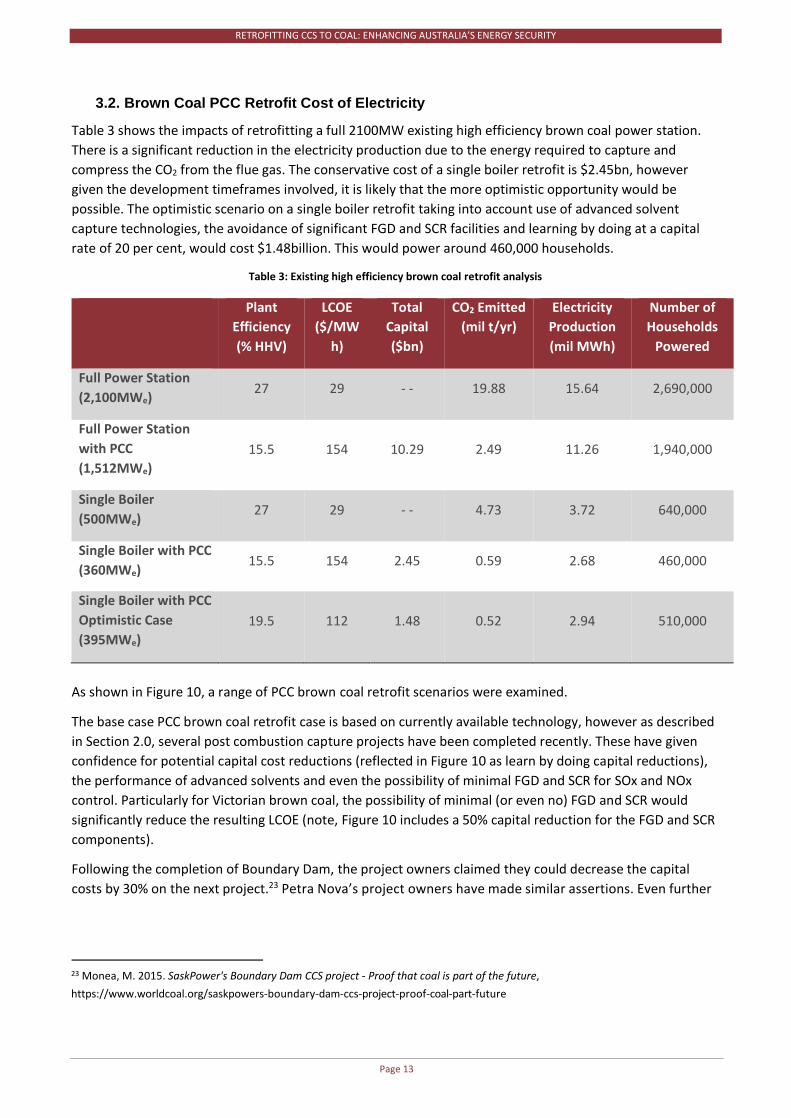
Table 3 shows the impacts of retrofitting a full 2100MW existing high efficiency brown coal power station. There is a significant reduction in the electricity production due to the energy required to capture and compress the CO2 from the flue gas. The conservative cost of a single boiler retrofit is $2.45bn, however given the development timeframes involved, it is likely that the more optimistic opportunity would be possible. The optimistic scenario on a single boiler retrofit taking into account use of advanced solvent capture technologies, the avoidance of significant FGD and SCR facilities and learning by doing at a capital rate of 20 per cent, would cost $1.48billion. This would power around 460,000 households.
Table 3: Existing high efficiency brown coal retrofit analysis
Plant Efficiency (% HHV)
LCOE ($/MW
h)
Total Capital ($bn)
CO2 Emitted (mil t/yr)
Electricity Production (mil MWh)
Number of Households
Powered
Full Power Station (2,100MWe) 27 29 - - 19.88 15.64 2,690,000
Full Power Station with PCC (1,512MWe)
15.5 154 10.29 2.49 11.26 1,940,000
Single Boiler (500MWe) 27 29 - - 4.73 3.72 640,000
Single Boiler with PCC (360MWe)
15.5 154 2.45 0.59 2.68 460,000
Single Boiler with PCC Optimistic Case (395MWe)
19.5 112 1.48 0.52 2.94 510,000
As shown in Figure 10, a range of PCC brown coal retrofit scenarios were examined.
The base case PCC brown coal retrofit case is based on currently available technology, however as described in Section 2.0, several post combustion capture projects have been completed recently. These have given confidence for potential capital cost reductions (reflected in Figure 10 as learn by doing capital reductions), the performance of advanced solvents and even the possibility of minimal FGD and SCR for SOx and NOx control. Particularly for Victorian brown coal, the possibility of minimal (or even no) FGD and SCR would significantly reduce the resulting LCOE (note, Figure 10 includes a 50% capital reduction for the FGD and SCR components).
Following the completion of Boundary Dam, the project owners claimed they could decrease the capital costs by 30% on the next project.23 Petra Nova’s project owners have made similar assertions. Even further
23 Monea, M. 2015. SaskPower's Boundary Dam CCS project - Proof that coal is part of the future, https://www.worldcoal.org/saskpowers-boundary-dam-ccs-project-proof-coal-part-future

RETROFITTING CCS TO COAL: ENHANCING AUSTRALIA’S ENERGY SECURITY
Page 14
reductions could be achieved though advanced solvents that reduce the need for FDG and SCR facilities.24 Considering the cost escalations when converting US studies to Australian, a 20% reduction in capital cost is seen as best case to be achieved through these previous projects.
Given the development likely timeframes involved in the funding, design and permitting of a PCC retrofit, it is likely that the more optimistic retrofit opportunity would be likely. The optimistic scenario on a single boiler retrofit is derived by taking into account use of advanced solvent capture technologies, the avoidance of significant FGD and SCR facilities (based on the low sulphur in Victorian brown coal) and learning by doing at a capital rate of 20 per cent.
Figure 10: A brown coal LCOE comparison of potential PCC improvements
24 EPRI 2017, 2017 Research Portfolio: CO2 Capture, Utilisation and Storage, www.epri.com/Our-Portfolio/Pages/Portfolio.aspx?program=062055
RETROFITTING CCS TO COAL: ENHANCING AUSTRALIA’S ENERGY SECURITY
Page 15
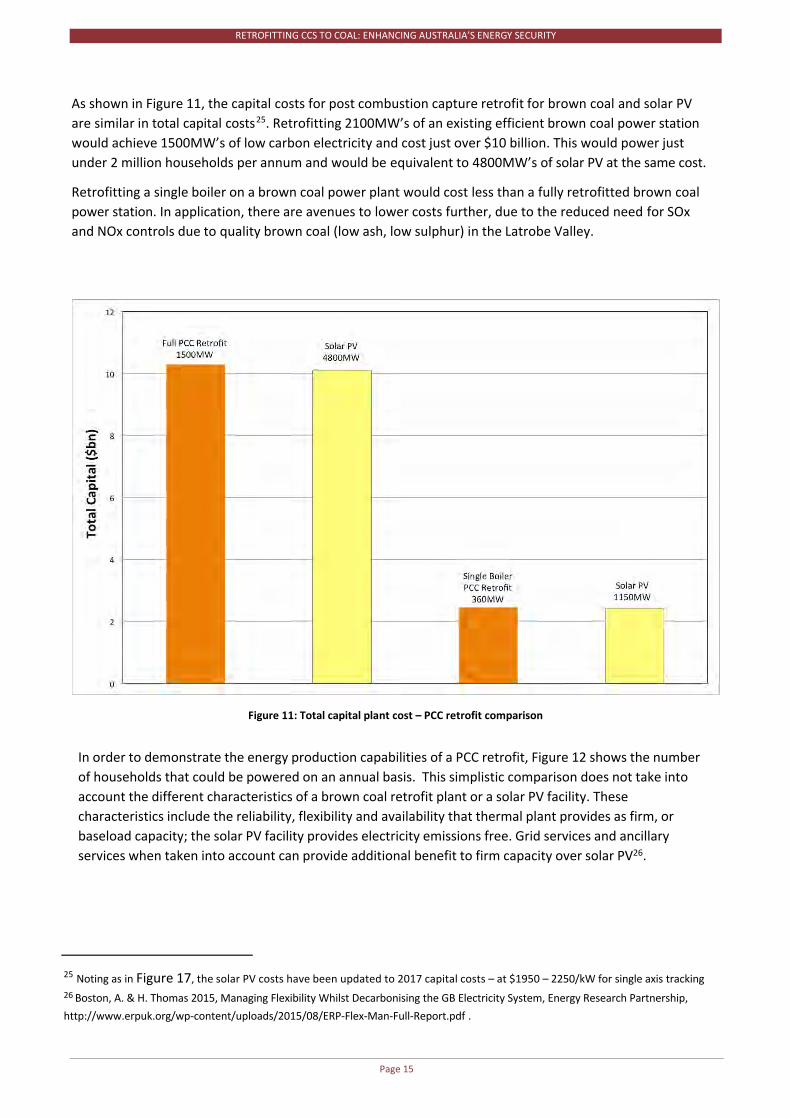
As shown in Figure 11, the capital costs for post combustion capture retrofit for brown coal and solar PV are similar in total capital costs25. Retrofitting 2100MW’s of an existing efficient brown coal power station would achieve 1500MW’s of low carbon electricity and cost just over $10 billion. This would power just under 2 million households per annum and would be equivalent to 4800MW’s of solar PV at the same cost.
Retrofitting a single boiler on a brown coal power plant would cost less than a fully retrofitted brown coal power station. In application, there are avenues to lower costs further, due to the reduced need for SOx and NOx controls due to quality brown coal (low ash, low sulphur) in the Latrobe Valley.
Figure 11: Total capital plant cost – PCC retrofit comparison
25 Noting as in Figure 17, the solar PV costs have been updated to 2017 capital costs – at $1950 – 2250/kW for single axis tracking 26 Boston, A. & H. Thomas 2015, Managing Flexibility Whilst Decarbonising the GB Electricity System, Energy Research Partnership, http://www.erpuk.org/wp-content/uploads/2015/08/ERP-Flex-Man-Full-Report.pdf .
In order to demonstrate the energy production capabilities of a PCC retrofit, Figure 12 shows the number of households that could be powered on an annual basis. This simplistic comparison does not take into account the different characteristics of a brown coal retrofit plant or a solar PV facility. These characteristics include the reliability, flexibility and availability that thermal plant provides as firm, or baseload capacity; the solar PV facility provides electricity emissions free. Grid services and ancillary services when taken into account can provide additional benefit to firm capacity over solar PV26.

RETROFITTING CCS TO COAL: ENHANCING AUSTRALIA’S ENERGY SECURITY
Page 16
Figure 12: Household power supplied (yearly basis) after a PCC retrofit
3.3. Black Coal PCC Retrofit Cost and Performance
Table 4 shows the total plant cost on a $/kWe basis for black coal retrofit base case and advanced solvent scenarios, alongside the costs of a new build ultra supercritical plant with and without PCC. All the retrofit cases assume wet cooling is available and that its existing pulverised coal base plant without capture is a fully paid-off asset, in good condition with a suitably long life. Unlike Boundary Dam,14 no base plant upgrades are included in this analysis.
Table 4: Black Coal Post Combustion Capture Costs27
New Ultra Super Critical Black Coal
Black Coal Retrofit
No PCC With PCC Base Case Advanced Solvent
Total plant cost (A$/kW sent out)
3,100 7,000 4,100 3,860
Fixed O&M (A$/kW-year) 45 55 75 70
Variable (A$/MWh) 2.5 9 11 11
Efficiency (% HHV) 41 30 24.7 26.7
27 The design basis, capital cost estimating basis and cost of electricity (levelised cost of electricity or LCOE) methodologies are
consistent with those used in the Australian Power Generation Technology report.
RETROFITTING CCS TO COAL: ENHANCING AUSTRALIA’S ENERGY SECURITY
Page 17
The base case PCC black coal retrofit case is a fully integrated MEA solvent facility. Like the brown coal retrofit scenario, the gross power output drops and auxiliary load increases as a result of the requirements of the capture system.
The advanced solvent case benefits from an improvement in the solvents regeneration energy, and a resulting decrease in diverted steam and auxiliary loads. Although not proven at scale, EPRI believes these will be commercially available in the near term.9
3.4. Black Coal PCC Retrofit Cost of Electricity
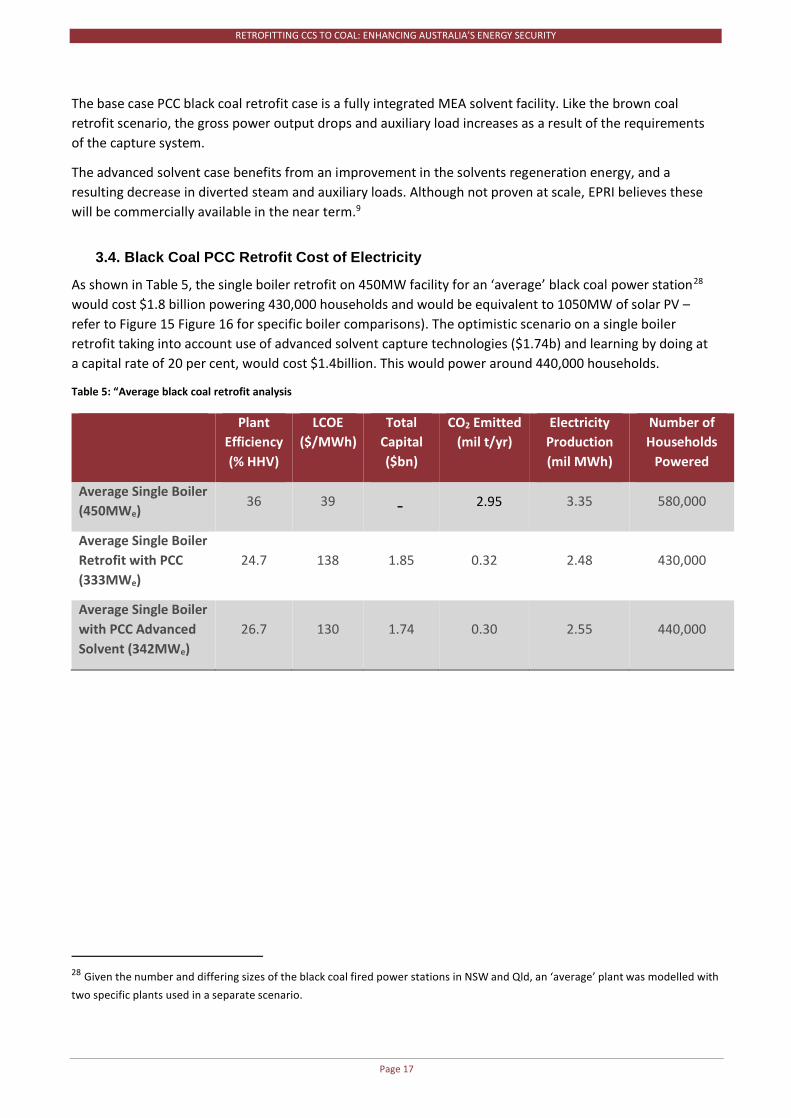
As shown in Table 5, the single boiler retrofit on 450MW facility for an ‘average’ black coal power station28 would cost $1.8 billion powering 430,000 households and would be equivalent to 1050MW of solar PV – refer to Figure 15 Figure 16 for specific boiler comparisons). The optimistic scenario on a single boiler retrofit taking into account use of advanced solvent capture technologies ($1.74b) and learning by doing at a capital rate of 20 per cent, would cost $1.4billion. This would power around 440,000 households.
Table 5: “Average black coal retrofit analysis
Plant Efficiency (% HHV)
LCOE ($/MWh)
Total Capital ($bn)
CO2 Emitted (mil t/yr)
Electricity Production (mil MWh)
Number of Households
Powered
Average Single Boiler (450MWe)
36 39 3.35 580,000
Average Single Boiler Retrofit with PCC (333MWe)
24.7 138 1.85 0.32 2.48 430,000
Average Single Boiler with PCC Advanced Solvent (342MWe)
26.7 130 1.74 0.30 2.55 440,000
28 Given the number and differing sizes of the black coal fired power stations in NSW and Qld, an ‘average’ plant was modelled withtwo specific plants used in a separate scenario.
- 2.95

RETROFITTING CCS TO COAL: ENHANCING AUSTRALIA’S ENERGY SECURITY
Page 18
Figure 13: An LCOE comparison a new build and retrofit black coal plant.
Figure 14: An LCOE comparison of potential PCC improvements on an ‘average’ black coal plant.

RETROFITTING CCS TO COAL: ENHANCING AUSTRALIA’S ENERGY SECURITY
Page 19
Looking a scenario specific to two existing plants, Table 6, Figure 15 and Figure 16 show the impacts of a PCC retrofit, compared with existing plant, on two typical black coal boilers in Queensland and New South Wales. The individual efficiency impacts are the same, however, due to the different sizes of the two boilers, the total capital cost varies significantly ($1.72bn for a 420MW Queensland boiler, compared with the larger 660MW boiler in New South Wales at $2.71bn). It should be noted however, that given the development timeframes involved, it is likely that a more optimistic opportunity would be possible.
Table 6: Existing high efficiency black coal retrofit analysis
Plant Efficiency (% HHV)
LCOE ($/MWh)
Total Capital ($bn)
CO2 Emitted (mil t/yr)
Electricity Production (mil MWh)
Number of Households
Powered
Single Boiler North QLD (420MWe)
38 37 - - 5.21 3.13 540,000
Single Boiler North QLD with PCC (311MWe)
26.7 134 1.72 0.27 2.31 400,000
Single Boiler NSW (660MWe)
37 38 - - 4.21 4.91 840,000
Single Boiler NSW with PCC (488MWe)
25.7 136 2.71 0.45 3.64 630,000
Figure 15: Total capital plant cost – PCC retrofit comparison for single boilers in NSW and Qld
RETROFITTING CCS TO COAL: ENHANCING AUSTRALIA’S ENERGY SECURITY
Page 20
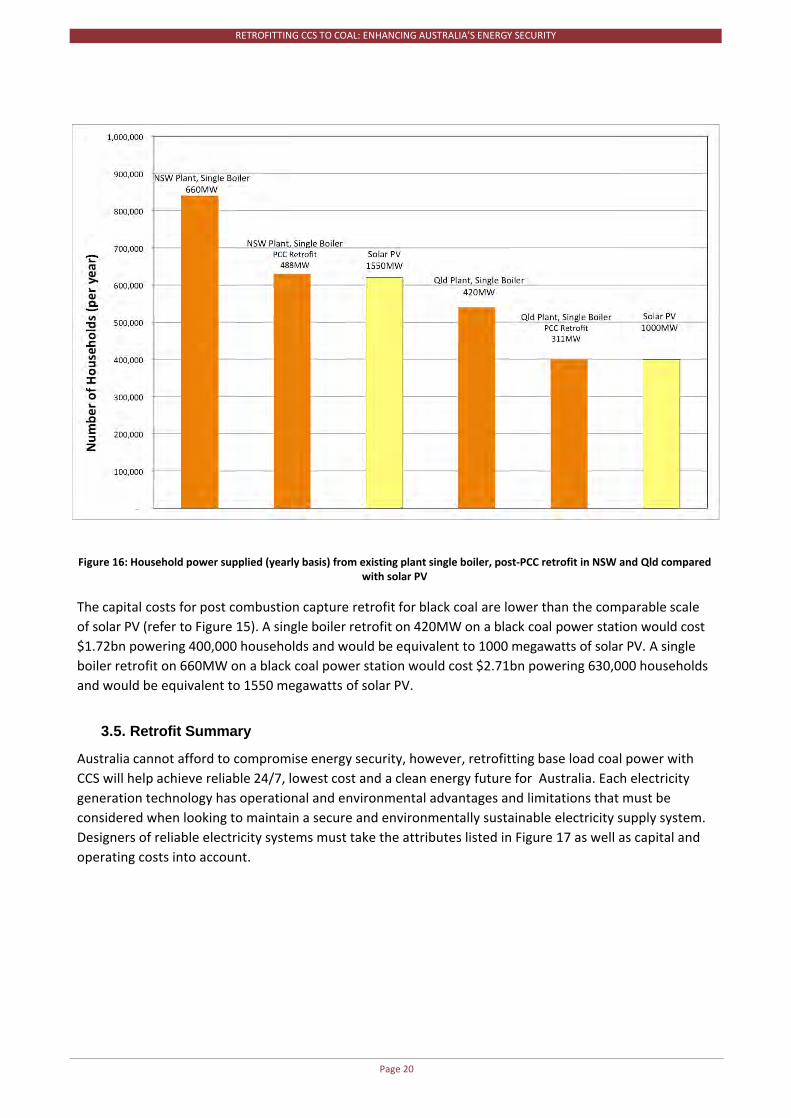
Figure 16: Household power supplied (yearly basis) from existing plant single boiler, post-PCC retrofit in NSW and Qld compared with solar PV
The capital costs for post combustion capture retrofit for black coal are lower than the comparable scale of solar PV (refer to Figure 15). A single boiler retrofit on 420MW on a black coal power station would cost $1.72bn powering 400,000 households and would be equivalent to 1000 megawatts of solar PV. A single boiler retrofit on 660MW on a black coal power station would cost $2.71bn powering 630,000 households and would be equivalent to 1550 megawatts of solar PV.
3.5. Retrofit Summary
Australia cannot afford to compromise energy security, however, retrofitting base load coal power with CCS will help achieve reliable 24/7, lowest cost and a clean energy future for Australia. Each electricity generation technology has operational and environmental advantages and limitations that must be considered when looking to maintain a secure and environmentally sustainable electricity supply system. Designers of reliable electricity systems must take the attributes listed in Figure 17 as well as capital and operating costs into account.

RETROFITTING CCS TO COAL: ENHANCING AUSTRALIA’S ENERGY SECURITY
Page 21
Figure 17: Electricity technology comparisons29
While including the cost of transport and storage into the cost estimates, this report has exclusively discussed the capture component of CCS. For more detail on transport and storage, see Appendix 1, taken from the APGT Report 2015.
In this report we have endeavored to establish quality data for the retrofit of Victorian brown coal power stations and adapt the APGT2 data to various black coal scenarios. Undoubtedly however, the most accurate way to generate retrofit cost and performance numbers is to undertake individual studies on existing Australian full-size plants by engineering companies (this was the approach EPRI took in its North American studies, using an engineering team from Nexant and Bechtel).2
29 Based on the APGT 2015.

RETROFITTING CCS TO COAL: ENHANCING AUSTRALIA’S ENERGY SECURITY
Page 22
Appendix 1 – CO2 Transport and Storage Case Studies This report has been adapted from the Australian Power Generation Technology Report 2015.9
The authors of this chapter are Professor Dianne Wiley, Dr Peter Neal, Dr Minh Ho and Dr Gustavo Fimbres Weihs from UNSW Engineering.
The authors thank CarbonNet, Coal Innovation NSW, CTSCo, the Western Australian Department of Mines and Petroleum and Dr Charles Jenkins for invaluable input to this chapter. They also thank Anggit Raksajati and Zikai Wang for assistance with calculations.
Introduction
This chapter provides estimates of the costs of CO2 transport and injection for a selection of possible projects in Australia, as developed in conjunction with stakeholders. As this is a scoping study, the design of the projects has not been evaluated or optimised in detail, as would be required for a full feasibility study. The costs presented are total plant costs and do not reflect the total project costs, which include additional owner’s and contingency costs for proving up storage sites, undertaking the required front-end engineering and obtaining project approvals (see Chapter 17 of the APGT Report 2015 for more details on this). The total project costs may also include extra risk-adjusted costs.
The emission sources are assumed to be hubs where high-purity CO2 has been collected from power plants and compressed to a maximum of 15 MPa ready for introduction to the pipeline for transport. The cost estimates therefore exclude the costs of CO2 capture and compression.
Source hubs and storage sites included in this evaluation are listed in Table 7, while Figure 18 and Figure 19 show maps of the sources, the approximate pipeline routes and the storage sites for the east and west coasts, respectively.
CO2 transport and storage case studies—highlights:
• The total plant cost (excluding owner’s and risk-adjusted costs) for CO2 transport, injection andmonitoring is likely:
o to vary between $5/t and 14/t injected for cases involving short transport distances tostorage formations with good characteristics
o to approach $70/t injected for cases involving transporting small volumes of CO2 overlong distances to storage formations with poorer characteristics.
• Variations in injection performance and materials costs can have a significant impact on costs.By optimising capture, transport and injection together, it may be possible to achieve lowercosts.
• Depending on the split between injection and transport costs, projects may be more sensitiveto geological or economic uncertainties.

RETROFITTING CCS TO COAL: ENHANCING AUSTRALIA’S ENERGY SECURITY
Page 23
Chapter 21 of the APGT Report 2015 provides the data used for the case studies, including source hub locations and the flow-rate of CO2 to be injected in Mt/y, storage site characteristics and lengths of onshore and offshore transport pipelines. For most storage sites, a number of different injection horizons have been evaluated. The cases consider both transporting from a single hub to a single storage site (single-source cases) and combining CO2 from two hubs before injection (multiple-source cases). In the multiple-source cases, the performance and cost calculations cover taking CO2 from the two sources to a junction point and then from the junction point to the storage site.
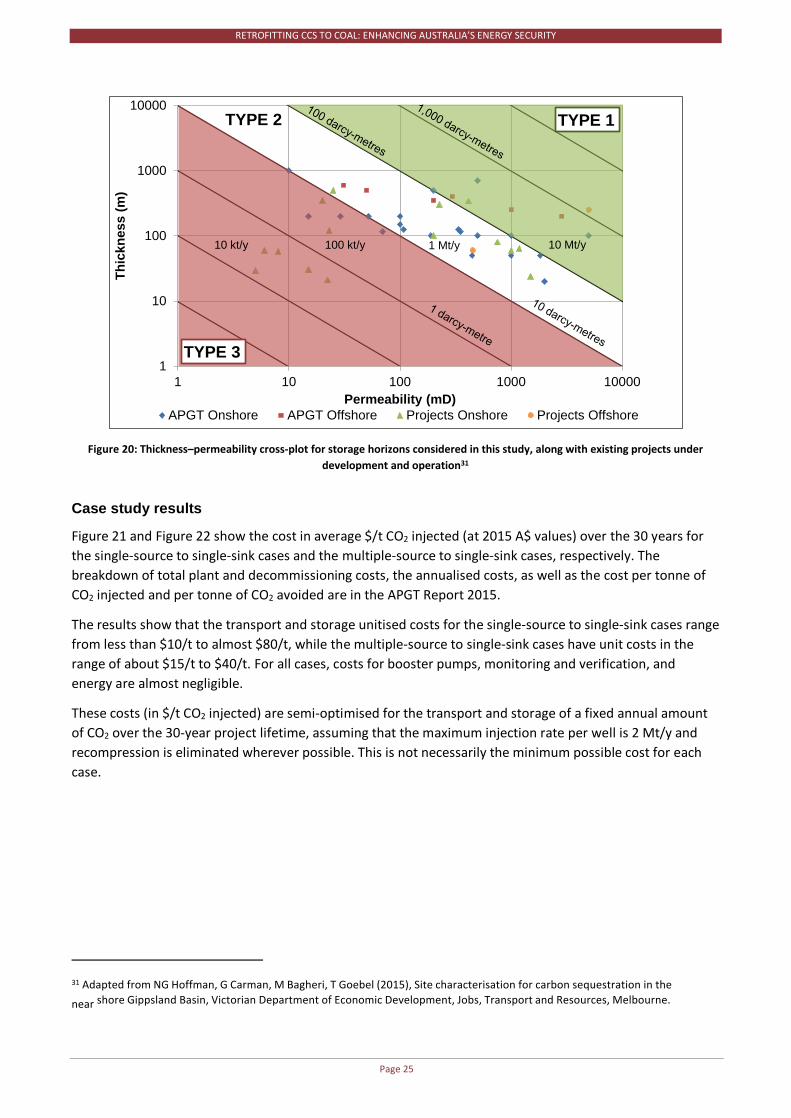
Figure 20 plots the permeability and thickness of the storage sites considered in this study, along with data from various existing storage projects. This plot estimates the expected injectivities and has been proposed as a screening tool for storage sites30. The figure is divided according to the product of permeability and thickness into three regions:
Type 1 sites have very high injectivities (greater than 10 Mt/y per well).
Type 2 site have injectivities in the order of 1 Mt/y per well.
Type 3 sites have injectivities less than 1 Mt/y per well.
The figure indicates that almost all of the storage sites considered are in the Type 1 or 2 regions. However, as discussed in Section 10.3.2 of the APGT Report 2015, consideration must also be given to parameters such as formation pressure, fracture pressure, porosity and areal extent before determining a final estimate of injectivity.
Table 7: Source hubs and storage sites for case studies
SOURCE HUBS STORAGE SITES
Latrobe Valley, Victoria Gippsland
(nearshore, intermediate and basin centre)
East Victoria Surat
(shallow, mid-depth and deep) South Qld
(East Surat) Eromanga
(shallow, mid-depth and deep) North Qld
(Gladstone–Rockhampton) Galilee
(shallow, mid-depth and deep)
North NSW (Hunter Valley–Newcastle)
Darling (Pondie Range average core and average
mini-DST) South NSW
(NSW West–Lithgow) Cooper
(shallow, mid-depth and deep) Southwest WA
(Collie) North Perth Offshore
(shallow, mid-depth and deep)
Kwinana WA North Perth Onshore
(shallow, mid-depth and deep) Lesueur Sandstone
(shallow, mid-depth and deep)
30 N Hoffman, G Carman, M Bagheri, T Goebel (2015), Site characterisation for carbon sequestration in the near shore Gippsland
Basin, Victorian Department of Economic Development, Jobs, Transport and Resources, Melbourne, Australia.

RETROFITTING CCS TO COAL: ENHANCING AUSTRALIA’S ENERGY SECURITY
Page 24
Figure 18: East coast emissions, storage basins and pipelines evaluated
Figure 19: West coast emissions, storage basins and pipelines evaluated
The blue bars show indicative locations for the emissions hubs. The height of the bar indicates the emission size.
The red arrows show indicative locations for storage sites. The length of the arrow indicates the depth of the formation; the width of the arrow indicates the thickness of the formation; and the intensity of colour indicates the permeability.
The blue bars show indicative locations for the emission hubs. The height of the bar indicates the emission size.
The red arrows show indicative locations for storage sites. The length of the arrow indicates the depth of the formation; the width of the arrow indicates the thickness of the formation; and the intensity of colour indicates the permeability.
RETROFITTING CCS TO COAL: ENHANCING AUSTRALIA’S ENERGY SECURITY
Page 25
Figure 20: Thickness–permeability cross-plot for storage horizons considered in this study, along with existing projects under development and operation31
Case study results
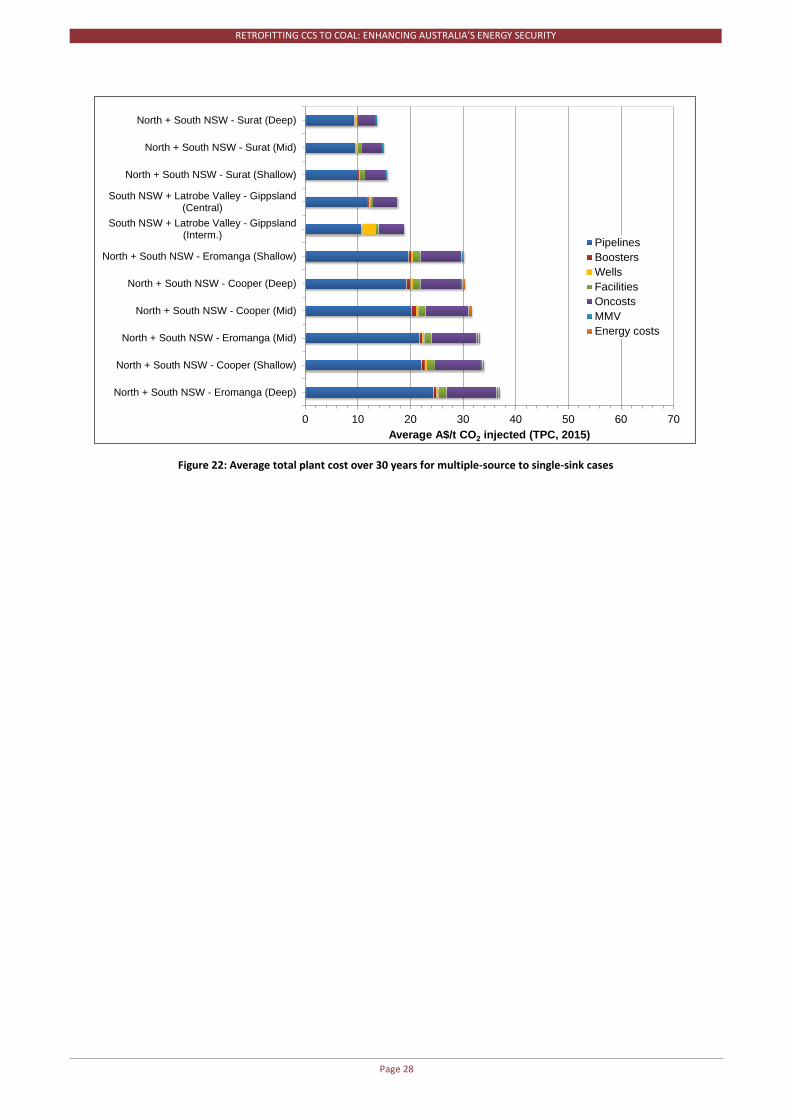
Figure 21 and Figure 22 show the cost in average $/t CO2 injected (at 2015 A$ values) over the 30 years for the single-source to single-sink cases and the multiple-source to single-sink cases, respectively. The breakdown of total plant and decommissioning costs, the annualised costs, as well as the cost per tonne of CO2 injected and per tonne of CO2 avoided are in the APGT Report 2015.
The results show that the transport and storage unitised costs for the single-source to single-sink cases range from less than $10/t to almost $80/t, while the multiple-source to single-sink cases have unit costs in the range of about $15/t to $40/t. For all cases, costs for booster pumps, monitoring and verification, and energy are almost negligible.
These costs (in $/t CO2 injected) are semi-optimised for the transport and storage of a fixed annual amount of CO2 over the 30-year project lifetime, assuming that the maximum injection rate per well is 2 Mt/y and recompression is eliminated wherever possible. This is not necessarily the minimum possible cost for each case.
31 Adapted from NG Hoffman, G Carman, M Bagheri, T Goebel (2015), Site characterisation for carbon sequestration in the
near shore Gippsland Basin, Victorian Department of Economic Development, Jobs, Transport and Resources, Melbourne.
1
10
100
1000
10000
1 10 100 1000 10000
Thic
knes
s (m
)
Permeability (mD)APGT Onshore APGT Offshore Projects Onshore Projects Offshore
TYPE 3
TYPE 2 TYPE 1
100 kt/y10 kt/y 1 Mt/y 10 Mt/y

RETROFITTING CCS TO COAL: ENHANCING AUSTRALIA’S ENERGY SECURITY
Page 26
Figure 21: Average total plant cost over 30 years for single-source to single-sink cases
0 10 20 30 40 50 60 70
South NSW - Gippsland (Central)South Qld - Eromanga (Mid)
South Qld - Eromanga (Deep)North Qld-Eromanga (Deep)
South Qld - Eromanga (Shallow)North Qld - Eromanga (Mid)
Southwest WA - North Perth Offshore (Shallow)South NSW - Gippsland (Intermediate)
Southwest WA - North Perth Offshore (Deep)North Qld - Eromanga (Shallow)
South NSW - Gippsland (Nearshore)Southwest WA - North Perth Offshore (Mid)
South NSW - Darling PR DST CoreEast Gippsland - Gippsland (Central)
North Qld - Galilee (Deep)Southwest WA - North Perth Onshore (Mid)
Southwest WA - North Perth Onshore (Deep)Southwest WA - North Perth Onshore (Shallow)
East Gippsland - Gippsland (Intermedidate)Latrobe V. (1) - Gippsland (Nearshore)
North NSW - Darling PR DST Avg.North Qld - Galilee (Mid)
North NSW - Surat (Deep)South NSW - Darling PR DST Avg.
North NSW - Surat (Shallow)North NSW - Surat (Mid)
East Gippsland - Gippsland (Nearshore)South Qld (4) Far - Surat (Deep)
Latrobe V. (10) - Gippsland (Central)South Qld (4) Far - Surat (Mid)
South Qld (4) Far - Surat (Shallow)Latrobe V. (15) - Gippsland (Central)
South Qld (4) Close - Surat (Deep)South Qld (4) Close - Surat (Mid)
South Qld (4) Close - Surat (Shallow)Latrobe V. (20) - Gippsland (Central)
Latrobe V. (10) - Gippsland (Intermediate)Latrobe V. (5) - Gippsland (Nearshore)
South Qld (18) Far - Surat (Deep)South Qld (18) Far - Surat (Mid)
Latrobe V. (10) - Gippsland (Nearshore)South Qld (18) Close - Surat (Deep)
South Qld (18) Close - Surat (Mid)South Qld (18) Close - Surat (Shallow)
South Qld (18) Far - Surat (Shallow)Southwest WA - Lesueur (Deep)
Kwinana - Lesueur (Deep)Southwest WA - Lesueur (Mid)
Southwest WA - Lesueur (Shallow)Kwinana - Lesueur (Mid)
Kwinana - Lesueur (Shallow)
Average A$/t CO2 injected (TPC, 2015)
Pipelines
Boosters
Wells
Facilities
Oncosts
MMV
Energy costs

RETROFITTING CCS TO COAL: ENHANCING AUSTRALIA’S ENERGY SECURITY
Page 27
The case studies with the lowest unit costs (less than $15/t) involve taking CO2 from the Latrobe Valley to the nearshore Gippsland Basin, from south Queensland to the Surat Basin and from Kwinana or south-west Western Australia to the Lesueur Basin (assuming the residual trapping mechanism proposed for this basin can contain the CO2). These cases have low transport costs due to the short distances involved, coupled with low storage costs due to the high injectivity of the formations at the required injection rates of 5–10 Mt/y. Reducing the injection rate to 1 Mt/y for the Latrobe Valley–Gippsland (nearshore) case more than doubles the unit cost of transport and storage.
The most expensive cases (more than $40/t) generally involve very long transport distances and storage in formations with moderate injectivities. These cases include transporting from north Queensland, south Queensland or north New South Wales to the Eromanga Basin and from south-west Western Australia to the North Perth Basin.
For north Queensland, the mid-depth of the Galilee Basin gives the lowest unit cost ($21/t).
For south Queensland, the shallow horizon in the Surat Basin gives the lowest unit cost ($5/t), while for north New South Wales the mid-depth option is the best match ($20/t). Both of these options combine relatively short transport distances and good formation properties. The reason the mid-depth horizon provides a better match for north New South Wales than the shallow horizon is because the greater depth allows for higher injection pressures to accommodate the higher flow-rate from north New South Wales.
For south New South Wales, the Darling site has the lowest unit cost (about $20/t based on the DST average value or nearly $34/t based on the core average), reflecting the high permeability and large injection pressure differential for the formation. When all the emissions from New South Wales are combined, the lowest unit cost ($14/t) is for injection into the deep horizon of the Surat Basin. When the emissions from south New South Wales are combined with those from the Latrobe Valley, the Central Gippsland Basin’s higher formation thickness, large areal extent and greater injection depth make it the most attractive horizon at a unit cost of about $18/t.
For the Perth region (south-west Western Australia and Kwinana), the lowest unit cost option in the Lesueur Sandstone is for the mid-depth horizon ($2–3/t). However, there is still work needed to demonstrate that the residual trapping mechanism proposed for the Lesueur can contain the CO2.
RETROFITTING CCS TO COAL: ENHANCING AUSTRALIA’S ENERGY SECURITY
Page 28
Figure 22: Average total plant cost over 30 years for multiple-source to single-sink cases
0 10 20 30 40 50 60 70
North + South NSW - Eromanga (Deep)
North + South NSW - Cooper (Shallow)
North + South NSW - Eromanga (Mid)
North + South NSW - Cooper (Mid)
North + South NSW - Cooper (Deep)
North + South NSW - Eromanga (Shallow)
South NSW + Latrobe Valley - Gippsland(Interm.)
South NSW + Latrobe Valley - Gippsland(Central)
North + South NSW - Surat (Shallow)
North + South NSW - Surat (Mid)
North + South NSW - Surat (Deep)
Average A$/t CO2 injected (TPC, 2015)
PipelinesBoostersWellsFacilitiesOncostsMMVEnergy costs

RETROFITTING CCS TO COAL: ENHANCING AUSTRALIA’S ENERGY SECURITY
Page 29
Figure 23: Average total plant cost over 30 years for all case studies
0 10 20 30 40 50 60 70
South NSW - Gippsland (Central)South Qld - Eromanga (Mid)
South Qld - Eromanga (Deep)North Qld-Eromanga (Deep)
South Qld - Eromanga (Shallow)North Qld - Eromanga (Mid)
South NSW - Gippsland (Interm.)Southwest WA - Nth Perth Offshore…
North Qld - Eromanga (Shallow)North + South NSW - Eromanga…
Southwest WA - Nth Perth Offshore…South NSW - Gippsland (Nearshore)Southwest WA - Nth Perth Offshore…
North + South NSW - Cooper…South NSW - Darling PR Core
East Gippsland - Gippsland (Central)North + South NSW - Eromanga (Mid)
North Qld - Galilee (Deep)North + South NSW - Cooper (Mid)Southwest WA - Nth Perth Onshore…
North + South NSW - Cooper (Deep)North + South NSW - Eromanga…
Southwest WA - Nth Perth Onshore…Southwest WA - Nth Perth Onshore…
Latrobe V. (1) - Gippsland (Nearshore)East Gippsland - Gippsland (Interm.)
North NSW - Darling PR DST Avg.North Qld - Galilee (Mid)
North NSW - Surat (Shallow)North NSW - Surat (Deep)
South NSW - Darling PR DST Avg.North NSW - Surat (Mid)
East Gippsland - Gippsland…South NSW + Latrobe Valley -…South NSW + Latrobe Valley -…
North + South NSW - Surat (Shallow)North + South NSW - Surat (Mid)South Qld (4) Far - Surat (Deep)
North + South NSW - Surat (Deep)Latrobe V. (10) - Gippsland (Central)
South Qld (4) Far - Surat (Mid)South Qld (4) Far - Surat (Shallow)
Latrobe V. (15) - Gippsland (Central)South Qld (4) Close - Surat (Deep)
South Qld (4) Close - Surat (Mid)South Qld (4) Close - Surat (Shallow)
Latrobe V. (5) - Gippsland (Nearshore)Latrobe V. (20) - Gippsland (Central)Latrobe V. (10) - Gippsland (Interm.)
South Qld (18) Far - Surat (Deep)South Qld (18) Far - Surat (Mid)
Latrobe V. (10) - Gippsland…South Qld (18) Close - Surat (Deep)
South Qld (18) Close - Surat (Mid)South Qld (18) Close - Surat (Shallow)
South Qld (18) Far - Surat (Shallow)Southwest WA - Lesueur (Deep)
Southwest WA - Lesueur (Shallow)Kwinana - Lesueur (Deep)
Southwest WA - Lesueur (Mid)Kwinana - Lesueur (Shallow)
Kwinana - Lesueur (Mid)
Average A$/t CO2 injected (TPC, 2015)
PipelinesBoostersWellsFacilitiesOncostsMMVEnergy costs
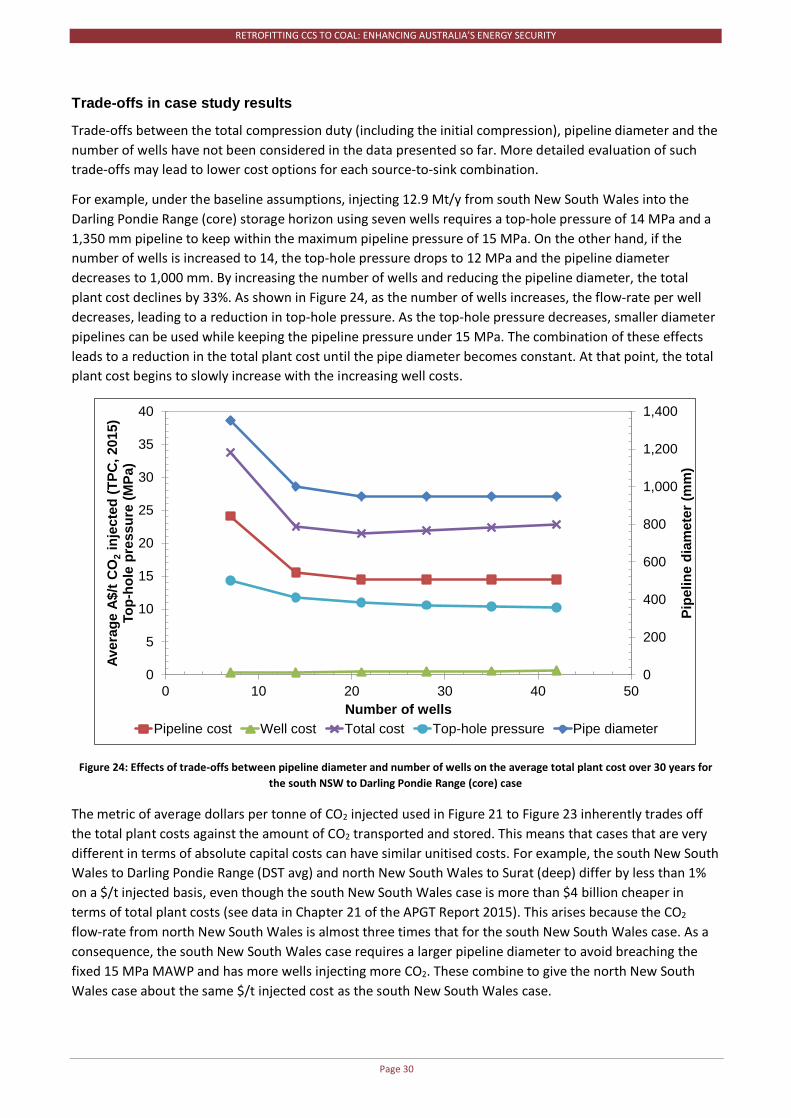
RETROFITTING CCS TO COAL: ENHANCING AUSTRALIA’S ENERGY SECURITY
Page 30
Trade-offs in case study results
Trade-offs between the total compression duty (including the initial compression), pipeline diameter and the number of wells have not been considered in the data presented so far. More detailed evaluation of such trade-offs may lead to lower cost options for each source-to-sink combination.
For example, under the baseline assumptions, injecting 12.9 Mt/y from south New South Wales into the Darling Pondie Range (core) storage horizon using seven wells requires a top-hole pressure of 14 MPa and a 1,350 mm pipeline to keep within the maximum pipeline pressure of 15 MPa. On the other hand, if the number of wells is increased to 14, the top-hole pressure drops to 12 MPa and the pipeline diameter decreases to 1,000 mm. By increasing the number of wells and reducing the pipeline diameter, the total plant cost declines by 33%. As shown in Figure 24, as the number of wells increases, the flow-rate per well decreases, leading to a reduction in top-hole pressure. As the top-hole pressure decreases, smaller diameter pipelines can be used while keeping the pipeline pressure under 15 MPa. The combination of these effects leads to a reduction in the total plant cost until the pipe diameter becomes constant. At that point, the total plant cost begins to slowly increase with the increasing well costs.
Figure 24: Effects of trade-offs between pipeline diameter and number of wells on the average total plant cost over 30 years for the south NSW to Darling Pondie Range (core) case
The metric of average dollars per tonne of CO2 injected used in Figure 21 to Figure 23 inherently trades off the total plant costs against the amount of CO2 transported and stored. This means that cases that are very different in terms of absolute capital costs can have similar unitised costs. For example, the south New South Wales to Darling Pondie Range (DST avg) and north New South Wales to Surat (deep) differ by less than 1% on a $/t injected basis, even though the south New South Wales case is more than $4 billion cheaper in terms of total plant costs (see data in Chapter 21 of the APGT Report 2015). This arises because the CO2 flow-rate from north New South Wales is almost three times that for the south New South Wales case. As a consequence, the south New South Wales case requires a larger pipeline diameter to avoid breaching the fixed 15 MPa MAWP and has more wells injecting more CO2. These combine to give the north New South Wales case about the same $/t injected cost as the south New South Wales case.
0
200
400
600
800
1,000
1,200
1,400
0
5
10
15
20
25
30
35
40
0 10 20 30 40 50Pi
pelin
e di
amet
er (m
m)
Aver
age
A$/t
CO
2in
ject
ed (T
PC, 2
015)
Top-
hole
pre
ssur
e (M
Pa)
Number of wellsPipeline cost Well cost Total cost Top-hole pressure Pipe diameter
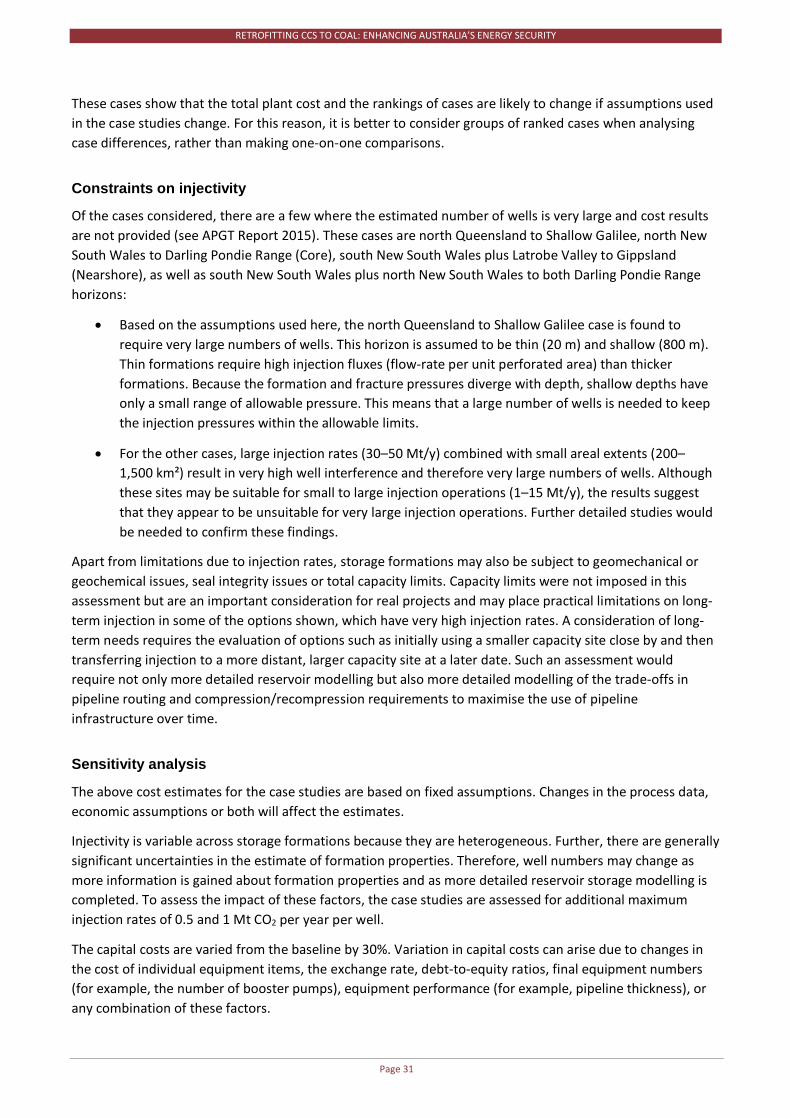
RETROFITTING CCS TO COAL: ENHANCING AUSTRALIA’S ENERGY SECURITY
Page 31
These cases show that the total plant cost and the rankings of cases are likely to change if assumptions used in the case studies change. For this reason, it is better to consider groups of ranked cases when analysing case differences, rather than making one-on-one comparisons.
Constraints on injectivity
Of the cases considered, there are a few where the estimated number of wells is very large and cost results are not provided (see APGT Report 2015). These cases are north Queensland to Shallow Galilee, north New South Wales to Darling Pondie Range (Core), south New South Wales plus Latrobe Valley to Gippsland (Nearshore), as well as south New South Wales plus north New South Wales to both Darling Pondie Range horizons:
• Based on the assumptions used here, the north Queensland to Shallow Galilee case is found torequire very large numbers of wells. This horizon is assumed to be thin (20 m) and shallow (800 m).Thin formations require high injection fluxes (flow-rate per unit perforated area) than thickerformations. Because the formation and fracture pressures diverge with depth, shallow depths haveonly a small range of allowable pressure. This means that a large number of wells is needed to keepthe injection pressures within the allowable limits.
• For the other cases, large injection rates (30–50 Mt/y) combined with small areal extents (200–1,500 km²) result in very high well interference and therefore very large numbers of wells. Althoughthese sites may be suitable for small to large injection operations (1–15 Mt/y), the results suggestthat they appear to be unsuitable for very large injection operations. Further detailed studies wouldbe needed to confirm these findings.
Apart from limitations due to injection rates, storage formations may also be subject to geomechanical or geochemical issues, seal integrity issues or total capacity limits. Capacity limits were not imposed in this assessment but are an important consideration for real projects and may place practical limitations on long-term injection in some of the options shown, which have very high injection rates. A consideration of long-term needs requires the evaluation of options such as initially using a smaller capacity site close by and then transferring injection to a more distant, larger capacity site at a later date. Such an assessment would require not only more detailed reservoir modelling but also more detailed modelling of the trade-offs in pipeline routing and compression/recompression requirements to maximise the use of pipeline infrastructure over time.
Sensitivity analysis
The above cost estimates for the case studies are based on fixed assumptions. Changes in the process data, economic assumptions or both will affect the estimates.
Injectivity is variable across storage formations because they are heterogeneous. Further, there are generally significant uncertainties in the estimate of formation properties. Therefore, well numbers may change as more information is gained about formation properties and as more detailed reservoir storage modelling is completed. To assess the impact of these factors, the case studies are assessed for additional maximum injection rates of 0.5 and 1 Mt CO2 per year per well.
The capital costs are varied from the baseline by 30%. Variation in capital costs can arise due to changes in the cost of individual equipment items, the exchange rate, debt-to-equity ratios, final equipment numbers (for example, the number of booster pumps), equipment performance (for example, pipeline thickness), or any combination of these factors.

RETROFITTING CCS TO COAL: ENHANCING AUSTRALIA’S ENERGY SECURITY
Page 32
The on-cost is varied from the baseline value of 40% of BEC. Values of 5% (representative of very mature technologies and project processes), 25% (representative of less mature technologies and project processes) and 60% (representative of increased contingency and project risk costs). The on-cost reflects the costs for engineering, management and construction in addition to the cost of the equipment. The baseline value of 40% represents the relatively immature stage of development of the CCS industry, despite the relatively mature stage of development of the underlying technology components. As the CCS industry matures, standard engineering design methods and management processes will emerge, and more suppliers, contractors and consultants are likely to enter the marketplace, so on-costs should decrease over time because of greater knowledge, experience and competitive market forces.
The results of the sensitivity analysis are shown in Figure 25 for the single-source to sink cases transporting CO2 from the Latrobe Valley to the Gippsland Basin and from north New South Wales to the Surat Basin (shallow, mid and deep).
The results indicate that, for the Gippsland Basin cases, the most sensitive factor is the number of wells. This can be attributed to the relatively low baseline number of wells and the relatively high cost of offshore wells. As shown in Figure 21, the cost of wells accounts for about a quarter of the total cost. These cases are therefore approximately one order of magnitude less sensitive to the effects of changes in capital costs and on-costs. On the other hand, the Surat Basin cases show greater sensitivity to the effect of changes in capital cost, followed by the effect of changes in on-costs. This is caused by the large relative component of pipeline costs in the total cost (the pipelines account for around half of the total cost) (Figure 21).
Figure 25: Changes in the average total plant cost over 30 years due to variations in the number of wells, capital costs and on-costs
Note: The diamonds represent the sensitivity values for changes in injection rate, the triangles for changes in capital cost and the circles for changes due to variations in on-costs. The open symbols show the baseline values for each case.
-
5
10
15
20
25
30
35
40
A$/t
CO
2in
ject
ed (T
PC, 2
015)
La Trobe Valley - Gippsland (Nearshore)
La Trobe Valley - Gippsland (Intermediate)
La Trobe Valley - Gippsland(Central)
North NSW -Surat (Mid)
North NSW - Surat(Deep)
North NSW -Surat (Shallow)
On-cost60%
5%
40%25%
Capex
- 30%
Injection rate(Mt/y/well)
2
1
0.5

RETROFITTING CCS TO COAL: ENHANCING AUSTRALIA’S ENERGY SECURITY
Page 33
Conclusions
The data for total plant costs show that cases that combine small transport distances with good injection properties are generally the cheapest. The most expensive practical cases involve large transport distances.
Some of the cases demonstrate that formations will have different maximum injection rates; as injection rates increase, the number of wells needed may become very large.
The sensitivity analysis shows that, depending on the split between injection and transport costs, projects may be more sensitive to geological or economic uncertainties.
The overall design of a transport and storage network needs to consider trade-offs in pipeline and injection design and operation, as well as the interaction with capture.

Level 1, 700 Swanston Street bldg. 290, The University of Melbourne Victoria 3010 Australia Corporate office: +61 3 8595 9600 www.co2crc.com.au
CO2CRC LIMITED ABN 56 117 183 516


