Annals of Work Exposures and Health, 2018, Vol. 62, No. 8, 1021–1032 doi: 10.1093/annweh/wxy064
Advance Access publication 17 July 2018 Original Article
Original Article
Retrospective Assessment of Respirable Quartz Exposure for a Silicosis Study of the Industrial Sand Industry Roy J. Rando1*, Pamela M. Vacek2, Robert E. Glenn3, Cheol Woong Kwon1
and John E. Parker4
1Tulane University, School of Public Health & Tropical Medicine, Department of Global Environmental Health Science, 1440 Canal St., New Orleans, LA 70112, USA; 2University of Vermont, Medical Biostatistics Unit, Larner College of Medicine, 105 Carrigan Drive Burlington, VT 05405, USA; 3Glenn Consulting Group, LLC, 2784 Little Creek Road, Seabrook Island, SC 29455, USA; 4West Virginia University, School of Medicine, Section of Pulmonary and Critical Care, 1 Stadium Drive, Morgantown, WV 26506, USA
*Author to whom correspondence should be addressed. Tel: +1 504 988 3870; fax: +1 504 988 1726; e-mail: [email protected]
Submitted 31 October 2017; revised 6 June 2018; editorial decision 11 June, 2018; revised version accepted 26 June 2018.
Abstract
Background: In 2016, the OSHA PEL for crystalline silica was reduced, renewing interest in evalu-ating risk of silicosis from occupational exposures. The industrial sand industry, which deals with high-purity quartz sands, is the setting for a current epidemiologic investigation of silicosis risk and progression. In support of that investigation, respirable quartz (RQ) exposures were retrospectively estimated for 67 workers with silicosis and 167 matched control workers from 21 industrial sand plants, in which some started work as early as 1929. Methods: A job exposure matrix (JEM) was constructed by integrating a modern (post-1970) RQ exposure database containing more than 40000 measurements with archival particle count exposure data from a 1947 survey. A simulation algorithm was used to develop a conversion factor to convert the archival particle count data into modern measures of RQ by randomly generating 100000 virtual dust particles of varying diameters corresponding to the size distributions of 14 archival particle size distribution samples. The equivalent respirable mass and particle counts of the virtual particles were calculated, totalled, and ratioed to derive the conversion factor. The JEM was integrated with individ-ual job histories to calculate average and cumulative exposure for each case and control. Multiple exposure estimates were derived for unprotected exposures as well as for exposures adjusted for estimated respiratory protective equipment use and effciency. Results: The mean of the count to respirable mass conversion factors derived from 14 archival par-ticle size samples was 157 µg m−3 per mppcf (SD: 42; range: 96–263) with no statistical difference across process areas (drying, screening, vibrating, binning, bulk loading, bagging), P = 0.29. The JEM demonstrated an industry-wide decrease in prevailing exposures to RQ of up to about 2 orders of
Dow
nloaded from https://academ
ic.oup.com/annw
eh/article-abstract/62/8/1021/5054738 by guest on 22 October 2018
1022 Annals of Work Exposures and Health, 2018, Vol. 62, No. 8
magnitude from the distant (1929) to the recent (2012) past. Unadjusted cumulative exposures for cases and controls were statistically different (P < 0.001) with respective medians (range) of 3764 µg m−3 year (221–25121) and 1595 µg m−3 year (0–16446). Adjustment of exposure for use of respiratory protection showed modest reductions in estimated exposure: median adjusted cumulative expo-sures assuming a protection factor of 5 were 86% and 77% of the unadjusted values for cases and controls, respectively. Conclusions: The industrial sand industry offers a unique setting for examination of silicosis risk because of the high silica content of industrial sand and a long history of radiographic silicosis sur-veillance of industry workers. However, the great majority of silicosis cases in this industry are found among former workers and are associated with exposures occurring in the distant past, which neces-sitates extensive retrospective exposure assessment and increases the likelihood of exposure mis-classifcation. Nonetheless, the estimated cumulative exposures for silicosis cases and controls in this work were signifcantly different, with the median cumulative exposure for cases being more than twice that of their matched controls.
The industrial sand industry produces commercial grade silica (quartz) sands and ground silica four for use in glass-making, foundries, paints and plastics, and oil and gas “fracking” operations. Industrial sands are extracted from deposits of sandstones or granular sands. Hard compact sandstones are mined by drilling and blasting operations to release sandstone boulders. These are sub-sequently reduced to manageable size by heavy mobile equipment in the quarry. The rocks are then transported to automated crushers in the processing plant. Soft fri-able sandstone is often hydraulically mined with high-pressure water cannon. Loose sand aggregates are extracted from deposits by power shovel or dredge.
The recovered granular sands may be wet processed to remove clays, calcite, iron, and other undesirable con-stituents, sometimes with size-separation through wet screening. The cleaned sand is then drained and dried. In the past, steam coil dryers were common; these were gradually replaced by rotary kiln and fuid bed dryers. Dried sand may be packaged directly or may be further size segregated through dry screening or air separation. In some plants, processed sand is pulverized in ball or rod mills to produce ground silica (silica four), which con-sists of very fne crystalline silica particles in size fractions down to 5 µm. Sand and silica four are bagged or bulk loaded into railcars, hopper cars, or trucks for shipment.
Industrial sands are characterized by very high con-tent of crystalline silica. Excessive exposure to airborne respirable silica particles can result in silicosis, a progres-sive fbrotic lung disease (ACGIH, 2010). Silica exposure has also been linked to an increase in risk of lung can-cer and kidney disease (Hughes et al., 2001; McDonald
et al., 2001; Steenland, 2001; McDonald et al., 2005) and the International Agency for Research on Cancer (IARC, 1997) has classifed crystalline silica as a human carcinogen. The OSHA Permissible Exposure Limit for respirable quartz (RQ) in general industry had been approximately equal to 100 µg m−3 since 1970 but was reduced to 50 µg/m3 in June 2016.
Most of the epidemiologic information on risk of silicosis, lung cancer and other diseases associated with workplace exposure to crystalline silica derives from retrospective mortality studies of workforces from the distant past when exposures were much higher than today, use of respiratory protective equipment was either nonexistent or ineffective, and exposure data was sparse, and prior to the 1970s, measured in outdated particle count concentrations. The industrial sand industry has been the setting for several such epidemiologic investi-gations, (Hughes et al., 2001; McDonald et al., 2001; Steenland and Sanderson, 2001; McDonald et al., 2005) and the work described herein was performed in support of a new examination of the radiographic prevalence and progression of silicosis among industrial sand work-ers dating back to 1929 (Vacek et al., 2018).
This study was approved by Solutions IRB, a pri-vate, fully accredited Institutional Review Board and by the Human Research Protections Offce/IRB of Tulane University.
Methods and materials
Data sources Two member companies of the National Industrial Sand Association (NISA) provided employee information,
Dow
nloaded from https://academ
ic.oup.com/annw
eh/article-abstract/62/8/1021/5054738 by guest on 22 October 2018
Annals of Work Exposures and Health, 2018, Vol. 62, No. 8 1023
chest radiographs, work histories, and exposure meas-urements used in this work and the companion epide-miologic study (Vacek et al., 2018). The initial study cohort included 1902 male production workers from 40 plants in 22 states. To identify silicosis cases, the latest chest X-ray for each worker was reviewed and classified by two or three NIOSH B readers using the ILO’s International Classification of Radiographs for Pneuomoconioses (International Labor Office, 2011). Films graded at a median profusion classifcation of 1/0 or greater were considered diagnostic of silicosis. Earlier flms for each silicosis case were then read to determine frst onset of silicosis. The initial cohort yielded 67 cases of radiographically diagnosed silicosis from 21 plants: 11 from Company A and 10 from Company B. The cases were matched with two to three controls each, randomly selected from among men employed at the same plant and born within 3 years of the case with no radiographic indication of silicosis prior to the date of diagnosis of the case, for a total of 167 controls and a combined total of 234 workers in the fnal group for which exposure assessment was conducted. The researchers involved in the exposure estimation were blinded to subject identity and case/control status.
Work histories for the fnal group of cases and con-trols were compiled by the participating companies under the coordination of one of the authors (REG). Company A’s human resource records were mostly elec-tronic, but for Company B, much of the earlier data were abstracted from paper copy. The companies developed the job histories by in-house review of their personnel, employment, and medical records, supplementing this information as needed by discussions with workers and supervisors. The job histories included date of initial hire with the company along with job title and department or work area and subsequent jobs and dates held until the study cut-off date (2013) or termination of employment.
Job histories received from the companies were reviewed and each entry in a worker’s job history was coded for the specific job and plant corresponding to those in the job exposure matrix (JEM).
Exposure measurements Beginning in the early 1970s, the two companies par-ticipating in this study have collected to date over 49000 samples for RQ using 10-mm nylon cyclone with a mem-brane flter for the analysis of collected quartz via X-ray diffraction. In addition to this database, quantitative data from archival consultant reports and the Mine Safety and Health Administration’s online database (https:// arlweb.msha.gov/drs/drshome.htm; last accessed 6 July 2018) were used to reconstruct exposures, particularly
for exposures occurring before the 1970s and for certain plants that had been in operation under different owner-ship before being acquired by the participating compa-nies. Also, available information was acquired on plants’ process fow, breakdowns of jobs and departments/areas, history of major process or engineering changes with an emphasis on those that may have altered dust concentra-tions in the workplace, and use of respiratory protective equipment (RPE).
Development and application of the JEM For each of the 21 plants having a case and controls, a separate JEM was developed for the period begin-ning with earliest date of hire of case or control work-ers, to the termination of employment or study cut-off date (2013), using an approach similar to that employed in our previous mortality studies of the industrial sand industry (Rando et al., 2001; McDonald et al., 2005). The JEM was linked to the specifc job histories of the participating workers to calculate yearly exposures for each individual. These were then used to compute cumu-lative and average exposures to RQ, as well as other exposure metrics.
A dictionary of job codes for each plant was devel-oped after careful review of the respective job history profiles, and current and historical plant and process information. In a few situations where cross-over among job titles and tasks within plant departments was a com-mon occurrence, a department-wide job code and cor-responding average concentration was assigned for all workers involved, regardless of job title.
Estimates of average exposure to RQ for each job code were computed as the arithmetic mean of the data over time segments in which the concentrations were judged to be stable. The arithmetic mean was used because chronic inhalation exposures are physiologic-ally integrated in a linear fashion and the inhaled expos-ure dose can be negatively biased when using geometric mean exposure concentration in dose response analyses (Seixas et al., 1988; Crump, 1998). Temporal trends or changes in the exposures were frst identifed by graphical examination of the data and then evaluated using trad-itional statistical tests for signifcance (t-test, ANOVA) on the log-transformed data. Identifed changes in exposure were correlated with any known dates of changes in pro-cess, work practices, and dust controls. When no stat-istically signifcant changes or trends in exposure were identified, the mean of the data across all times for a given job was used as the exposure estimate.
Individual exposure measurements that were below the limit of detection (~6 µg m−3) were fagged as being censored and the grouped data were analyzed using the
Dow
nloaded from https://academ
ic.oup.com/annw
eh/article-abstract/62/8/1021/5054738 by guest on 22 October 2018
1024 Annals of Work Exposures and Health, 2018, Vol. 62, No. 8
log-probit regression, maximum likelihood estimation, or beta substitution techniques to obtain statistically robust estimates of the geometric mean and geometric standard deviation. The arithmetic mean of the data was then calculated using the minimum variance unbiased estimator (MVUE). These analytical procedures were performed with IH DataAnalyst software using the program’s censored data analysis routines (Exposure Assessment Solutions, Inc.; Morgantown, West Virginia).
For reported jobs in which either no specific sam-pling was ever done, no specifc information on the job’s tasks was available (for example, “labor” and “utility”), or for time segments of an individual’s job history with missing job information, RQ exposures were assumed to be equal to the overall mean of the estimates for all pro-duction jobs in the facility.
To estimate RQ exposures prior to the starting date of the modern database (~1970), the history of a given job and facility identifed probable dates for any likely changes in dust concentration based on process changes, dust controls, etc. After that date, concentra-tion estimates derived from the modern exposure data-base were extrapolated back in time to the point of the change. Preceding such changes, exposure estimates were based on archival data from a series of reports sub-mitted to NISA by Professor Theodore Hatch through the Industrial Hygiene Foundation of America between 1947 and 1955 (Hatch et al., 1947; Hatch, 1954; Hatch and Wellington, 1955). The 1947 report contained approximately 500 dust measurements from 19 separ-ate facilities processing industrial sand. Of the 19 facili-ties, data from 3 plants in this study could be specifcally identifed and used for past exposure estimation. For the other plants in this study, dust measurement data were averaged by production areas/tasks across all 19 plants.
Conversion of archival exposure measures Hatch’s 1947 survey data were collected using Greenburg Smith impingers with enumeration of collected particles by bright feld microprojector microscopy. The resulting dust measurements were nonspecifc and were reported in units of million particles per cubic foot (mppcf). For use in this study, the Hatch particle count concentration data had to be converted to the equivalent modern unit system of µg m−3 RQ.
In similar studies of other industries such as the Vermont granite sheds (Montgomery et al., 1991 and Ayer et al., 1973), conversion factors have been obtained directly from side-by-side samples collected by impin-ger and by respirable cyclone sampler. This approach requires access to plants and processes that are rep-resentative of past conditions when the archival data
were collected; however, with plant modernization and implementation of dust exposure controls over time, this is typically not possible. The industrial sand indus-try has changed dramatically over time, so a computa-tional approach must be taken to develop the conversion factor. In our previous work, (Rando et al., 2001) this computation was based on 14 archival particle size sam-ples collected in various areas in several industrial sand plants (Severns, 1979). These samples were collected on membrane flters with a 10-mm nylon cyclone pre-separator and analyzed by oil-immersion microscopy with 400–500 particles in each sample counted and clas-sifed into nine size categories ranging between 0.3 and 4.8 µm. Additionally, for each sample the count median diameter (CMD) and geometric standard deviation (GSD) of the particle size distribution were estimated by graphical analysis (Table 1).
We estimated the corrected number concentration of particles in each of the nine size categories by accounting for the sampling effciency of the cyclone/flter (εC). The collection/analysis effciency of the impinger/microscope (εI) was then applied to the corrected number concentra-tion to determine the expected number concentration from an impinger collection and analysis of that sample. The
Table 1. Particle count to respirable mass conversion factors for industrial sand dust derived from archival particle size data (Severns, 1979) using the simulation algorithm.
Area Original size distribution of respirable dust
CFa
(µg m−3
mppcf−1)
CMD (µm) GSD
Dryers 0.36 2.1 136
0.55 2.5 263
0.55 2.1 181
0.41 2.1 146
Screen 0.44 1.9 115
Air Sizers 0.46 2.3 202
0.44 2.0 134
Vibrators 0.37 2.2 157
0.39 2.2 162
Binroom 0.56 2.0 160
Bulkloading 0.36 2.3 186
Bagging 0.30 2.2 137
0.30 2.1 121
0.33 1.7 96
Overall 157 ± 42 (mean ± SD)
CMD: count median diameter; GSD: geometric standard deviation; CF: conver-
sion factor. aNo signifcant differences in CF between areas. ANOVA, P = 0.29.
Dow
nloaded from https://academ
ic.oup.com/annw
eh/article-abstract/62/8/1021/5054738 by guest on 22 October 2018
Annals of Work Exposures and Health, 2018, Vol. 62, No. 8 1025
original particle counts in each size category were then converted to equivalent respirable mass concentration assuming spherical silica particles. The number and mass contributions in each size category were summed and rati-oed to determine the conversion factor for that sample.
Our previous computational algorithm yielded a conversion factor of 276 µg m−3 per mppcf which is in the upper range of conversion factors reported by oth-ers for various types of mineral dusts and is signifcantly greater than those developed for siliceous dusts which generally range around a value of 125 µg m−3 per mppcf (Supplementary Table S2, available at Annals of Work Exposures and Health). Our original computational algorithm had several limitations: imprecision for size categories with low particle counts, assignment of collec-tion effciency of the category median particle size to all particles in a given size category, truncating the counts at 4.8 µm thus excluding respirable particle mass of larger particles, and assuming that all particles in the sample were silica with a density of 2.65 g cm−3.
In this present work, the computational algorithm for the conversion factor has been updated with a sto-chastic approach using computer simulations based on the particle size distributions of the samples. The simu-lation algorithm entailed generation of 100 000 indi-vidual virtual particles with projected area diameter of the ith particle (dP,i) randomly chosen from a log-nor-mal distribution of particle sizes having the CMD and GSD of the corresponding archival sample. The simula-tions were run in Microsoft Excel using the RiskAMP Monte Carlo Simulation add-in (Structured Data, LLC; San Francisco, California; www.riskamp.com). Virtual particles with random values of ln (dP,i) were generated using the ‘NormalValue’ function in RiskAMP which returns a value randomly chosen from the normal dis-tribution with the input mean (ln CMD) and standard deviation (ln GSD).
For each of the virtual particles, their equivalent res-pirable mass was calculated according to equation (1) where dP,i is particle diameter, ρi is the particle density, and Mi is the particle mass. The density of each virtual particle was randomly chosen from among the following values: 1.8 g cm−3 (black carbon/soot), 2.6 g cm−3 (kaolin), 2.65 g cm−3 (quartz), and 2.7 g cm−3 (calcite). This approximates the composition of airborne particulate matter in indus-trial sand plants as reported by Hatch et al., (1947).
° d3
M = P i, ˛i i (1)6
Next, for each virtual respirable particle, the correspond-ing number of particles of such diameter was determined
by dividing the count of one by the collection effciency of the cyclone/flter assembly; that is, the single virtual par-ticle would have been part of a family of such sized par-ticles in the air sample, only one of which was collected. For example, if the cyclone/flter collection effciency for a particular sized virtual particle is 0.1 (or 10%) then there would actually have been on average a total of 10 such particles in the whole sample prior to separation by the cyclone. The corresponding equivalent particle count by impinger/microscopy then is the product of the adjusted particle count and the effciency of measurement by impinger collection/microscopy. Combining these two adjustments yields equation (2), where Ni is equivalent particle count of the ith virtual particle by impinger col-lection and microscopy, εI,i is the impinger/microprojec-tor measurement effciency for virtual particle i, and εC,i is its cyclone/flter collection effciency:
˝ Ni = I i, (2)
˝C i,
The 10-mm cyclone/filter collection efficiency, εC, has been shown to meet the 1984 ACGIH respirable dust sampling convention reasonably well (ACGIH, 1984; Tsai and Shih, 1995):
…those particles that penetrate a separator whose size collection effciency is described by a cumu-lative lognormal function with a median aero-dynamic diameter (dAE) of 3.5 µm ± 0.3 µm and with a geometric standard deviation of 1.5 (± 0.1).
Hence, the cyclone collection effciency, ε c, was calcu-lated for each virtual particle according to equation (3) where Φ is the cumulative normal distribution function, and dAE,i is the aerodynamic equivalent diameter of the
)1/2):ith particle (d = d (ρAE,i P,i i
˘ ln(d / GM)� ˝C i, = −1 � �
� z = AE
( ,i
) ��
(3) ln GSD
Calculation of ε c according to equation (3) was performed using the ‘LOGNORM.DIST’ function in Microsoft Excel, with input values of 1.253 and 0.405 (ln (GM = 3.5 µm)) and (ln (GSD = 1.5)), respectively. This applied to simu-lation particles with dAE less than or equal to 10 µm. The corrected particle count of simulation particles greater than 10 µm was set to zero because the conversion factor was extremely sensitive to the presence of such large par-ticles owing to the cubic relationship of mass and diam-eter and such large particles would have been removed from the sample by the cyclone pre-separator.
The impinger/microprojector measurement effciency, εI, was set to zero for virtual particles with dP,i less than
Dow
nloaded from https://academ
ic.oup.com/annw
eh/article-abstract/62/8/1021/5054738 by guest on 22 October 2018
1026 Annals of Work Exposures and Health, 2018, Vol. 62, No. 8
0.75 µm (dAE,i < 1.2 µm for a silica particle) based on the resolving/magnifying power of the Bureau of Mines microprojector apparatus (Brown et al., 1938) and for particles with d greater than 5 µm (d > 8.1 µm for aP,i AE,i
silica particle) based on the counting rules employed by Hatch (1947). For particles with dP,i between 0.75 and 5 µm, the impinger/microscopy measurement effciency was calculated according to equation (4), obtained by nonlinear regression (r2 > 0.999) of the experimental data for impinger collection effciency of silica particles reported by Davies et al., (1951).
1 174. 1 760. 1 194.˝I i, = 0 563. + − 2 + 3 (4)d d dAE,i AE i, AE,i
Finally, each of the individual particle masses calculated from equation (1) and counts calculated from equa-tion (2) were totalled for the 100 000 virtual particles and ratioed to derive the conversion factor (CF) for that sample, as per equation (5):
100 000,˘ µ � Mi ( )µg3g �
� m � i=1CF =
Dow
nloaded from https://academ
ic.oup.com/annw
eh/article-abstract/62/8/1021/5054738 by guest on 22 October 2018
� �mppcf� �� � 100,000
� Ni (particles) (5) i=1
6 310 particles 35 3. ft × ×
3 3ft m
The performance of the simulation algorithm for the CF was assessed by comparison to a set of CFs for mineral dusts obtained directly from side-by-side sam-pling with impinger sampling/microscopic analysis and cyclone collection/gravimetric analysis as reported
by Tomb and Haney, 1988. The measured CFs and those calculated using our simulation algorithm were not statistically different by paired t-test, P = 0.79 (Supplementary Table S1, available at Annals of Work Exposures and Health).
The archival particle count concentrations (mppcf) were then converted to modern measures of RQ (µg m−3) using our conversion factor of 157 derived from the simu-lations, along with the percent quartz (%Q), as shown in equation (6). The percent quartz in this equation was taken from the values reported by Hatch et al., (1947), as shown in Table 2. Hatch determined the quartz percentage of 39 samples of airborne and settled dust by X-ray diffraction analysis after removal of particles greater than 5 µm.
3 (6)RQ(µg m/ ) = 157 × mppcf × %Q ÷ 100
Respiratory protective equipment The use of respiratory protective equipment (RPE) by workers can be an important exposure modifer in con-structing the JEM. Hatch et al. (1947) anecdotally noted some use of RPE in this industry; however, the RPE in the past was commonly ¼-mask gasketed metal facepiece air-purifying respirators with electrostatic felt or electret fl-ters. Those respirators tended to provide poor ft quality and there were no formal RPE programs or any indica-tion of ft testing in the distant past in the industrial sand industry. Furthermore, the electret flters of the past have been shown to be unreliable, losing filtration capacity when exposed to water, oil mists, certain organic solvents, and high dust loadings (Revoir and Bien, 1997). Thus, exposures before the 1970s were not adjusted for RPE.
Table 2. Historical industrial sand particle count measurements (Hatch et al., 1947) converted to RQ concentration.
Department, area, or activity # samples Particle count concentration
% quartz Mean (SD)
Mean converted µg m−3 RQ
Range (mppcf)
Mean (mppcf)
Quarrying 14 0.5–16 4.9 78 (15) 598
Crushing 27 1.2–15 4.0 490
Wet processing 28 0.2–4.7 1.4 54 (16) 119
Moist sand handling and storage 17 0.4–3.2 1.3 110
Annals of Work Exposures and Health, 2018, Vol. 62, No. 8 1027
For most of the data in the modern exposure data-base, individual samples were fagged for RPE use. The assigned exposure concentration for each fagged sample was reduced by the workplace protection factor, WPF:
CC’ = (7)
WPF
Where C’ is the RQ exposure concentration adjusted for respirator use and C is the measured environmental exposure level. A WPF of 5 was used as the default value in this calculation based on reported workplace protec-tion factors of air-purifying respirators for small par-ticle and vapor hazards (Nicas and Neuhaus, 2004). The combined average exposures (MVUE) of the flagged, adjusted, and unfagged, unadjusted samples were then calculated as the best estimate of exposure, thus incorpo-rating both degree of protection and frequency of use of RPE. Because of the numerous assumptions required to perform the exposure adjustments and estimations, add-itional estimates based on differing assumptions about past exposures and respirator use and protection were computed in parallel for use in sensitivity analyses. Thus, each cell in the JEM contained fve estimates of expos-ure: exposure with no adjustment for RPE (WPF = 1), exposures adjusted for recorded frequency of use assum-ing WPF = 5 and = 10, and exposures adjusted for assumed continuous use of RPE with WPF = 5 and = 10.
For some plants, recording of respirator use in the exposure database was delayed for some time after the institution of a respiratory protection program. In these cases, estimates of frequency of use of respirators for a given job title were obtained from the observed frequency, f, for the time after which the information was included in the exposure database, assuming that it was representative of prior usage patterns. This frequency (0 ≤ f ≤ 1) was then used in conjunction with the assigned workplace protec-tion factor to adjust the average exposure levels as follows:
˘ f �C’ = C (1 − f ) + C (8)
�� ��WPF
This formula was applied to all the exposure data cover-ing the period starting with the estimated start date of RPE use up to the point when RPE was specifcally recorded in the exposure database.
Results
Converting particle counts to respirable mass The results of the CF simulations are shown in Table 1. The CF values range over a factor of about 2.5 and vary both across and within the various process areas;
however, there was no statistically significant differ-ence in CF among the different process areas (ANOVA, P = 0.29). The overall average CF based on the simu-lations is 157 µg m−3 per mppcf (SD = 42). This value is similar to other reported CFs for mineral dusts (Supplementary Table S2, available at Annals of Work Exposures and Health) and is 57% of our original CF of 276 µg m−3 per mppcf obtained from the deterministic algorithm.
Table 2 presents a summary of the Hatch survey data in particle count concentrations and the equivalent RQ concentrations estimated per equation (6). The table entries are grouped by the same scheme Hatch used in presenting the data in the archival report.
The converted average exposure measures for RQ range from 110 to 13430 µg m−3. The lowest exposures were associated with the processing of wet sand, whereas dry screening and bulk loading operations showed the highest concentrations. The excessively high dust meas-ures for the screening operations represent worst case scenarios as Hatch noted that the workers spent little time during the workday in the immediate vicinity of the screens where the samples were taken. The extraordinar-ily high exposures measured in bulk loading operations were primarily due to the loading of boxcars with bulk product, a practice that was eliminated in this industry by the early 1970s. Overall, the converted survey data of Hatch indicate that past exposures in this industry for all areas, including those dealing with wet product, were gen-erally higher than modern exposure guidelines for RQ.
The plant/time/JEM A total of 399 plant–job combinations were identifed among the 21 plants having cases and matched controls and were used in constructing the JEM. Company B’s information was considerably more detailed than that of Company A as to the identifcation of those specifc jobs sampled in the exposure databases and those held by the study subjects according to their job histories. The num-ber of uniquely identifed jobs per plant from Company A ranged from 7 to 10 with an average of 9. In contrast, the numbers of jobs identifed per plant from Company B ranged from 6 to 81 with an average of 31.
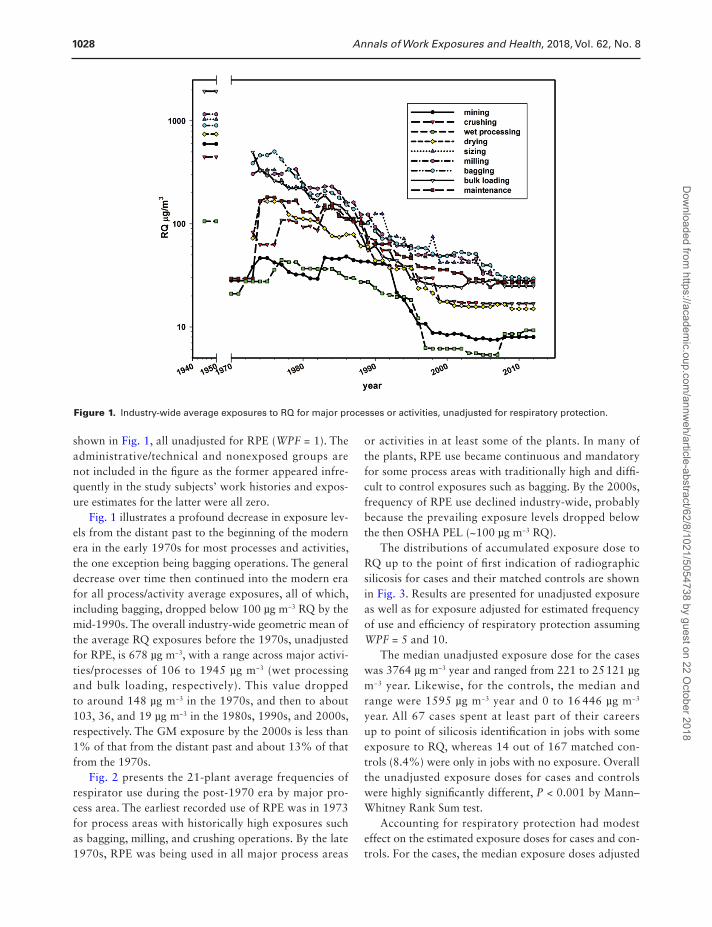
For purposes of presenting the results of the JEM, which contained thousands of individual plant/job/year combinations, the 399 plant/job combinations were collapsed into 11 major processes or activities (Fig. 1): nonexposed, administrative/technical, mining, crushing, wet processing, drying, sizing/screening, milling, bag-ging, bulk loading, and maintenance. The overall aver-age unadjusted exposures across time for the 21 plants by major process areas or activities are summarized and
Dow
nloaded from https://academ
ic.oup.com/annw
eh/article-abstract/62/8/1021/5054738 by guest on 22 October 2018
1028 Annals of Work Exposures and Health, 2018, Vol. 62, No. 8
Figure 1. Industry-wide average exposures to RQ for major processes or activities, unadjusted for respiratory protection.
shown in Fig. 1, all unadjusted for RPE (WPF = 1). The administrative/technical and nonexposed groups are not included in the fgure as the former appeared infre-quently in the study subjects’ work histories and expos-ure estimates for the latter were all zero.
Fig. 1 illustrates a profound decrease in exposure lev-els from the distant past to the beginning of the modern era in the early 1970s for most processes and activities, the one exception being bagging operations. The general decrease over time then continued into the modern era for all process/activity average exposures, all of which, including bagging, dropped below 100 µg m−3 RQ by the mid-1990s. The overall industry-wide geometric mean of the average RQ exposures before the 1970s, unadjusted for RPE, is 678 µg m−3, with a range across major activi-ties/processes of 106 to 1945 µg m−3 (wet processing and bulk loading, respectively). This value dropped to around 148 µg m−3 in the 1970s, and then to about 103, 36, and 19 µg m−3 in the 1980s, 1990s, and 2000s, respectively. The GM exposure by the 2000s is less than 1% of that from the distant past and about 13% of that from the 1970s.
Fig. 2 presents the 21-plant average frequencies of respirator use during the post-1970 era by major pro-cess area. The earliest recorded use of RPE was in 1973 for process areas with historically high exposures such as bagging, milling, and crushing operations. By the late 1970s, RPE was being used in all major process areas
or activities in at least some of the plants. In many of the plants, RPE use became continuous and mandatory for some process areas with traditionally high and diff-cult to control exposures such as bagging. By the 2000s, frequency of RPE use declined industry-wide, probably because the prevailing exposure levels dropped below the then OSHA PEL (~100 µg m−3 RQ).
The distributions of accumulated exposure dose to RQ up to the point of frst indication of radiographic silicosis for cases and their matched controls are shown in Fig. 3. Results are presented for unadjusted exposure as well as for exposure adjusted for estimated frequency of use and effciency of respiratory protection assuming WPF = 5 and 10.
The median unadjusted exposure dose for the cases was 3764 µg m−3 year and ranged from 221 to 25121 µg m−3 year. Likewise, for the controls, the median and range were 1595 µg m−3 year and 0 to 16 446 µg m−3
year. All 67 cases spent at least part of their careers up to point of silicosis identifcation in jobs with some exposure to RQ, whereas 14 out of 167 matched con-trols (8.4%) were only in jobs with no exposure. Overall the unadjusted exposure doses for cases and controls were highly signifcantly different, P < 0.001 by Mann– Whitney Rank Sum test.
Accounting for respiratory protection had modest effect on the estimated exposure doses for cases and con-trols. For the cases, the median exposure doses adjusted
Dow
nloaded from https://academ
ic.oup.com/annw
eh/article-abstract/62/8/1021/5054738 by guest on 22 October 2018
Annals of Work Exposures and Health, 2018, Vol. 62, No. 8 1029
Figure 2. Reported frequency of use of respiratory protective equipment industry-wide for various major processes or activities.
Figure 3. Distributions of estimated RQ exposure dose at frst identifcation of silicosis for cases and controls, with and without adjustment for frequency of use and effciency of respiratory protective equipment.
for RPE use were 86% and 84% of the unadjusted value The study subjects had an average exposure start date assuming WPF = 5 and 10, respectively. For the con- of 1961 and out of 234 total study subjects, 173 (74%) trols, the respective values were 77% and 72%. With the had a hire date before 1970. The percentages of pre-1970 default WPF value of 5, the equivalent effective protec- hire for the cases and the controls were very similar (78% tion factors were only 1.2 and 1.3 for cases and controls, and 73%) and were not statistically different. Thus, the respectively. cumulative exposures are primarily related to the high
Dow
nloaded from https://academ
ic.oup.com/annw
eh/article-abstract/62/8/1021/5054738 by guest on 22 October 2018
1030 Annals of Work Exposures and Health, 2018, Vol. 62, No. 8
exposures of the distant past when respiratory protection was nonexistent or unreliable. Fully 43% of cases and 50% of controls were always in jobs without respiratory protection and the proportions were not signifcantly dif-ferent (P = 0.69, χ2 test). The adjusted exposures assuming WPF of 5 or 10 were also very similar, with a difference of only 6.2% in median adjusted exposure.
Discussion
Retrospective epidemiologic investigations of worker health in industries processing silica-containing minerals, includ-ing this work and others for industrial sand (Sanderson et al., 2000; Rando et al., 2001; McDonald et al., 2005; Brown and Rushton, 2005), face a variety of challenges related to exposure assessment. Historical exposure infor-mation is often limited or missing and Hatch’s archival exposure survey reports are the only exposure data for industrial sand production prior to the 1970s. These data, used in our previous (Rando et al., 2001) and current work as well as that of Sanderson et al., (2000), were in the form of particle count concentrations and were converted into RQ concentrations for use in the JEM.
Count to respirable mass conversion factors for sili-ceous mineral dusts have been reported in other retro-spective epidemiologic and exposure studies (Jacobson and Tomb, 1967; Sutton and Reno, 1968; Ayer et al., 1973; Samimi, 1973; Davis et al., 1983; Sheehy and McJilton, 1987; Montgomery et al., 1991; Seixas et al., 1997). The values of these CFs have ranged over about an order of magnitude (~18 to 180 µg m−3 per mppcf) but most are clustered around an overall average value of approximately 130 (Supplementary Table S2, available at Annals of Work Exposures and Health). Sanderson et al., (2000) utilized a CF for industrial sand of 100 that was derived from studies of Vermont granite sheds (Sutton and Reno, 1968; Ayer et al., 1973) and of taconite production (Sheehy and McJilton, 1987). In contrast, we utilized arch-ival particle size data from several industrial sand plants to develop a sand industry-specifc CF. Particle size distribu-tions can vary across differing industries, so an industry-specifc CF for respirable dust is clearly preferable.
In our original work (Rando et al., 2001), a CF of 276 was developed from a deterministic algorithm using archival particle size distribution data. This value is in the upper range of CFs reported for mineral dusts and may have been positively biased by imprecision of low parti-cle counts observed in the larger particle size categories. In this current work, we applied a stochastic algorithm with log-normal modeling of the particle size distribu-tions rather than using the actual size-categorized par-ticle count data. The current simulation algorithm was
evaluated against directly measured CFs from paired sam-pling/analysis with impinger/microscopy and respirable dust cyclone/gravimetry (Tomb and Haney, 1988) and our simulation algorithm produced CFs that were on average within 20% of the directly measured values with no sta-tistical difference (Supplementary Table S1, available at Annals of Work Exposures and Health). Furthermore, our CF of 157 falls in the middle of the range reported for siliceous dusts and is identical to the value previously sug-gested by the ACGIH (ACGIH, 1979).
Accounting for the use of RPE in quantitative expos-ure assessments is another challenge and other investi-gations of past exposures in the sand industry, both in the USA (Sanderson et al., 2000) and in the UK (Brown and Rushton, 2005), have noted the potential impact on estimated exposures, but made no adjustments for RPE. Quantitative information on RPE effectiveness and use is often unavailable, especially for the distant past, and there is wide variability in protection among work-ers using the same equipment as well as within indi-vidual workers from day to day (Nicas and Neuhaus, 2004). Furthermore, pre-1970 RPE often exhibited poor performance of construction and fltration materi-als. Robust respiratory protection programs were also uncommon during that time period.
Because of these issues with past RPE use, we chose not to adjust exposures prior to about 1970 for any respira-tory protection. After about 1970, exposure estimates were adjusted for the frequency of use and, for purposes of comparison and sensitivity analyses, were computed assuming no RPE and assuming continuous use as well. Our sensitivity analyses of exposure adjustments for RPE showed only modest effect on the overall estimated cumulative exposures in our study population. This mod-est effect is attributable to much higher unprotected past exposures for the study subjects, 74% of whom began work before 1970. Similar results, also attributed to higher exposures and poorer protection in the distant past, were observed in a study estimating cumulative organic solvent exposures for painters (Wang et al., 2011).
With or without adjustment for RPE, there have been very signifcant reductions in RQ exposures over time in this industry. In our previous work investigating cancer mortality in 9 industrial sand plants (Rando et al., 2001), similar reductions across time were observed but this cur-rent work expands the exposure assessment to 21 plants and extends the time frame of the analysis out another 15 years. Sanderson et al., (2000) also observed simi-lar exposure reductions in 18 American industrial sand plants up to 1996: overall GM dropped from 51.2 µg m−3
RQ in the 1970s to 7.5 µg m−3 by the 1990s, a decrease of about 85%. Brown and Rushton (2005) also report
Dow
nloaded from https://academ
ic.oup.com/annw
eh/article-abstract/62/8/1021/5054738 by guest on 22 October 2018
Annals of Work Exposures and Health, 2018, Vol. 62, No. 8 1031
signifcant exposure reductions in seven industrial sand plants from the UK during a similar time frame (1978– 2000). There, exposures declined from 80 µg m−3 in the early 1980s to 40 µg m−3 by the late 1990s.
Decreases in RQ exposures of US industrial sand workers were driven in part by the establishment of the OSHA/MSHA in the early 1970s and probably by subsequent periodic reductions in recommended expos-ure guidelines such as the ACGIH TLV. Thus the sand industry accelerated implementing dust control pro-grams that had been ongoing for several decades after the Hatch survey of 1947. Controls included wet drilling equipment in quarries, air conditioned/fltered control booths for dusty operations like crushing, air condi-tioning/fltering of mobile equipment cabs, eliminating steam coil dryers, drying sheds and some bulk loading operations, ventilation and dust suppression on screens, local exhaust ventilation and air curtains on bagging machines, and replacing burlap product bags having sewn closures with paper or plastic bags sealed with glue or weld lines. Formal RPE programs started in the late 1970s and further reduced the exposure burden for industrial sand workers.
This work had several limitations. Pre-1970 exposures had to be estimated from limited archival data which lacked plant-specifc information, except for three plants, so that industry-wide exposure estimates were used for 18 of 21 plants. The archival particle count concentra-tion data also had to be converted to modern measures of RQ. The CF used in this work was based on a small set of archival particle size distribution data, although it was industry-specifc. Likewise, the quartz content of dust from the past was estimated from assays of sus-pended and settled dust reported in the archival surveys, but the quartz content of respirable dust in this industry has changed over time. Work histories for the study sub-jects were generally complete for recent time periods but more often contained missing information for the distant past. Finally, various assumptions had to be made regard-ing use of RPE and its effectiveness; although sensitivity analyses suggested that accounting for RPE had only modest effect on the exposures. These various limitations have likely resulted in some misclassifcation error in the exposure estimates; however, this error likely affected cases and controls equally and nondifferentially.
Conclusions
With the recent (2016) revision of the OSHA PEL for crystalline silica, there is renewed interest in evaluating risk of silicosis from occupational exposures. The indus-trial sand industry deals with high-purity quartz sand
and has been the subject of several previous mortality studies of silicosis, lung cancer, and kidney disease. In this work, RQ exposures were retrospectively estimated for 67 radiographically-identifed silicosis cases and 167 matched controls from the industrial sand workforce, most of whom started work before 1970 and as early as 1929. The JEM was constructed by integrating arch-ival particle count exposure data, converted to equiva-lent levels of RQ, with an extensive modern (post-1970) exposure database and demonstrated an industry-wide decrease in prevailing exposures to RQ of up to 2 orders of magnitude from the distant to the recent past. Adjustment for use of respiratory protection showed only modest reductions in estimated exposure—a result of most of the accumulated exposure occurring in the past when respiratory protection was rare and unreli-able. Overall the estimated cumulative exposures for sili-cosis cases and controls were signifcantly different, with the median cumulative exposure for cases being more than twice that of their matched controls.
Supplementary Data
Supplementary data are available at Annals of Work Exposures and Health online.
Acknowledgements
The assistance of John Ulizio and Andrew O’Brien in acquiring exposure data and work histories was critical and invaluable. Kyle Looker, Erin McDuff, and Wanwei Amy Zhou provided helpful technical assistance in analyzing the extensive exposure data in this study.
Confict of Interest
Funding for this project was provided by the National Industrial Sand Association (NISA). Robert Glenn was employed by NISA from 1988 to 2004, prior to the time the project was funded. The authors declare no other potential confict of interest relat-ing to the material presented in this article.
References
ACGIH. (1979) Threshold limit values for chemical sub-stances and physical agents in the workroom environment with intended changes for 1979. Appendix G. Cincinnati: American Conference of Governmental Industrial Hygienists.
ACGIH. (1984) Particle size selective sampling in the work-place. Ann Amer Con Govt Ind Hyg; 11: 23–6.
ACGIH. (2010) Silica, crystalline: alpha-quartz and cristo-balite: TLV chemical substances 7th edition documenta-tion. Cincinnati: American Conference of Governmental Industrial Hygienists.
Dow
nloaded from https://academ
ic.oup.com/annw
eh/article-abstract/62/8/1021/5054738 by guest on 22 October 2018
1032 Annals of Work Exposures and Health, 2018, Vol. 62, No. 8
Ayer HE, Dement JM, Busch KA et al. (1973) A monumental study–reconstruction of a 1920 granite shed. Am Ind Hyg Assoc J; 34: 206–11.
Brown CE. (1944) Midget microprojector for dust determina-tions. R.I. 3780, Washington, DC: US Bureau of Mines.
Brown CE, Baum LAH, Yant WP et al. (1938) A microprojec-tion method for counting impinger dust samples. R.I. 3373, Washington, DC: US Bureau of Mines.
Brown TP, Rushton L. (2005) Mortality in the UK industrial silica sand industry: 1. Assessment of exposure to respirable crystalline silica. Occup Environ Med; 62: 442–5.
Crump KS. (1998) On summarizing group exposures in risk assessment: is an arithmetic mean or a geometric mean more appropriate? Risk Anal; 18: 293–7.
Davies CN, Aylward M, Leacey D. (1951) Impingement of dust from air jets. AMA Arch Ind Hyg Occup Med; 4: 354–97.
Davis LK, Wegman DH, Monson RR et al. (1983) Mortality experience of Vermont granite workers. Am J Ind Med; 4: 705–23.
Hatch TF. (1954) Control of dust hazards in production of industrial sand and sand products. Pittsburgh, PA: Industrial Hygiene Foundation of America, Inc.
Hatch TF, Holden FR, Haines GF. (1947) Investigations of dust exposures and control in industrial sand produc-tion. Pittsburgh, PA: Industrial Hygiene Foundation of America, Inc.
Hatch TF, Wellington AC. (1955) An overall program of silico-sis prevention in an industrial sand plant. Pittsburgh, PA: Industrial Hygiene Foundation of America, Inc.
Hughes JM, Weill H, Rando RJ et al. (2001) Cohort mortality study of North American industrial sand workers. II. Case-referent analysis of lung cancer and silicosis deaths. Ann Occup Hyg; 45: 201–7.
IARC. (1997) Silica, some silicates, coal dust and paraaramid fbrils. IARC Monogr Eval Carcinog Risks Hum; 68: 1–475.
International Labor Office (ILO). (2011) Guidelines for Use of the ILO International Classifcation of Radiographs for Pneumoconeoses (Revised Edition 2011). Occupational Safety and Health Series No. 22. Geneva: International Labor Offce.
Jacobson M, Tomb TF. (1967) Relationship between gravimetric respirable dust concentration and midget impinger number concentration. Am Ind Hyg Assoc J; 28: 554–6.
McDonald JC, McDonald AD, Hughes JM et al. (2005) Mortality from lung and kidney disease in a cohort of North American industrial sand workers: an update. Ann Occup Hyg; 49: 367–73.
McDonald AD, McDonald JC, Rando RJ et al. (2001) Cohort mortality study of North American industrial sand work-ers. I. Mortality from lung cancer, silicosis and other causes. Ann Occup Hyg; 45: 193–9.
Montgomery JA, Horstman SW, Breslow NE et al. (1991) A comparison of air sampling methods for airborne silica in
the diatomaceous earth industry. Appl Occup Environ Hyg; 6: 696–702.
Nicas M, Neuhaus J. (2004) Variability in respiratory protection and the assigned protection factor. J Occup Environ Hyg; 1: 99–109.
NIOSH. (1974) Criteria for a recommended standard: occu-pational exposure to crystalline silica. DHHS (NIOSH) Publication Number 75–120, Washington, DC: Department of Health and Human Services.
Rando RJ, Shi R, Hughes JM et al. (2001) Cohort mortal-ity study of North American industrial sand workers. III. Estimation of past and present exposures to respirable crys-talline silica. Ann Occup Hyg; 45: 209–16.
Revoir WH, Bien CT. (1997) Respiratory protection handbook. Boca Raton: Lewis Publishers.
Samimi B. (1973) Silica dust in sandblasting operation. Doctoral Dissertation. New Orleans: Tulane University.
Sanderson WT, Steenland K, Deddens JA. (2000) Historical res-pirable quartz exposures of industrial sand workers: 1946-1996. Am J Ind Med; 38: 389–98.
Seixas NS, Heyer NJ, Welp EA et al. (1997) Quantifcation of historical dust exposures in the diatomaceous earth indus-try. Ann Occup Hyg; 41: 591–604.
Seixas NS, Robins TG, Moulton LH. (1988) The use of geomet-ric and arithmetic mean exposures in occupational epidemi-ology. Amer J Ind Med; 14: 465–77.
Severns N. (1979) A profle of respirable free crystalline silica in the sand industry, Master’s thesis. Pittsburgh, PA: University of Pittsburgh.
Sheehy JW, McJilton CE. (1987) Development of a model to aid in reconstruction of historical silica dust exposures in the taconite industry. Am Ind Hyg Assoc J; 48: 914–8.
Steenland K, Sanderson W. (2001) Lung cancer among industrial sand workers exposed to crystalline silica. Am J Epidemiol; 153: 695–703.
Sutton GW, Reno SJ. (1968) Respirable mass concentration equivalent to impinger count data: Barre, VT granite sheds. Presented at AIHCE, St. Louis, MO. As reported in Ayer, et al. (1973).
Tomb TF, Haney RA. (1988) Comparison of Number and Respirable Mass Concentration Determinations. In Air Sampling Procedures Committee, ed. ACGIH Advances in Air Sampling. Chelsea, MI: Lewis Publishers. pp. 189–202. ISBN 0-87371-115-7.
Tsai CJ, Shih TS. (1995) Particle collection effciency of two per-sonal respirable dust samplers. Amer Ind Hyg Assoc J; 56: 911–8.
Vacek PM, Glenn RE, Rando RJ et al. (2018). Exposure-response relationships for silicosis and its progression in industrial sand workers. Scand J Work Env Health.
Wang SW, Qian H, Weisel C et al. (2011) Development of sol-vent exposure index for construction painters. J Occup Environ Hyg; 8: 375–86.
Dow
nloaded from https://academ
ic.oup.com/annw
eh/article-abstract/62/8/1021/5054738 by guest on 22 October 2018