The Resource for Great Programs, Inc. 526 West 14 th Street, Suite 164 Traverse City, MI 49684 Phone: (231) 947-3280 www.GreatPrograms.org Page 1 Return-on-Investment Analysis for Pro Bono Ontario Final Project Report September 18, 2017 1. Introduction The number of unrepresented litigants 1 appearing in Ontario courts has increased dramatically since the economic downturn of 2008. As described in our evaluation of Pro Bono Ontario’s Law Help Ontario program in 2009 2 and documented by the interviews conducted in this study, the flood of unrepresented litigants is straining an already overburdened court system, with more litigants showing up with missing papers, more litigants needing explanation of fundamental concepts before the court process can proceed, more aborted hearings, and higher costs for all parties. According to a senior Superior Court judge in a recent interview, the impact of unrepresented litigants is “the greatest challenge faced by our courts today.” This report describes a study of the cost savings and other economic impacts that Pro Bono Ontario (PBO) is having on Ontario’s court system. 1 The terms “unrepresented” and “self-represented” are widely used to indicate litigants who participate in legal proceedings without lawyers or paralegals to represent them. For consistency in this report, we use “unrepresented” throughout. 2 See, “Evaluation of Law Help Ontario as A Model for Assisting Unrepresented Litigants in the Ontario Superior Court of Justice at 393 University Avenue in Toronto,” by The Resource for Great Programs, November 5, 2009 at http://www.greatprograms.org/Program_assessment/pdfs/J-6_PBLO%20Report_Final%20Draft_11-16-09.pdf. Law Help Ontario (LHO) is the help centre for unrepresented litigants operated by Pro Bono Ontario at 393 University Avenue. This Report at a Glance Page 1. Introduction ............................................ 1 2. PBO’s Services for Unrepresented Litigants ................................................ 3 3. Overview of the Study .......................... 4 4. Major Findings ....................................... 9 5. Conclusion ........................................... 12
Transcript
The Resource for Great Programs, Inc. 526 West 14th Street, Suite 164 Traverse City, MI 49684 Phone: (231) 947-3280 www.GreatPrograms.org
Page 1
Return-on-Investment Analysis for Pro Bono Ontario
Final Project Report
September 18, 2017
1. Introduction
The number of unrepresented litigants1 appearing in Ontario courts has increased dramatically
since the economic downturn of 2008.
As described in our evaluation of Pro Bono
Ontario’s Law Help Ontario program in 20092
and documented by the interviews conducted in
this study, the flood of unrepresented litigants is
straining an already overburdened court system,
with more litigants showing up with missing
papers, more litigants needing explanation of
fundamental concepts before the court process
can proceed, more aborted hearings, and higher
costs for all parties.
According to a senior Superior Court judge in a
recent interview, the impact of unrepresented
litigants is “the greatest challenge faced by our
courts today.”
This report describes a study of the cost savings
and other economic impacts that Pro Bono Ontario (PBO) is having on Ontario’s court system.
1 The terms “unrepresented” and “self-represented” are widely used to indicate litigants who participate in legal
proceedings without lawyers or paralegals to represent them. For consistency in this report, we use “unrepresented”
throughout.
2 See, “Evaluation of Law Help Ontario as A Model for Assisting Unrepresented Litigants in the Ontario Superior
Court of Justice at 393 University Avenue in Toronto,” by The Resource for Great Programs, November 5, 2009 at
http://www.greatprograms.org/Program_assessment/pdfs/J-6_PBLO%20Report_Final%20Draft_11-16-09.pdf. Law
Help Ontario (LHO) is the help centre for unrepresented litigants operated by Pro Bono Ontario at 393 University
with judges and other staff of the Small Claims Court, the Superior Court of Justice, the
Divisional Court and the Court of Appeal for Ontario. Perspectives were sought on the
challenges presented by unrepresented litigants and to collect information about the
impacts these challenges are having on indicators of court efficiency, including duration of
hearings and trials, the ability of proceedings to achieve their purposes, the need to carry
over proceedings for additional days, and other issues.
5. Court statistics and other information. Data were obtained from the Small Claims Court
regarding volume of services provided, with breakdowns by types of services and year for
the period 2013-16.4 Comparable data were requested from the other courts, as well as
financial and staffing data for use in the cost analysis. At this writing, the responses to
those requests for data, other than Small Claims, are still pending.
6. PBO service statistics and other information. Data were obtained from PBO regarding
volumes of services provided, with breakdowns by types of services and year over the
period 2013-16 as well as financial and staffing information contained in various agency
reports.
Exhibit 3: Methodologies for Estimating Economic Impacts of PBO Assistance to Unrepresented Litigants
Economic Impacts
Approach for Measuring or
Estimating
Data Needed
Data Collection Approach
1. Cost savings to courts due to reduction in numbers of proceedings that are commenced.
Measure attrition rates of proceedings pursued by “pre-litigation consults” of PBO. (See Preliminary Study by PBO).
• Measured or estimated percentage of cases in which client decided not to proceed after being advised by a PBO lawyer that it would be imprudent to do so.
• Average cost of types of proceedings that otherwise would have been required.
Review of court records - Same approach as used by PBO in “Preliminary Study.”
4 Note that cases handled by PBO in FY 2013-2014 were chosen as the sampling frame for the court case file review
to ensure that the 2-year statute of limitations on filing a claim would have run out by the time of the review in mid-
The Resource for Great Programs, Inc. 526 West 14th Street, Suite 164 Traverse City, MI 49684 Phone: (231) 947-3280 www.GreatPrograms.org
Page 6
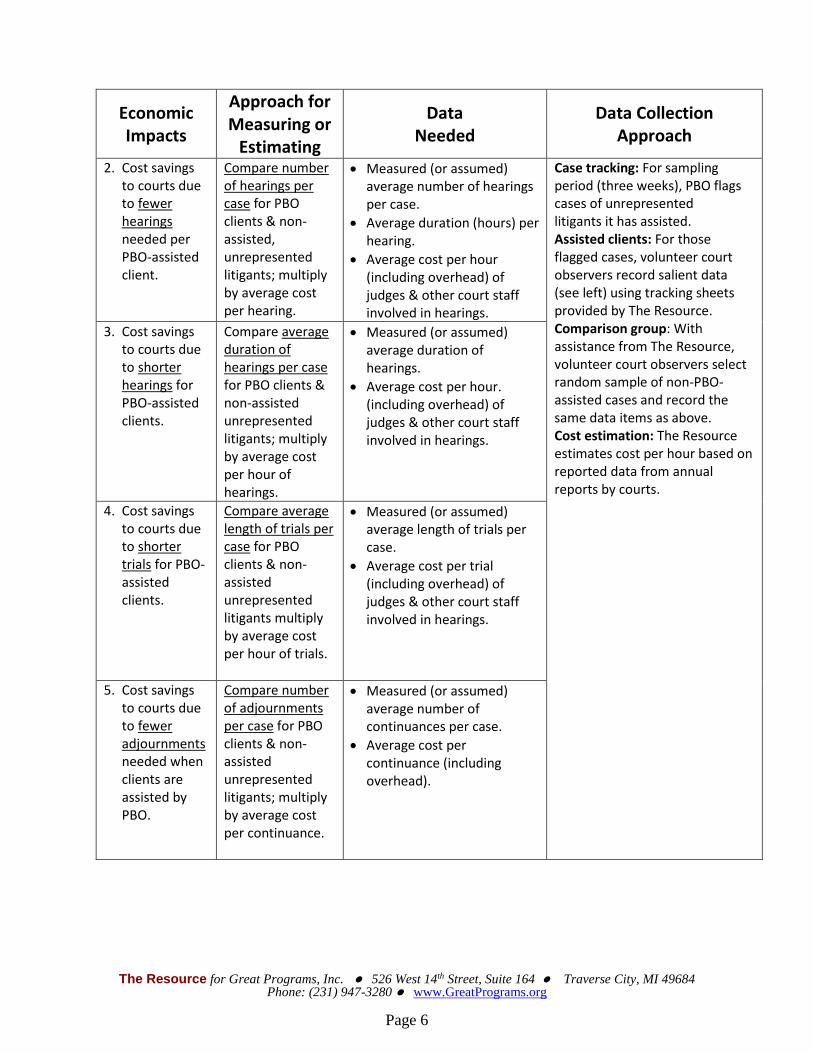
Economic Impacts
Approach for Measuring or
Estimating
Data Needed
Data Collection Approach
2. Cost savings to courts due to fewer hearings needed per PBO-assisted client.
Compare number of hearings per case for PBO clients & non-assisted, unrepresented litigants; multiply by average cost per hearing.
• Measured (or assumed) average number of hearings per case.
• Average duration (hours) per hearing.
• Average cost per hour (including overhead) of judges & other court staff involved in hearings.
Case tracking: For sampling period (three weeks), PBO flags cases of unrepresented litigants it has assisted. Assisted clients: For those flagged cases, volunteer court observers record salient data (see left) using tracking sheets provided by The Resource. Comparison group: With assistance from The Resource, volunteer court observers select random sample of non-PBO-assisted cases and record the same data items as above. Cost estimation: The Resource estimates cost per hour based on reported data from annual reports by courts.
3. Cost savings to courts due to shorter hearings for PBO-assisted clients.
Compare average duration of hearings per case for PBO clients & non-assisted unrepresented litigants; multiply by average cost per hour of hearings.
• Measured (or assumed) average duration of hearings.
• Average cost per hour. (including overhead) of judges & other court staff involved in hearings.
4. Cost savings to courts due to shorter trials for PBO-assisted clients.
Compare average length of trials per case for PBO clients & non-assisted unrepresented litigants multiply by average cost per hour of trials.
• Measured (or assumed) average length of trials per case.
• Average cost per trial (including overhead) of judges & other court staff involved in hearings.
5. Cost savings to courts due to fewer adjournments needed when clients are assisted by PBO.
Compare number of adjournments per case for PBO clients & non-assisted unrepresented litigants; multiply by average cost per continuance.
• Measured (or assumed) average number of continuances per case.
• Average cost per continuance (including overhead).
The Resource for Great Programs, Inc. 526 West 14th Street, Suite 164 Traverse City, MI 49684 Phone: (231) 947-3280 www.GreatPrograms.org
Page 7
Economic Impacts
Approach for Measuring or
Estimating
Data Needed
Data Collection Approach
6. Cost savings to courts due to fewer front-desk staff needed for processing unrepresented litigants when they are assisted by PBO.
Compare average length of time spent per litigant for front-desk staff to process non-assisted unrepresented litigants versus those who had been helped by PBO; multiply by average cost per hour of front-desk staff.
• Measured (or assumed) average length of time spent by front-desk staff per litigant.
• Average cost per hour (including overhead) of front-desk staff who process unrepresented litigants.