18
Revamping Gurgaon Electricity Scenario By Mr. Praveer Sinha Date 20.02.2013

Revamping Gurgaon Electricity Scenario
By Mr. Praveer Sinha
Date 20.02.2013
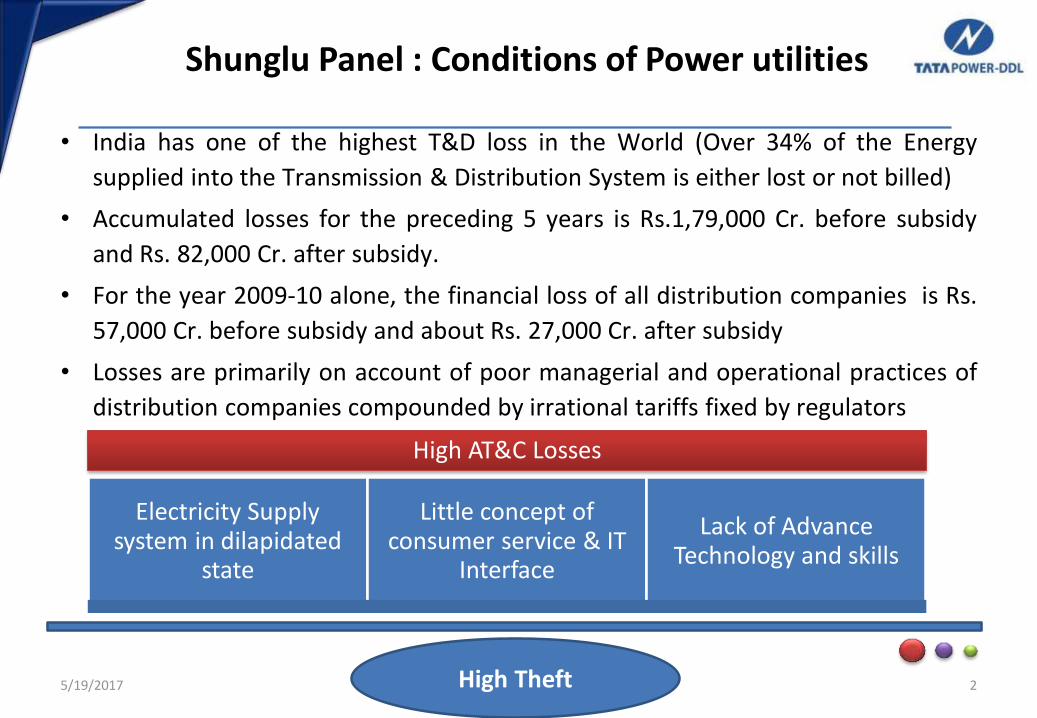
Shunglu Panel : Conditions of Power utilities
• India has one of the highest T&D loss in the World (Over 34% of the Energy
supplied into the Transmission & Distribution System is either lost or not billed)
• Accumulated losses for the preceding 5 years is Rs.1,79,000 Cr. before subsidy
and Rs. 82,000 Cr. after subsidy.
• For the year 2009‐10 alone, the financial loss of all distribution companies is Rs.
57,000 Cr. before subsidy and about Rs. 27,000 Cr. after subsidy
• Losses are primarily on account of poor managerial and operational practices of
distribution companies compounded by irrational tariffs fixed by regulators
5/19/2017 2
High AT&C Losses
Electricity Supply system in dilapidated
state
Little concept of consumer service & IT
Interface
Lack of Advance Technology and skills
High Theft
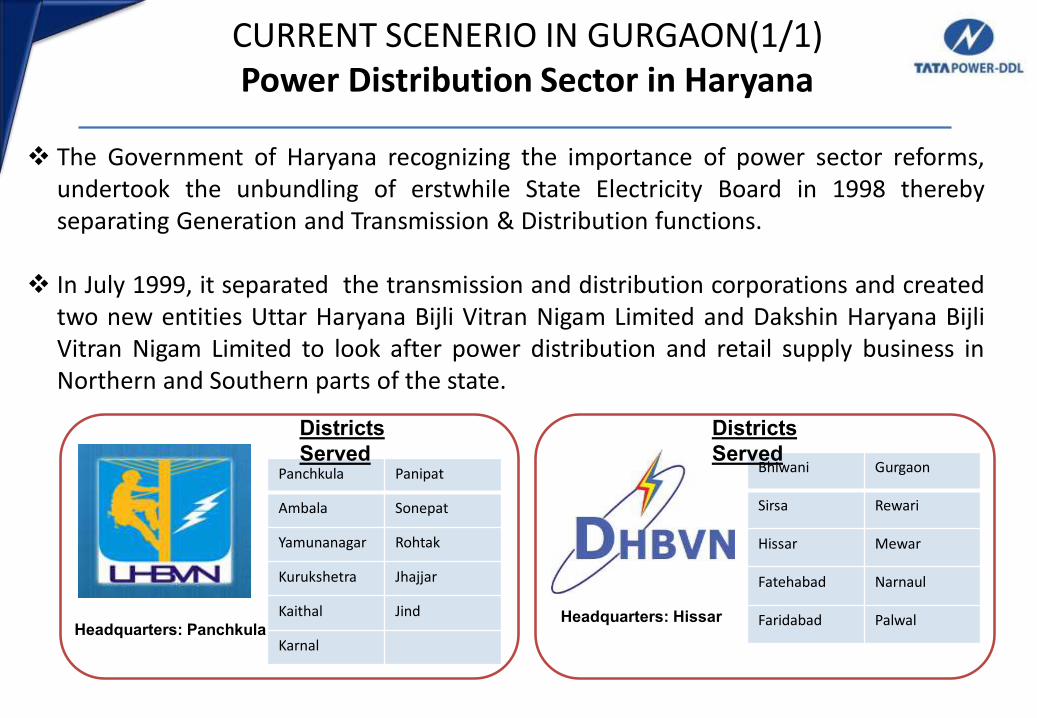
CURRENT SCENERIO IN GURGAON(1/1)Power Distribution Sector in Haryana
The Government of Haryana recognizing the importance of power sector reforms,undertook the unbundling of erstwhile State Electricity Board in 1998 therebyseparating Generation and Transmission & Distribution functions.
In July 1999, it separated the transmission and distribution corporations and createdtwo new entities Uttar Haryana Bijli Vitran Nigam Limited and Dakshin Haryana BijliVitran Nigam Limited to look after power distribution and retail supply business inNorthern and Southern parts of the state.
Panchkula Panipat
Ambala Sonepat
Yamunanagar Rohtak
Kurukshetra Jhajjar
Kaithal Jind
Karnal
Districts Served
Headquarters: PanchkulaHeadquarters: Hissar
Bhiwani Gurgaon
Sirsa Rewari
Hissar Mewar
Fatehabad Narnaul
Faridabad Palwal
Districts Served

CURRENT SCENERIO IN GURGAON(1/2)Profile
Particulars Gurgaon DHBVN
Area (sq. km.) 1253 23, 934
Districts (nos.) - 10
Consumers (in lakhs) 4.43 23.70
Revenue in 2011-12 (in Rs. Cr.) 1940 4800
AT&C Losses (%) 12.06 24.15
Domestic 229961 1043427
Non-Domestic 33779 124583
Agriculture Metered 6123 105788
IndustrialLT 8399 30132
HT 2714 5848
Others 2392 8077
CO
NSU
MER
SO
VER
VIE
W
• Gurgaon’s power demand is growing at the rate 15 to 20 %.
• Gurgaon circle contributes 33% of the load and 40% of the revenue of DHBVN
• 72 % of commercial load under DHBVN comes from Gurgaon circle alone
• Load Profile : 32 % domestic , 33% commercial , 31 % industrial and 4 % agriculturesegment
• DT Metering at 9%
• DG Capacity of 2000 MW – 80% is commercial & industrial
Source : http://www.dhbvn.com

CURRENT SCENERIO IN GURGAON(1/3)Key Issues
• AT&C Loss is at 12.80% with one of the division having AT&C losses at 83%• Escalating Power Deficits – shortage of minimum 150 MW in peak seasons , over
dependency on DG’s• Poor network conditions• Dependency on captive generation• Rampant Theft & poor metering of DT’s• Lack of Performance Management System• Inadequate IT penetration• Mismatch in consumer expectations with increasing tariff• Inefficient energy usage practices• Consumer unrest on account of lack of reliable services
5

PPP MODEL ADOPTED IN DELHI (2/1)Reforms Structure
5/19/2017 6
• License-based Regulated business for 25 years
• AT&C target prefixed for 5 years as per bid
• Guaranteed 16% RoE on meeting AT&C Targets.
• Overachievement gains shared with consumers.
• Tariff set by regulator on cost plus RoE
• Power purchase payment on
residuary principles
• Financial support of approx. 630 Mn
USD by Govt. to DTL to cover shortfall
of DTL till March 07 for all Discoms
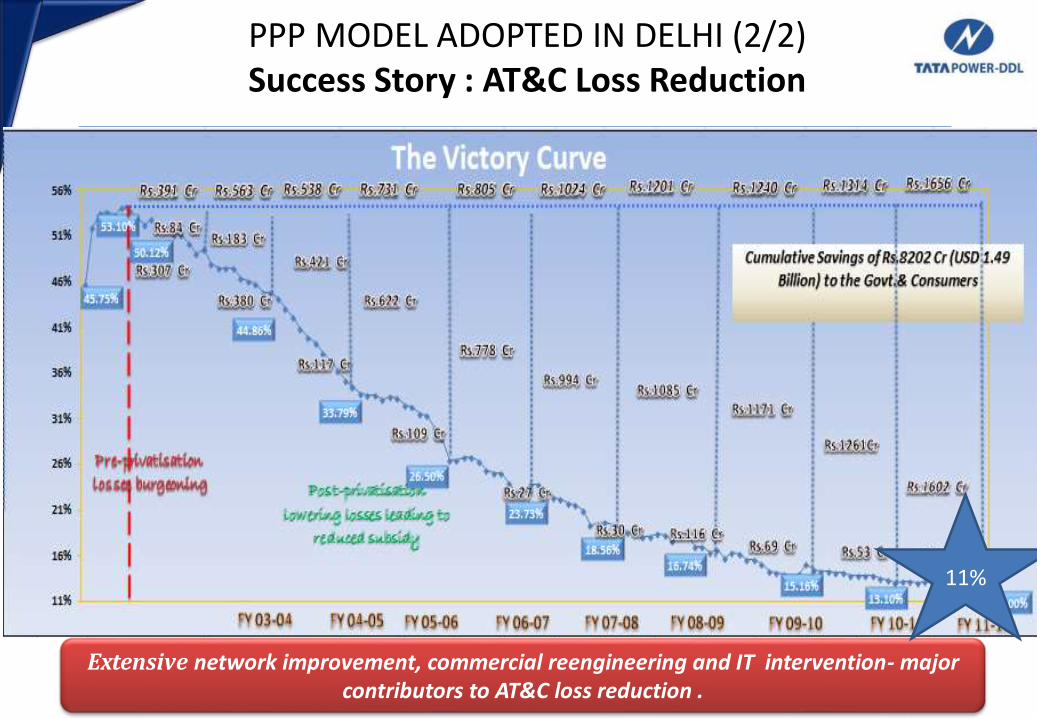
PPP MODEL ADOPTED IN DELHI (2/2)Success Story : AT&C Loss Reduction
Extensive network improvement, commercial reengineering and IT intervention- major contributors to AT&C loss reduction .
11%

PPP MODEL ADOPTED IN DELHI (2/3)Our Turnaround Story
8
Parameter UoM
Jul-02
(On
takeover)
2011-12 % change
AT&C Losses % 53.1 11 77%
System Reliability – ASAI % 70 99.2 42%
Transformer Failure Rate % 11 0.8 93%
Peak Load MW 930 1401 51%
Length of Network Ckt. Km 6750 10253 51.8%
Street Light Functionality % 40 99.3 148%
Payment Collection
AvenuesNos. 20 4599 22895%
Consumer Satisfaction Index - 88

PPP MODEL ADOPTED IN DELHI (2/4)Customer Service Standards
5/19/2017 9
Parameter UoMJul-02
(On takeover)2011-12 % change
Mean Time To Restore Supply Hrs. 5.2 1.3 75%
Street Light restoration within 48
hrs.% 50
99.70 (90%
completed within
24 hrs)
99%
New Connection Energization
TimeDays 51.8 6 88%
Faulty Meter Replacement Days 25 7 72%
GIS Smart Feeder Architecture9
SCADA

PPP MODEL ADOPTED IN DELHI (2/5) Key Initiatives
• Key initiatives to reduce losses : HVDS Implementation, Spot Billing, InstantConnections , LT ABC, Energy Auditing upto 4 level , GSM Based AMR, MassRaids Replacement of Electromechanical meters with Electronic meters,creation of Special Consumer Group to take of Jhuggi Jhopri residents etc..
• Key Technologies adopted: integrated GIS, SCADA, OMS, DMS,DA,AMI,SAPISU etc..
• Key initiatives to enhance consumer services like Integrated Call Centre, 24x7Payment avenues, Client Managers, Dedicated consumer meets, SMS Basedpull services, 14 Fully networked consumer care centers, Video Conferencingfor Consumers etc..
5/19/2017 10

“WAY FORWARD”
5/19/2017 11

WAY FORWARD(3/1) PPP Model
5/19/2017 12
A Sub Group Of Planning Commission on ‘Public Private Partnership in theDistribution of Electricity’ headed by Sh. B.K. Chaturvedi has stated in its reportsubmitted in Oct’ 2011-
“….. a well formulated PPP model could be the way forward.”
“ …… It was felt that PPP framework would be in consonance with the ElectricityAct and would also obviate the shortcomings of the Franchise Model.”
“… After detailed deliberations the Sub-Group felt that Public Private Partnership inthe distribution of the electricity was clearly the way forward”
The Shunglu Committee report on ‘Financial Position of Distribution Utilities’ has
also endorsed PPP for its high loss reduction and better performance.

WAY FORWARD(3/2) PPP Model
5/19/2017 13
….Well formulated PPP model is best suited for moving forward with the reform process in Uttar Pradesh & provide suitable solution to consumer needs
Reliable SupplyBased on requirement Licensee canprocure additional energy subject toregulatory approval.
Current legal framework doesnot support Franchisee forprocuring additional power.
Network Strengthening
Capital investment can be made forimprovement of the networkinfrastructure subject to approval byregulator.
Present model does notsupport huge capitalinvestment in networkinfrastructure by Franchisee.
Consumer Convenience
Performance parameters withregulatory oversights are built into theLicense conditions as per provisions ofAct.
As Franchise is just a merecontractor under the DISCOM,so regulator can not monitorthe performance .
PPP Model Franchisee

WAY FORWARD(3/3) PPP Model
5/19/2017 14
Performance Management System
AT&C Loss Reduction
Non Adoption of latest
technologies
Employee Engagement
Installation of electronic meters, AMR, GIS
Indexing, Energy Auditing, HVDS, Proactive
enforcement, offline & online payment modes
SCADA, DMS, OMS, Pre- Paid metering, AMI,
Unmanned Grids etc.
Dilapidated network condition Drives to clean network esthetics, proactive
maintenance etc..
The Shunglu Committee report on ‘Financial Position of Distribution Utilities’ has also endorsed PPP for its high loss reduction and better performance.

WAY FORWARD(3/3) Smart Grid : Vision 2020
15

THANK YOU
5/19/2017 16

5/19/2017 17
State Utility AT&C Loss (%)
Delhi BSES Rajdhani 17.26
BSES Yamuna 19.74
TPDDL 12.50
Delhi Total 15.76
Haryana DHBVNL - overall 26.29
DHBVNL - Gurgaon 14.85
UHBVNL 29.85
Haryana Total 28.02
Himachal Pradesh HPSEB, HPSEB Ltd 15.72
Jammu & Kashmir J&K PDD 72.86
Punjab P5PCL 17.47
Rajasthan AWNL, JWNL, JDWNL 24.19
Uttar Pradesh 40.29
Uttarakhand Ut PCL 28.48
Northern Total 28.91
National Total 26.15
AT&C LOSSES (FY11)- NORTHERN REGION
BACK
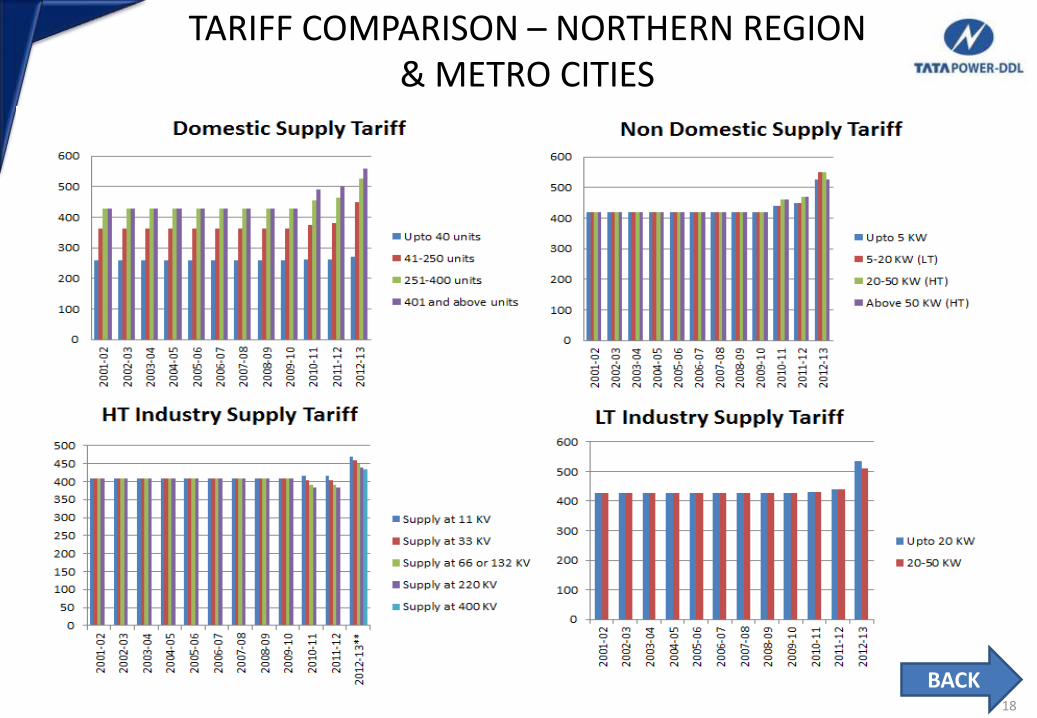
TARIFF COMPARISON – NORTHERN REGION & METRO CITIES
18
States/ Discoms Domestic - 5 KW Commerci
al - LT - 10
KW
Industrial
- LT - 10
KW -
Industrial
HT -100
KW/108
KVA -
Supply at
11 kV
Last Tariff Order
Date/Effective
From
Units-> 200 400 1000 1500 1500 15000
Haryana - Gurgaon 414 460 520 550 535 564 1st Apr 2012
Delhi 420 485 584 827 778 720 1st July 2012
Mumbai – BEST 420 496 704 940 865 893 1st Jun 2012
Karnataka 470 515 542 743 513 640 30th Apr 2012
Punjab 479 522 557 603 510 561 1st Apr 2012
Uttar Pradesh 508 444 406 728 735 770 19th Oct 2012
Rajasthan 516 517 516 666 518 651 9th Aug 2012
Madhya Pradesh 534 581 630 657 480 672 1st Apr 2012
Kolkata 586 652 738 780 621 796 1st Dec 2012
BACK


