1School of Geography and Tourism, Shaanxi Key Laboratory of Tourism Informatics, Shaanxi Normal University, Xi'an, China2State Key Laboratory of Information Engineering in Surveying, Mapping and Remote Sensing, Wuhan University, Wuhan, China3Department of Land Surveying and Geo- Informatics, The Hong Kong Polytechnic University, Kowloon, Hong Kong4Shenzhen Institutes of Advanced Technology, Chinese Academy of Sciences, Shenzhen, China5National & Local Joint Engineering Research Center of Geo- spatial Information Technology, Fuzhou University, Fuzhou, China
CorrespondenceZhixiang Fang, State Key Laboratory of Information Engineering in Surveying, Mapping and Remote Sensing, Wuhan University, Wuhan 430079, China.Email: [email protected]
Funding informationNational Natural Science Foundation of China, Grant/Award Number: 41801373, 41771473 and 41901390; Open Research Fund Program of LIESMARS, Grant/Award Number: 20S03; Shaanxi science and technology program, Grant/Award Number: 2019ZDLSF07- 04; Fundamental Research Funds for the Central Universities, Grant/Award Number: #2042020kfxg24
AbstractThe emergence of large- scale human spatiotemporal trac-ing data inspired researchers to investigate human mobil-ity patterns from different perspectives with potential implications for urban planning, traffic management, and emergency response. Previous studies investigated the mechanism of human mobility by constructing spatial mobil-ity motifs based on mobile phone datasets, but ignored their temporal characteristics. To compensate for this, this study extracted temporal stay patterns based on spatial mobility motifs. Using mobile phone location data from Shenzhen, China, we identified stop location sequences for users and constructed home- based mobility motifs according to pre-defined rules, and observed that approximately 97% of users can be characterized by the 10 identified home- based mobility motifs. We designed a method to quantify the similarity of temporal stay characteristics, and the primary temporal stay patterns were extracted by classifying users with similar stay rhythms. Our results enrich the knowledge of human travel behavior from both spatial and temporal perspectives.
Human mobility patterns have attracted significant attention from researchers in different fields, including trans-portation, geography, and computer science. Inhabitants commonly display mobility patterns over urban spaces to fulfill their daily requirements, resulting in human movements from morning till night. Urban managers strive to make cities smarter, planning well- suited infrastructures that can provide better services to citizens. A deep understanding of human mobility patterns could give an insight into how people utilize urban space, whether the construction of urban infrastructure is reasonable, and what measures could be implemented to optimize the ex-isting resources and improve service efficiency. Therefore, investigating human mobility patterns would result in enormous potential implications for urban planning (Gao, 2015; Jia, Du, Wang, Bai, & Fai, 2019; Long, Han, Tu, & Shu, 2015; Ratti, Frenchman, Pulselli, & Williams, 2006), traffic management and forecasting (Barbosa et al., 2018; Chen, Ma, Susilo, Liu, & Wang, 2016; Fang, Yang, Xu, Shaw, & Yin, 2017), and emergency management such as preventing disease transmission (Lai, Farnham, Ruktanonchai, & Tatem, 2019; Yin et al., 2019).
In the past decade, large- scale human geo- spatial tracing data have become more abundant and available, with the rapid development of information and communication technology (Ben- Elia & Zhen, 2018; Chen et al., 2016; Shaw, Tsou, & Ye, 2016; Wang, He, & Leung, 2018; Yue, Lan, Yeh, & Li, 2014), which opens up new pathways to examine the collective human mobility patterns and their relationship with urban space on a more comprehensive level (Chen et al., 2016; Liu, Liu, et al., 2015; Shaw & Sui, 2019; Toch, Lerner, Ben- Zion, & Ben- Gal, 2019; Wang et al., 2018). Therefore, the literature covers a great diversity of topics, including but not limited to human spatio-temporal dynamics and their quantitative relationship with the built environment (Andrienko et al., 2010; García- Palomares, Salas- Olmedo, Moya- Gómez, Condeço- Melhorado, & Gutiérrez, 2018; Gong, Lin, & Duan, 2017; Kang & Qin, 2016; Yang, Fang, Yin, et al., 2019), urban spatial structure and interaction characteristics (Liu, Gong, Gong, & Liu, 2015; Louail et al., 2015; Liu, Gao, & Lu, 2019; Yang, Fang, Xu, et al., 2019), land functional detection (Pei et al., 2014; Ríos & Muñoz, 2017; Toole, Ulm, Bauer, & Gonzalez, 2012; Tu et al., 2017), origin– destination flow estimation (Alexander, Jiang, Murga, & González, 2015; Bachir, Khodabandelou, Gauthier, El Yacoubi, & Puchinger, 2019), and human activity space and social segregation (Xu et al., 2016; Xu, Belyi, Santi, & Ratti, 2019; Yuan & Raubal, 2016).
In fact, an individual daily trajectory is composed of both motions and stops. A stop indicates that the indi-vidual stayed at the same location or a predefined spatial area during a particular time period, which indicates that the person may have participated in some activity at the location (Zhao et al., 2018). Based on the individ-ual daily stop location sequence, a pioneering work constructed travel networks for thousands of individuals, and 17 unique networks, called motifs, were extracted that uncover daily mobility patterns (Schneider, Belik, Couronné, Smoreda, & González, 2013). Thereafter, some literatures extend along this line of work by character-izing the relationship between motifs and travel distance (Cao, Li, Tu, & Wang, 2019; Schneider, Rudloff, Bauer, & González, 2013), and inferring activity patterns for trip chains using land use and survey data (Jiang, Ferreira, & Gonzalez, 2017; Widhalm, Yang, Ulm, Athavale, & González, 2015) and extracting work tour motifs (Joy & Samundeeswari, 2018). However, motifs could only generalize the mechanism of human mobility patterns from the perspective of a spatial stop location sequence, whereas temporal stay characteristics at stop locations are neglected in the process of extracting motifs. For each stop location, temporal attributes include start time, end time and duration of the stay, which indicates the potential characteristics of activity and can be utilized to label the activity type (Yin, Sheehan, Feygin, Paiement, & Pozdnoukhov, 2017). Kovanen, Karsai, Kaski, Kertész, and Saramäki (2011) introduced a framework to model temporal motifs by analyzing the topological– temporal struc-ture of event sequences in a large mobile carrier network, but this work mainly discussed the statistical traits of temporal motifs rather than the temporal stay patterns, which reveal how people arrange their daily life at each stop location.
Human activities have been a research topic for a long time. Anthropologists and sociologists have made consid-erable efforts to develop human activity theories to characterize individual everyday life (Kalekin- Fishman, 2013;
| 3YANG et Al.
Karpatschof, 2000; Löfgren, 2015; Prato & Pardo, 2013). For example, Vagni and Cornwell (2018) analyzed a large collection of long- term diary data from 23 countries and observed the re- emergence of common sets of sequential human activity patterns, even though they were associated with vastly different contexts. Such studies primarily emphasize daily activity behavior, which enhances our understanding of how people organize their daily activities, thus explaining the underlying mechanism of these activity behaviors from the perspectives of anthropology and sociology. Daily life is composed of activity behavior and travel behavior, which respectively correspond to the stopping and movement of individual trajectories. A comprehensive analysis of individual spatiotemporal trajectories attempts to examine spatial displacements among individual daily stop locations in urban spaces and their changes over time in order to further enhance our understanding of how people exploit urban spaces. In this study, the spatial aim is to examine how people move among daily stop locations during the day; this is inspired by previous studies on spatial mobility motifs (Cao et al., 2019; Schneider, Belik, et al., 2013). The temporal motiva-tion for the study is to reveal how people schedule their time at such spatial stop locations during a day, and inves-tigate whether there are primary temporal stay patterns within each spatial mobility motif pattern. The results of the present study could provide an in- depth understanding of human travel behavior based on an integration of spatial motifs and their temporal stay characteristics.
Considering two individuals belonging to the same human mobility motif pattern, they may exhibit completely different temporal characteristics, which demonstrate different stay rhythms even in the same spatial motif. Therefore, the aim of the present study was to extract the temporal stay characteristics of human mobility motifs by investigating the potential primary temporal stay patterns within each spatial motif. The main contribution of this study can be concluded from the following two aspects. First, an individual stop location sequence is iden-tified for each user based on the movement trajectory generated by mobile phone data of Shenzhen, China. The home- based mobility motifs are then constructed from the stop location sequences according to the predefined rules. Second, a method is designed to quantify the similarity of daily stay rhythms between users by combining the temporal characteristics at the corresponding stop locations and number of stops. Based on the similarity of stay characteristics, we group the users with similar stay rhythms to extract the primary temporal stay patterns for each motif.
The remainder of this article is organized as follows. The study area and mobile phone data used in this study are introduced in Section 2. Section 3 describes the main methodology, ranging from identifying stop location sequences and constructing home- based mobility motifs to extracting temporal stay patterns for each motif. The results and discussion of the temporal stay patterns are given in Section 4. Finally, we present the conclusions of this study and discuss the limitations and future work directions in Section 5.
2 | STUDY ARE A AND DATA SET
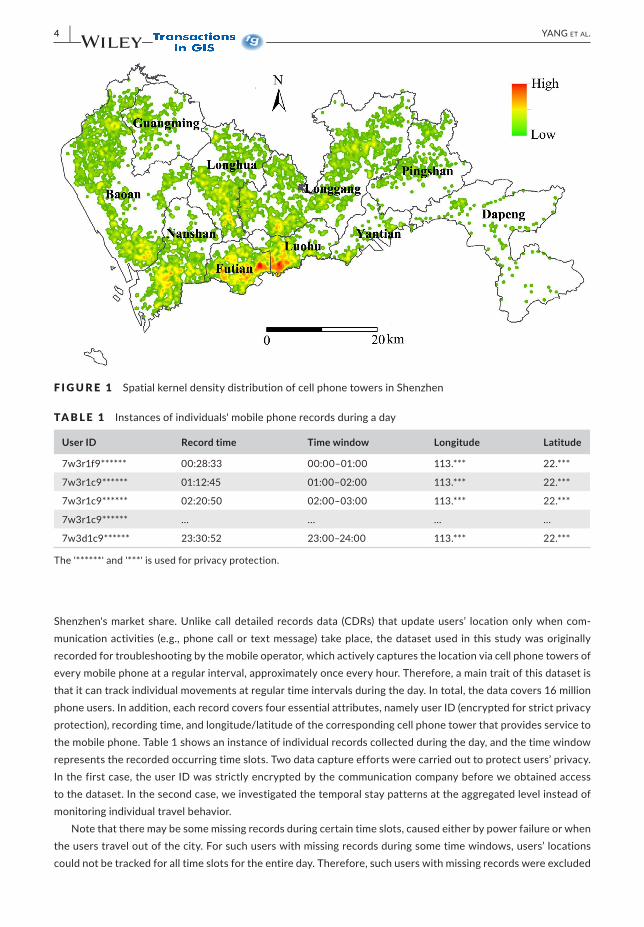
The mobile phone data used in this study come from a famous megacity, Shenzhen, which is located in south-eastern China and is adjacent to Hong Kong. As a first beneficiary of the reform and opening- up policy in China, Shenzhen has experienced rapid and unprecedented development. Nowadays it is a national economic, financial, technological, and innovative center and has become one of the largest cities in China. Currently, Shenzhen covers an area of approximately 2,000 km2 and includes 10 administrative districts, which can be further classified into downtown areas (including Futian, Luohu, and Nanshan districts), suburbs (including Banan, Longhua, Longgang, and Yantian districts), and rural areas (including Guangming, Pingshan, and Dapeng districts), based on the degree of economic development (Figure 1). Due to its open and advanced policies, many migrant workers from other provinces seek job opportunities in the city. Shenzhen has an actual managed population of approximately 20 mil-lion, which makes it one of the most densely populated Chinese cities.
The mobile phone data were collected on a typical workday in 2012 from a main mobile phone operator company (China Mobile Communications Group Company Limited, CMCC), which controls more than 60% of
4 | YANG et Al.
Shenzhen's market share. Unlike call detailed records data (CDRs) that update users’ location only when com-munication activities (e.g., phone call or text message) take place, the dataset used in this study was originally recorded for troubleshooting by the mobile operator, which actively captures the location via cell phone towers of every mobile phone at a regular interval, approximately once every hour. Therefore, a main trait of this dataset is that it can track individual movements at regular time intervals during the day. In total, the data covers 16 million phone users. In addition, each record covers four essential attributes, namely user ID (encrypted for strict privacy protection), recording time, and longitude/latitude of the corresponding cell phone tower that provides service to the mobile phone. Table 1 shows an instance of individual records collected during the day, and the time window represents the recorded occurring time slots. Two data capture efforts were carried out to protect users’ privacy. In the first case, the user ID was strictly encrypted by the communication company before we obtained access to the dataset. In the second case, we investigated the temporal stay patterns at the aggregated level instead of monitoring individual travel behavior.
Note that there may be some missing records during certain time slots, caused either by power failure or when the users travel out of the city. For such users with missing records during some time windows, users’ locations could not be tracked for all time slots for the entire day. Therefore, such users with missing records were excluded
F I G U R E 1 Spatial kernel density distribution of cell phone towers in Shenzhen
TA B L E 1 Instances of individuals' mobile phone records during a day
User ID Record time Time window Longitude Latitude
The '******' and '***' is used for privacy protection.
| 5YANG et Al.
and mobile phone users with at least one record at each time slot were selected. Finally, 6.5 million mobile phone users (approximately 40% of total users) were identified for use in the study of temporal stay patterns of human mobility. The individual mobile data- tracking records were located based on cell phone towers; therefore, the spatial resolutions depended on the spatial distributions of cell phone towers across the city. Generally, the cell phone towers are densely distributed in urban areas and sparsely scattered in the outskirts; hence, positioning accuracy ranges from dozens of meters in downtown areas to kilometers in suburban areas. More than 5,900 cell phone towers were extracted from the dataset; the minimum, average, and maximum service radius of the cell phone towers are 17.10, 325.28, and 2,037.57 m, respectively. Figure 1 shows the study area and the kernel den-sity distribution of the cell phone towers.
3 | METHODOLOGY
3.1 | Identifying stop location sequence from movement trajectory
Generally, moving and stopping make up the daily trajectory of an individual (Figure 2). Contrary to the infor-mation from the travel survey dataset that interviewees reported about their trips and activities (e.g., location, duration time, and activity types), there is no additional information in the mobile phone dataset except for the location. Therefore, a crucial step in analyzing human temporal stay patterns is to identify stops from movement trajectories. In this study, a stop is identified when an individual stays at the same location (cell phone tower) during certain time slots. The stop may indicate a meaningful activity (e.g., sleeping or shopping) occurring at the location. Previous literature has proposed frameworks to identify meaningful places or anchor points based on the CDRs dataset (Ahas, Silm, Järv, Saluveer, & Tiru, 2010; Isaacman et al., 2011), but it does not perform well as a short- term and regular sampling dataset. Therefore, we designed a method to identify stops based on the spatial and temporal sampling characteristics of this dataset.
First, an individual trajectory is constructed by connecting all updating records in chronological order (Figure 2):
where n represents the total number of tracing points, lati and loni the latitude and longitude, respectively, of the cell phone tower providing the signal service for the phone at time ti.
(1)T ={p1, p2, …, pi, …, pn
}, pi =
(lati, loni, ti
)
F I G U R E 2 (a) Individual space- time trajectory diagram; and (b) A real trajectory with a map
6 | YANG et Al.
Second, we scan these tracing points from the first record to the last record one by one. For every two adjacent records, if the locations are the same, this means that a stop may have occurred during the period. Considering that the time interval between two consecutive tracing records was approximately 1 hr, as shown in Table 1, we identified a stop when it met the follow conditions: (1) a set of consecutive tracking records occurring in the same cell phone tower; (2) the time interval between first record and last record is greater than 30 min, which indicates that the minimum duration of stay at the cell phone tower is 30 min. The specific formula can be denoted as follows:
Here, ti and ti+m represent the start time and end time of the stop, respectively, and the time difference be-tween them indicates the duration of the stop. This way, we can identify the stop sequence for each phone user during the day, which is denoted as follows:
where sti and eti represent the start and end times of the ith stop, respectively.
3.2 | Construction of home- based mobility motifs
Based on the extracted stop sequence, an individual daily travel directed network can be constructed by con-necting these visited locations using directed edges (red lines with arrows in Figure 2). Human mobility motifs can be extracted from these individual travel networks to uncover the ubiquitous daily mobility patterns in the city. A motif can present a unique underlying mechanism of daily travel behavior frequently appearing among urban citizens (Schneider, Belik, et al., 2013). An underlying assumption for extracting motifs is that a user starts and fin-ishes their day at home, thus identifying individual home location as a key step before extracting motifs. Referring to the literature (Yang et al., 2018), if a stop occurred between 00:00 and 06:00, and the duration is longer than 4 hr, then the location of the stop can be considered as a person's home. Only mobile phone users whose home can be identified are involved in the extraction of motifs, denoted as home- based motifs. In addition, the motifs are constructed according to the following two rules:
(1) If the last stop location is not the user's home, we append a home location at the end of a stop location sequence. As shown in Figure 3a, the extracted stop sequence from the moving trajectory is h → l1 → l2, and then we add the home location to the end of the sequence, to obtain h → l1 → l2 → h, which conforms to the assumption that a user starts and finishes their day at home.
(2) For a stop sequence, if there are two or more contiguous stops occurring at the same location, these stops can be considered as one stop in constructing an individual travel network. For example, if a stop sequence h → l1 → l1 → l2 → h is detected based on an individual moving trajectory (Figure 3b), the two contiguous stops A would be merged into one stop, and the generated travel network would then become h → l1 → l2 → h.
According to the above rules, individual travel networks can be constructed for mobile phone users, and human mobility motifs extracted from these travel networks to uncover the frequent mobility patterns of citizens (Cao et al., 2019).
3.3 | Extracting temporal stay patterns for each mobility motif pattern
Although the motifs can indicate the underlying mechanism of how people travel and perform activities during the day, they only reveal the human stay patterns from a spatial perspective and lose any insights into the temporal patterns. For example, users i and j have the same travel motif, but their time spent at the stop locations is dif-ferent, which indicates their different stay rhythms (Figure 4). Therefore, investigating temporal stay patterns for each motif can further give an understanding of how people arrange their daily time among these stop locations. This section introduces a method to extract the temporal stay patterns for each mobility motif pattern. To facili-tate interpretation, the symbols and their descriptions are listed in Table 2.
Each mobility motif pattern can be denoted by a location sequence L = {l1 → l2 → ⋯ → lm → ⋯ → lM}, where lm represents the user's mth stop location of the day and M represents the total number of stop locations. A com-mon characteristic for users with the same motif pattern is that they have the same number of locations in their sequences. Suppose there are two users i and j with the same motif pattern, and their location sequences are
F I G U R E 3 Two examples of space- time trajectories under different scenarios. h represents the identified home location for a mobile phone user, and l1 and l2 are the other stop locations at which an individual stayed during the day
F I G U R E 4 Two space- time trajectories with different stay rhythms
8 | YANG et Al.
Li = {li1→ li
2→ ⋯ → li
m→ ⋯ → li
M} and Lj = {l
j
1→ l
j
2→ ⋯ → lj
m→ ⋯ → l
j
M}, respectively. The temporal stay similar-
ity between user i and user j can be measured by quantifying their time spent at each corresponding stop location (Lehmann, Alvares, & Bogorny, 2019). However, for each corresponding location lm, there could be more than one stay at the location. As shown in Figure 5, user j makes two stays at the mth location, while user i only has one stay. Hence, lj
m can be denoted as lj
m= {s1, s2, …, sp, …, sP}, and the corresponding start time stj
p and end time etj
p
of the stop can be generated based on individual stop sequence S. The similarity of stay time at location lm can be calculated as follows:
where P and Q represent the total number of stops in location lim and lj
m, respectively. The numerator represents the
duration of stay time intersection at location lm between user i and user j, and the denominator represents duration from earliest start time to latest end time between both users. The formula quantifies the extent of synchronization
(4)sim_timei,jm=
P∑p=1
Q∑q=1
min(etim,p
, etjm,q
) −max(stim,p
, stjm,q
)
max(etim,p
, etjm,q
) −min(stim,p
, stjm,q
)
TA B L E 2 Description of variables
Name Description
Li A set of stop location sequences in chronological order for user i
lim
Represents the mth stop location of user i during the day
sp Represents the pth stop at corresponding stop location
stip
The start time of the corresponding pth stop for user i
etip
The end time of the corresponding pth stop for user i
sim_timei,jm
Similarity of stay time at stop location lm between user i and user j
sim_timei,j The total similarity of stay time between the daily location sequence Li and Lj for users i and j, respectively
||Li|| The total number of stops for user i during the day
sim_NSi,j The similarity in the number of stops between user i and user j
Simi,j The similarity in daily rhythm between user i and user j based on both stay time and number of stops
F I G U R E 5 An illustration of different numbers of stays at the corresponding mth location lm for users i and j
| 9YANG et Al.
in stay time at location lm between user i and user j. The value of sim_timei,jm lies between zero and one. A greater value indicates more synchronization in stay time, which further indicates a more similar stay rhythm between user i and user j at location lm. Note that negative sim_timei,jm also indicates no intersection in stay time, so we set sim_timei,jm to be zero when it is negative. The total similarity of stay time between the location sequences Li and Lj can be calculated by summing the similarity at each location lm:
In addition to stay time, the number of stops during the day should be considered when comparing the daily rhythms of people. As shown in Figure 3a,b, although the two scenarios have the same mobility motif h → l1 → l2 → h, the number of stops in both scenarios is different. The number of stops in Figure 3a is 3, while the number of stops in Figure 3b is 5. The different number of stops indicates the difference in their daily rhythm, even though they fall under the same motif pattern. Therefore, it is necessary to consider the difference in number of stops when quanti-fying their temporal stay similarity. This study quantifies the difference in number of stops as follows:
where sim_NSi,j represents the similarity in the number of stops between user i and user j, and ||Li|| and |||Lj||| represent
the total number of stops for users i and j, respectively. The value of sim_NSi,j lies between zero and one, where a value of one indicates that the two users have the same number of stops during the day. By combining the stay time and the number of stops, the similarity of daily rhythm between user i and user j can be measured as:
The value of Simi,j lies between zero and one, and the stay rhythms are more similar when the value of Simi,j is closer to one. For each mobility motif pattern, the similarity of stay rhythm between users can be quantified using Equation (7), and the users can be divided into different groups according to their similarity. The users within the same group have more similar stay rhythms than those between groups. Generally, clustering approaches are uti-lized to execute the tasks of classification. However, the large scale of the mobile phone users dataset used in this study requires tremendous computing resources and memory, which makes it difficult to implement the clustering analysis efficiently using such traditional approaches. Therefore, instead of using clustering approaches, this study groups users with the same motif pattern using the following steps:
1. Users with the same motif pattern are stored in the set U = {u1, u2, …, ui, …, un}; an empty set C is built to store users who have been grouped; a threshold parameter � is given to determine whether two users are grouped into the same class.
2. A user ui is selected from the set U randomly and put into set C, and then deleted from set U, so U = U − ui.3. For each user in set U, the similarity between the user and all other users in set C is computed using Equation
(7). If all the similarity values are greater than the threshold parameter �, then put the user into set C and delete
(5)sim_timei,j =
M∑m=1
sim_timei,jm
(6)sim_NSi,j =min( ||Li|| , |||Lj
||| )max( ||Li|| , |||Lj
||| )
(7)
Simi,j= sim_NSi,j×sim_timei,j
=min( ||Li|| , |||Lj
||| )max( ||Li|| , |||Lj
||| )×
M∑m=1
P∑p=1
Q∑q=1
min(etim,p
, etjm,q
)−max(stim,p
, stjm,q
)
max(etim,p
, etjm,q
)−min(stim,p
, stjm,q
)
10 | YANG et Al.
it from set U. Repeat this process until all users in set U are traversed once. After that, the users in set C are considered as a group with similar stay rhythms and the similarity between the users is greater than the given threshold.
4. The set C is cleared, and steps (2) and (3) are repeated until the set U is empty, which indicates that all the users have been grouped.
4 | RESULTS AND DISCUSSION
4.1 | Overview of human stay characteristics
The stops are extracted for each phone user according to the method highlighted in Section 3.1, and a total of 5,189,724 users' home locations could be identified, containing 17,996,389 stops. The average number of stops for each user is approximately 3.5. Figure 6a gives a statistical percentage of the number of stops. It can be seen that the number of users with fewer than six stops during the day accounts for more than 97%, and it is appar-ent that the number of users with three and four stops is significantly larger than the others, reaching 23.2 and 24.4%, respectively. The number of locations indicate the number of total unique places a person visits. Note that a person may visit a place two or more times during the day, thus the number of locations visited by a person is less than or equal to the number of stops occurring during the day. Figure 6b shows that more than 93% of users visit no more than three places during the day. The proportion of users with two visiting places accounts for ap-proximately 42%, which indicates that these users are likely to have a two- point itinerary (home and workplace) during the day. Nearly 30% of users visited only one place during the day, which means that these users may have stayed at home throughout the day or undertaken activities in the area covered by the home- based cell phone tower. In Shenzhen, there is a large number of immigrants working in urban industrial parks, which provide ac-commodation for factory workers; therefore, such individuals often undertake their daily activities over relatively small spaces (Xu et al., 2016).
The start time, end time, and duration are the three basic traits for each stop. For each time slot, we calculated the percentage of users whose start and end times fall in this time slot (Figure 7). In terms of end time, three small wave peaks can be observed from the curve during the daytime, appearing at approximately 08:00, 12:00, and 18:00, respectively, and these three peaks correspond to the end of sleep, end of work in the morning, and end of day's work. A lagging phenomenon is observed in the curve of start time, and the three peaks which correspond
F I G U R E 6 The frequency distributions of: (a) stops; and (b) locations
| 11YANG et Al.
to the start of work in the morning (09:00), starting work after lunch in the afternoon (14:00), and starting to stay after returning home or going to a restaurant for dinner at the end of the day's work (19:00). Figure 8 illustrates the statistical distribution of the stay duration. The number of stops shows an overall descending trend with in-creasing stay duration, and the proportion of stops with duration less than 8 hr exceeds 80%. A conspicuous bulge appears when the duration is 23 hr, which may be caused by users who stay at home or nearby (service areas of cell phone tower labeled as home location) throughout the day.
Based on stay durations between 00:00 and 06:00, tower- based home locations could be identified from individual trajectories. A total of 3,183,121 users had identified home locations. Figure 9 illustrates the spatial distribution of home locations at the cell phone tower level. Compared to residential populations in national cen-sus data, the Spearman's correlation coefficient between identified home location and residential population was 0.946 at street block level (Yang et al., 2018), which indicates that the identification of users' home locations by examining the stay duration at a cell phone tower is feasible.
4.2 | Home- based mobility motifs
Figure 10 visualizes the primary unique home- based motif patterns and their probability distribution (probabil-ity > 0.5%). The colored dots are employed to differentiate the user's home location and other visited locations during the day. The statistical figures indicate that approximately 97% of users can be represented by the 10
F I G U R E 7 The percentage of users whose start times and end times fall within a single time slot
F I G U R E 8 Frequency distribution of stay duration
12 | YANG et Al.
identified motif patterns. These motif patterns give an insight into the daily human mobility profile. Consider the following two scenarios:
1. A person wakes up at 06:30, has breakfast at home (home location), takes a bus to their workplace (second location), stays there until the end of their day's work at 18:00, goes to a mall (third location) with friends to have dinner or do shopping and returns home at 21:00.
2. A person wakes up at 06:30 (home location), has breakfast at their favorite restaurant (second location) located along the route between their home and workplace, drives to their workplace (third location), works there from 09:00 to 18:00, and goes straight home.
Evidently, both daily mobility profiles in these scenarios can be characterized by the third motif pattern. Certainly, there are other scenarios that can be described by this motif pattern. Although the motif pattern has the capability to characterize spatial moving rules between visited locations, it is limited in terms of distinguishing the temporal stay in these visited locations. Therefore, the aim of this study is to investigate the temporal life rhythms for each motif pattern.
F I G U R E 9 The spatial distribution of identified home locations at the cell phone tower level. Thiessen polygon generated based on cell phone towers is used as service area
F I G U R E 1 0 The identified home- based mobility motifs. The number 2 on the arrow represents the corresponding trip occurring twice
| 13YANG et Al.
F I G U R E 11 Primary temporal stay patterns of motif M1. Red line represents the stay- at- home location and black line represents movement
14 | YANG et Al.
F I G U R E 1 2 The primary temporal stay patterns of motif M2. Red line represents the stay- at- home location, green line represents the second stay, and black line represents movement
| 15YANG et Al.
4.3 | Temporal stay patterns for each motif pattern
For each motif pattern, we utilized the proposed method to quantify the similarity of stay time between users who belong to this motif and grouped these users into different classes based on their similarity. The similarity threshold parameter � is determined to be 0.7 over repeated trials, which means that the similarity between users in the same class is greater than 0.7. To mitigate the effects of random selection in the second step of the grouping process, we executed the process repeatedly until all the users in the motif pattern had been grouped and selected groups contained more than 5% of the total users of the motif pattern. The selected groups are considered as the primary temporal stay patterns in the motif pattern. Consequently, for the 10 identified frequent motif patterns, one or more primary temporal stay patterns can be extracted from the six motif patterns M1, M2, M3, M4, M5, and M8, and there is no significant consistency in the stay patterns found in the other four motifs.
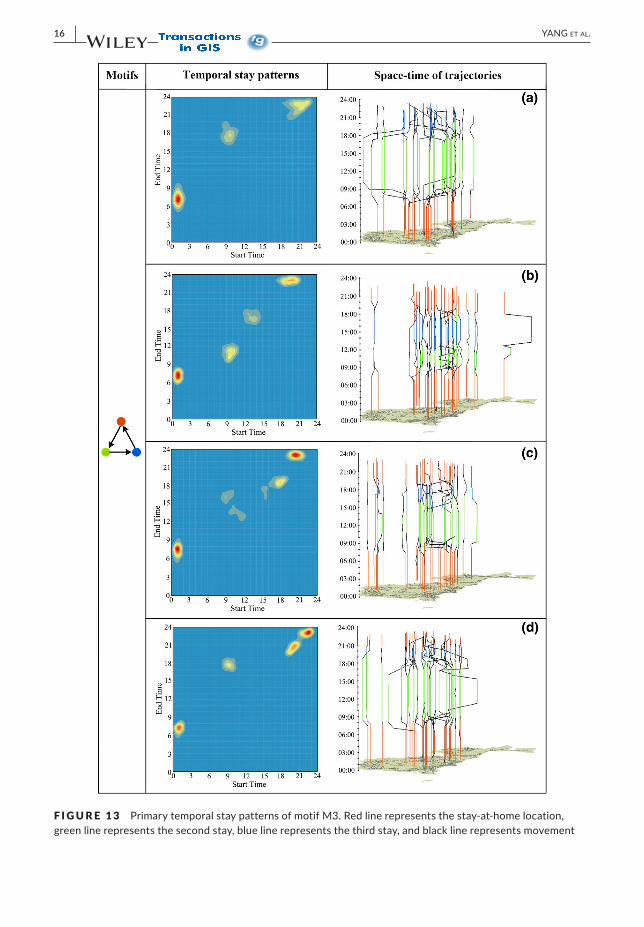
For each temporal stay pattern, a two- dimensional plane is used to present the temporal stay characteristics. The start and end times of each stay are viewed as a two- dimensional point coordinate (sti, eti) mapped onto the plane, where the horizontal and vertical axes represent the start and end times, respectively. The kernel density estimation of these points is employed to visualize the temporal rhythm of the pattern. More information about this visualization method can be found in the literature (Zhang & Liu, 2018; Zhang, Liu, & Wang, 2019). In addition to visualizing the temporal characteristics of each temporal stay pattern, we randomly selected 30 users from the pattern and constructed their real space- time trajectories in the city during the day.
Figure 11 illustrates the four primary temporal stay patterns of the motif M1. It is apparent that users be-longing to these four patterns are likely to spend most of the day staying in the service area of the cell phone towers identified as their home location, which demonstrates that there are no commuting movements, and these users may be housewives, retirees, or have the same home and work locations. Compared with the locations of users staying at home the whole day (Figure 11a), transitory movements are observed within the remaining three patterns (Figures 11b– d), and their occurrence times are approximately 08:00, 12:00, and 18:00, respectively. Although a trip takes place during the day, there are no other stay locations detected except for the home loca-tion. A possible reason for these movements is that these users may leave home to perform some activities (e.g., purchasing fast food or necessities) that do not require a long time.
Five primary stay rhythms are detected for the motif M2, with two stay locations during the day (Figure 12). As shown in Figure 12a, the time period of the first stay mainly happens between 00:00 and 08:00, when most peo-ple sleep at home. After that, people move to the second stay locations, where they stayed from approximately 09:00 until 22:00 in the evening. These stay locations are likely to be the users' workplaces who work overtime until 22:00. It is a known fact that many high- tech enterprises are gathered in Shenzhen, and information technol-ogy (IT) employees often get off work late. Figure 12b depicts the normal rhythm of users who often leave work at 18:00 and return home immediately, which represents a typical urban lifestyle: home → work → home. Compared
F I G U R E 1 2 (Continued)
16 | YANG et Al.
F I G U R E 1 3 Primary temporal stay patterns of motif M3. Red line represents the stay- at- home location, green line represents the second stay, blue line represents the third stay, and black line represents movement
| 17YANG et Al.
with the rhythm in Figure 12b, the stay pattern in Figure 12c displays a subtle difference where users prefer to return home between 12:00 and 14:00 for a short stay. These users may have a shorter commuting distance and are likely to have lunch at home. For the stay patterns in Figures 12d,e, a common characteristic is that the users spend most of their time at home during the day. The users in Figure 12d are likely to move to their second location for a short stay at 18:00, whereas the users in Figure 12e tend to make a transitory stay at their second location after 21:00. A possible reason for this phenomenon is that these people have the same home and work locations (e.g., working and living in the industrial park), and they may be leaving the location to perform other activities (e.g., eating out or shopping) after finishing their day's work.
As for motif M3, four primary temporal stay patterns could be detected from the users (Figure 13). Figure 13a shows the stay rhythm of users who are likely to commute to their workplaces at approximately 9:00, when they start their work, and stay until approximately 18:00, leaving their workplaces for the third stay location to perform other activities (e.g., eating out or other engagements with friends). Different from the rhythm in Figure 13a, the users in Figure 13b usually make a short stop at their second location and a long stop at their third location. In terms of the duration of stay, the third location may be the workplace of these users and they start their work after 12:00. In contrast to the pattern in Figure 13b, Figure 13c represents the stay rhythm where users stay at work from 09:00 until 16:00, then tend to move to the third location to perform other activities at approximately 18:00 and return home at approximately 19:00. Compared with the pattern in Figure 13c, a minor difference in Figure 13d is that users leave work at approximately 18:00, then perform transitory activities (e.g., having dinner) at 21:00 and usually return home after 22:00.
Figure 14 illustrates the primary temporal stay patterns of motif M4. Although only three stay locations are detected from users’ trajectories, five stays are observed during the day. In addition to the first stay at home, people are likely to commute to their workplaces at approximately 8:00, where they work until 12:00, and then move to nearby places to perform activities at approximately 13:00 (e.g., go to a restaurant for lunch). They return to their workplace and continue to work until 18:00, then leave for home after work. Different from M4, the users of motif M5 usually stay at their workplace from approximately 09:00 to 18:00, then return home. However, it is interesting that they go out to the third stay location at approximately 20:00 instead of staying home until the end of the day (Figure 15). It is possible that these people have a part- time job in the evening. For example, some people may be part- time loaders of delivery companies and they need to work 2 hr in the evening. Compared with motif M5, users with four stay locations (motif M8) are likely to move to a third location for dinner or other
F I G U R E 1 4 Primary temporal stay patterns of motif M4. Red line represents the stay- at- home location, green line represents the second stay, blue line represents the third stay, and black line represents movement
18 | YANG et Al.
activities, instead of returning home after work. They would then move to the fourth location after 21:00 to take part in other activities (Figure 16).
Based on the above observations, it was determined that the proposed method is feasible to extract temporal stay patterns for mobility motifs. It is evident that there may be significant differences in temporal stay charac-teristics even though users belong to the same home- based mobility motifs. In other words, although people have the same spatial stop location sequences (motifs) and trip chains during the day, time spent at these stop locations may be distinct, which means that they have different stay rhythms during the day. The reasons for this phenom-enon may be attributed to the diversity of individual demographic characteristics such as job specifications, daily travel distance, commuting distance and modes, personal references and so on. For example, Cao et al. (2019) found that the displacement distance affected the choice of spatial mobility motifs. Therefore, further studies should be conducted to address the factors that could have an impact on temporal stay characteristics.
F I G U R E 1 5 Primary temporal stay patterns of motif M5. Red line represents the stay- at- home location, green line represents the second stay, blue line represents the third stay, and black line represents movement
F I G U R E 1 6 Primary temporal stay patterns of motif M8. Red line represents the stay- at- home location, green line represents the second stay, blue line represents the third stay, brown line represents the fourth stay, and black line represents movement
| 19YANG et Al.
The findings of this study provide insights into the temporal stay characteristics of spatial home- based mo-bility motifs, providing a comprehensive understanding of human travel behavior from both spatial and temporal perspectives. By combining with survey data, land use and points of interest, these temporal stay patterns could be utilized to label activity types for each stay, which helps to make up for the deficiency in activity types of mobile phone data. Furthermore, an activity- based model can be established by using large- scale mobile phone data to estimate travel demand and generate origin– destination trips, which further forecasts urban traffic flows.
5 | CONCLUSIONS
Understanding human mobility has had a significant impact on various fields, such as urban planning, traffic man-agement, and emergence response. Currently, humans have stepped into the information era, bringing about a great number of human spatiotemporal tracing datasets, which provide an opportunity to look for coincident patterns among the complex human travel behaviors. Taking reference from previous studies (Schneider, Belik, et al., 2013), this study examined the temporal stay patterns of human mobility. Temporal stay patterns could give a clear description of how people manage their daily time at the stop locations, which enriches our understanding of human travel behavior in the perspective of time.
Based on the characteristics of mobile phone location data from Shenzhen, China, we first identified the stop location sequences of users, and observed that 97.8% of the users had no more than six stops and 98.9% of users visited no more than four distinct places during the day; in addition, the number of stops exhibited overall descend-ing trends with an increase in stay duration. Second, home- based mobility motifs were constructed according to the predefined rules; we observed that approximately 97% of users can be characterized by the 10 identified motif patterns, which provides insight into the daily human spatial mobility profile at the stop locations. Specifically, these motifs demonstrate residents’ primary daily trip chains, which reveal how people move between their daily stop locations and indicate how urban citizens tend to plan their daily trips, namely, leaving home, visiting their meaningful locations in an orderly manner, and finally returning home. Furthermore, we designed a method to quantify the similarity of temporal stay rhythms between users; primary temporal stay patterns of each motif are extracted by grouping users with similar stay rhythms. These temporal stay patterns provide knowledge of residents’ schedule characteristics for each motif, specifically referring to the start time, end time, and duration of stays at their visited locations, which presents a comprehensive description of human travel behavior from both spatial and temporal perspectives.
In the field of transport planning, trip chains and activity chains were traditionally generated from travel sur-vey data, with the characteristics of high cost and limited sample sizes. With the emergence of large- scale spatio-temporal human tracking data such as mobile phone data, scholars attempted to extract trip chains and activity chains from these datasets to complement traditional approaches. However, a major limitation of mobile phone data is the lack of direct activity semantic information (e.g., working, shopping, recreation, etc.), which could narrow the usage of the tracking data. Therefore, inferring the activity purpose of mobile phone trajectories has been a primary challenge for transport analysis. With this thread of work, the current study aims to contribute to understanding human daily travel trip patterns and temporal stay patterns at daily visited locations. The extracted home- based mobility motifs revealed the patterns of trip- chain behavior in daily spatial mobility networks. On this basis, the temporal stay patterns were grouped to depict the characteristics of time spent at stop locations for each motif. These spatiotemporal patterns could be used further to serve as a priori knowledge to infer activity information for mobile phone data. For example, an integration of these temporal stay characteristics and spatial context (e.g., land use, points of interest) at stop locations would provide better results for activity purpose infer-ence (Yin, Lin, & Zhao, 2021). Therefore, it is expected that these findings will be used to infer activity semantic information and generate residents’ activity chains in the future.
20 | YANG et Al.
However, this study has some limitations that can be resolved in the future to enhance the present study. First, we could only access one weekday of human tracing data, and further studies should analyze temporal stay patterns of multiple days to check if consistent results are observed. Further, the temporal sampling interval of mobile phone data is quite large, which leads to difficulties in detecting detailed short stops. Currently, this is the only accessible dataset; hence, this study provides an observation of human temporal stay patterns at this limited temporal resolution. In the future, additional trajectory datasets with high spatiotemporal resolution should be utilized to enhance the understanding of temporal stay patterns. Third, the present study mainly concentrated on investigating temporal stay rhythms for each mobility motif pattern without considering the spatial locations of stops. It is essential to combine the spatial and temporal characteristics of stops to quantify space- time similarity in travel behavior, and analyze the impact of land use or traffic network on human travel trips. Although the study is not comprehensive, the results can still provide further insights into the temporal stay characteristics of daily human mobility, which is also an extension of spatial mobility motifs. In addition, the proposed similarity measure method can be employed to evaluate the similarity of stay rhythms of other movement trajectories.
ORCIDXiping Yang https://orcid.org/0000-0002-2507-4757 Zhixiang Fang https://orcid.org/0000-0003-1651-878X Yang Xu https://orcid.org/0000-0003-3898-022X
R E FE R E N C E SAhas, R., Silm, S., Järv, O., Saluveer, E., & Tiru, M. (2010). Using mobile positioning data to model locations meaningful to
users of mobile phones. Journal of Urban Technology, 17, 3– 27. https://doi.org/10.1080/10630 73100 3597306Alexander, L., Jiang, S., Murga, M., & González, M. C. (2015). Origin– destination trips by purpose and time of day in-
ferred from mobile phone data. Transportation Research Part C: Emerging Technologies, 58, 240– 250. https://doi.org/10.1016/j.trc.2015.02.018
Andrienko, G., Andrienko, N., Bak, P., Bremm, S., Keim, D., von Landesberger, T., … Schreck, T. (2010). A framework for using self- organising maps to analyse spatio- temporal patterns, exemplified by analysis of mobile phone usage. Journal of Location Based Services, 4, 200– 221. https://doi.org/10.1080/17489 725.2010.532816
Bachir, D., Khodabandelou, G., Gauthier, V., El Yacoubi, M., & Puchinger, J. (2019). Inferring dynamic origin– destination flows by transport mode using mobile phone data. Transportation Research Part C: Emerging Technologies, 101, 254– 275. https://doi.org/10.1016/j.trc.2019.02.013
Barbosa, H., Barthelemy, M., Ghoshal, G., James, C. R., Lenormand, M., Louail, T., … Tomasini, M. (2018). Human mobility: Models and applications. Physics Reports, 734, 1– 74. https://doi.org/10.1016/j.physr ep.2018.01.001
Ben- Elia, E., & Zhen, F. (2018). ICT, activity space- time and mobility: New insights, new models, new methodologies. Transportation, 45, 267– 272. https://doi.org/10.1007/s1111 6- 018- 9870- y
Cao, J., Li, Q., Tu, W., & Wang, F. (2019). Characterizing preferred motif choices and distance impacts. PLoS ONE, 14(4), e0215242. https://doi.org/10.1371/journ al.pone.0215242
Chen, C., Ma, J., Susilo, Y., Liu, Y., & Wang, M. (2016). The promises of big data and small data for travel behavior (aka human mobility) analysis. Transportation Research Part C: Emerging Technologies, 68, 285– 299. https://doi.org/10.1016/j.trc.2016.04.005
Fang, Z., Yang, X., Xu, Y., Shaw, S.- L., & Yin, L. (2017). Spatiotemporal model for assessing the stability of urban human convergence and divergence patterns. International Journal of Geographical Information Science, 31, 2119– 2141. https://doi.org/10.1080/13658 816.2017.1346256
Gao, S. (2015). Spatio- temporal analytics for exploring human mobility patterns and urban dynamics in the mobile age. Spatial Cognition & Computation, 15, 86– 114. https://doi.org/10.1080/13875 868.2014.984300
García- Palomares, J. C., Salas- Olmedo, M. H., Moya- Gómez, B., Condeço- Melhorado, A., & Gutiérrez, J. (2018). City dynamics through Twitter: Relationships between land use and spatiotemporal demographics. Cities, 72, 310– 319. https://doi.org/10.1016/j.cities.2017.09.007
Gong, Y., Lin, Y., & Duan, Z. (2017). Exploring the spatiotemporal structure of dynamic urban space using metro smart card records. Computers, Environment & Urban Systems, 64, 169– 183. https://doi.org/10.1016/j.compe nvurb sys.2017.02.003
Isaacman, S., Becker, R., Cáceres, R., Kobourov, S., Martonosi, M., Rowland, J., & Varshavsky, A. (2011). Identifying im-portant places in people's lives from cellular network data. In Proceedings of the Ninth IEEE International Conference on Pervasive Computing and Communications, Seattle, WA (pp. 133– 151). Piscataway, NJ: IEEE.
Jia, C., Du, Y., Wang, S., Bai, T., & Fei, T. (2019). Measuring the vibrancy of urban neighborhoods using mobile phone data with an improved PageRank algorithm. Transactions in GIS, 23, 241– 258. https://doi.org/10.1111/tgis.12515
Jiang, S., Ferreira, J., & Gonzalez, M. C. (2017). Activity- based human mobility patterns inferred from mobile phone data: A case study of Singapore. IEEE Transactions on Big Data, 3, 208– 219. https://doi.org/10.1109/TBDATA.2016.2631141
Joy, J. J., & Samundeeswari, V. (2018). Analysing work tour motifs from GPS trajectory data. i- Manager’s Journal on Communication Engineering & Systems, 7, 31– 36. https://doi.org/10.26634/ jcs.7.2.14442
Kalekin- Fishman, D. (2013). Sociology of everyday life. Current Sociology, 61, 714– 732. https://doi.org/10.1177/00113 92113 482112
Kang, C., & Qin, K. (2016). Understanding operation behaviors of taxicabs in cities by matrix factorization. Computers, Environment & Urban Systems, 60, 79– 88. https://doi.org/10.1016/j.compe nvurb sys.2016.08.002
Karpatschof, B. (2000). Human activity: Contributions to the anthropological sciences from a perspective of activity theory. Copenhagen, Denmark: Dansk Psykologisk Forlag.
Kovanen, L., Karsai, M., Kaski, K., Kertész, J., & Saramäki, J. (2011). Temporal motifs in time- dependent networks. Journal of Statistical Mechanics: Theory & Experiment, 2011(11), P11005. http://dx.doi.org/10.1088/1742- 5468/2011/11/p11005
Lai, S., Farnham, A., Ruktanonchai, N. W., & Tatem, A. J. (2019). Measuring mobility, disease connectivity and individual risk: A review of using mobile phone data and mHealth for travel medicine. Journal of Travel Medicine, 26(3), taz019. https://doi.org/10.1093/jtm/taz019
Lehmann, A. L., Alvares, L. O., & Bogorny, V. (2019). SMSM: A similarity measure for trajectory stops and moves. International Journal of Geographical Information Science, 33, 1847– 1872. https://doi.org/10.1080/13658 816.2019.1605074
Liu, K., Gao, S., & Lu, F. (2019). Identifying spatial interaction patterns of vehicle movements on urban road networks by topic modelling. Computers, Environment & Urban Systems, 74, 50– 61. https://doi.org/10.1016/j.compe nvurb sys.2018.12.001
Liu, X., Gong, L., Gong, Y., & Liu, Y. (2015). Revealing travel patterns and city structure with taxi trip data. Journal of Transport Geography, 43, 78– 90. https://doi.org/10.1016/j.jtran geo.2015.01.016
Liu, Y. U., Liu, X. I., Gao, S., Gong, L. I., Kang, C., Zhi, Y. E., … Shi, L. I. (2015). Social sensing: A new approach to under-standing our socioeconomic environments. Annals of the Association of American Geographers, 105, 512– 530. https://doi.org/10.1080/00045 608.2015.1018773
Löfgren, O. (2015). Anthropology of everyday life. In J. D. Wright (Ed.), International encyclopedia of the social & behavioral sciences (2nd ed., pp. 323– 326). Oxford, UK: Elsevier.
Long, Y., Han, H., Tu, Y., & Shu, X. (2015). Evaluating the effectiveness of urban growth boundaries using human mobility and activity records. Cities, 46, 76– 84. https://doi.org/10.1016/j.cities.2015.05.001
Louail, T., Lenormand, M., Picornell, M., García Cantú, O., Herranz, R., Frias- Martinez, E., … Barthelemy, M. (2015). Uncovering the spatial structure of mobility networks. Nature Communications, 6, 6007. https://doi.org/10.1038/ncomm s7007
Pei, T., Sobolevsky, S., Ratti, C., Shaw, S.- L., Li, T., & Zhou, C. (2014). A new insight into land use classification based on aggregated mobile phone data. International Journal of Geographical Information Science, 28, 1988– 2007. https://doi.org/10.1080/13658 816.2014.913794
Prato, G. B., & Pardo, I. (2013). Urban anthropology. Urbanities, 3(2), 80– 110. Retrieved from https://www.anthr ojour nal- urban ities.com/pdf/urban ities_n5.pdf
Ratti, C., Frenchman, D., Pulselli, R. M., & Williams, S. (2006). Mobile landscapes: Using location data from cell phones for urban analysis. Environment & Planning B, 33, 727– 748. https://doi.org/10.1068/b32047
Ríos, S. A., & Muñoz, R. (2017). Land use detection with cell phone data using topic models: Case Santiago, Chile. Computers, Environment & Urban Systems, 61, 39– 48. https://doi.org/10.1016/j.compe nvurb sys.2016.08.007
Schneider, C. M., Belik, V., Couronné, T., Smoreda, Z., & González, M. C. (2013). Unravelling daily human mobility motifs. Journal of the Royal Society Interface, 10, 20130246. https://doi.org/10.1098/rsif.2013.0246
Schneider, C. M., Rudloff, C., Bauer, D., & González, M. C. (2013). Daily travel behavior: Lessons from a week- long survey for the extraction of human mobility motifs related information. In Proceedings of the Second ACM SIGKDD International Workshop on Urban Computing, Chicago, IL (pp. 1– 7). New York, NY: ACM.
Shaw, S.- L., & Sui, D. (2019). Understanding the new human dynamics in smart spaces and places: Toward a splatial framework. Annals of the American Association of Geographers, 110(2), 339– 348. https://doi.org/10.1080/24694 452.2019.1631145
Shaw, S.- L., Tsou, M.- H., & Ye, X. (2016). Editorial: Human dynamics in the mobile and big data era. International Journal of Geographical Information Science, 30(9), 1687– 1693. http://dx.doi.org/10.1080/13658 816.2016.1164317
Toch, E., Lerner, B., Ben- Zion, E., & Ben- Gal, I. (2019). Analyzing large- scale human mobility data: A survey of machine learning methods and applications. Knowledge & Information Systems, 58, 501– 523. https://doi.org/10.1007/s1011 5- 018- 1186- x
Toole, J. L., Ulm, M., Bauer, D., & Gonzalez, M. C. (2012). Inferring land use from mobile phone activity. In Proceedings of the ACM SIGKDD International Workshop on Urban Computing, Beijing, China (pp. 1– 8). New York, NY: ACM.
Tu, W., Cao, J., Yue, Y., Shaw, S.- L., Zhou, M., Wang, Z., … Li, Q. (2017). Coupling mobile phone and social media data: A new approach to understanding urban functions and diurnal patterns. International Journal of Geographical Information Science, 31, 2331– 2358. https://doi.org/10.1080/13658 816.2017.1356464
Vagni, G., & Cornwell, B. (2018). Patterns of everyday activities across social contexts. Proceedings of the National Academy of Sciences of the United States of America, 115(24), 6183– 6188. https://doi.org/10.1073/pnas.17180 20115
Wang, Z., He, S. Y., & Leung, Y. (2018). Applying mobile phone data to travel behaviour research: A literature review. Travel Behaviour & Society, 11, 141– 155. https://doi.org/10.1016/j.tbs.2017.02.005
Widhalm, P., Yang, Y., Ulm, M., Athavale, S., & González, M. C. (2015). Discovering urban activity patterns in cell phone data. Transportation, 42, 597– 623. https://doi.org/10.1007/s1111 6- 015- 9598- x
Xu, Y., Belyi, A., Santi, P., & Ratti, C. (2019). Quantifying segregation in an integrated urban physical– social space. Journal of the Royal Society Interface, 16, 20190536. https://doi.org/10.1098/rsif.2019.0536
Xu, Y., Shaw, S.- L., Zhao, Z., Yin, L., Lu, F., Chen, J., … Li, Q. (2016). Another tale of two cities: Understanding human activity space using actively tracked cellphone location data. Annals of the American Association of Geographers, 106, 489– 502. https://doi.org/10.1080/00045 608.2015.1120147
Yang, X., Fang, Z., Xu, Y., Yin, L., Li, J., & Lu, S. (2019). Spatial heterogeneity in spatial interaction of human movements: Insights from large- scale mobile positioning data. Journal of Transport Geography, 78, 29– 40. https://doi.org/10.1016/j.jtran geo.2019.05.010
Yang, X., Fang, Z., Yin, L., Li, J., Lu, S., & Zhao, Z. (2019). Revealing the relationship of human convergence– divergence patterns and land use: A case study on Shenzhen City, China. Cities, 95, 102384. https://doi.org/10.1016/j.cities.2019.06.015
Yang, X., Fang, Z., Yin, L., Li, J., Zhou, Y., & Lu, S. (2018). Understanding the spatial structure of urban commuting using mobile phone location data: A case study of Shenzhen, China. Sustainability, 10, 1435. https://doi.org/10.3390/su100 51435
Yin, L., Lin, N., Song, X., Mei, S., Shaw, S.- L., Fang, Z., … Mao, L. (2019). Space- time personalized short message service (SMS) for infectious disease control: Policies for precise public health. Applied Geography, 114, 102103. https://doi.org/10.1016/j.apgeog.2019.102103
Yin, L., Lin, N., & Zhao, Z. (2021). Mining daily activity chains from large- scale mobile phone location data. Cities, 109, 103013. https://doi.org/10.1016/j.cities.2020.103013
Yin, M., Sheehan, M., Feygin, S., Paiement, J.- F., & Pozdnoukhov, A. (2017). A generative model of urban activities from cellular data. IEEE Transactions on Intelligent Transportation Systems, 19, 1682– 1696. https://doi.org/10.1109/TITS.2017.2695438
Yuan, Y., & Raubal, M. (2016). Analyzing the distribution of human activity space from mobile phone usage: An individ-ual and urban- oriented study. International Journal of Geographical Information Science, 30, 1594– 1621. https://doi.org/10.1080/13658 816.2016.1143555
Yue, Y., Lan, T., Yeh, A. G., & Li, Q.- Q. (2014). Zooming into individuals to understand the collective: A review of trajectory- based travel behaviour studies. Travel Behaviour & Society, 1, 69– 78. https://doi.org/10.1016/j.tbs.2013.12.002
Zhang, Y., & Liu, L. (2018). Understanding temporal pattern of human activities using temporal areas of interest. Applied Geography, 94, 95– 106. https://doi.org/10.1016/j.apgeog.2018.03.009
Zhang, Y., Liu, L., & Wang, H. (2019). A new perspective on the temporal pattern of human activities in cities: The case of Shanghai. Cities, 87, 196– 204. https://doi.org/10.1016/j.cities.2018.10.002
Zhao, Z., Yin, L., Shaw, S.- L., Fang, Z., Yang, X., & Zhang, F. (2018). Identifying stops from mobile phone location data by introducing uncertain segments. Transactions in GIS, 22, 958– 974. https://doi.org/10.1111/tgis.12332
How to cite this article: Yang X, Fang Z, Xu Y, Yin L, Li J, Zhao Z. Revealing temporal stay patterns in human mobility using large- scale mobile phone location data. Transactions in GIS. 2021;00:1– 22. https://doi.org/10.1111/tgis.12750