Contents lists available at SciVerse ScienceDirect
Geoderma
j ourna l homepage: www.e lsev ie r .com/ locate /geoderma
Revegetation as an efficient means of increasing soil aggregate stabilityon the Loess Plateau (China)☆
Shao-Shan An a,c,⁎, Frédéric Darboux b, Man Cheng c
a State Key Laboratory of Soil Erosion and Dryland Farming on the Loess Plateau, Northwest A&F University, Yangling 712100, PR Chinab INRA, UR0272, UR Science du sol, Centre de Recherche Val de Loire, CS 40001, F-45075 Orléans Cedex 2, Francec Institute of Soil and Water Conservation, CAS&MWR, Yangling 712100, PR China
Abbreviations: FW, fast wetting; SW, slow wetting;(36 years); At.S., Artemisia sacrorum Ledeb (25 years); Tgrassland (3 years); C.K.26, Caragana korshinskii Kom. (2☆ This is an open-access article distributed under themedium, provided the original author and source are cr⁎ Corresponding author at: State Key Laboratory of So
Article history:Received 23 August 2012Received in revised form 2 May 2013Accepted 20 May 2013Available online 4 July 2013
Keywords:Soil aggregate stabilityLe Bissonnais' methodLoess PlateauGrain for GreenRevegetationPlant communities
Soil aggregate stability influences several aspects of soil physical behavior, such as water infiltration and soilerosion (Amézketa, 1999). We investigated the soil aggregate stability characteristics in the framework of the‘Grain for Green’ vegetation rehabilitation project at the Loess Plateau (China) by using the Le Bissonnais(1996) and the modified Yoder (1936) methods. Both non-grazed grassland and afforestation revegetationswere considered.The size distribution mode was always >2 mm for the fast wetting test (FW) in the non-grazed grasslandcommunities. This fraction accounted for approximately 40% to 80% of the total soil weight. The wet stirring(WS) test showed a distribution similar to that determined by the FW test. For the slow wetting (SW) test,80% or more of the non-grazed grassland soil fragments was >2 mm.The mean weighted diameter (MWD) that was determined by the Le Bissonnais' method was differentamong the tests and land uses. For the FW test, all the plant communities were significantly different fromthat of the recently abandoned grazing on grassland at the 0–20 and 20–40 cm depths. In the Artemisiasacrorum community, the maximum MWD was approximately 3 mm for the 0–20 cm depth. There wereno significant differences among the plant communities after 3 years of afforestation and 7 years ofnon-grazing of the grassland. The MWDs were lower in the afforestation area than in the non-grazed grass-land area. The maximum MWD value from the FW test was approximately 1.8 mm and was significantlylower (b0.5 mm) for cropland. The MWD of the modified Yoder method was positively related to the slowwetting and wet stirring (WS) tests of the Le Bissonnais' method (n = 20 and r = 0.83 and 0.87,respectively).In the Loess Plateau, revegetations by non-grazed grassland and afforestation are efficient means of increas-ing aggregate stability and decreasing soil erodibility. The aggregate stability under non-grazed grasslands ishigher than that under afforestation. The effect of revegetation is persistent, which makes it a suitablelong-term management practice. Compared with the modified Yoder's method, the FW test of the LeBissonnais' method is better at determining aggregate stability differences among land uses and isrecommended for future studies.
Soil structure is a key soil property that impacts plant and animallife, moderates environmental quality changes through soil organic car-bon sequestration, and impacts soil water quality. Soil structure can be
WS, wet stirring; MWD, mean weigh.M., Thymus mongolicus Ronn. (15 y6 years); C.K.16, Caragana korshinskterms of the Creative Commons Attedited.il Erosion and Dryland Farming on
blished by Elsevier B.V. All rights re
defined in terms of form and stability (Bronick and Lal, 2005). Good soilstructure is important for the productivity of sustainable agriculturaland for the preservation of environmental quality (Peng et al., 2004).Soil structure depends on the presence of stable aggregates. In fact, ag-gregate stability influences several soil physical processes, such as
hted diameter; St.G., Stipa grandis P. Smirn (56 years); St.B., Stipa bungeana Trin Ledebears); Hi.O., Hierochloe ordorata Beauv (7 years); Ab.G., recently abandoned grazing onii Kom. (16 years); A.G.3, abandoned grazing land (3 years); Cr., slope cropland (0 year).ribution License, which permits unrestricted use, distribution, and reproduction in any
76 S.-S. An et al. / Geoderma 209–210 (2013) 75–85
water infiltration and soil erosion (Amézketa, 1999; Le Bissonnais et al.,2007). Specifically, aggregate stability impacts the movement and stor-age of water in soils, soil aeration, soil erosion, biological activity, andcrop growth (Zhang and Miller, 1996). Thus, aggregate stability affectsa wide range of physical and biogeochemical processes in natural andagricultural environments. Maintaining high soil aggregate stability isessential for preserving soil productivity and forminimizing soil erosionand environmental pollution that result from soil degradation. Arshadand Cohen (1992) proposed that aggregate stability is one of the phys-ical soil properties that can serve as a soil quality indicator. Hortensiusand Welling (1996) included aggregate stability in the internationalstandardization of soil quality measurements. Aggregate stability isalso used as an indicator of soil structure (Six et al., 2000).
Human activities have impacted Chinese ecosystems formillennia (Fuet al., 1999, 2002). In the last century, fragmentation and degradation ofecological environments accelerated due to increasing population pres-sure. To prevent further deterioration of natural ecosystems, the Chinesegovernment has launched a series of nationwide conservation projects.These projects, such as the ‘Grain for Green’ project, focus on the rehabil-itation and recovery of damaged ecosystems (McVicar et al., 2007; Stokes,et al., 2010). The impacts of human activity at the Loess Plateau can be at-tributed to continuous and widespread stress, such as over-grazing andlarge-scale monocultures (wheat and maize) (Fu et al., 2000). In thisarea, soil erosion is a major threat. One of the most urgent tasks forachieving sustainable agricultural development is the recovery of naturalvegetation (Li et al., 2005). Among other impacts, revegetation could in-crease aggregate stability and decrease soil erodibility. Soil water-stableaggregation research has been conducted at the Loess Plateau in relationto soil erosion (for example,Wanget al., 1994; Zha et al., 1992). According
Table 2General situation of selected plots for the revegetation gradient of afforestation.
to this research, soil water-stable aggregation best reflects the ability ofsoils to resist erosion at the Loess Plateau. However, few papers are avail-able regarding the evolution of soil water-stable aggregation during nat-ural revegetation (e.g., Guo et al., 2010). Hence, the effect of revegetationon soil aggregate stability needs to be confirmed. At the Loess Plateau,two types of revegetation practices have been implemented: non-grazed grassland and afforestation, but no comparison between these re-vegetation types have been carried out yet.
Numerous research studies regarding soil aggregate stability onthe Loess Plateau have been conducted (for example, Gao, 1991;Zhu, 1982). While many methods have been designed to measure ag-gregate stability, most of the results from the Loess Plateau have beenobtained using a method based on Yoder (1936). These studiesshowed that the fraction of soil aggregates >0.25 mm is strongly re-lated to soil erodibility (Gao, 1991; Zhu, 1982). Wet sieving byYoder's method involves several mechanisms of soil aggregate break-down (Le Bissonnais, 1996). Other methods, such as that of LeBissonnais (1996), have been designed to separate the mechanisms(such as slaking and differential clay swelling) and to provide moreinformation regarding soil aggregation. The Le Bissonnais (1996)method recently became an ISO standard (ISO/DIS, 10930, 2012).Thus, it is important to compare the capabilities of the Le Bissonnais(1996) method with those based on the Yoder (1936) method.
The objectives of this study were to (1) investigate the changes insoil aggregate stability during vegetation rehabilitation in the LoessPlateau of China, (2) assess which revegetation practices improvesoil aggregate stability the most, and (3) compare the suitability ofthe Le Bissonnais' method with that of the modified Yoder's methodfor the Loess Plateau soils.
The study siteswere locatedwithin the Loess Plateau of Chinanear thecity of Yuanzhou (Ningxia province). In this area, 90% of the land area ishilly, 4% is occupied by villages and rivers, and only 6% is considered suit-able for intensive agriculture. This area has a sub-arid climate that is char-acterized by heavy seasonal rainfall with periodic floods and droughts.The average annual rainfall at the observatory is 400 mm (1941–2000;C.V. 18%), and the area has distinct wet and dry seasons. The rainy seasonstarts in July and continues until September. The July rainfall accounts for24%of the annual rainfall. Themean annual temperature is approximately7 °C.Most of the land is at an altitude of between 1800 and 2040 mand isfrequently dissected by steep and very steep gullies.
Two types of revegetation areaswere selected: non-grazed grasslandand afforestation. Altogether, ten sites were chosen. The non-grazedgrassland area is located within the Yunwu Observatory for VegetationProtection and Eco-environment (latitude 36° 13′ N–36° 19′ N and lon-gitude 106° 24′ E–106° 28′ E). It is the only remaining non-grazed grass-land on the Loess Plateau and is a protected area of approximately1000 ha that is enclosed by fences. This non-grazed grassland area wasformally established in 1982 andhas not been grazed for 30 years. How-ever, some sections of the non-grazed grassland have been protectedfrom grazing for as many as 56 years. Based on the natural plant succes-sion process in this area (Zou and Guan, 1997), we studied six sites thathad been enclosed for different lengths of time to establish natural veg-etation after 1982. The non-grazed grassland was used as grazing landprior to enclosure. The enclosure times were determined based onland use records and farmers' indications. Depending on the time of nat-ural succession, the studied plant communities from the longest toshortest enclosure duration were as follows: (a) Stipa grandis P. Smirn(St.G., 56 years), (b) Stipa bungeana Trin Ledeb (St.B., 36 years), (c)Artemisia sacrorum Ledeb (At.S., 25 years), (d) Thymus mongolicus
Table 4Soil physical and chemical properties for the revegetation gradient of afforestation.
Ronn. (Th.M., 15 years), (e) Hierochloe ordorata Beauv (Hi.O., 7 years),and (f) recently abandoned grazing on grassland (Ab.G., 3 years). Thebasic information about these sites are listed in Table 1.
The afforestation area is located at the Guyuan Observatory for Veg-etation Protection and Eco-environment (latitude 35° 59′ E–36° 02′ Eand longitude 106° 26′ N–106° 30′ N), which is approximately 30 kmsouth of the Yunwu Observatory for Vegetation Protection and Eco-environment. The site is a long-term and comprehensively managedfield study site that was established in 1982. Several practical revegeta-tionmethodswere implemented for soil andwater protection, includingshrub reconstruction and natural enclosure by a steel fence to protectthe area from grazing and human activities. Under afforestation, fourcommunities from the neighboring areas were studied, including (a) a26-year-old Caragana korshinskii Kom. (C.K.26), (b) a 16-year-old C.korshinskii Kom. (C.K.16), (c) a 3-year-old abandoned grazing land(A.G.3), and (d) a slope cropland (Cr.). The basic information aboutthese sites are listed in Table 2. The slope cropland is currently used byfarmers for production (with very low fertilizer input) and representsthe field conditions just before afforestation. The basic soil physicaland chemical properties for the non-grazed grassland and afforestedplant communities are listed in Tables 3 and 4, respectively. Based ondata from previously-studied sites, the particle size distribution of theupper 0–20 cm of the soil at the non-grazed grassland area was173–292 g · kg−1 clay (b0.002 mm), 173–267 g · kg−1 silt (0.2–0.002 mm), and 462–579 g · kg−1 sand (>0.2 mm). At the afforesta-tion area, the particle size distribution of the upper 0–20 cm of soilwas 279–357 g · kg−1 clay (b0.002 mm), 584–630 g · kg−1 silt (0.2–0.002 mm), and 60–91 g · kg−1 sand (>0.2 mm) (An and Huang,2003; An et al., 2009).
2.2. Soil sampling and preparation
Soil samples were collected at 0–20 cm and 20–40 cm depths inMarch 2010. An area of 60 × 60 m2 was delineated at each site.
abandoned grazing land (3 years); Cr.: slope cropland.
0
20
40
60
80
100St. G. 0-20 cm St. G. 20-40 cm
0
20
40
60
80
100St. B. 0-20 cm St. B. 20-40 cm
0
20
40
60
80
100
Agg
rega
te c
onte
nts
(%)
At. S. 0-20 cm At. S. 20-40 cm
0
20
40
60
80
100Th. M. 0-20 cm Th. M. 20-40 cm
0
20
40
60
80
100Hi. O. 0-20 cm Hi. O. 20-40 cm
0
20
40
60
80
100
> 2
mm
1-2
mm
0.5-
1 m
m
0.2-
0.5
mm
0.1-
0.2
mm
0.05
-0.
1 m
m0- 0.
05 m
m
> 2
mm
1-2
mm
0.5-
1 m
m
0.2-
0.5
mm
0.1-
0.2
mm
0.05
-0.
1 m
m0- 0.
05 m
m
> 2
mm
1-2
mm
0.5-
1 m
m
0.2-
0.5
mm
0.1-
0.2
mm
0.05
-0.
1 m
m0- 0.
05 m
m
SW testWS testFW test
Treatment and Size
Ab. G. 0-20 cm Ab. G. 20-40 cm
A
B
C
D
E
F
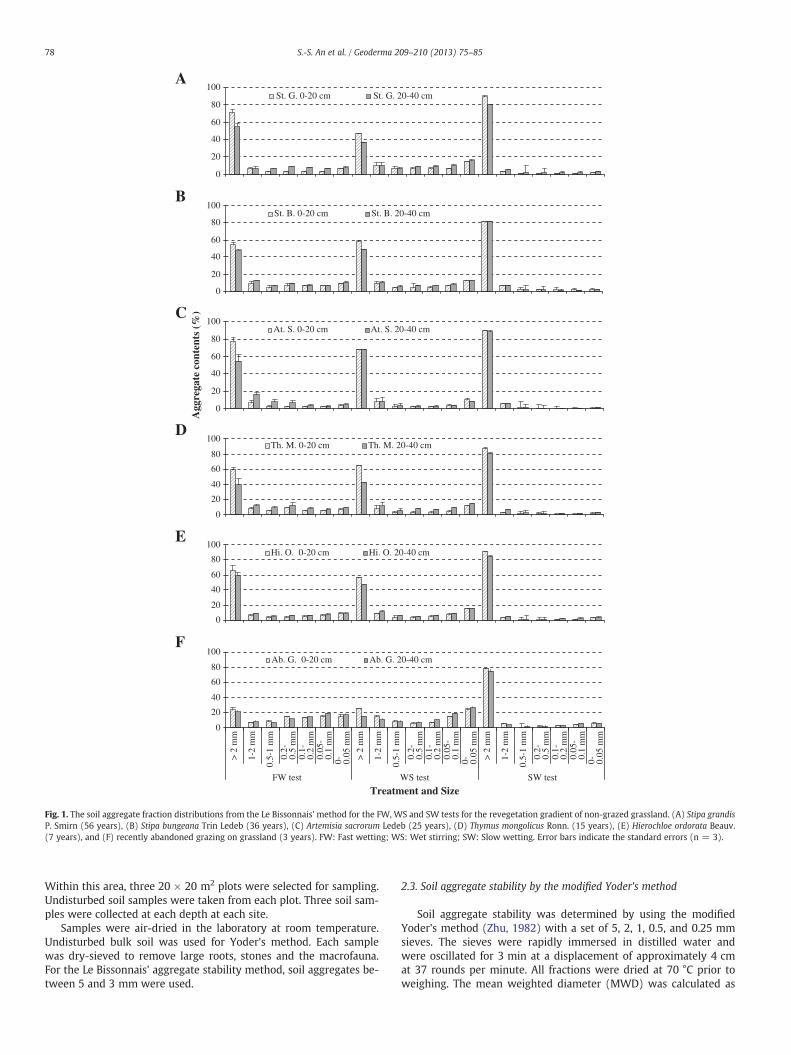
Fig. 1. The soil aggregate fraction distributions from the Le Bissonnais' method for the FW, WS and SW tests for the revegetation gradient of non-grazed grassland. (A) Stipa grandisP. Smirn (56 years), (B) Stipa bungeana Trin Ledeb (36 years), (C) Artemisia sacrorum Ledeb (25 years), (D) Thymus mongolicus Ronn. (15 years), (E) Hierochloe ordorata Beauv.(7 years), and (F) recently abandoned grazing on grassland (3 years). FW: Fast wetting; WS: Wet stirring; SW: Slow wetting. Error bars indicate the standard errors (n = 3).
78 S.-S. An et al. / Geoderma 209–210 (2013) 75–85
Within this area, three 20 × 20 m2 plots were selected for sampling.Undisturbed soil samples were taken from each plot. Three soil sam-ples were collected at each depth at each site.
Samples were air-dried in the laboratory at room temperature.Undisturbed bulk soil was used for Yoder's method. Each samplewas dry-sieved to remove large roots, stones and the macrofauna.For the Le Bissonnais' aggregate stability method, soil aggregates be-tween 5 and 3 mm were used.
2.3. Soil aggregate stability by the modified Yoder's method
Soil aggregate stability was determined by using the modifiedYoder's method (Zhu, 1982) with a set of 5, 2, 1, 0.5, and 0.25 mmsieves. The sieves were rapidly immersed in distilled water andwere oscillated for 3 min at a displacement of approximately 4 cmat 37 rounds per minute. All fractions were dried at 70 °C prior toweighing. The mean weighted diameter (MWD) was calculated as
A
B
C
D
0.0
20.0
40.0
60.0
80.0
100.0C.K.26 0-20 cm C.K.26 20-40 cm
0.0
20.0
40.0
60.0
80.0
100.0A
ggre
gate
s co
nten
t (%
)C.K.16 0-20 cm C.K.16 20-40 cm
0.0
20.0
40.0
60.0
80.0
100.0A.G. 0-20 cm A.G. 20-40 cm
0.0
20.0
40.0
60.0
80.0
100.0
> 2
mm
1-2
mm
0.5-
1 m
m
0.2-
0.5
mm
0.1-
0.2
mm
0.05
-0.
1 m
m0- 0.
05 m
m
> 2
mm
1-2
mm
0.5-
1 m
m
0.2-
0.5
mm
0.1-
0.2
mm
0.05
-0.
1 m
m0- 0.
05 m
m
> 2
mm
1-2
mm
0.5-
1 m
m
0.2-
0.5
mm
0.1-
0.2
mm
0.05
-0.
1 m
m0- 0.
05 m
m
FW test WS test SW test
Treatment and Size
Cr. 0-20 cm Cr. 20-40 cm
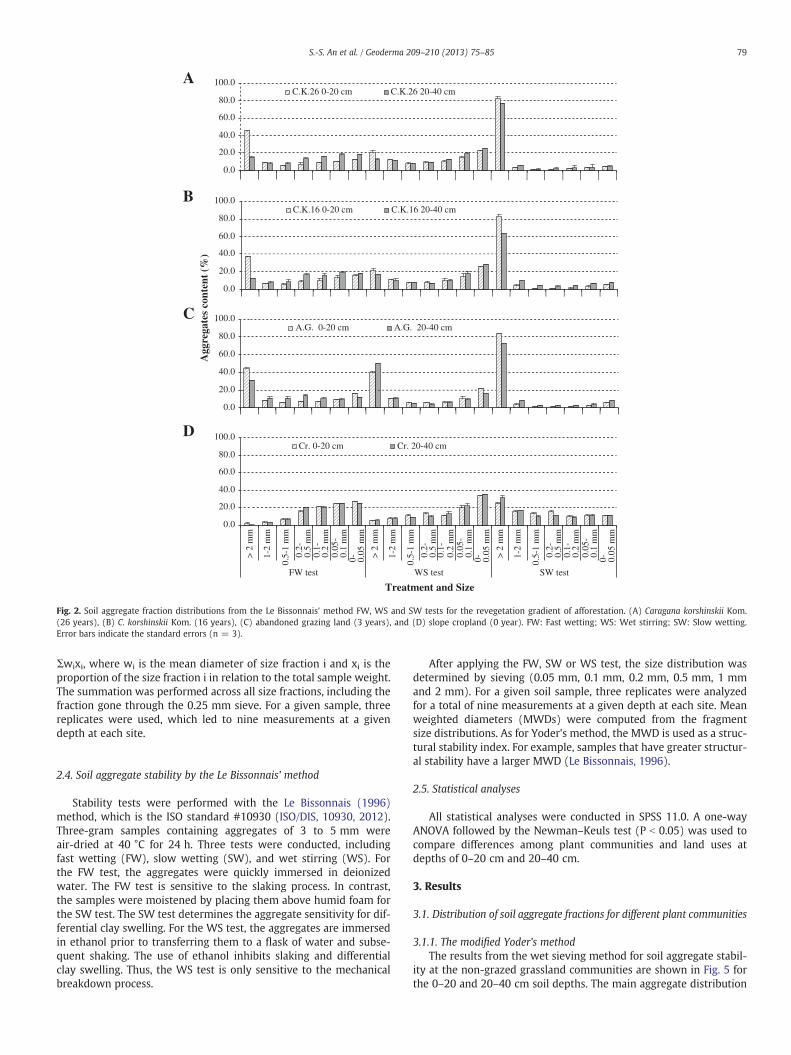
Fig. 2. Soil aggregate fraction distributions from the Le Bissonnais' method FW, WS and SW tests for the revegetation gradient of afforestation. (A) Caragana korshinskii Kom.(26 years), (B) C. korshinskii Kom. (16 years), (C) abandoned grazing land (3 years), and (D) slope cropland (0 year). FW: Fast wetting; WS: Wet stirring; SW: Slow wetting.Error bars indicate the standard errors (n = 3).
79S.-S. An et al. / Geoderma 209–210 (2013) 75–85
Σwixi, where wi is the mean diameter of size fraction i and xi is theproportion of the size fraction i in relation to the total sample weight.The summation was performed across all size fractions, including thefraction gone through the 0.25 mm sieve. For a given sample, threereplicates were used, which led to nine measurements at a givendepth at each site.
2.4. Soil aggregate stability by the Le Bissonnais' method
Stability tests were performed with the Le Bissonnais (1996)method, which is the ISO standard #10930 (ISO/DIS, 10930, 2012).Three-gram samples containing aggregates of 3 to 5 mm wereair-dried at 40 °C for 24 h. Three tests were conducted, includingfast wetting (FW), slow wetting (SW), and wet stirring (WS). Forthe FW test, the aggregates were quickly immersed in deionizedwater. The FW test is sensitive to the slaking process. In contrast,the samples were moistened by placing them above humid foam forthe SW test. The SW test determines the aggregate sensitivity for dif-ferential clay swelling. For the WS test, the aggregates are immersedin ethanol prior to transferring them to a flask of water and subse-quent shaking. The use of ethanol inhibits slaking and differentialclay swelling. Thus, the WS test is only sensitive to the mechanicalbreakdown process.
After applying the FW, SW or WS test, the size distribution wasdetermined by sieving (0.05 mm, 0.1 mm, 0.2 mm, 0.5 mm, 1 mmand 2 mm). For a given soil sample, three replicates were analyzedfor a total of nine measurements at a given depth at each site. Meanweighted diameters (MWDs) were computed from the fragmentsize distributions. As for Yoder's method, the MWD is used as a struc-tural stability index. For example, samples that have greater structur-al stability have a larger MWD (Le Bissonnais, 1996).
2.5. Statistical analyses
All statistical analyses were conducted in SPSS 11.0. A one-wayANOVA followed by the Newman–Keuls test (P b 0.05) was used tocompare differences among plant communities and land uses atdepths of 0–20 cm and 20–40 cm.
3. Results
3.1. Distribution of soil aggregate fractions for different plant communities
3.1.1. The modified Yoder's methodThe results from the wet sieving method for soil aggregate stabil-
ity at the non-grazed grassland communities are shown in Fig. 5 forthe 0–20 and 20–40 cm soil depths. The main aggregate distribution
aab
bccdd
e
AA
ABB
A
C
0.0
0.5
1.0
1.5
2.0
2.5
3.0
3.5A
B
C
St. G.St. B.At. S.Th. M.Hi. O.Ab. G.Plant Communities
MW
DFW test 0-20 cm FW test 20-40 cm
a abbc c
d
e
A
B BCCD
E
0.0
0.5
1.0
1.5
2.0
2.5
3.0
3.5
St. G.St. B.At. S.Th. M.Hi. O.Ab. G.Plant Communities
MW
D
WS test 0-20 cm WS test 20-40 cm
aaa aab
b
AABAB ABAB
B
0.0
0.5
1.0
1.5
2.0
2.5
3.0
3.5
4.0
St. G. St. B. At. S. Th. M. Hi. O. Ab. G.
Plant Communities
MW
D
SW test 0-20 cm SW test 20-40 cm
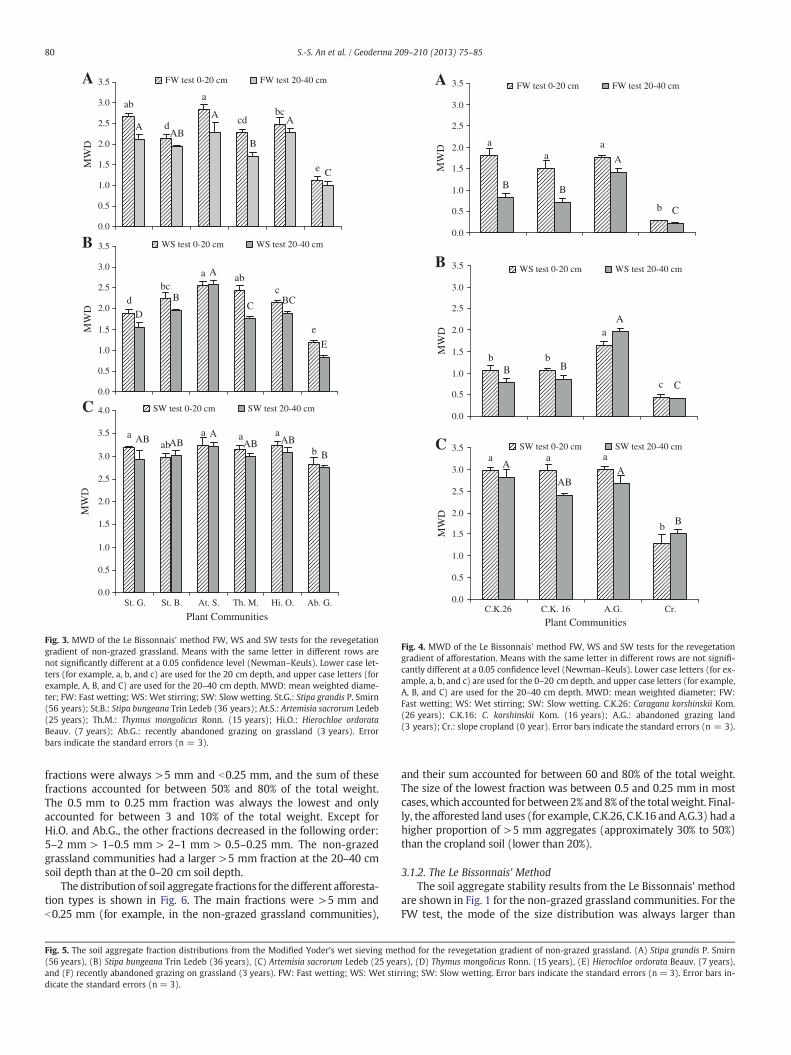
Fig. 3. MWD of the Le Bissonnais' method FW, WS and SW tests for the revegetationgradient of non-grazed grassland. Means with the same letter in different rows arenot significantly different at a 0.05 confidence level (Newman–Keuls). Lower case let-ters (for example, a, b, and c) are used for the 20 cm depth, and upper case letters (forexample, A, B, and C) are used for the 20–40 cm depth. MWD: mean weighted diame-ter; FW: Fast wetting; WS: Wet stirring; SW: Slow wetting. St.G.: Stipa grandis P. Smirn(56 years); St.B.: Stipa bungeana Trin Ledeb (36 years); At.S.: Artemisia sacrorum Ledeb(25 years); Th.M.: Thymus mongolicus Ronn. (15 years); Hi.O.: Hierochloe ordorataBeauv. (7 years); Ab.G.: recently abandoned grazing on grassland (3 years). Errorbars indicate the standard errors (n = 3).
aa
a
b
A
B B
C
0.0
0.5
1.0
1.5
2.0
2.5
3.0
3.5
MW
D
FW test 0-20 cm FW test 20-40 cm
a
b b
c
A
BB
C
0.0
0.5
1.0
1.5
2.0
2.5
3.0
3.5
MW
D
WS test 0-20 cm WS test 20-40 cm
a a a
b
AA
AB
B
0.0
0.5
1.0
1.5
2.0
2.5
3.0
3.5
C.K.26 C.K. 16 A.G. Cr.
Plant Communities
MW
DSW test 0-20 cm SW test 20-40 cm
A
B
C
Fig. 4. MWD of the Le Bissonnais' method FW, WS and SW tests for the revegetationgradient of afforestation. Means with the same letter in different rows are not signifi-cantly different at a 0.05 confidence level (Newman–Keuls). Lower case letters (for ex-ample, a, b, and c) are used for the 0–20 cm depth, and upper case letters (for example,A, B, and C) are used for the 20–40 cm depth. MWD: mean weighted diameter; FW:Fast wetting; WS: Wet stirring; SW: Slow wetting. C.K.26: Caragana korshinskii Kom.(26 years); C.K.16: C. korshinskii Kom. (16 years); A.G.: abandoned grazing land(3 years); Cr.: slope cropland (0 year). Error bars indicate the standard errors (n = 3).
80 S.-S. An et al. / Geoderma 209–210 (2013) 75–85
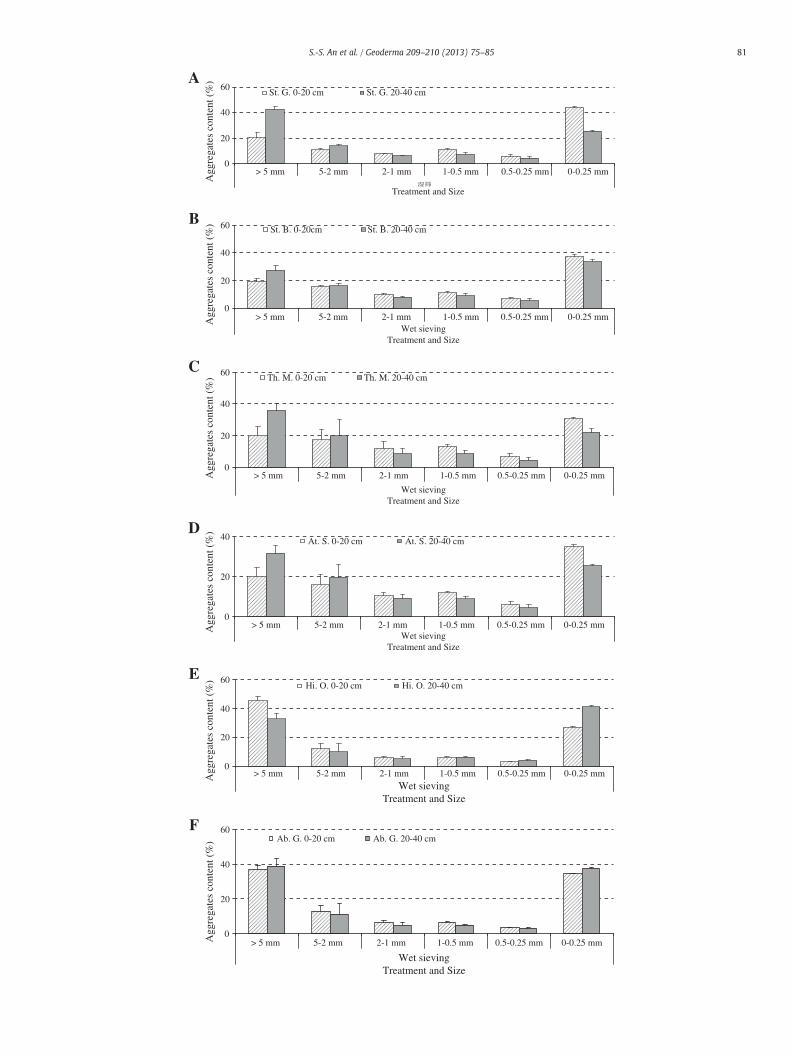
fractions were always >5 mm and b0.25 mm, and the sum of thesefractions accounted for between 50% and 80% of the total weight.The 0.5 mm to 0.25 mm fraction was always the lowest and onlyaccounted for between 3 and 10% of the total weight. Except forHi.O. and Ab.G., the other fractions decreased in the following order:5–2 mm > 1–0.5 mm > 2–1 mm > 0.5–0.25 mm. The non-grazedgrassland communities had a larger >5 mm fraction at the 20–40 cmsoil depth than at the 0–20 cm soil depth.
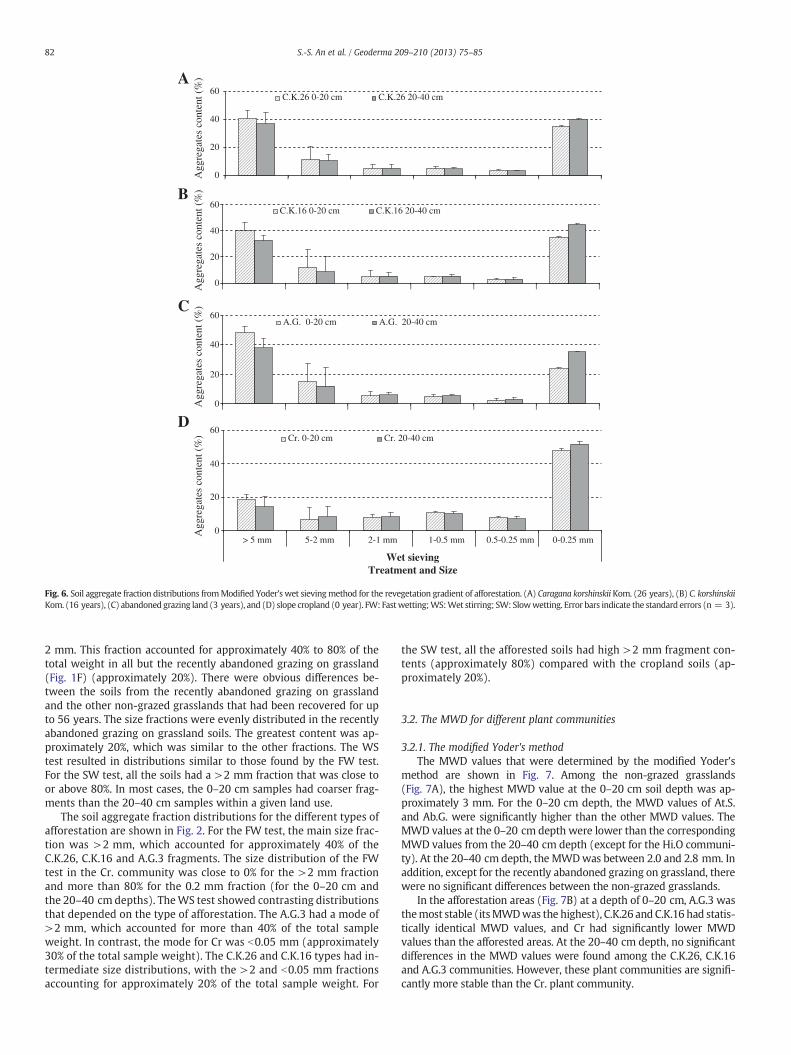
The distribution of soil aggregate fractions for the different afforesta-tion types is shown in Fig. 6. The main fractions were >5 mm andb0.25 mm (for example, in the non-grazed grassland communities),
Fig. 5. The soil aggregate fraction distributions from the Modified Yoder's wet sieving met(56 years), (B) Stipa bungeana Trin Ledeb (36 years), (C) Artemisia sacrorum Ledeb (25 yeaand (F) recently abandoned grazing on grassland (3 years). FW: Fast wetting; WS: Wet stirdicate the standard errors (n = 3).
and their sum accounted for between 60 and 80% of the total weight.The size of the lowest fraction was between 0.5 and 0.25 mm in mostcases,which accounted for between2% and 8% of the totalweight. Final-ly, the afforested land uses (for example, C.K.26, C.K.16 and A.G.3) had ahigher proportion of >5 mm aggregates (approximately 30% to 50%)than the cropland soil (lower than 20%).
3.1.2. The Le Bissonnais' MethodThe soil aggregate stability results from the Le Bissonnais' method
are shown in Fig. 1 for the non-grazed grassland communities. For theFW test, the mode of the size distribution was always larger than
hod for the revegetation gradient of non-grazed grassland. (A) Stipa grandis P. Smirnrs), (D) Thymus mongolicus Ronn. (15 years), (E) Hierochloe ordorata Beauv. (7 years),ring; SW: Slow wetting. Error bars indicate the standard errors (n = 3). Error bars in-
0
20
40
60
Treatment and Size
Agg
rega
tes
cont
ent (
%)
St. G. 0-20 cm St. G. 20-40 cm
0
20
40
60
Wet sievingTreatment and Size
Agg
rega
tes
cont
ent (
%) St. B. 0-20cm St. B. 20-40 cm
0
20
40
60
Wet sievingTreatment and Size
Agg
rega
tes
cont
ent (
%) Th. M. 0-20 cm Th. M. 20-40 cm
0
20
40
Wet sievingTreatment and Size
Agg
rega
tes
cont
ent (
%)
At. S. 0-20 cm At. S. 20-40 cm
0
20
40
60
Wet sievingTreatment and Size
Agg
rega
tes
cont
ent (
%) Hi. O. 0-20 cm Hi. O. 20-40 cm
0
20
40
60
> 5 mm 5-2 mm 2-1 mm 1-0.5 mm 0.5-0.25 mm 0-0.25 mm
> 5 mm 5-2 mm 2-1 mm 1-0.5 mm 0.5-0.25 mm 0-0.25 mm
> 5 mm 5-2 mm 2-1 mm 1-0.5 mm 0.5-0.25 mm 0-0.25 mm
> 5 mm 5-2 mm 2-1 mm 1-0.5 mm 0.5-0.25 mm 0-0.25 mm
> 5 mm 5-2 mm 2-1 mm 1-0.5 mm 0.5-0.25 mm 0-0.25 mm
> 5 mm 5-2 mm 2-1 mm 1-0.5 mm 0.5-0.25 mm 0-0.25 mm
Wet sievingTreatment and Size
Agg
rega
tes
cont
ent (
%) Ab. G. 0-20 cm Ab. G. 20-40 cm
A
B
C
D
E
F
81S.-S. An et al. / Geoderma 209–210 (2013) 75–85
A
B
C
D
0
20
40
60
Agg
rega
tes
cont
ent (
%)
C.K.26 0-20 cm C.K.26 20-40 cm
0
20
40
60A
ggre
gate
s co
nten
t (%
)C.K.16 0-20 cm C.K.16 20-40 cm
0
20
40
60
Agg
rega
tes
cont
ent (
%)
A.G. 0-20 cm A.G. 20-40 cm
0
20
40
60
> 5 mm 5-2 mm 2-1 mm 1-0.5 mm 0.5-0.25 mm 0-0.25 mm
Wet sievingTreatment and Size
Agg
rega
tes
cont
ent (
%) Cr. 0-20 cm Cr. 20-40 cm
Fig. 6. Soil aggregate fraction distributions fromModified Yoder's wet sievingmethod for the revegetation gradient of afforestation. (A) Caragana korshinskii Kom. (26 years), (B) C. korshinskiiKom. (16 years), (C) abandoned grazing land (3 years), and (D) slope cropland (0 year). FW: Fastwetting;WS:Wet stirring; SW: Slowwetting. Error bars indicate the standard errors (n = 3).
82 S.-S. An et al. / Geoderma 209–210 (2013) 75–85
2 mm. This fraction accounted for approximately 40% to 80% of thetotal weight in all but the recently abandoned grazing on grassland(Fig. 1F) (approximately 20%). There were obvious differences be-tween the soils from the recently abandoned grazing on grasslandand the other non-grazed grasslands that had been recovered for upto 56 years. The size fractions were evenly distributed in the recentlyabandoned grazing on grassland soils. The greatest content was ap-proximately 20%, which was similar to the other fractions. The WStest resulted in distributions similar to those found by the FW test.For the SW test, all the soils had a >2 mm fraction that was close toor above 80%. In most cases, the 0–20 cm samples had coarser frag-ments than the 20–40 cm samples within a given land use.
The soil aggregate fraction distributions for the different types ofafforestation are shown in Fig. 2. For the FW test, the main size frac-tion was >2 mm, which accounted for approximately 40% of theC.K.26, C.K.16 and A.G.3 fragments. The size distribution of the FWtest in the Cr. community was close to 0% for the >2 mm fractionand more than 80% for the 0.2 mm fraction (for the 0–20 cm andthe 20–40 cm depths). TheWS test showed contrasting distributionsthat depended on the type of afforestation. The A.G.3 had a mode of>2 mm, which accounted for more than 40% of the total sampleweight. In contrast, the mode for Cr was b0.05 mm (approximately30% of the total sample weight). The C.K.26 and C.K.16 types had in-termediate size distributions, with the >2 and b0.05 mm fractionsaccounting for approximately 20% of the total sample weight. For
the SW test, all the afforested soils had high >2 mm fragment con-tents (approximately 80%) compared with the cropland soils (ap-proximately 20%).
3.2. The MWD for different plant communities
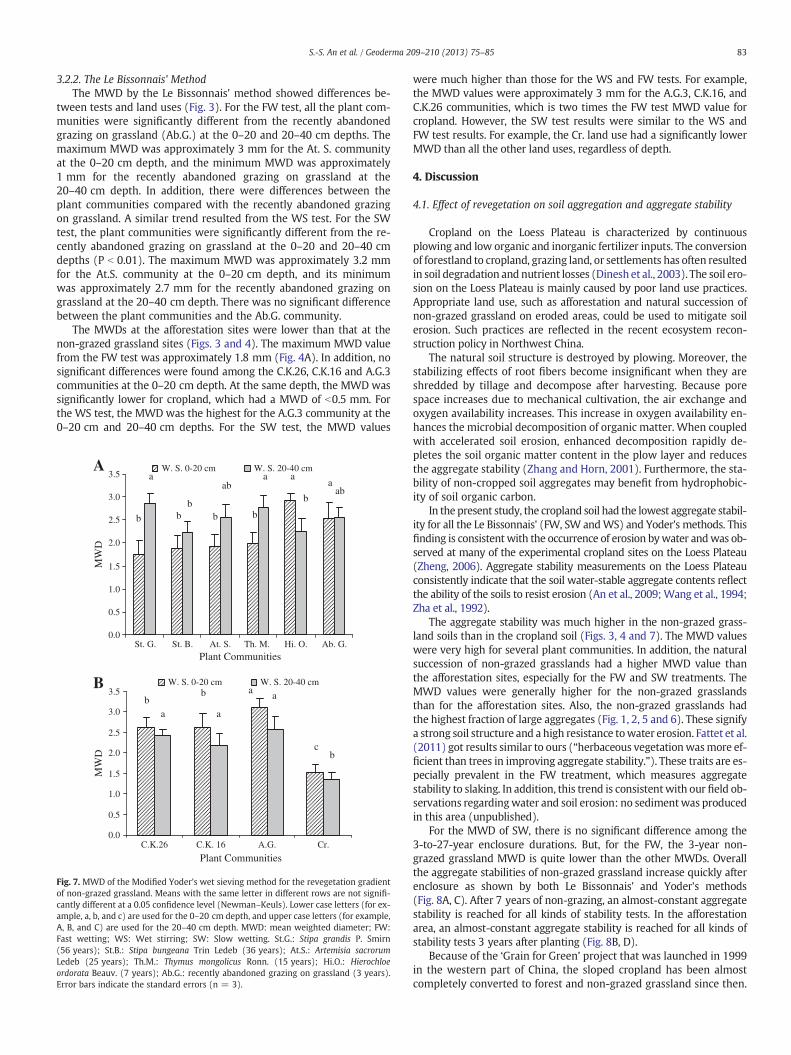
3.2.1. The modified Yoder's methodThe MWD values that were determined by the modified Yoder's
method are shown in Fig. 7. Among the non-grazed grasslands(Fig. 7A), the highest MWD value at the 0–20 cm soil depth was ap-proximately 3 mm. For the 0–20 cm depth, the MWD values of At.S.and Ab.G. were significantly higher than the other MWD values. TheMWD values at the 0–20 cm depth were lower than the correspondingMWD values from the 20–40 cm depth (except for the Hi.O communi-ty). At the 20–40 cm depth, the MWDwas between 2.0 and 2.8 mm. Inaddition, except for the recently abandoned grazing on grassland, therewere no significant differences between the non-grazed grasslands.
In the afforestation areas (Fig. 7B) at a depth of 0–20 cm, A.G.3 wasthemost stable (itsMWDwas the highest), C.K.26 and C.K.16 had statis-tically identical MWD values, and Cr had significantly lower MWDvalues than the afforested areas. At the 20–40 cm depth, no significantdifferences in the MWD values were found among the C.K.26, C.K.16and A.G.3 communities. However, these plant communities are signifi-cantly more stable than the Cr. plant community.
83S.-S. An et al. / Geoderma 209–210 (2013) 75–85
3.2.2. The Le Bissonnais' MethodThe MWD by the Le Bissonnais' method showed differences be-
tween tests and land uses (Fig. 3). For the FW test, all the plant com-munities were significantly different from the recently abandonedgrazing on grassland (Ab.G.) at the 0–20 and 20–40 cm depths. Themaximum MWD was approximately 3 mm for the At. S. communityat the 0–20 cm depth, and the minimum MWD was approximately1 mm for the recently abandoned grazing on grassland at the20–40 cm depth. In addition, there were differences between theplant communities compared with the recently abandoned grazingon grassland. A similar trend resulted from the WS test. For the SWtest, the plant communities were significantly different from the re-cently abandoned grazing on grassland at the 0–20 and 20–40 cmdepths (P b 0.01). The maximum MWD was approximately 3.2 mmfor the At.S. community at the 0–20 cm depth, and its minimumwas approximately 2.7 mm for the recently abandoned grazing ongrassland at the 20–40 cm depth. There was no significant differencebetween the plant communities and the Ab.G. community.
The MWDs at the afforestation sites were lower than that at thenon-grazed grassland sites (Figs. 3 and 4). The maximum MWD valuefrom the FW test was approximately 1.8 mm (Fig. 4A). In addition, nosignificant differences were found among the C.K.26, C.K.16 and A.G.3communities at the 0–20 cm depth. At the same depth, the MWD wassignificantly lower for cropland, which had a MWD of b0.5 mm. Forthe WS test, the MWD was the highest for the A.G.3 community at the0–20 cm and 20–40 cm depths. For the SW test, the MWD values
aa
bb b b
abb
aab
b
a
0.0
0.5
1.0
1.5
2.0
2.5
3.0
3.5
Plant Communities
MW
D
W. S. 0-20 cm W. S. 20-40 cm
c
abb
b
a
aa
0.0
0.5
1.0
1.5
2.0
2.5
3.0
3.5
St. G. St. B. At. S. Th. M. Hi. O. Ab. G.
C.K.26 C.K. 16 A.G. Cr.
Plant Communities
MW
D
W. S. 0-20 cm W. S. 20-40 cmB
A
Fig. 7. MWD of the Modified Yoder's wet sieving method for the revegetation gradientof non-grazed grassland. Means with the same letter in different rows are not signifi-cantly different at a 0.05 confidence level (Newman–Keuls). Lower case letters (for ex-ample, a, b, and c) are used for the 0–20 cm depth, and upper case letters (for example,A, B, and C) are used for the 20–40 cm depth. MWD: mean weighted diameter; FW:Fast wetting; WS: Wet stirring; SW: Slow wetting. St.G.: Stipa grandis P. Smirn(56 years); St.B.: Stipa bungeana Trin Ledeb (36 years); At.S.: Artemisia sacrorumLedeb (25 years); Th.M.: Thymus mongolicus Ronn. (15 years); Hi.O.: Hierochloeordorata Beauv. (7 years); Ab.G.: recently abandoned grazing on grassland (3 years).Error bars indicate the standard errors (n = 3).
were much higher than those for the WS and FW tests. For example,the MWD values were approximately 3 mm for the A.G.3, C.K.16, andC.K.26 communities, which is two times the FW test MWD value forcropland. However, the SW test results were similar to the WS andFW test results. For example, the Cr. land use had a significantly lowerMWD than all the other land uses, regardless of depth.
4. Discussion
4.1. Effect of revegetation on soil aggregation and aggregate stability
Cropland on the Loess Plateau is characterized by continuousplowing and low organic and inorganic fertilizer inputs. The conversionof forestland to cropland, grazing land, or settlements has often resultedin soil degradation and nutrient losses (Dinesh et al., 2003). The soil ero-sion on the Loess Plateau is mainly caused by poor land use practices.Appropriate land use, such as afforestation and natural succession ofnon-grazed grassland on eroded areas, could be used to mitigate soilerosion. Such practices are reflected in the recent ecosystem recon-struction policy in Northwest China.
The natural soil structure is destroyed by plowing. Moreover, thestabilizing effects of root fibers become insignificant when they areshredded by tillage and decompose after harvesting. Because porespace increases due to mechanical cultivation, the air exchange andoxygen availability increases. This increase in oxygen availability en-hances the microbial decomposition of organic matter. When coupledwith accelerated soil erosion, enhanced decomposition rapidly de-pletes the soil organic matter content in the plow layer and reducesthe aggregate stability (Zhang and Horn, 2001). Furthermore, the sta-bility of non-cropped soil aggregates may benefit from hydrophobic-ity of soil organic carbon.
In the present study, the cropland soil had the lowest aggregate stabil-ity for all the Le Bissonnais' (FW, SW andWS) and Yoder's methods. Thisfinding is consistent with the occurrence of erosion bywater andwas ob-served at many of the experimental cropland sites on the Loess Plateau(Zheng, 2006). Aggregate stability measurements on the Loess Plateauconsistently indicate that the soil water-stable aggregate contents reflectthe ability of the soils to resist erosion (An et al., 2009;Wang et al., 1994;Zha et al., 1992).
The aggregate stability was much higher in the non-grazed grass-land soils than in the cropland soil (Figs. 3, 4 and 7). The MWD valueswere very high for several plant communities. In addition, the naturalsuccession of non-grazed grasslands had a higher MWD value thanthe afforestation sites, especially for the FW and SW treatments. TheMWD values were generally higher for the non-grazed grasslandsthan for the afforestation sites. Also, the non-grazed grasslands hadthe highest fraction of large aggregates (Fig. 1, 2, 5 and 6). These signifya strong soil structure and a high resistance towater erosion. Fattet et al.(2011) got results similar to ours (“herbaceous vegetationwasmore ef-ficient than trees in improving aggregate stability.”). These traits are es-pecially prevalent in the FW treatment, which measures aggregatestability to slaking. In addition, this trend is consistentwith our field ob-servations regardingwater and soil erosion: no sedimentwas producedin this area (unpublished).
For the MWD of SW, there is no significant difference among the3-to-27-year enclosure durations. But, for the FW, the 3-year non-grazed grassland MWD is quite lower than the other MWDs. Overallthe aggregate stabilities of non-grazed grassland increase quickly afterenclosure as shown by both Le Bissonnais' and Yoder's methods(Fig. 8A, C). After 7 years of non-grazing, an almost-constant aggregatestability is reached for all kinds of stability tests. In the afforestationarea, an almost-constant aggregate stability is reached for all kinds ofstability tests 3 years after planting (Fig. 8B, D).
Because of the ‘Grain for Green’ project that was launched in 1999in the western part of China, the sloped cropland has been almostcompletely converted to forest and non-grazed grassland since then.
A
0
0.5
1
1.5
2
2.5
3
3.5
0 10 20 30 40 50 60
Duration (years)
MW
D (
mm
)
SW - 0-20 cm
SW - 20-40 cmFW - 0-20 cm
FW - 20-40 cm
WS - 0-20 cmWS - 20-40 cm
B
0
0.5
1
1.5
2
2.5
3
3.5
0 10 20 30
Duration (years)
MW
D (
mm
)
SW - 0-20 cm
SW - 20-40 cm
FW - 0-20 cm
FW - 20-40 cm
WS - 0-20 cm
WS - 20-40 cm
C
0
0.5
1
1.5
2
2.5
3
3.5
0 10 20 30 40 50 60
Duration (years)
MW
D (
mm
)
0-20 cm20-40 cm
D
0
0.5
1
1.5
2
2.5
3
3.5
0 10 20 30
Duration (years)
MW
D (
mm
) 0-20 cm
20-40 cm
Fig. 8. Time evolution of the MWDs. (A) Le Bissonnais' method for non-grazed grassland, (B) Le Bissonnais' method for afforestation, (C) Yoder's method for non-grazed grassland,and (D) Yoder's method afforestation. MWD: mean weighted diameter; FW: Fast wetting; WS: Wet stirring; SW: Slow wetting. Error bars indicate the standard errors (n = 3).
84 S.-S. An et al. / Geoderma 209–210 (2013) 75–85
Our results indicate that these land use changes have significantly de-creased soil erodibility. Based on the succession of communities, itwas estimated that prohibiting grazing and cropping, by stabilizingsoil aggregates, will continue to limit erosion.
From a soil aggregate stability enhancement and soil conservationstandpoint, we can conclude that non-grazed grassland is more effec-tive than afforestation, also it may take a few more years for aggre-gate stability to reach its maximum.
According to long-term monitoring and research studies on LoessPlateau soils (Guo et al., 2010; Jiao et al., 2012; Lv et al., 2012; Zheng,2006), the vegetation structure and species diversity of afforestedsites have improved. In our previous studies (An et al., 2009, 2010),soil microbiodiversities and soil nutrients increased for the first 20years of enclosure, and then they kept a high level. Soil aggregatestability was probably influenced by many other factors such as soilorganic carbon, soil inorganic carbon, and soil clay content. Moreresearch related to soil aggregate stability should be carried out toidentify the mechanisms of soil aggregate stabilization dependingon enclosure duration.
4.2. Comparison of the Yoder's and Le Bissonnais' methods
Yoder's method combines two disaggregation mechanisms: slak-ing during sample immersion and mechanical breakdown duringshaking. It makes it impossible to identify the sensitivity of a soil sam-ple to the disaggregation mechanisms. On the contrary, comparingthe MWDs between the three tests defined by Le Bissonnais (1996)help identify the sensitivity of soil aggregates to different disaggrega-tion mechanisms: slaking for the FW test, differential clay swelling forthe SW test andmechanical breakdown for theWS test. In the presentstudy, the FW test was the most efficient for disrupting soil aggre-gates; the WS test was intermediate; and the SW test disrupted soil
aggregates the least. Hence the soil aggregates were highly sensitiveto slaking (FW test), less sensitive to mechanical breakdown (WStest) and the least sensitive to differential clay swelling (SW test).The summer rains of the studied area are often very intense. Duringthese rains, the aggregates at the soil surface may undergo fast wet-ting, which causes high aggregate disruption. This finding potentiallyexplains the high soil erosion rates that are observed in the summerfollowing heavy rains.
We hypothesize that the higher organic matter and carbohydratecontents of the surface layer (0–20 cm) contribute to aggregate stabi-lization by bridging between the mineral particles. Increased aggre-gate stability in mull A-horizons was reported in forests by Ma et al.(2005). With regard to improving semiarid soil structure, the soil or-ganic matter concentration is the most important aggregate stabilityfactor (Diaz et al., 1994). Organic matter and its biological origin arethe main parameters responsible for aggregate stability. These pa-rameters are usually developed in the rhizosphere. Increasing aggre-gate stability from microorganisms may be of a physical nature(Tisdall and Oades, 1982) or may be due to the formation and excre-tion of microbial polysaccharides that act as binding agents (Cheshireet al., 1983).
Some MWD by Yoder's method were higher for the 20–40 cmdepth than for the 0–20 cm depth (Fig. 7), suggesting a lower aggre-gate stability in the surface layer. These differences were not consis-tent with MWD by Le Bissonnais' method for FW, SW and WS(Fig. 3). The cause of these inconsistencies is unclear.
The MWD of the modified Yoder method was positively correlatedto the MWD of the Le Bissonnais' method for SW (r = 0.83, n = 20)and WS (r = 0.87, n = 20) but was not related to that of the FW(r = 0.29, n = 20). This result is similar to the one of Guo et al.(2010), obtained on the Loess Plateau of China too. Le Bissonnais etal. (2007) (obtained on Mediterranean vineyards) and Guo et al.
85S.-S. An et al. / Geoderma 209–210 (2013) 75–85
(2010) also found the Le Bissonnais's method more discriminant thanthe Yoder's method. As such, the Le Bissonnais' method should bepreferred over the Yoder's method while working on revegetationin the Loess Plateau of China.
To the credit of Yoder's (1936) early work, it must be remindedthat Le Bissonnais' method was developed more recently and isbased, among others, on Yoder (1936). Moreover, most authors ofYoder's method are in fact (1) using a modified version, and (2) thechanges are not always reported; making difficult to compare studies.Finally, considering the results of the comparisons between Yoder'sand Le Bissonnais' method, and considering that Le Bissonnais' meth-od recently became an ISO standard (ISO/DIS, 10930, 2012), LeBissonnais' method should be considered as a preferred method.
5. Conclusions
At the Loess Plateau, non-grazed grassland and afforestation reveg-etations were efficient measures for increasing aggregate stability anddecreasing soil erodibility. High aggregate stabilities were reachedafter 3 and 7 years under afforestation and non-grazed grassland, re-spectively. However, aggregate stability in the non-grazed grasslandwas higher than that under afforestation. This result was likely due tothe higher organic matter content in the non-grazed grassland. The ef-fect of revegetation on aggregate stability is persistent, which makes ita suitable long-term management practice.
The Le Bissonnais (1996) method was used to identify the pro-cesses responsible for disaggregation. Compared with the modifiedYoder (1936) method, the Le Bissonnais (1996) method was betterat determining aggregate stability (especially with the fast wettingtest) between land uses at the Loess Plateau.
Acknowledgments
This research was supported by the French Minister of Foreign Af-fairs through a Hubert Curien grant (PFCC 2009–2010 #20919ZC), theNational Natural Sciences Foundation of China (41171226, 41030532),and the Foundation for Youth Teachers by Northwest A&F University.In addition, the authors are grateful to Hervé Gaillard (UR0272, Soil Sci-ence Lab., INRA) for his technical assistance.
References
Amézketa, E., 1999. Soil aggregate stability: a review. Journal of Sustainable Agriculture14 (2–3), 83–151.
An, S.S., Huang, Y.M., 2003. Study on the ameliorate benefits of Caragana korshinskiishrubwood to soil properties in loess hilly area. Scientia Silvae Sinicae 42 (1),70–74.
An, S.S., Huang, Y.M., Zheng, F.L., 2009. Evaluation of soil microbial indices along a re-vegetation chronosequence in grassland soils on the Loess Plateau, NorthwestChina. Applied Soil Ecology 41, 286–292.
Arshad, M.A., Cohen, G.M., 1992. Characterization of soil quality: physical and chemicalcriteria. American Journal of Alternative Agriculture 7, 25–32.
Bronick, C.J., Lal, R., 2005. Soil structure and management: a review. Geoderma 124,3–22.
Cheshire, M.V., Sparling, G., Mundie, C.M., 1983. Effect of periodate treatment of soil oncarbohydrate constituents and soil aggregation. Journal of Soil Science 34, 105–112.
Diaz, E., Roldan, A., Lax, A., Albaladejo, J., 1994. Formation of stable aggregates in degradedsoil by amendment with urban refuse and peat. Geoderma 63 (3–4), 277–288.
Dinesh, R., Ghoshal, Chaudhuri S., Ganeshamurthy, A.N., Dey, C., 2003. Changes in soilmicrobial indices and their relationships following deforestation and cultivationin wet tropical forests. Applied Soil Ecology 24, 17–26.
Fattet, M., Fu, Y., Ghestem, M., Ma, W., Foulonneau, M., Nespoulous, J., Le Bissonnais, Y.,Stokes, A., 2011. Effects of vegetation type on soil resistance to erosion: relation-ship between aggregate stability and shear strength. Catena 87, 60–69.
Fu, B.J., Cheng, L.D., Mang, K.M., 1999. The effect of land use change on the regional en-vironment in the Yangjuangou catchment in the Loess Plateau of China. ActaGeographica Sinica 54 (3), 241–246.
Fu, B.J., Chen, L.D., Ma, K.M., 2000. The relationship between land use and soil condi-tions in the hilly area of Loess Plateau in Northern Shanxi. Catena 39, 69–78.
Fu, B.J., Chen, D.X., Qiu, Y., Wang, J., Meng, Q.H., 2002. Land Use Structure and EcologicalProcesses in the Loess Hilly Area, China. Commercial Press, Beijing, China (inChinese with English abstract).
Gao, W.S., 1991. Primary study of classification of different indices of soil anti-erosibility and its adaptation in the hill region of the Loess Plateau. Journal ofSoil and Water Conservation 5 (2), 60–65.
Guo, M., Zheng, F.L., An, S.S., Liu, Y., Wang, B., Darboux, F., 2010. Application of LeBissonnais method to study soil aggregate stability in the hilly–gully region. Sci-ence of Soil and Water Conservation 8 (2), 68–73 (In Chinese with Englishabstract).
Hortensius, D., Welling, R., 1996. International standardization of soil quality measure-ments. Communications in Soil Science and Plant Analysis 27, 387–402.
ISO/DIS 10930, 2012. Soil Quality — Measurement of the Stability of Soil AggregatesSubjected to the Action of Water. International Organization for Standardization,Geneva, Switzerland (12 pp. http://www.iso.org/iso/catalogue_detail.htm?csnumber=46433).
Jiao, J.Y., Zhang, Z.G., Bai, W.J., Jia, Y.F., Wang, N., 2012. Assessing the ecological successof restoration by afforestation on the Chinese Loess Plateau. Restoration Ecology 20(2), 240–249.
Le Bissonnais, Y., 1996. Aggregate stability and assessment of soil crustability and erod-ibility: I. Theory and methodology. European Journal of Soil Science 47, 425–431.
Le Bissonnais, Y., Blavet, D., De Noni, G., Laurent, J.Y., Asseline, J., Chenu, C., 2007. Erod-ibility of Mediterranean vineyard soils: relevant aggregate stability methods andsignificant soil variables. European Journal of Soil Science 58, 188–195.
Li, Y.Y., Shao, M.A., Zheng, J.Y., Zhang, X.C., 2005. Spatial–temporal changes of soil or-ganic carbon during vegetation recovery at Ziwuling, China. Pedosphere 15 (5),601–610.
Lv, Y.H., Fu, B.J., Feng, X.M., Zeng, Y., Liu, Y., Chang, R.Y., Sun, G., Wu, B.F., 2012. A policy-driven large scale ecological restoration: quantifying ecosystem services changesin the Loess Plateau of China. PLoS One 7 (2), e31782.
Ma, X.H., Jiao, J.Y., Bai, W.J., 2005. The changes of soil water-stable aggregates inabandoned lands during vegetation restoration in hilly and gully regions on theLoess Plateau. Agricultural Research in the Arid Areas 23 (3), 69–74 (in Chinesewith English abstract).
McVicar, T.R., Li, L.T., Van Niel, T.G., Zhang, L., Li, R., Yang, Q.K., Zhang, X.P., Mu, X.M.,Wen, Z.M., Liu, W.Z., Zhao, Y.A., Liu, Z.H., Gao, P., 2007. Developing a decision sup-port tool for China's re-vegetation program: simulating regional impacts of affores-tation on average annual streamflow in the Loess Plateau. Forest Ecology andManagement 251, 65–81.
Peng, X.H., Horn, R., Zhang, B., Zhao, Q.G., 2004. Mechanisms of soil vulnerability tocompaction of homogenized and recompacted Ultisols. Soil and Tillage Research76 (2), 125–137.
Six, J., Elliott, E.T., Paustian, K., 2000. Soil macroaggregate turnover and microaggregateformation: a mechanism for C sequestration under no-tillage agriculture. Soil Biol-ogy and Biochemistry 32, 2099–2103.
Stokes, A., Sotir, R., Chen, W., Ghestem, M., 2010. Soil bio- and eco-engineering inChina: past experience and future priorities. Ecological Engineering 36, 247–257.
Tisdall, J.M., Oades, J.M., 1982. Organic-matter and water-stable aggregates in soils.Journal of Soil Science 33 (2), 141–163.
Wang, Y.M., Guo, P.C., Gao, W.S., 1994. A study on soil antierodibility in Loess Plateau.Journal of Soil and Water Conservation 8 (4), 11–16 (in Chinese with Englishabstract).
Yoder, R.E., 1936. A direct method of aggregate analysis of soils and a study of the phys-ical nature of erosion losses. Journal of the American Society of Agronomy 28,337–351.
Zha, X., Tang, K.L., Zhang, K.L., 1992. The impact of vegetation on soil characteristics andsoil erosion. Journal of Soil and Water Conservation 6 (2), 52–58 (in Chinese withEnglish abstract).
Zhang, B., Horn, R., 2001. Mechanisms of aggregate stabilization in Ultisols from sub-tropical China. Geoderma 99, 123–145.
Zhang, X.C., Miller, W.P., 1996. Physical and chemical crusting processes affecting run-off and erosion in furrows. Soil Science Society of America Journal 60, 860–865.
Zheng, F.L., 2006. Effect of vegetation changes on soil erosion on the Loess Plateau.Pedosphere 16 (4), 420–427.
Zhu, X.M., 1982. Soil and Agriculture in Loess Plateau (in Chinese). Agricultural Press,Beijing.
Zou, H.Y., Guan, X.Q., 1997. The explored of the management of grassland natural con-servation area in Yunwu mountain. Prataculture Science 14 (1), 3–4 (in Chinesewith English abstract).