CHAPTER 1. REVIEW OF LITERATURE AND RESEARCH OBJECTIVES 1 Review of Literature ......................................................................................1 Research Objectives.......................................................................................9 References......................................................................................................10
CHAPTER 2. SITE DESCRIPTION AND EXPERIMENTAL DESIGN 13 2.1. Site Description and History 13 2.2. Experimental Design 18 2.3. Materials and Methods 25 2.3.1. Soil Sampling Procedures 25 2.3.2 Soil pH 25 2.3.3 Soil EC 26 2.3.4 Water EC 26 2.3.5 Soil Respiration 26 2.3.6 Enumeration of Culturable Microorganisms 26 2.3.7. Microbial Biomass Carbon Flush 27 2.3.8 Penn State Ag Analytical Service Lab Soil Methods 28 2.3.9 Germination Rate 28 2.3.10 Percent Groundcover and Vegetative Diversity 29 2.3.11 Aboveground Plant Biomass 29 2.3.12 Greenhouse Leaching Study Set Up With Soil Columns 30 2.3.13 Plant and Root Biomass 30 2.3.14 Statistical Analysis 31 References 32 CHAPTER 3.FIELD SITE EXPERIMENT 34 3.1. Introduction Measurement of Soil Quality Indicators 34 3.2. Soil Chemical Properties 34 3.2.1 Soil Moisture 34 3.2.2 Soil pH 35 3.2.3 Soil Electrical Conductivity 37 3.2.4 Soil Fertility 37 3.3. Soil Microbial Properties 38 3.3.1 Enumeration of Culturable Microorganisms 38 3.3.2 Soil Microbial Biomass Carbon Flush 42 3.3.3 Respired CO2 45 3.4. Vegetative Characteristics 46 3.4.1. Germination Rate 46
vi
3.4.2 Vegetation Height 47 3.4.3. Percent Plant Cover by Ten Pin Method 48 3.4.4. Plant Biomass Production and Botanical Separation 49 References 53 CHAPTER 4 CONTROLLED GREENHOUSE EXPERIMENT 55 4.1. Soil Results 56 4.1.1 Total Soil Carbon 56 4.2. Vegetative Results 57 4.2.1 Germination Rate 57 4.2.2 Biomass Production and Botanical Separation 57 4.3 Root Biomass 60 4.4 pH of Leachate 62 4.5 Electrical Conductivity of Leachate 62 4.6 Elements Present in Leachate 64 4.7 Conclusion 65 References 66 CHAPTER 5 SUMMARY AND CONCLUSIONS 67 5.1 Summary 67 5.2 Objective Summary 67 5.2.1 Objective 1 67 5.2.2 Objective 2 68 5.2.3 Objective 3 69 5.2.4 Objective 4 70 5.3 Conclusion 71 5.4 Directions for Future Studies 72 5.5 References 74 APPENDIX 75 Appendix A Soil Descriptions 75 Appendix B Chemical Measurements of Field Soil Samples by Treatment Zone from Sylvan Grove Kill Study 85 Appendix C Chapter 3 & 4 Data Presented in Table Form 89
vii
LIST OF FIGURES
Figure 2.1: Topographic map of Sylvan Grove Kill zone site 14 Figure 2.2: Soils Map of Sylvan Grove kill zone site, adapted from Clearfield
County Soil Survey. A complex Brinkerton and Ernest soils are present. 15
Figure 2.3: A picture of Hughes Borehole kill zone near Portage Pa, taken in 2007. Iron deposition is actively occurring, and stream flow has not channelized. It is proposed that this is how the Sylvan Grove kill zone site looked 100 years ago. 17
Figure 2.4: Picture of barren site (Sylvan Grove AMD kill zone) before planting in 2006 17
Figure 2.5: Site map of area in 2005 with iron deposition depth in cm sampled every 3 meters (sampling points numbered). Iron depths ranged from 0 -35 cm on the site 19
Figure 2.6: Site map of area in 2006 showing rills and gullies (in gray) and placement of the main stream channel (in blue). Yellow dots indicate sampling points for measuring thickness of iron oxide deposits. 20
Figure 2.7: Aerial photograph of research site with plot layout illustrated. The
location of the large AMD- laden spring is on the bottom right. Channelized stream flows northwest and empties into Brown’s Run at the upper left. Underground flow near the soil surface occurs in the red zone, with water spring re-emerging at the surface immediately to the north. 24
Figure 2.8: Ten-pin frame used to count vegetative hits. 29 Figure 3.1: Graph of percent soil moisture taken at the end of 2006 & 2007 growing season. Results are shown for inside amended plots and area
directly outside of that plot. Orange and gray zone moistures can be considered as typical field moisture values. Red zone soils have very high moisture contents and could almost be considered water logged. 35
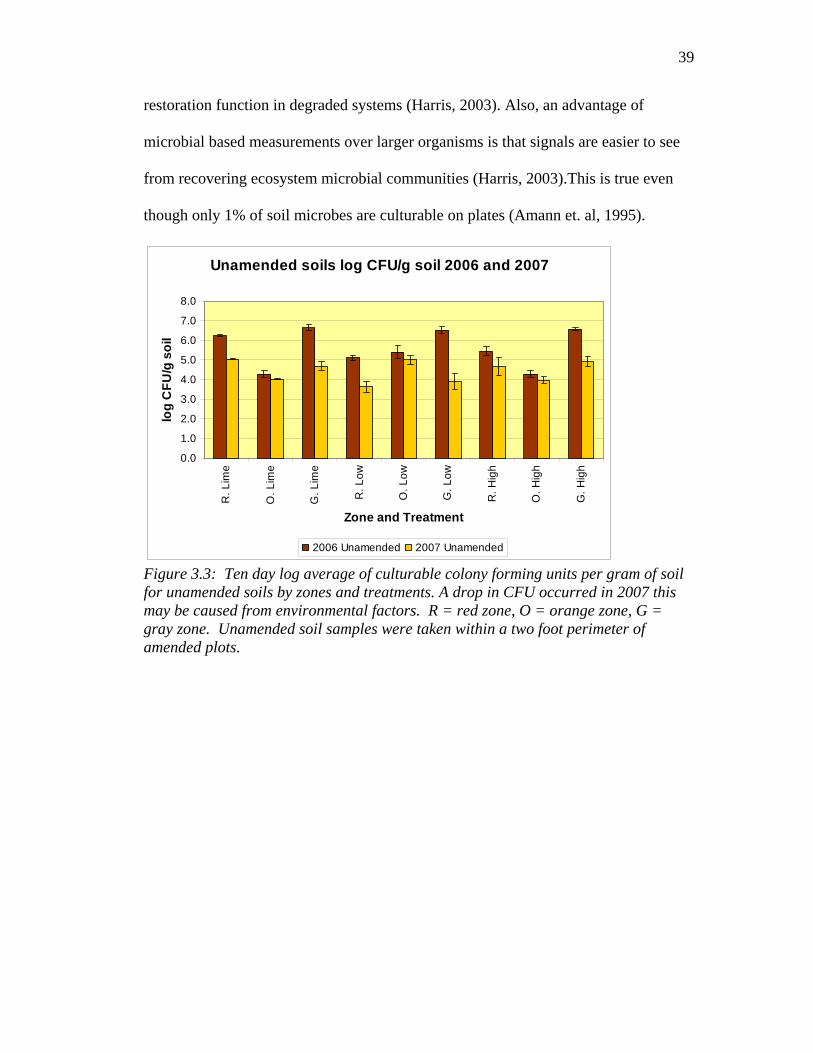
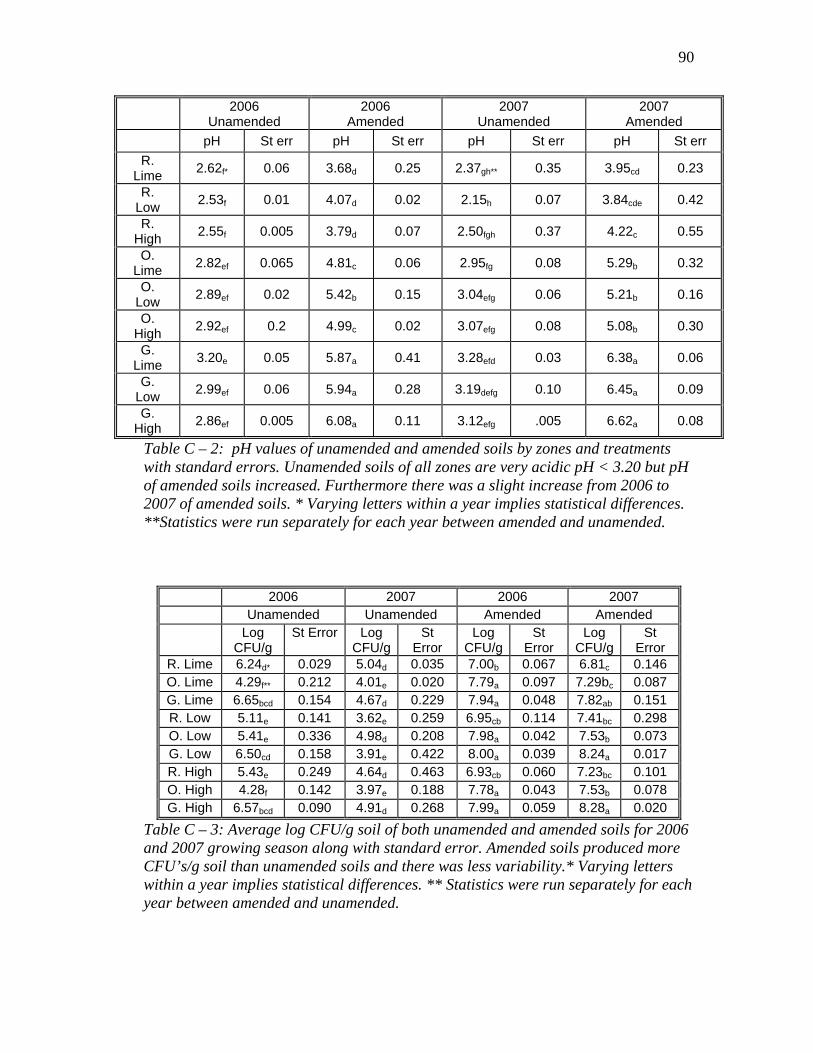
Figure 3.2: pH values of unamended and amended soils by zones and treatments with standard errors. Unamended soils of all zones are very acidic pH < 3.20 but pH of amended soils increased. Furthermore there was a slight increase from 2006 to 2007 of amended soils. 36 Figure 3.3: Ten day log average of culturable colony forming units per gram of soil for unamended soils by zones and treatments. A drop in CFU occurred in 2007 this may be caused from environmental factors.
viii
R = red zone, O = orange zone, G = gray zone. Unamended soil samples were taken within a two foot perimeter of amended plots. 39 Figure 3.4: Ten day log average of culturable colony forming units per gram of soil for amended soils by zones and treatments. R = red zone,
O = orange zone, G = gray zone. There was not a large difference between treatments and zones. However, there is an appreciable increase from unamended soils found in Appendix C. 40
Figure 3.5: Photo of plates from directly outside of a plot in left column and inside a plot in right column. Left column majority of growth is fungi
and in right column majority is bacterial growth. Shows a change in population diversity, bacteria typically live in more fertile soils whereas fungi live in less fertile soils. 42
Figure 3.6: Average microbial biomass by carbon flush by zone and treatment
given in µg C/g soil. There was a large increase from 2006 to 2007 in amended plots in orange and gray zones. However, a small increase in red amended zones for 2007. Also, a small increase occurred in unamended plots from 2006 to 2007. 44
Figure 3.7: Respired carbon C-CO2, by zone and treatments. R = red zone,
O = orange zone, G = gray zone. Amended plots produced more C than unamended treatments. Also, compost amended plots responded better than lime only amendment. 46
Figure 3.8: Percent vegetative cover by 10 pin method of each zone R, O, and G
along with lime only treatment, low rate compost, and high rate compost. Lime only treatments did not respond as well as low and high compost treatments. Both low- and high-compost treatments of soils in the orange zone performed worst compared to compost-treated soils in the red and grey zones. 48
Figure 3.9: Dry biomass produced (kg/ha) per zone and amendment for 2006 and 2007. A decrease in 2007 biomass occurred from a specie transition of oat nurse crop to seeded long term vegetation. It is believed that larger
red zone biomass is attributable to high soil moisture during entire growing season. 50
Figure 3.10: 2006 and 2007 comparison of species diversity. 51 Figure 4.1: First and second greenhouse harvest biomass diversity. Species composition changed in only a ten month period. Orchard grass
dominated, Fescue started to flourish by the second harvest, and Trefoil biomass also increased. 59
ix
Figure 4.2: Average dry root biomass produced by amendment with standard error. More compost to AMD soil produced more root biomass. The Hagerstown control produced the least amount of biomass 61
Figure 4.3: Average root biomass produced by zone with standard error.
More roots seemed to be produced in areas of less soil acidity, besides Hagerstown control. 61
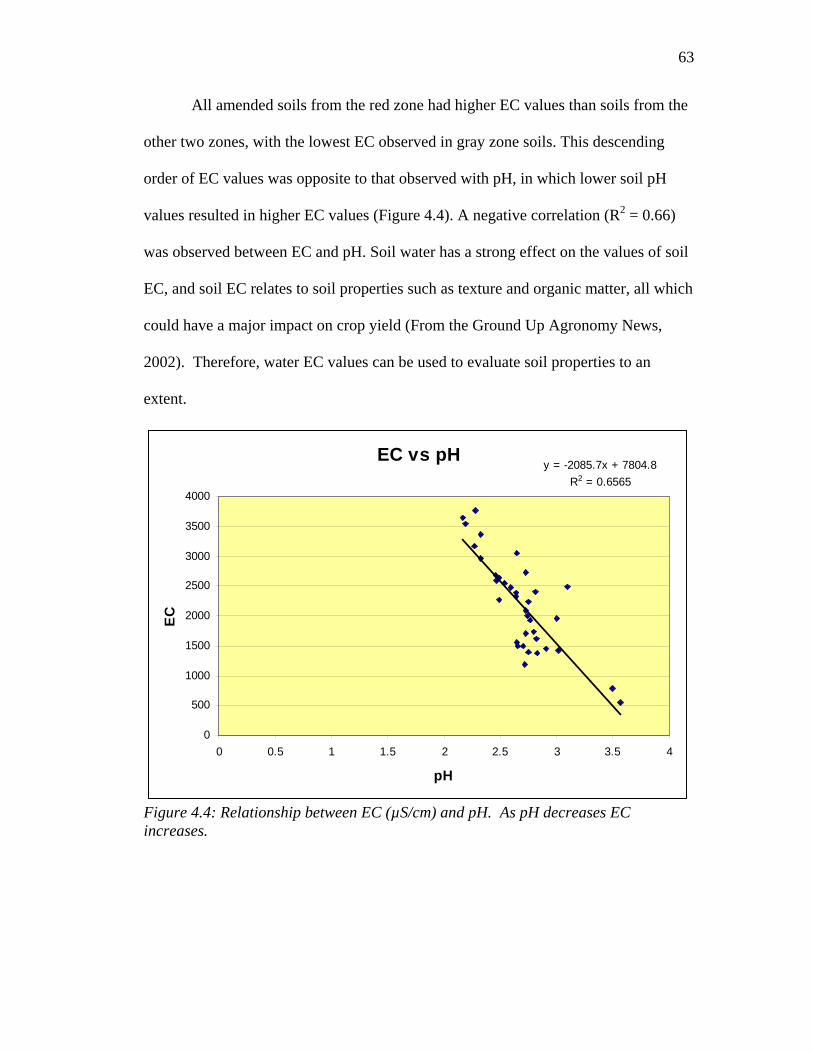
Figure 4.4: Relationship between EC (µS/cm) and pH. As pH decreases EC increases. 63
x
LIST OF TABLES Table 2.1: Results of soil chemical analyses by zone before treatment, tests conducted by Penn State Ag Analytical Services Lab. 20 Table 2.2: OMPEC compost results by Penn State Ag Analytical Services Lab 22 Table 2.3: Listing of treatments for research plots in each zone 23 Table 3.1: Soil EC values of amended and unamended treatments. In general also referring back to figure 3.2 treatments in the red zone had the lowest pH, then orange zone treatments was in the middle with gray zone treatments having the highest pH. EC values are higher in soils that had lower pH. 37 Table 3.2: 2006 & 2007 average soil fertility tested by PSU Ag Analytical for unamended and amended soils with treatments. All properties increased once amended except reserve acidy decreased. 38 Table 3.3: Average number of germinated seedlings in a 100 cm2 area. There were no significant differences between treatments or zones. 46 Table 3.4: Average vegetative height (cm) by treatment mid growing season 2006. High compost rates performed better than low rate followed by lime only treatment. * Differences in letters imply significant differences. 47 Table 4.1: Total % soil carbon (dry weight) average by zone before amendments
with standard errors and calculated equivalent percent soil organic matter (justification by a 1.72 factor conversion). 56
Table 4.2: Germination counts by zone and treatment along with Hagerstown
control for 182 cm2 area. No significant differences were found amount treatments. 57
Table 4.3: Average dry biomass produced (kg/ha) per zone and amendment in greenhouse study first harvest * Varying letters indicate significant differences. 58 Table 4.4: Average biomass produced per zone at the first harvest in the greenhouse study. 58 Table 4.5: pH of leachate of columns by zone and treatment with standard errors. 62 Table 4.6: Electrical conductivity (dS/m) of zones and treatments with standard errors. Soils with a lower pH produces and leachate with higher EC values. 62
xi
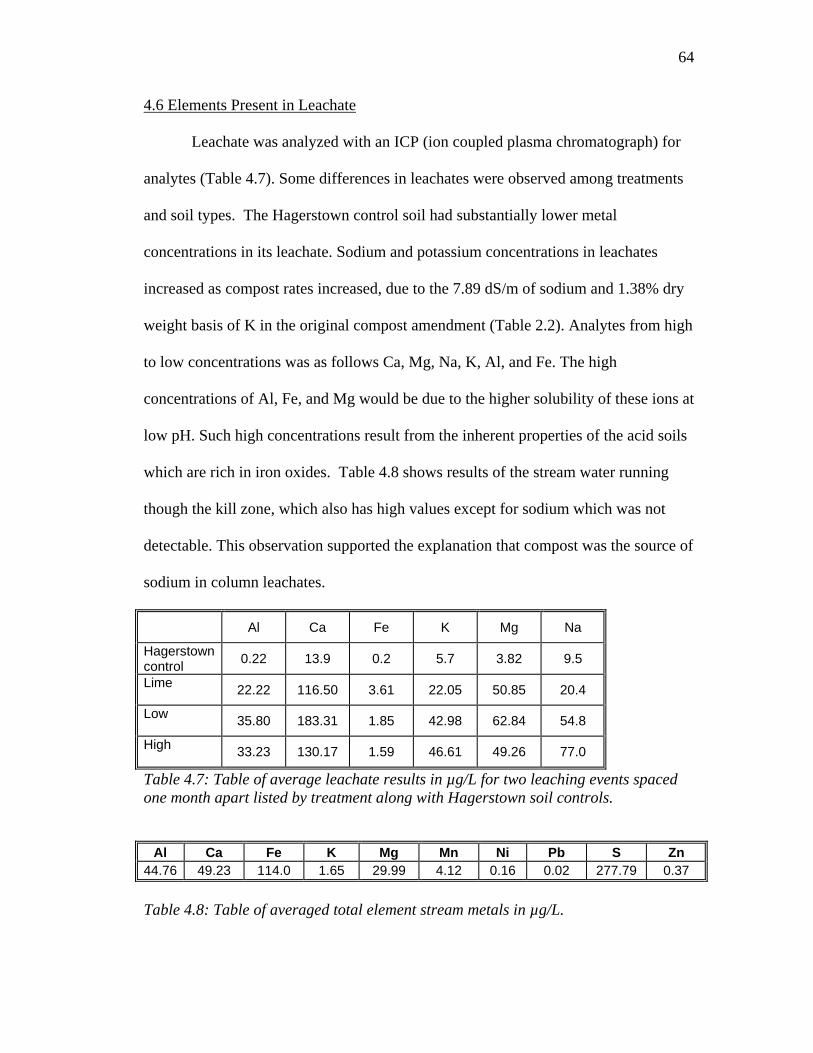
Table 4.7: Table of average leachate results in µg/L for two leaching events spaced one month apart listed by treatment along with Hagerstown soil control. 64
Table 4.8: Table of averaged total element stream metals in µg/L. 64
xii
Acknowledgements
I would like to thank everyone on my committee for helping me throughout
my master’s project for the last four and half years namely Dr. Mary Ann Bruns, Dr.
Curtis Dell, and Dr. Herschel Elliott. Special thanks to Dr. Daniel Fritton for being
my temporary advisor and getting me started off on the right foot. Furthermore, I
would also like to thank my parents for their support and help in the field and grass
separations. I am grateful to my husband for his help, pounding in PVC columns
with a sledge hammer and other hard things in the field, keeping me company for
hours while counting plates, and for being patient and supportive. I would like to
thank everyone at the USDA ARS, Pasture Systems Watershed Management
Research Unit for their help and advice including; Bart Moyer, Lou Saporito, Joan
Weaver, Sarah Marshall, Dr. Tony Buda, Gordon Folmar, Rob Stout, John Everhart,
Matt Myers, and Dr. Matt Sanderson. I would like to also thank Douglas Saylor of
the Moshannon Field Office of DEP for mining information and seed. Also, I would
like to thank Nadine Davitt of PSU OMPEC for supplying compost. In addition, I
would like to express appreciation to Dr. Marvin Risius for statistical advice. I am
also very appreciative of help that I received from numerous undergraduate and
graduate students at the USDA. Thank you for all your help in the many different
portions of my research, Becky Rank, Afton Campbell, Rachel Balance, Allison
Senycz, Christy Gambriel, Collin Olie, and Tyson Myers. Finally I would like to
thank the Larson family for permitting me to conduct research on their land.
1
Chapter 1
REVIEW OF LITERATURE AND RESEARCH
OBJECTIVES
Disturbed and degraded lands can be found over the entire globe. Natural and
manmade events cause these disturbances, hindering the lands’ productivity. These
disturbances interfere with natural succession of plant communities. Reclamation,
returning land to a more useful and healthy state, aims to speed up succession
(Gregorich, 2001). During reclamation, various organic matter sources such as
manure, biosolids, paper sludge, or different types of compost can be incorporated
into the soil to provide nutrients. Other materials are also incorporated to increase pH,
such as lime, slag, alkaline fly ash or flue gas desulfurization residue to aid plant
establishment (Munn et. al, 1999). Depending on the source, some organic matter
amendments also have pH-neutralizing capacities, such as biosolids, paper sludge,
and compost because of their higher pH values. Organic matter accumulation during
restoration of disturbed lands is essential for success. Consequently, soil organic
matter (SOM) and other indicators of SOM, including soil microbial populations,
carbon mineralization, carbon sequestration, and biomass accumulation, are used to
monitor reclamation progress. Organic matter represents perhaps the most reliable
index of soil fertility and contributes to soil productivity in a number of ways (Minzi
et. al, 1990). The benefits of organic matter additions are widespread, and effects
may last a century or more (Compton and Boone, 2000).
2
Pennsylvania has a dire need to restore its degraded abandoned coal mine
lands. As of 2002, 44 out of 67 counties were affected by abandoned coal mines and
5,172 abandoned mine sites covered 184,431 acres. The extent of degraded
abandoned coal mine land makes acid mine drainage (AMD) the largest contributor to
water quality impairment in the state (Pennsylvania Organization for Watersheds and
Rivers, 2002). In 1977 the federal Surface Mining Control and Reclamation Act
established regulations for revegetation of currently mined land, Act (PL 95-87, sec.
515), and Pennsylvania also mandates that if post mining land is not used to grow
crops, there shall be a 70 percent ground cover of permanent plant species along with
other stipulations (Sopper, 1994). However, strict federal requirements on fixing acid
mine drainage seeps (AMD) are non-existent; this problem is left to state agencies
based on funding, such as the Growing Greener Project in Pennsylvania. Growing
Greener is the largest investment of state funds in Pennsylvania to address critical
environmental concerns; the law was signed on December 15, 1999, and extends
through 2012. In 2005 another law, Growing Greener II (Act 45), was established to
provide $625 million over six years to clean rivers and streams, protect natural areas,
open spaces and working farms, and shore up key programs to improve quality of life
and revitalize communities across the Commonwealth (PA DEP).
1.1. Review of Literature
Benefits of Organic Matter Accumulation in Disturbed Soils
Once plants become established they add organic matter, lower soil bulk
density, bring mineral nutrients to the surface, accumulate nutrients in an available
3
form, and improve soil water-holding capacity (Bradshaw, 1997). In addition, certain
matter acts as a slow release fertilizer, with nutrient release rates controlled by
microbial and enzymatic activity (Vetterlein and Huttl, 1999). Over time soil organic
matter is transformed into humic substances, which are estimated to have half – lives
ranging from hundreds to thousands of years (Jenkinson and Rayner, 1977). Organic
matter serves in nutrient storage and performs functions related to the reactivity of
humic acids, for example complexation of metal cations (Vetterlein and Huttl, 1999).
Soil organic matter helps to develop soil horizonation in mine soils. Formation of
distinct surface soil horizons have been observed within two growing seasons after
mine soil construction, and discernible subsurface horizonation have been seen to
develop within four growing seasons (Haering et. al, 1993).
Types of soil carbon compounds
Many different organic compounds can be found in soil depending on amounts of
organic matter inputs and degree of SOM decomposition. The soil holds easily
degradable, “labile” carbon such as simple sugars; slowly degradable forms of
carbon, such as starches, with intermediate stability; and resistant forms, such as
lignin, which take much longer times to degrade. Typically more carbon in a soil
means higher soil fertility. Decomposition of more labile organic matter in soil
releases plant nutrients, while the resistant forms provide structure, porosity and
exchange sites.
4
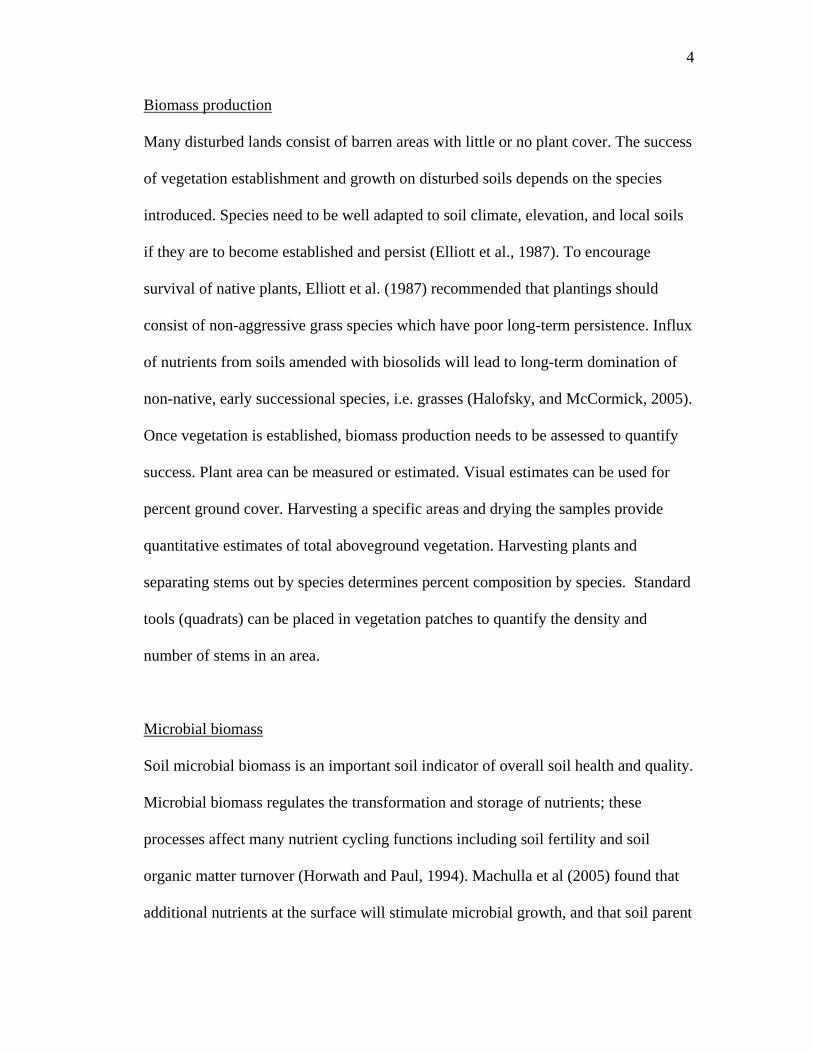
Biomass production
Many disturbed lands consist of barren areas with little or no plant cover. The success
of vegetation establishment and growth on disturbed soils depends on the species
introduced. Species need to be well adapted to soil climate, elevation, and local soils
if they are to become established and persist (Elliott et al., 1987). To encourage
survival of native plants, Elliott et al. (1987) recommended that plantings should
consist of non-aggressive grass species which have poor long-term persistence. Influx
of nutrients from soils amended with biosolids will lead to long-term domination of
non-native, early successional species, i.e. grasses (Halofsky, and McCormick, 2005).
Once vegetation is established, biomass production needs to be assessed to quantify
success. Plant area can be measured or estimated. Visual estimates can be used for
percent ground cover. Harvesting a specific areas and drying the samples provide
quantitative estimates of total aboveground vegetation. Harvesting plants and
separating stems out by species determines percent composition by species. Standard
tools (quadrats) can be placed in vegetation patches to quantify the density and
number of stems in an area.
Microbial biomass
Soil microbial biomass is an important soil indicator of overall soil health and quality.
Microbial biomass regulates the transformation and storage of nutrients; these
processes affect many nutrient cycling functions including soil fertility and soil
organic matter turnover (Horwath and Paul, 1994). Machulla et al (2005) found that
additional nutrients at the surface will stimulate microbial growth, and that soil parent
5
material mineralogy is an important influence on the increase in microbial biomass..
Vegetation and organic matter play integrated roles in soil microbial biomass buildup.
Organic matter accumulations as microbial biomass carbon in a retreating glacier
front were studied by Insam et al. (1988). They found that carbon increased from zero
to 1350 µg biomass C g-1 in 225 years in the vegetated area but remained near zero
after the same amount of time in the bare areas.
Soil Quality
There are numerous soil properties that could be included within the term “soil
quality”, for example: physical, chemical, and biological properties, processes, or
characteristics. In this study, soil fertility, pH, and microbial populations were
evaluated as indicators of soil quality. Soil fertility is considered to be the supply of
nutrients in soil to support vegetation. Soil pH can greatly affect the soil fertility by
controlling the forms and amounts of nutrients available to rooting systems. Microbial
populations and their activities are more informative indicators of how different
practices are changing soil quality/health, because microorganisms respond more
quickly to soil change than other physical and chemical properties of soils.
“Measurement of the microbial community has utility as an indicator of the re-
establishment of connections between the biota and restoration of function in
degraded systems” (Harris, 2003).
6
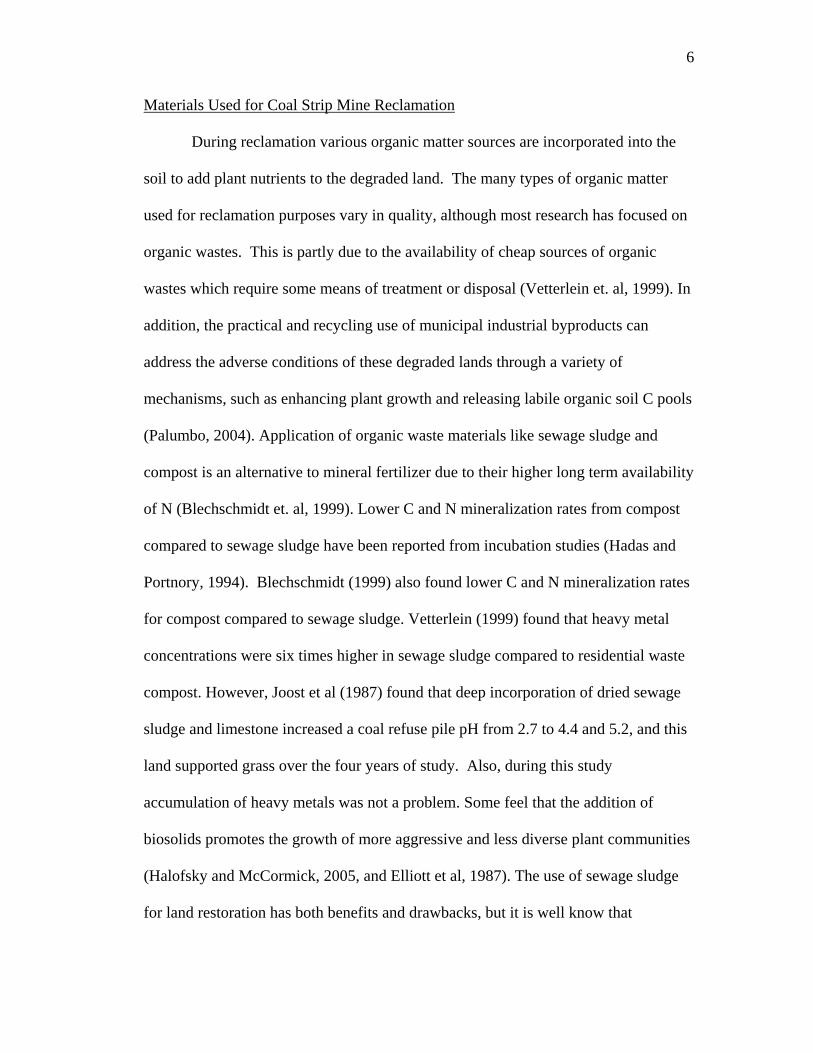
Materials Used for Coal Strip Mine Reclamation
During reclamation various organic matter sources are incorporated into the
soil to add plant nutrients to the degraded land. The many types of organic matter
used for reclamation purposes vary in quality, although most research has focused on
organic wastes. This is partly due to the availability of cheap sources of organic
wastes which require some means of treatment or disposal (Vetterlein et. al, 1999). In
addition, the practical and recycling use of municipal industrial byproducts can
address the adverse conditions of these degraded lands through a variety of
mechanisms, such as enhancing plant growth and releasing labile organic soil C pools
(Palumbo, 2004). Application of organic waste materials like sewage sludge and
compost is an alternative to mineral fertilizer due to their higher long term availability
of N (Blechschmidt et. al, 1999). Lower C and N mineralization rates from compost
compared to sewage sludge have been reported from incubation studies (Hadas and
Portnory, 1994). Blechschmidt (1999) also found lower C and N mineralization rates
for compost compared to sewage sludge. Vetterlein (1999) found that heavy metal
concentrations were six times higher in sewage sludge compared to residential waste
compost. However, Joost et al (1987) found that deep incorporation of dried sewage
sludge and limestone increased a coal refuse pile pH from 2.7 to 4.4 and 5.2, and this
land supported grass over the four years of study. Also, during this study
accumulation of heavy metals was not a problem. Some feel that the addition of
biosolids promotes the growth of more aggressive and less diverse plant communities
(Halofsky and McCormick, 2005, and Elliott et al, 1987). The use of sewage sludge
for land restoration has both benefits and drawbacks, but it is well know that
7
vegetation will grow in soil amended with biosolids (Sopper, 1994). Organic sources
will supply many nutrients to vegetation, however, when and how long nutrients will
be available are dependent on mineralization rates. Grandy (2002) found higher total
C mineralization rates from cattle manure than from waste potato compost (i.e., 267
g/kg versus 176 g/kg, respectively) and pH values were similar. Liming materials
have different calcium carbonate equivalents (CCE) for their acidity neutralizing
capabilities. Higher CCEs will have more of an impact on the acidic substrate being
remediated. Many of the organic materials used for amending soils have some
neutralizing capabilities. The organic materials used for amending soils may have a
pH of 7 - 10, which aids in neutralizing the very acidic coal mine soil.
Remediation with biosolids
Remediation with biosolids seems to be one of the most common materials
used for land reclamation for several reasons. First, the source is plentiful from
municipal wastewater treatment facilities and cheap. Pennsylvania produces
approximately 300,000 tons dry weight basis of sewage sludge a year (Stehouwer,
1999). .Biosolids may be applied on land, landfilled or incinerated, but land
application is preferred because it is rich in nutrients and organic matter (Bakner,
2005). Typical rates of biosolids applied in Pennsylvania range from 80 to 134 Mg
ha-1 (dry weight basis) which is the largest rate allowed by Pennsylvania Department
of Environmental Protection (Stehouwer et al, 2006). The Environmental Protection
Agency (EPA) in 1993 established Title 40 (part 503) under Section 405 (d) of the
Clean Water Act to regulate land application of sewage sludge, concerning
8
concentration limits and loading rates for chemicals, and treatment and use
regulations to control and reduce pathogens and disease vectors (National Research
Council, 2002). Stehouwer et al, (2006) found that application of 134 Mg ha-1 had
several negative effects on vadose zone water quality that could potentially impact
area ground or surface waters, mostly from nitrogen leaching within the first year of
application. The addition of biosolids in place of topsoil for reclamation on
Pennsylvania surface coal mines creates an effective barrier to oxygen influxes.
Because of the oxygen barrier, acidity, sulfate, and metal concentrations were
elevated in ground water (6 to 21 meter depth) from active oxidation of pyrite by iron
– oxidizing bacteria under sludge treated spoil relative to untreated spoil. Also,
elevated nitrate levels exceeding 10 mg/L have been found in many other locales
(Cravotta, 1998). Nitrogen does not fall into the list of pollutants in EPA chemical
standards for regulation (National Research Council, 2002). According to Sopper,
(1994) surface and groundwaters should be monitored before and after biosolids
applications; however, with water pollution problems from AMD creating a severely
degraded aquifer, it can be exempted from nondegradation regulations. Therefore, if
an AMD stream or ground water affected by AMD already has a high concentration
of metals and low pH, nitrate levels are legally elevated. Agronomic practices only
apply crop nitrogen rates needed for that year. However, since biosolids are typically
a one time application it is advised to exceed the nitrogen requirement of vegetation,
because only 20 percent of the total nitrogen will be mineralized and available for the
plant the first year (Sopper, 1994). Many chemicals and other constituents are
monitored in biosolids application. In contrast, the high quantities of plant
9
macronutrients in biosolids application seem to be ignored in the belief that more is
good thing.
1.2. Research Objectives
The hypotheses of this study was that a degraded soil covered by a layer of
acid mine drainage (AMD) precipitates could be remediated with minimal additions
of lime and compost. This study was conducted in an acid mine drainage AMD kill
zone (area lacking vegetation and diverse microbial populations) about one acre in
size in Clearfield County, PA. The development of restoration methods using
minimal inputs would enable inputs to be applied to larger areas of other devastated
sites, which would increase the pace of remediation statewide. Also, minimal inputs
in comparison to typical biosolids applications would not overload the ecosystem
with nutrients that could leach to groundwater and adversely affect the environment.
Furthermore, minimal inputs will also promote natural establishment of native species
including woody species. Four key objectives were met in this research: 1)
establishment of vegetation in the field; 2) improvement of physical soil quality in the
field; 3) improvement of soil biological properties in the field; and 4) comparison of
results from leached soils columns in the greenhouse with field measurements. In this
thesis, chapter 2 describes the field site and research methods used in the field and
greenhouse components, chapters 3 and 4 give results and discussions of field and
greenhouse experiments respectively, and chapter 5 contains overall conclusions of
the research.
10
References
Bakner, B.L., 2005. Land-based biosolids recycling in Pennsylvania: prevalence and nutrient distribution. Masters thesis. The Pennsylvania State University. College of Agricultural Sciences.
Blechschmidt, R., Schaaf, W., Huttl, R. F., 1999. Soil microcosm experiments to
study the effects of waste material application on nitrogen and carbon turnover of lignite mine spoils in Lusatia (Germany). Plant and Soil. 213: 23 – 30.
Bradshaw, A. 1997. Restoration of mine lands – using natural processes. Ecological
Engineering. 8: 255 – 269. Compton, J.E., and R. D. Boone. 2000. Long-term impacts of agriculture on soil
carbon and nitrogen in New England forests. Ecology. 81: 2314 – 2330. Cravotta, C.A. III, 1998. Effect of sewage sludge on formation of acidic ground water
at a reclaimed coal mine. Ground Water. 36: 1. 9 – 19. Elliott, C.L., McKendrick, J.D., and Helm, D. 1987. Plant Biomass, Cover, and
Survival of Species Used for Stripmine Reclamation in South-Central Alaska, U.S.A. Arctic and Alpine Research, Vol 19 No. 4. 572 – 577.
Grandy, A.S., Porter, G.A., and M. Erich. 2002. Organic Amendment and Rotation
Crop Effects on the Recovery of Soil Organic Mattter and Aggregation in Potato Cropping Systems. Soil Sci. Soc. Am. J. 66: 1311 – 1319.
Daniels, W.L. 2004. Prospects for Enhancing Carbon Sequestration and Reclamation of Degraded Lands with Fossil – Fuel Combustion By – Products. Advances in Environmental Research. 8: 425 – 438.
Pennsylvania Growing Greener. Pennsylvania Department of Environmental
Protection. http://www.depweb.state.pa.us/growinggreener/site/default.asp. verified October 16, 2008.
Pennsylvania Organization for Watersheds and Rivers. Abandoned Mine Reclamation
in Pennsylvania. 2002. Harrisburg, PA. Sopper, W.E., 1994. Manual for the revegetation of mine land in the eastern United
States using municipal biosolids. National Mine Land Reclamation Center at West Virginia University.
12
Stehouwer, R. Land Application of Sewage Sludge in Pennsylvania. Use of Biosolids in Crop Production. Pennsylvania State University, College of Agricultural Sciences, Cooperative Extension. 1999.
Stehouwer, R., Day, R.L., Macneal, K.E. 2006. Nutrient and trace element leaching
following mine reclamation with biosolids. Journal of Envirnmental Quality. 35:1118-1126.
Vetterlein, D., and Huttl, R.F., 1999. Can applied organic matter fulfil similar
functions as soil organic matter? Risk-benefit analysis for organic matter application as a potential strategy for rehabilitation of disturbed ecosystems. Plant and Soil. 213: 1-10.
13
Chapter 2
SITE DESCRIPTION AND EXPERIMENTIAL DESIGN
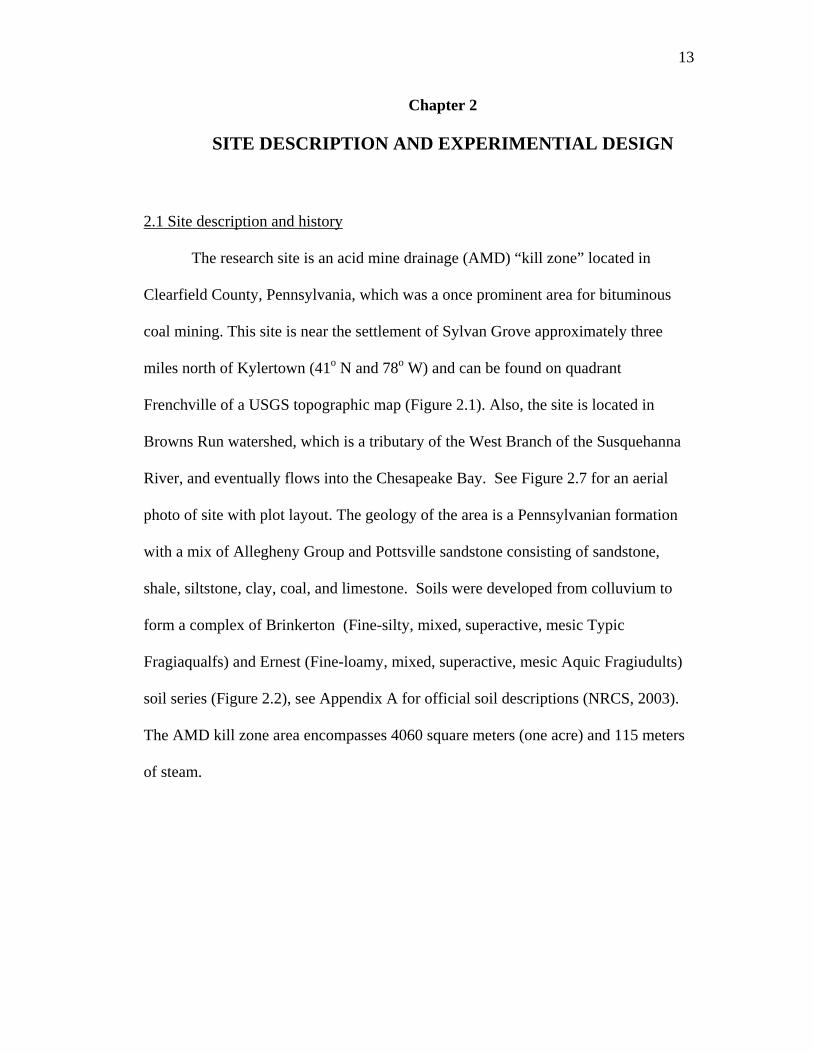
2.1 Site description and history
The research site is an acid mine drainage (AMD) “kill zone” located in
Clearfield County, Pennsylvania, which was a once prominent area for bituminous
coal mining. This site is near the settlement of Sylvan Grove approximately three
miles north of Kylertown (41o N and 78o W) and can be found on quadrant
Frenchville of a USGS topographic map (Figure 2.1). Also, the site is located in
Browns Run watershed, which is a tributary of the West Branch of the Susquehanna
River, and eventually flows into the Chesapeake Bay. See Figure 2.7 for an aerial
photo of site with plot layout. The geology of the area is a Pennsylvanian formation
with a mix of Allegheny Group and Pottsville sandstone consisting of sandstone,
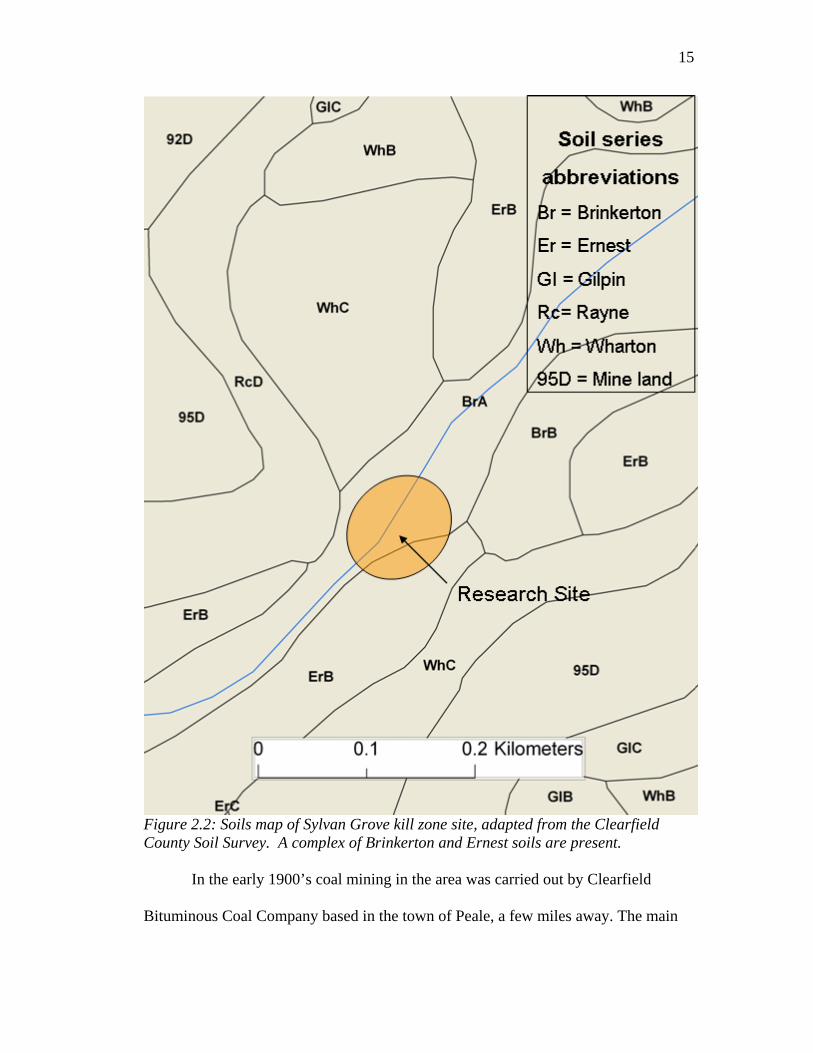
shale, siltstone, clay, coal, and limestone. Soils were developed from colluvium to
form a complex of Brinkerton (Fine-silty, mixed, superactive, mesic Typic
Fragiaqualfs) and Ernest (Fine-loamy, mixed, superactive, mesic Aquic Fragiudults)
soil series (Figure 2.2), see Appendix A for official soil descriptions (NRCS, 2003).
The AMD kill zone area encompasses 4060 square meters (one acre) and 115 meters
of steam.
14
Figure 2.1: Topographic map of Sylvan Grove kill zone site.
15
Figure 2.2: Soils map of Sylvan Grove kill zone site, adapted from the Clearfield County Soil Survey. A complex of Brinkerton and Ernest soils are present. In the early 1900’s coal mining in the area was carried out by Clearfield
Bituminous Coal Company based in the town of Peale, a few miles away. The main
16
entrance to the underground network of mining tunnels was located in Peale, and the
company stopped mining coal sometime before 1950. Approximately 100 years ago,
the current research site had been a horse pasture on a footslope location (Krasinski,
2005). When the abandoned mine tunnels filled with water, an AMD seep emerged
immediately uphill of the site and flooded the area. As the AMD flowed across the
site toward Brown’s Run, vegetation was killed by the acidity and the ground became
covered with oxidized iron deposits. Over the years, more iron oxides accumulated
and in some areas turned into a hard crust, which is believed to be formed by
cementation of iron oxides with organic compounds.
Over time, AMD flow eroded one channel large enough to contain the smaller
quantity of flow. Currently, a steady stream of AMD (pH 2.5) flows all year down
this channel into Brown’s Run (Figure 2.1). The one-acre kill zone site remains
barren and exhibits eroded rills and gullies with varying depths of iron oxide crusts,
which are very acidic (pH 2.8). Considerable sheet erosion has occurred, and the
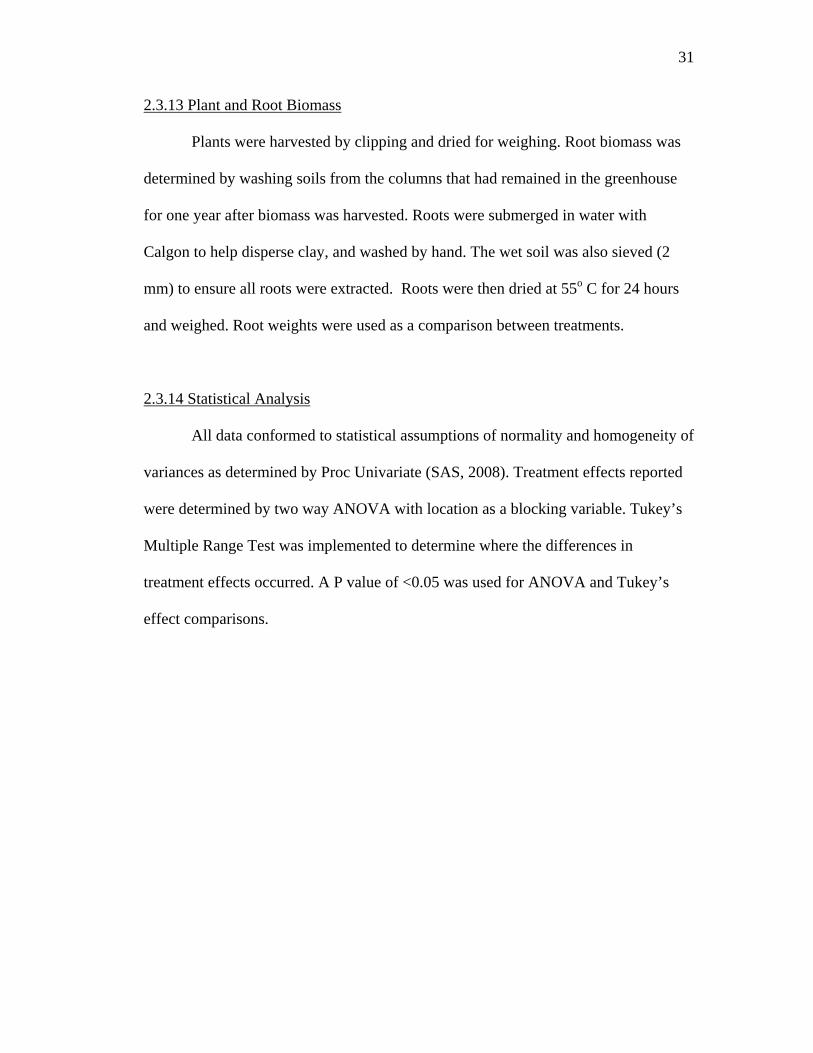
original soil’s subsurface is exposed in places (Figure 2.4, 2.5 and 2.6). The site
exhibits large variations in micro-topography, color of sediments and exposed
subsoil, and moisture content. These variations developed as a result of differences in
landscape positions, water table heights, and possibly duration of water flow across
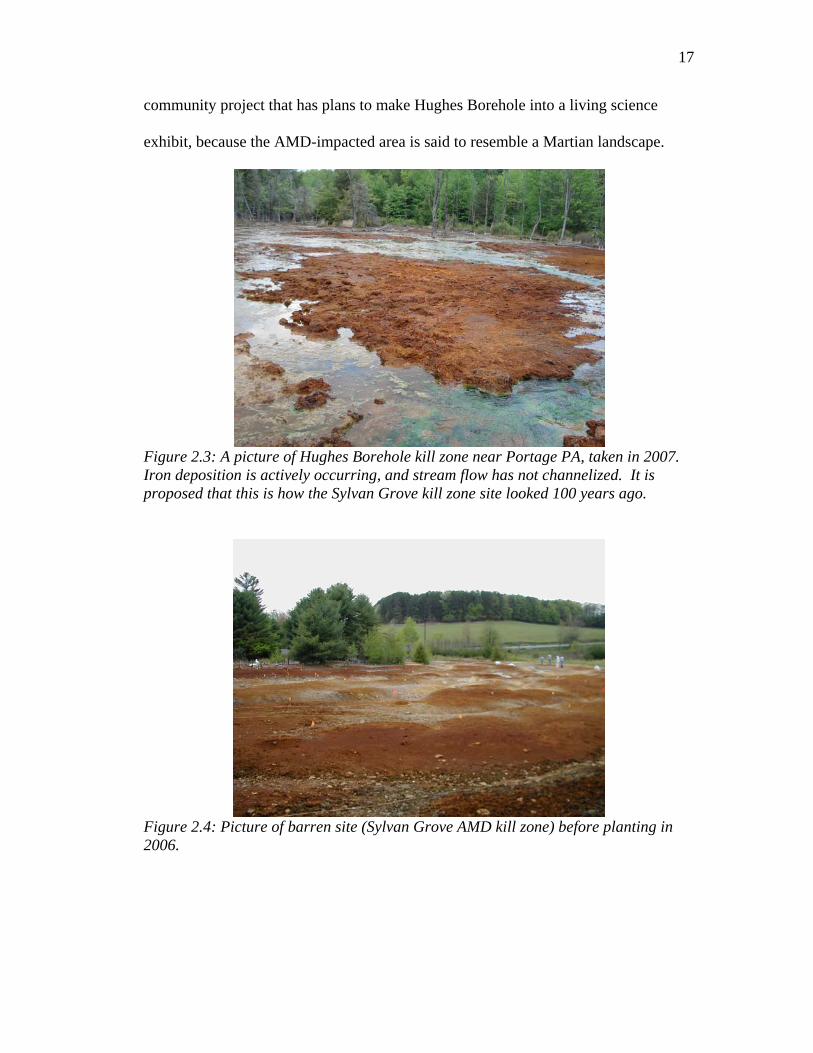
selected areas. Before the steam channelized and iron deposition erosion occurred, it
is believed that the site looked similar to the Hughes Bore Hole site, Portage PA
Cambria County (Figure 2.3). Currently the Stonycreek –Conemaugh River
Improvement Project is trying to treat the AMD spring before it discharges into
Stonycreek, which flows to the Little Conemaugh River. "AMD and Art" is a
17
community project that has plans to make Hughes Borehole into a living science
exhibit, because the AMD-impacted area is said to resemble a Martian landscape.
Figure 2.3: A picture of Hughes Borehole kill zone near Portage PA, taken in 2007. Iron deposition is actively occurring, and stream flow has not channelized. It is proposed that this is how the Sylvan Grove kill zone site looked 100 years ago.
Figure 2.4: Picture of barren site (Sylvan Grove AMD kill zone) before planting in 2006.
18
2.2. Experimental Design
Spatial heterogeneity of the site is evident in Figure 2.4, which is a
photograph taken facing a NW direction at the top of the orange zone location. Prior
to test plot placement, the depths of iron oxide crusts were measured every 3 meters
at the site, and a map based on crust depth was generated (Figure 2.5). Iron crust
depths ranged from 0-35 centimeters, with the site being traversed by many rills and
gullies (Figure 2.6).
19
Figure 2.5: Site map of area in 2005 with iron deposition depth in cm sampled every 3 meters (sampling points numbered). Iron depths ranged from 0- 35 cm on the site.
20
Figure 2.6: Site map of area in 2006 showing rills and gullies (in gray) and placement of the main stream channel (in blue).Yellow dots indicate sampling points for measuring thickness of iron oxide deposits.
21
Based on the site map, three distinct “zones” were identified: 1) very wet area
due to a higher water table and exhibiting deep red iron oxide crusts often covered
with algae and mosses (red zone); 2) drier area with thinner crusts of a lighter orange
color (orange zone); and 3) driest area represented by mounds of exposed subsoil,
gray in color with little or no crust (gray zone). A composite (50 soil samples 15 cm
deep) sample was taken from each zone for chemical analyses (Table 2.1). Soil pH
was very low in all zones and ranged from 2.7 – 3.3. All nutrients were below
optimum especially P, K, Mg, and Ca. Exchangeable acidity ranged from 12.3-26.1
meq/100g soil. Sulfur ranged from 311 ppm in the gray zone up to 1306 ppm in the
red zone, which was 4 times higher than in the gray zone
High rate compost (54,000 kg/ha), lime, seeds sown at 70 kg/ha
Table 2.3: Listing of treatments for research plots in each zone
24
N
Red Zone
Gray Zone
Orange Zone
Large Spring
Spring re-emergence
One Acre Area
NN
Red Zone
Gray Zone
Orange Zone
Large Spring
Spring re-emergence
One Acre Area
Figure 2.7: Aerial photograph of research site with plot layout illustrated. The location of the large AMD-laden spring is on the bottom right. Channelized stream flows northwest and empties into Brown's Run at the upper left. Underground flow near the soil surface occurs in the Red Zone, with water spring re-emerging at the surface immediately to the north. “Baseline measurements” consisted of taking composite samples of untreated
soil within each treatment zone. Lime and compost was incorporated with a rototiller
for all treatments on June 25, 2006. Then a “wildlife” seed mixture used by the PA
DEP Bureau of Abandoned Mine Reclamation, provided by Douglas Saylor of the
Moshannon Field Office of the DEP was broadcasted by hand at a rate of 70 kg/ha.
Seed species consisted of 59.9% rye, 14.9% fawn tall fescue, 14.2% Potomac orchard
and 1% redtop. The seeds were then lightly raked and rolled with a 25 kg roller to
create good seed-to-soil contact and promote germination. Each plot was mulched by
broadcasting half a bale of oat straw (approximately 9 kg) on the surface. Oat seed
was included in the straw, so that the oat seedlings served as a nurse crop. Vegetative
responses and soil properties were measured for two growing seasons in 2006 and
2007.
2.3 Materials and Methods
2.3.1 Soil Sampling Procedures
Soil from the plots (top 5 cm) were sampled randomly (50 samples) with a
probe (inside diameter 1.9 cm) and composited on 10-26-06 and 10-31-07. Soil
samples were analyzed for pH, EC, respired CO2, recovery and enumeration of viable
bacteria, and microbial biomass carbon flush. Samples were split, with one portion
kept moist and the other portion air-dried and ground < 2mm with a hammermill-style
grinder. Moisture content was determined gravimetrically. Moist soil samples were
stored at 4o C for less than 2 days before dilution plating on surfaces of R2A agar
plates. Microbial colony forming units were determined after 10 days incubation at
25°C, microbial biomass carbon flush was determined within 2 weeks of soil
sampling, and respired CO2 was determined in less than 4 weeks after sampling.
2.3.2 Soil pH
A 1:1 ratio of soil to distilled water was used to determine soil pH. Ten
milliliters of water was added to 10 grams of dry soil. The solution was mixed, and
26
the slurry was left to react for 10 minutes. The pH was determined with an glass
electrode in the slurry supernatant (Thomas, 1996).
2.3.3 Soil EC
An electrical conductivity meter was used on a 1:1 ratio of soil to distilled
water. Out put was measured in dS/m.
2.3.4 Water EC
An electrical conductivity meter was also used directly in water samples to
determine EC measured in dS/m.
2.3.5 Respired CO2
Carbon mineralization was determined by incubation of moist soil in sealed
mason jars with a Li-Cor, infra red gas analyzer (IRGA) model Li-6262. After soil
moisture was determined gravimetrically, duplicate 50 gram subsamples (dry weight
equivalent) of soil were weighed into plastic Dixie cups. A pre-determined quantity
of water was added to bring the moisture content up to 30%. Each sample was placed
in a sealed mason jar to incubate at 25 deg C for one week. Then, CO2 flux in the jars
head space was determined by IRGA.
2.3.6 Enumeration of Culturable Microorganisms (Microbial Population in Colony Forming Units (CFU)) Serial dilutions were plated onto R2A agar. Soil dilutions were made with a
0.1% Tryptone Peptone solution (Zuberer, 1994). R2A agar is known to perform
better than other plating mediums by several different factors (Reasoner and
27
Geldreich, 1985) Duplicated dilutions ranged from 10-4 to 10-7. Colony forming units
were counted on days 2, 7, and 10 of incubation at 25ºC.
2.3.7 Microbial Biomass Carbon Flush
Soil microbial biomass carbon was determined by the chloroform fumigation-
extraction method using 0.5 M K2SO4 (Horwath and Paul, 1994). Twenty grams of
duplicate soils samples were weighed into a 50 ml glass beaker both for fumigation
and non fumigation. Half the samples were placed in a vacuum desiccator under an
extraction hood lined with moist paper towels and 50 ml of ethanol-free chloroform
and anti bumping granules. The desiccator was evacuated with the pump three times
until chloroform boiled vigorously, and air was allowed to pass back into the
desiccator each time to facilitate chloroform vapor distribution throughout the soil
samples. The desiccator was evacuated for the fourth time and chloroform boiled
vigorously for two minutes, after which the valve was closed. The other portions of
soil samples were placed in a separate desiccator lined with moist paper towels for
incubation without chloroform. Samples in both desiccators were incubated for five
days in the dark and at 25 deg C. After five days the desiccator containing chloroform
was placed in a fume hood, and the chloroform and paper towels were removed. The
desiccator was evacuated eight times by letting air pass into the desiccator for 3 min
during each evacuation to remove residual chloroform. Following this procedure, no
residual chloroform could be detected by smell. The fumigated and non-fumigated
soil samples were extracted with 0.5 M of K2SO4 at a ratio of 5:1 (weight of
extractant to dry soil weight). The soil and extractant were shaken on an orbital
28
shaker at 180 strokes per minute for 1 hour. After shaking, the soil suspension was
filtered with Whatman #2 and the filtrate collected. The filtrate was stored at 4 deg C
maximum of 1 week or frozen until analyzed. A blank filtrate was extracted alone,
and ran for each batch of samples analyzed to determine background levels of C.
Total Organic carbon was determined using a Shimadzu Carbon Analyzer. Soil
microbial biomass carbon was calculated by the difference between fumigated and
non-fumigated samples, and expressed as soil microbial biomass C flush per gram of
soil (Fierer and Schimel, 2002).
2.3.8 Penn State Ag Analytical Service Lab Soil Methods
Soil analyses were performed by Penn State Agricultural Analytical Service
Laboratory. Soil pH was determined by the water method. Available P, K, Ca, Mg,
Zn, Cu, and S were determined with a Mehlich 3 extractant and analyzed with a ICP.
Summation was used for determination of cation exchange capacity (CEC). Organic
matter was obtained by loss on ignition, and total carbon by Combustion – Fisons NA
1500 Elemental Analyzer. Total N was also obtained by combustion. Nitrate and
ammonium N were determined with a specific ion electrode. Electrical conductivity,
a 1:2 ratio was used for soluble salt evaluation.
2.3.9 Germination Rate
Seedling germination rate was determined by counting seedlings in ten 100
cm2 quadrants per treatment and averaged per area for comparison.
29
2.3.10 Percent Ground Cover and Vegetative Diversity (10 Point Sampling)
A ten-pin frame was used to take one hundred pin readings per plot (Figure
2.8). The pins were set at a 45o angle, and every time vegetation touched a pin the
species of plant was recorded (Bureau of Land Management, 1999). The amounts of
bare ground and litter were also recorded. The total numbers of hits were recorded
for each species to determine total ground coverage and percent composition. Also,
ground cover greater than 100% is possible if multiple hits (overlapping canopies)
occurred at each point along transect (Bureau of Land Management, 1999).
Figure 2.8: Ten-pin frame used to count vegetative hits.
2.3.11 Aboveground Plant Biomass (Total and by Individual Species)
Plant biomass was determined by harvesting (4) quarter-square meter
quadrants per treatment. Plants were harvested by cutting with a hand trimmer 2.54
centimeters from the soil surface. Botanical composition of plants were separated by
30
species and dried at 60o C for 48 hours (Deak et al, 2007). Samples were then
weighed and calculated as total and individual species by kg/ha equivalents.
2.3.12 Greenhouse Leaching Study Set Up With Soil Columns
Six PVC columns (15.24 cm diameter) of soil from each zone were taken
from the Sylvan Grove kill zone. Twelve inch high columns were pounded into the
ground with a 10-lb sledge hammer, a metal plate was fixed onto the top of the
column to hammer on, and a removable metal cone fixture was attached to the
bottom. The cone resembled the cone attachment on a soil probe. Once the columns
were inserted to a depth of 20.3 centimeters, the soil outside the column was removed
so that the entire column could be removed with a shovel. The bottoms of the soil
columns were leveled, and care was taken not to smear or compact soil. Columns
were placed into Buchner funnels with sand in the funnel bottom. The funnels and
columns were placed into holding racks in a greenhouse. Soils in duplicate columns
received the following treatments: no amendment; lime only; lime plus compost at a
rate of 27,000 kg/ha; and lime plus compost at a rate of 54,000 kg/ha. Soils were
sown with the DEP seed mix and lightly mulched with straw. These treatments were
identical to those applied to the plots at the Sylvan Grove site. Plants were watered
regularly with equal quantities of water. Columns were leached with distilled water,
and leachates were collected the same day for analyses on May 7, 2007 and June 9,
2007.
31
2.3.13 Plant and Root Biomass
Plants were harvested by clipping and dried for weighing. Root biomass was
determined by washing soils from the columns that had remained in the greenhouse
for one year after biomass was harvested. Roots were submerged in water with
Calgon to help disperse clay, and washed by hand. The wet soil was also sieved (2
mm) to ensure all roots were extracted. Roots were then dried at 55o C for 24 hours
and weighed. Root weights were used as a comparison between treatments.
2.3.14 Statistical Analysis
All data conformed to statistical assumptions of normality and homogeneity of
variances as determined by Proc Univariate (SAS, 2008). Treatment effects reported
were determined by two way ANOVA with location as a blocking variable. Tukey’s
Multiple Range Test was implemented to determine where the differences in
treatment effects occurred. A P value of <0.05 was used for ANOVA and Tukey’s
effect comparisons.
32
References
Deak, A. M. H. Hall, M. A. Sanderson, and D. D. Archibald. 2007. Production and Nutritive Value of Grazed Simple and Complex Forage Mixtures. Agronomy Journal. 99: 814-821.
Fierer, N. and J.P. Shimel. 2002. Effects of Drying – Rewetting Frequency on Soil
Horthwath, W.R. and E.A. Paul. 1994. Microbial Biomass: Microbiological and
Biochemical Properties, p 753-774, Methods of soil analysis. Part 2. SSSA book series. 5. SSSA, Madison WI.
Hughes Bore Hole Wikipedia, Free Encyclopedia. May 21, 2008.
http://en.wikipedia.org/wiki/Hughes_bore_hole, (verified 15 Sept. 2008) Krasinski, Mary. 2005. Personal communication.
Official Soil Description, National Cooperative Soil Survey. National Resource Conservation Service. United States Department of Agriculture. 1999 & 2003.
Organic Materials Processing and Education Center (OMPEC). Agricultural Engineering. Pennsylvania State University. Available at http://www.age.psu.edu/psu-compost/.
Reasoner, D.J., and E.E. Geldreich. 1985. A New Medium for the Enumeration and
Subculture of Bacteria From Potable Water. Applied and Environmental Microbiology. 49:1-7.
Thomas, G.W. 1996. Soil pH and soil acidity p. 475-490. in J.M. Bighan (ed). Methods of soil analysis. Part 3 – chemical methods. Soil Science Society of America Book Series No. 5. Soil Science Society of America and American Society of Agronomy, Madison, WI.
33
Zibilske, L.M.,1994. Carbon Mineralization: Microbiological and Biochemical Properties, p. 835-859, Methods of soil analysis. Part 2. SSSA book series. 5. SSSA, Madison WI.
Zuberer, D.A., Recovery and Enumeration of Viable Bacteria, p. 119-144, Methods
of soil Analysis part 2. Microbiological and Biochemical Properties. SSSA book Series 5. SSSA, Madison, WI.
34
Chapter 3
Field Site Experiment
3.1 Introduction: Measurement of Soil Quality Indicators
Soil quality can be considered a very broad soil property, since it can
encompass many soil indicators. Characteristics of the soil microbial community are
often considered to be the most responsive indicators of the progress of restoration
following soil degradation (Harris, 2003: Machulla et al., 2005). In this study,
chemical, microbial, and vegetative properties were considered as indicators of soil
quality. Indicators for assessing soil quality for agro–ecosystems are organic matter,
pollutants, and soil respiration (Arshad and Martin, 2002). Results of measurements
made for amended soils were compared with results for unamended soils directly
adjacent to field plots in the 2006 and 2007 growing seasons.
3.2 Soil Chemical Properties
3.2.1. Soil Moisture
Soil moisture content throughout the research site was not consistent (Figure
3.1). Three general zones were identified on basis of soil color (depth of iron) and
moisture content. The red zone had extremely high moisture content compared to
orange and gray zones. The red zone maintained statistically higher moisture content
(P < 0.05) throughout the year in comparison to orange and gray zone, with a water
content ranging from 63 - 84% by weight. Tabular data can be found in Appendix C.
35
Soil Moisture
0102030405060708090
Red Lim
e
Red Low
Red High
Red Lim
e Outsi
de
Red Low
Outs
ide
Red High
Outs
ide
Orange L
ime
Orange L
ow
Orange H
igh
Orange L
ime O
utside
Orange L
ow Outs
ide
Orange H
igh Outs
ide
Gray Lim
e
Gray Low
Gray High
Gray Lim
e Outs
ide
Gray Low
Outsi
de
Gray High
Outsi
de
Zone and Treatment
% M
oist
ure
20062007
Figure 3.1: Graph of percent soil moisture taken at the end of 2006 & 2007 growing season. Results are shown for inside amended plots and area directly outside of that plot. Orange and gray zone moistures can be considered as typical field moisture values. Red zone soils have very high moisture contents and could almost be considered water logged.
3.2.2 Soil pH
A proven indicator of soil quality is pH. To a great extent, soil pH determines
the availability of nutrients to plants and microorganisms by affecting protonation,
speciation, and oxidation-reduction reactions. Statistical differences between
unamended and amended plots were found (P= <0.0001 for 2006 and P = 0.0001 for
2007) each year. However, no differences were observed from one year to another (P
= 0.64). There were differences within each single year between amended zones and
treatments, and in unamended treatments by zone. In 2006, unamended soils were
highly acidic, ranging from 2.34 in the red zone to 3.2 in the gray zone. Presumably
due to the lime treatments carried out in May 2006, all amended soils consistently had
higher pH than unamended soils that year. However, all pH values remained acidic
36
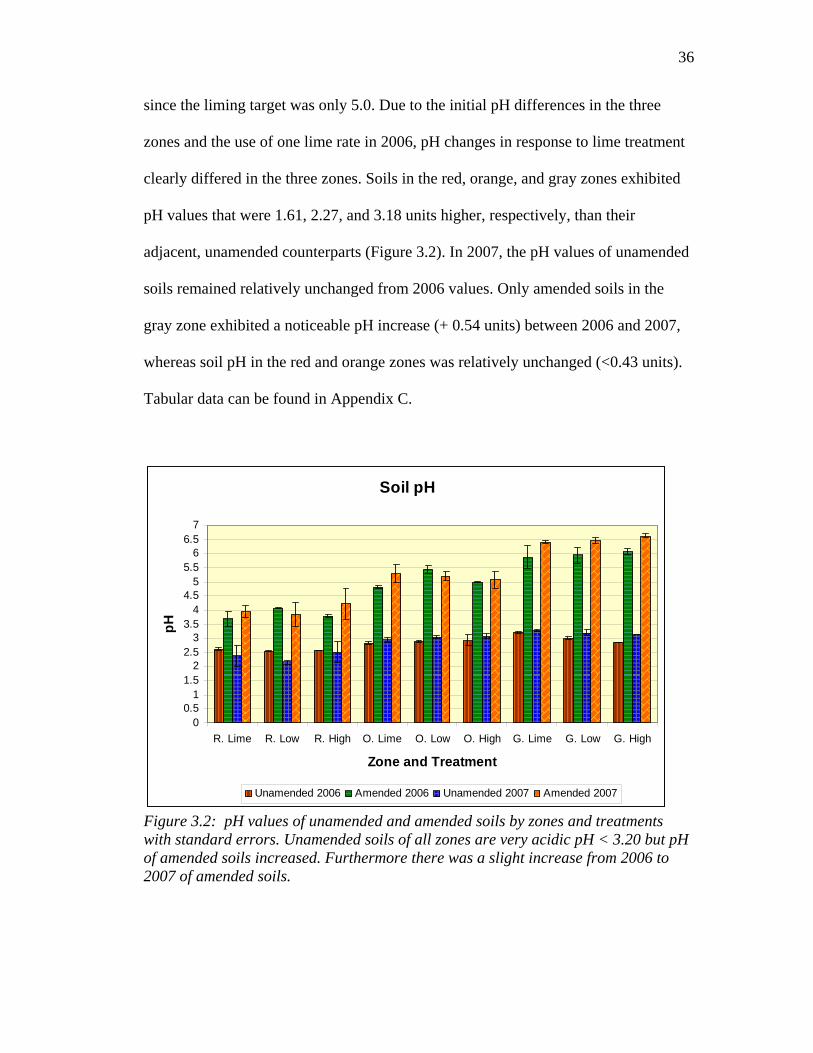
since the liming target was only 5.0. Due to the initial pH differences in the three
zones and the use of one lime rate in 2006, pH changes in response to lime treatment
clearly differed in the three zones. Soils in the red, orange, and gray zones exhibited
pH values that were 1.61, 2.27, and 3.18 units higher, respectively, than their
adjacent, unamended counterparts (Figure 3.2). In 2007, the pH values of unamended
soils remained relatively unchanged from 2006 values. Only amended soils in the
gray zone exhibited a noticeable pH increase (+ 0.54 units) between 2006 and 2007,
whereas soil pH in the red and orange zones was relatively unchanged (<0.43 units).
Tabular data can be found in Appendix C.
Soil pH
00.5
11.5
22.5
33.5
44.5
55.5
66.5
7
R. Lime R. Low R. High O. Lime O. Low O. High G. Lime G. Low G. High
Figure 3.2: pH values of unamended and amended soils by zones and treatments with standard errors. Unamended soils of all zones are very acidic pH < 3.20 but pH of amended soils increased. Furthermore there was a slight increase from 2006 to 2007 of amended soils.
37
As stated in chapter 2, the reserve acidity levels of soils in the three zones
differed in the beginning of the experiment, with red, orange, and gray soils having
highest, intermediate, and lowest acidity. This same pattern of pH differences was
observed in both unamended and amended soils.
3.2.3 Soil Electrical Conductivity (EC)
Soil electrical conductivity is the measure of soluble salts in soil solution
which affects the amount of electrical current that can be carried though the soil
solution. EC is measured typically to determine whether soils are saline in arid or
semi arid temperature regimes. In general, soils with lower pH exhibited higher EC
values (Table 3.1).
EC (dS/m)
Amended 2006
Unamended2006
Amended2007
Unamended2007
R. Lime 3.2 1.9 1.2 0.9 O. Lime 1.2 0.6 0.7 0.3 G. Lime 0.6 0.3 0.2 0.2 R. Low 3.0 1.5 1.2 0.8 O. Low 0.5 0.5 0.7 0.3 G. Low 0.6 0.4 0.2 0.2 R. High 2.4 1.9 1.5 1.1 O. High 1.2 0.4 0.5 0.3 G. High 0.9 0.4 0.3 0.2 Table 3.1: Soil EC values of amended and unamended treatments. In general also referring back to figure 3.2 treatments in the red zone had the lowest pH, then orange zone treatments was in the middle with gray zone treatments having the highest pH. EC values are higher in soils that had lower pH.
3.2.4 Soil Fertility
Soil fertility is a very important component of overall soil quality. Table 3.2
lists fertility values for both unamended and amended treatments, Appendix B lists
38
raw data for soil fertility done by PSU Ag Analytical Services Laboratory. Soil
fertility of amended soils improved greatly compared to unamended soils. Most
values are still considered to be below optimum, except for Mg concentrations which
were above optimum in some situations. Reserve acidity dropped over 50% which
greatly improved soil quality. The percent organic matter increased, in compost-
amended soils along with base cation percent saturation.
Unamended 0.6 2.9 8.0 1.4 1.7 1066.6 5.0 Amended Lime 1.2 17.1 48.4 0.4 1.3 1365.9 5.1 Amended Low 1.4 14.5 49.5 1.8 1.9 1211.4 5.5 Amended High 1.3 12.0 50.7 0.7 2.7 1265.3 6.4 Table 3.2: 2006 & 2007 average soil fertility tested by PSU Ag Analytical for unamended and amended soils with treatments. All properties increased once amended except reserve acidy decreased.
3.3 Soil Microbial Properties
3.3.1 Enumeration of Culturable Microorganisms
Recovery and enumeration of viable bacteria were conducted to determine if
numbers of microbial colony forming units (CFU’s) would change following
amendments and plant establishment. CFU values and comparisons are presented in
Figure 3.3 and 3.4, and in tabular form in Appendix C. Measurement of the culturable
microbial community has utility as an indicator of re-establishment between biota and
39
restoration function in degraded systems (Harris, 2003). Also, an advantage of
microbial based measurements over larger organisms is that signals are easier to see
from recovering ecosystem microbial communities (Harris, 2003).This is true even
though only 1% of soil microbes are culturable on plates (Amann et. al, 1995).
Unamended soils log CFU/g soil 2006 and 2007
0.0
1.0
2.0
3.0
4.0
5.0
6.0
7.0
8.0
R. L
ime
O. L
ime
G. L
ime
R. L
ow
O. L
ow
G. L
ow
R. H
igh
O. H
igh
G. H
igh
Zone and Treatment
log
CFU
/g s
oil
2006 Unamended 2007 Unamended
Figure 3.3: Ten day log average of culturable colony forming units per gram of soil for unamended soils by zones and treatments. A drop in CFU occurred in 2007 this may be caused from environmental factors. R = red zone, O = orange zone, G = gray zone. Unamended soil samples were taken within a two foot perimeter of amended plots.
40
Amended soils log CFU/g soil 2006 and 2007
0.0
1.0
2.0
3.0
4.0
5.0
6.0
7.0
8.0
9.0
R. L
ime
O. L
ime
G. L
ime
R. L
ow
O. L
ow
G. L
ow
R. H
igh
O. H
igh
G. H
igh
Zone and Treatment
Log
CFU
/g s
oil
2006 Amended 2007 Amended
Figure 3.4: Ten day log average of culturable colony forming units per gram of soil for amended soils by zones and treatments. R = red zone, O = orange zone, G = gray zone. There was not a large difference between treatments and zones. However, there is an appreciable increase from unamended soils found in Appendix C.
All statistics were done with P = 0.05 significance level. Statistical differences
(P <0.05) were seen between amended plots in 2007 among different treatments. The
difference between unamended and amended soils was significant at P =0.001.
Culturable organisms in unamended soils ranged from 3.62 – 6.65 log CFU/g.
Amended soil log CFU/g ranged from 6.81 – 8.28. In 2007 all CFU values decreased
in the lime-only plots in all zones and in the orange zone for all 3 treatments. This
decrease in lime-only plots may have been due to a flush of microbial activity in
2006, followed by conditions in 2007 that did not provide enough organic matter to
support microbial growth. Overall decreases in the orange zone were probably due to
the fact that the 2007 growing season was a drier year than 2006 and also due to the
orange zone being slightly drier and more acidic than the gray zone. However, CFU
counts increased in the majority of compost + lime amended soils. This increase
41
occurred due to several factors: increase in organic matter for a food source from both
compost and root production, higher moisture content due to more water-holding
capacity with organic matter, and increase of soil pH, all of which would create a
more favorable environment for microbes. From 2006 to 2007 a general change was
observed in microbial composition. Fungi were the dominant forms with
actinomycetes and bacteria in much lower numbers in 2006 in all zones and
treatments. However, for 2007 the bacteria became the dominant form with fungi
being the next prominent and a severe drop off in actinomycete populations was
observed. Figure 3.5 compares microorganism’s differences between amended and
unamended plots. Fungi are known for living in more acidic environments in
comparison to bacteria. Change in microorganism forms implies important
improvement in soil quality to create a more hospitable environment for the bacteria.
42
Figure 3.5: Photo of plates from directly outside of a plot in left column and inside a plot in right column. Left column majority of growth is fungi and in right column majority is bacterial growth. Shows a change in population diversity, bacteria typically live in more fertile soils whereas fungi live in less fertile soils.
3.3.2 Soil Microbial Biomass Carbon Flush
Soil microbial biomass (SMBC) is a labile C form and is an important part of
soil organic matter because it regulates transformation and storage of nutrients
(Horwath and Paul, 1994). Microbial biomass flush in µg C/g soil was determined by
the chloroform fumigation extraction method. Microbial biomass C was calculated
by subtracting the C in extracts of unfumigated soils from the C in extracts of
fumigated samples, and was not corrected for extraction efficiency, so that values
represent C “flush” rather than total SMBC (Fierer and Schimel, 2002). Since this
method was developed for soils rich in organic matter and microbial biomass, it may
Red Low 10 -4
Orange High 10 -3
Orange Low 10 -3
Orange Low 10 -5
Gray Low 10 -4
Gray High 10 -4
43
not be optimal for determining microbial biomass in the soils in this study, which
have high acidity and iron content. Therefore, these results should be interpreted with
caution. Differences in weather between 2006 and 2007 may have caused differences
from year to year. The average precipitation for 2006 was 37 inches and 41 inches for
2007. Also, a 52 year average of annual precipitation for this area is 41 inches.
Significant differences were found within each year (P = 0.006 for 2006 and <0.0001
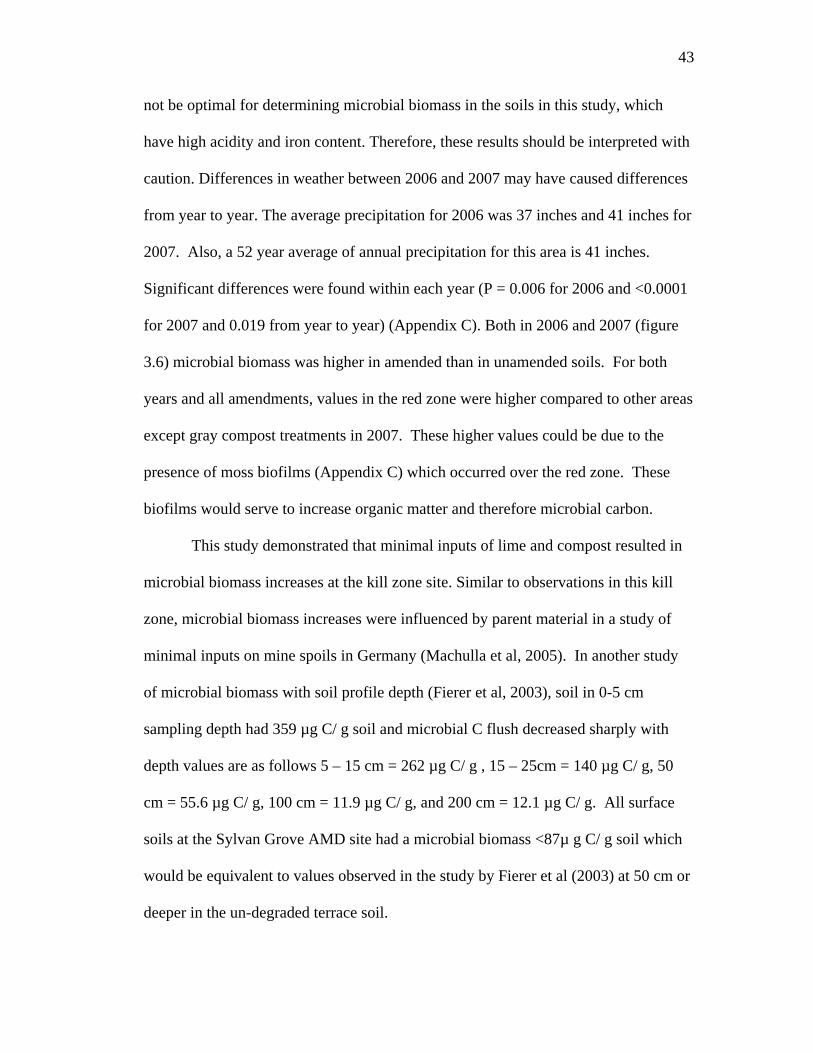
for 2007 and 0.019 from year to year) (Appendix C). Both in 2006 and 2007 (figure
3.6) microbial biomass was higher in amended than in unamended soils. For both
years and all amendments, values in the red zone were higher compared to other areas
except gray compost treatments in 2007. These higher values could be due to the
presence of moss biofilms (Appendix C) which occurred over the red zone. These
biofilms would serve to increase organic matter and therefore microbial carbon.
This study demonstrated that minimal inputs of lime and compost resulted in
microbial biomass increases at the kill zone site. Similar to observations in this kill
zone, microbial biomass increases were influenced by parent material in a study of
minimal inputs on mine spoils in Germany (Machulla et al, 2005). In another study
of microbial biomass with soil profile depth (Fierer et al, 2003), soil in 0-5 cm
sampling depth had 359 µg C/ g soil and microbial C flush decreased sharply with
depth values are as follows 5 – 15 cm = 262 µg C/ g , 15 – 25cm = 140 µg C/ g, 50
cm = 55.6 µg C/ g, 100 cm = 11.9 µg C/ g, and 200 cm = 12.1 µg C/ g. All surface
soils at the Sylvan Grove AMD site had a microbial biomass <87µ g C/ g soil which
would be equivalent to values observed in the study by Fierer et al (2003) at 50 cm or
deeper in the un-degraded terrace soil.
44
Microbial Biomass (Fum C - UnFum C)
0
10
20
30
40
50
60
70
80
90
R. Lime R. Low R. High O. Lime O. Low O. High G. Lime G. Low G. High
Figure 3.6: Average microbial biomass by carbon flush by zone and treatment given in µg C/g soil. There was a large increase from 2006 to 2007 in amended plots in orange and gray zones. However, a small increase in red amended zones for 2007. Also, a small increase occurred in unamended plots from 2006 to 2007.
Even the highest microbial biomass of 87 µg C/g soil listed above is
extremely low compared to those observed by Fierer and Schimel (2002). They found
C flushes on average of 550 µg C/g soil in surface oak forested soil and 350 µg C/g
soil in surface grass soil. The increase seen from 2006 to 2007 in amended soils
indicates that continual inputs by plant roots stimulated increases in microbial
biomass. The largest increase found in the gray zone in 2007 could be due a more
neutral soil pH compared to other zones. According to Mummey et al, (2002) soil
microbial biomass carbon flush reclaimed soils will have approximately half the
values of undisturbed soils.
45
3.3.3 Respired CO2
Organic matter mineralization by means of soil respiration was measured with
a Li – Cor (model Li – 6262) infrared gas analyzer. Measuring the CO2 respired from
the soil quantifies biological oxidation and activity of microbes and roots. In 2006
there was a significant change in respiration following the addition of lime and or
compost except for red zone with lime only. Mineralized carbon respiration
increased three times in compost amended vs. unamended plots in 2006. In 2007,
there was a small decrease in mineralization for unamended plots, however;
mineralization in compost-amended plots increased 6 fold (Figure 3.7, and Appendix
C). Significant differences between treatments within year (P = <0.05) were observed
in both 2006 and 2007. The largest impact on mineralized carbon was in amended
gray zone plots in 2007 (Figure 3.7.) This increase in microbial activity appeared to
be due to lower limitations on microbial activity (e.g. acidity and low nutrient
availability) compared to other plots. There was no significant change in
mineralization in unamended soils from 2006 to 2007. The large increase in
mineralization in amended soils from 2006 to 2007 could be due to vegetative residue
and roots decomposing to create higher respiration rates. Decomposing residue and
roots were found to increase respiration rates in agricultural soils (Bell, 2008). Fierer
and Schimel (2002) found that 24-hr soil respiration rates from control soils at 35%
water holding capacity were 1.6 µg C – CO2 / g soil hour-1 in forested oak soil and a
little less than one µg C CO2/g soil hour -1 in grass soil. However, their values cannot
46
be directly compared to results in this study because incubation conditions can greatly
affect results.
Respired C-CO2
0.0
0.5
1.0
1.5
2.0
2.5
3.0
R. Lime R. Low R. High O. Lime O. Low O. High G. Lime G. Low G. High
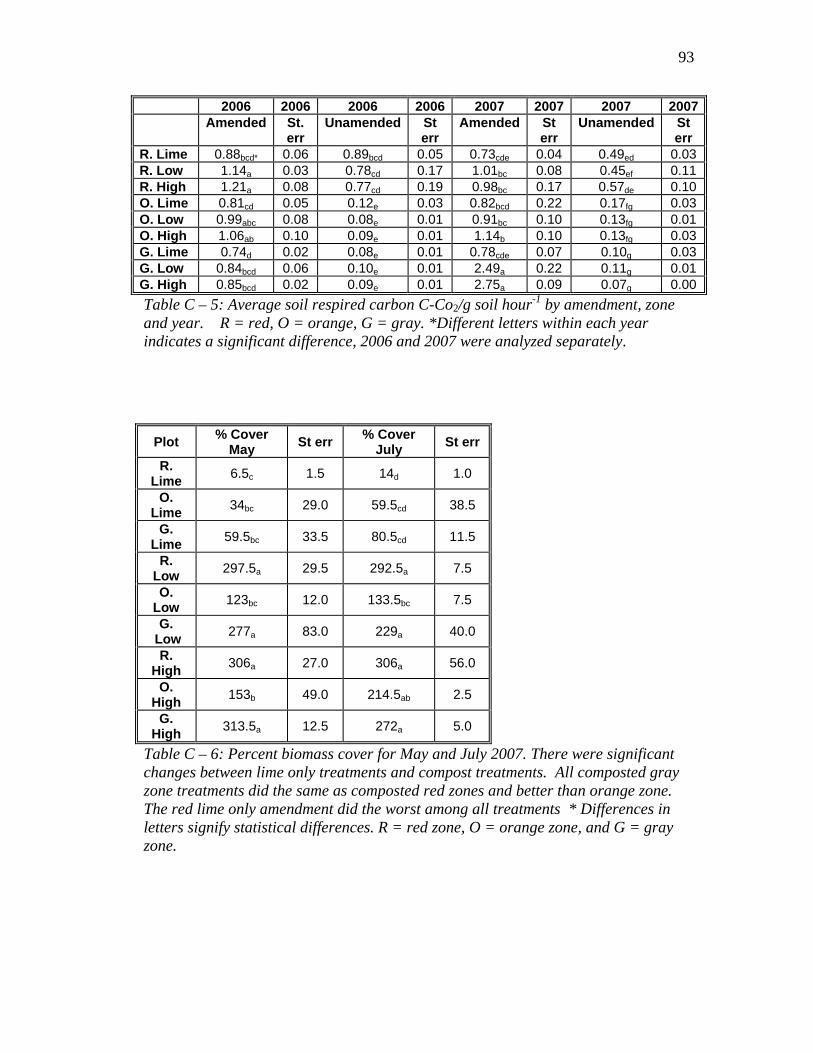
Figure 3.7: Respired carbon C-CO2, by zone and treatments. R = red zone, O = orange zone, G = gray zone. Amended plots produced more C than unamended treatments. Also, compost amended plots responded better than lime only amendment.
3.4 Vegetative characteristics
3.4.1 Germination Rate
No significant differences were observed in germination between treatments
(P = 0.81) (Table 3.3). This indicated that all plots received similar plant inputs and
that later effects were due to soil properties not vegetative establishment.
Lime Low High
Red 79 74 100
Orange 90 95 93
Gray 94 87 79
Table 3.3: Average number of germinated seedlings in a 100 cm2 area. There were no significant differences between treatments or zones.
47
By applying minimal amounts of compost instead of up to 135 dry metric tons
of biosolids (commonly applied by DEP Bureau of Abandoned Mine Reclamation),
the resulting lower soil nutrient status could help reduce rapid colonization by early
successional species that favor high-nutrient environments. Introduction of fewer
nutrients during plant establishment may increase colonization by other herbaceous
and woody species and result in greater species richness (Halofsky and McCormick,
2005).
3.4.2 Vegetation Height
The growth of vegetation in 2006 was determined mid growing season by
measuring the height of vegetation. Nine measurements were taken per plot and
averaged. Table 3.4 shows an increase in vegetative growth between treatments with
the lowest increase in lime-only plots, followed by plots with the low rate of compost.
The most plant growth was observed in the high-rate compost treatment. With the
addition of higher rates of compost, the vegetation growth responded more vigorously
(P = 0.001).
Lime Std err Low Std
err High Std err
Red 19.8d* 0.8 33.2c 0.9 43.6a 1.4 Orange 22.6d 0.5 31.1c 1.1 37.3b 1.6 Gray 21.4d 0.6 37.1b 1.2 41.5a 1.7 Table 3.4: Average vegetative height (cm) by treatment mid growing season 2006. High compost rates performed better than low rate followed by lime only treatment. * Differences in letters imply significant differences.
48
3.4.3 Percent Plant Cover by Ten Pin Method
In 2007, percent cover by the ten pin method was used to compare plant
establishment between treatments. With a pin method measurements are highly
repeatable and lead to more precise measurement than cover estimates using quadrant
(Bureau of Land Management, 1999). Also, it is possible to have > 100% cover
because results are taken in three dimensions. There was a statistical difference
between treatments with a P value of 0.002. Lime-only treatments had a sparser plant
cover compared to compost treatments (Figure 3.8). Composted red and gray zones
produced more cover than the orange zone (Figure 3.8 and Appendix C). This
difference is believed to be caused by the red zone having higher soil moisture
content all year, and the gray zone having less acidity than the orange zone.
Percent Cover
0
50
100
150
200
250
300
350
400
R. Lime O. Lime G. Lime R. Low O. Low G. Low R. High O. High G. High
Zone and Treatment
% C
over
MayJuly
Figure 3.8: Percent vegetative cover by 10 pin method of each zone R, O, and G along with lime only treatment, low rate compost, and high rate compost. Lime only treatments did not respond as well as low and high compost treatments. Both low- and high-compost treatments of soils in the orange zone performed worst compared to compost-treated soils in the red and grey zones.
49
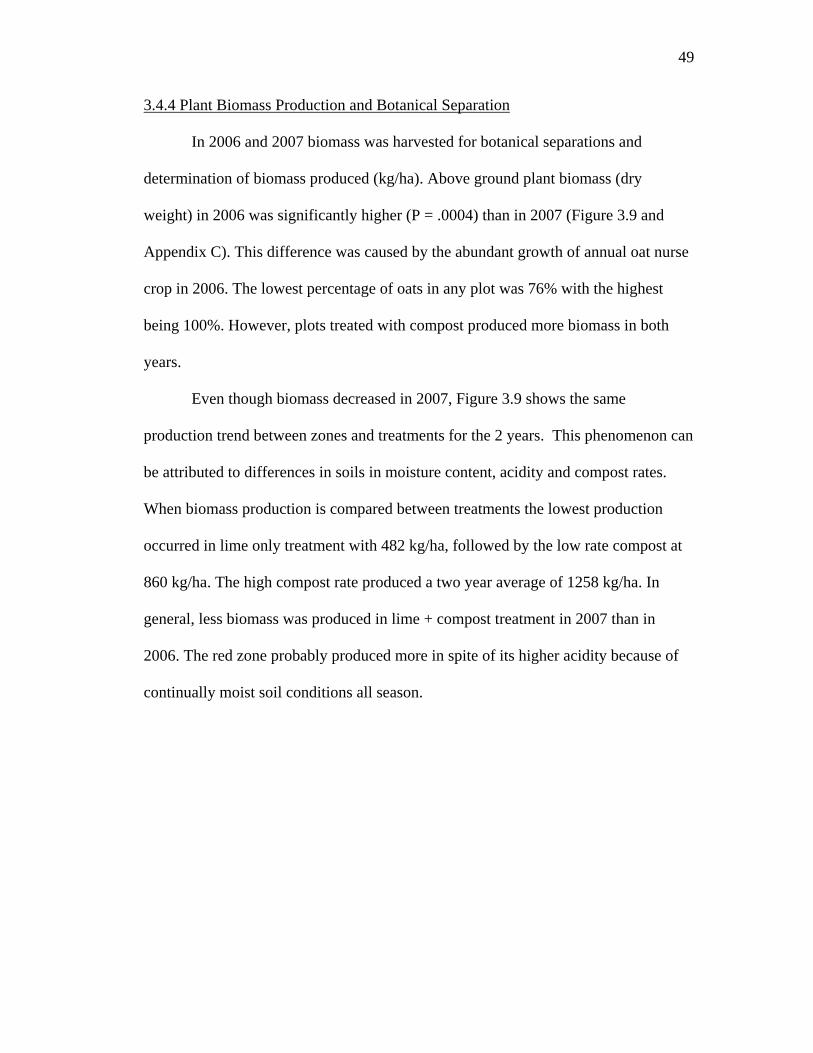
3.4.4 Plant Biomass Production and Botanical Separation
In 2006 and 2007 biomass was harvested for botanical separations and
determination of biomass produced (kg/ha). Above ground plant biomass (dry
weight) in 2006 was significantly higher (P = .0004) than in 2007 (Figure 3.9 and
Appendix C). This difference was caused by the abundant growth of annual oat nurse
crop in 2006. The lowest percentage of oats in any plot was 76% with the highest
being 100%. However, plots treated with compost produced more biomass in both
years.
Even though biomass decreased in 2007, Figure 3.9 shows the same
production trend between zones and treatments for the 2 years. This phenomenon can
be attributed to differences in soils in moisture content, acidity and compost rates.
When biomass production is compared between treatments the lowest production
occurred in lime only treatment with 482 kg/ha, followed by the low rate compost at
860 kg/ha. The high compost rate produced a two year average of 1258 kg/ha. In
general, less biomass was produced in lime + compost treatment in 2007 than in
2006. The red zone probably produced more in spite of its higher acidity because of
continually moist soil conditions all season.
50
Dry Plant Biomass
0
500
1000
1500
2000
2500
3000
3500
4000
R. Lime R. Low R. High O. Lime O. Low O. High G. Lime G. Low G. High
Zone and Treatment
Dry
Biom
ass
(kg/
ha)
2006 2007
Figure 3.9: Dry biomass produced (kg/ha) per zone and amendment for 2006 and 2007. A decrease in 2007 biomass occurred from a specie transition of oat nurse crop to seeded long term vegetation. It is believed that larger red zone biomass is attributable to high soil moisture during entire growing season.
Also from the plants harvested, botanical separation was completed to
determine species diversity. Even though total biomass produced in 2007 was lower
than in 2006, species diversity increased greatly (Figure 3.10). The oats population
accounted for the majority of growth in 2006, while orchard grass accounted for the
most in 2007. Indigenous species also increased within one year. Overall, there was a
more even distribution of species in 2007 to create more species richness. Deak et al,
(2007) also found changes in botanical composition under varying growing
conditions with simple and complex seed mixtures, with orchard grass and fescue
predominating in the Northeast.
51
2006 Plant Species Diversity in All Plots
1%1%
1%
4%
93%
Oats Fescue Orchard Rye Indigenous
2007 Plant Species Diversity in All Plots
9%
9%6%6%3%
14%
53%
Trefoil Fescue Orchard Rye Clover Red top Indigenous
Figure 3.10: 2006 and 2007 comparison of species diversity.
52
In their study of biosolids amendment of minelands in Clearfield County,
Halofsy and McCormick (2005) used a seed mixture that was similar to the one used
in the Sylvan Grove kill zone and sown at rates of 56.5 and 28.25 kg/ha. With
biosolids, this seed mixture resulted in percent coverage ranging from 60 – 100%.
However, the high-nutrient conditions provided by the biosolids resulted in a
vegetation cover that appeared to inhibit the establishment of native plant species,
because of dense grass competition. In contrast, the use of lower levels of nutrient
amendments in the Sylvan Grove kill zone appeared to facilitate establishment of
volunteer successional vegetation, leading to higher plant diversity after two years.
53
References
Amann, R.L., W. Ludwig, and K.H. Schleifer. 1995. Phylogenetic Identification and In Situ Detection of Individual Microbial Cells without Cultivation. Microbiological Reviews 59:143 – 169.
Arshad, M.A. and S. Martin. 2002. Identifying Critical Limits for Soil Quality
Indicators in Agro – Ecosystems. Agriculture, Ecosystems, and Environment, 88, 153-160.
Bell. M.C. and C.W. Raczkowski. Soil Property Indices for Assessing Short-term Changes in Soil Quality. Renewable Agriculture and Food Systems. 23 (1) 70-79. 2008.
Deak, A. M.H. Hall. M.A. Sanderson. D.D. Archibald. Production and Nutritive
Value of Grazed Simple and Complex Forage Mixtures. Agronomy Journal. 99, 814 – 821.
Fierer, N. J.P. Schimel. P.A. Holden. 2003. Variations in Microbial Community
Composition through Two Soil Depth Profiles. Soil Biology & Biochemistry. 35, 167 – 176.
Fierer, N. and J.P. Shimel. 2002. Effects of Drying – Rewetting Frequency on Soil
Extension Service. U.S. Department of Agriculture, NRCS Grazing Land Technology Institute. U.S. Bureau of Land Management, 1999.
55
Chapter 4
Controlled Greenhouse Experiment
A replicated greenhouse experiment was conducted to determine if results
with leached soil columns would be similar to results observed in the field study. The
main difference between the greenhouse experiment and the field study was that soil
columns were leached twice to characterize soil water chemistry available to plants.
Leaching also led to more consistent moisture conditions across all soil columns.
Some of the same determinations were performed: germination rate of vegetation,
biomass production and botanical separation (for methods see chapter 2). Other
properties observed were: soil carbon, root biomass production, and pH and EC of
leachate (for methods see chapter 2). Another variation included an addition of two
replicates of a control reference soil with a typical Hagerstown series (fine mixed
semiactive mesic typic hapludalf) soil that was unaffected by AMD. This was to show
the potential of vegetative growth in “healthy” soil. Hagerstown soil is considered a
top producing agricultural soil of Pennsylvania. Intact soil columns, which had been
removed from the field, were placed in Buchner funnels in the greenhouse to facilitate
leaching operations.
56
4.1. Soil Results
4.1.1 Total Soil Carbon
Total soil carbon was determined with a Fisons NA 1500 Elemental Analyzer.
Total Carbon before amendments was on average approximately 1% (Table 4.1).
Zone % Soil Carbon
Std err
% O.M Equivalent
Orange 1.147 0.097 1.973 Red 0.782 0.072 1.345 Gray 1.098 0.074 1.889 Average 1.009 0.059 1.735 Table 4.1: Total % soil carbon (dry weight) average by zone before amendments with standard errors and calculated equivalent percent soil organic matter (justification by a 1.72 factor conversion).
These results show that total carbon was only slightly below average
compared to typical cultivated soils. In a study of cultivated soils in France, average
soil organic carbon was 1.29% (Virto et al, 2008). In a Maryland study, several
cultivated systems had the following percentages of soil organic carbon (depth 0-7.5
cm): no- till soils, 1.55%; cover cropped soils, 1.73%; soils planted with crown
vetch, 1.44%; and organically farmed soils, 1.92% (Teasdale et al, 2007). Since the
Sylvan Grove kill zone soils had been barren of any plants for decades, their organic
carbon contents may be due to the protection of organic matter by iron oxides, as well
as by the lack of mineralization by microbes.
57
4.2 Vegetative Results
4.2.1 Germination Rate
Germination rate was determined by counting all plant shoots per column. The
highest germination count was 48 and the lowest was 24 (table 4.2). However, the
differences in germination rate were not significant (P =0.32).
Red Std err Orange Std err Gray Stderr Hagerstown Std errControl - - - - - - 26.0 2.0 Lime 29.5 3.5 36.0 0.0 32 6.0 - - Low Rate 38.0 10.0 27.5 3.5 30.5 4.5 - - High Rate 43.5 0.5 35.5 0.5 34.5 4.5 - - Table 4.2: Germination counts by zone and treatment along with Hagerstown Control for 182 cm2 area. No significant differences were found amount treatments.
4.2.2 Biomass Production and Botanical Separation
Using the same methods as in the field study, biomass production and
botanical diversity were measured on the soil columns.. The Hagerstown control soil
produced 3 times more biomass (l0,918 kg/ha) than the most productive AMD soils
(gray high compost treatment) with 3,962 kg/ha. Of the kill zone soils, those
receiving the high-compost treatments produced the most biomass, followed by the
low compost soils. The least biomass was produced in lime-only amended soils
(table 4.3). Table 4.4 shows that regardless of amendment the gray zone produced
the most biomass, followed by orange zone soils. Red zone soils produced the least
biomass, which contrasted with the results from the field study, where red zone soils
produced more biomass than orange zone soils, This observation supported the
explanation that the higher water table in the red zone resulted in higher soil moisture
content in the field, which appeared to give an edge over the less acidic, drier soil
Table 4.3: Average dry biomass produced (kg/ha) per zone and amendment in greenhouse study first harvest * Varying letters indicate significant differences.
Zone kg/ha Red 1919 Orange 2091 Gray 2712 Hagerstown 10918
Table 4.4 Average biomass produced per zone at the first harvest in the greenhouse study.
Botanical separations of plants grown in the greenhouse study showed that
diversity changed slightly between the two harvests that were spaced 10 months
apart. The majority of unidentifiable species in the first harvest were most likely a
mixture of oat and orchard grass. The grasses were harvested late and had already
dried on this stalk, making it difficult to differentiate species. The proportion of
fescue population in the total first harvest had increased by the second harvest. The
oat population decreased and trefoil increased in the second harvest (Figure 4.1).
Greenhouse results were similar to field results in that oats dominated the plant
communities in the first season. Greenhouse results were dissimilar due to the growth
of more fescue at the second harvest in the greenhouse.
59
First Greenhouse Harvest Biomass Diversity
45%
2%3%13%
37%
Oat Fescue Orchard Rye Unidentifiable
Second Greenhouse Harvest Biomass Diversity
9%
3%
41%
47%
Oats Trefoil Fescue Orchard Figure 4.1: First and second greenhouse harvest biomass diversity. Species composition changed in only a ten month period. Orchard grass dominated, Fescue started to flourish by the second harvest, and Trefoil biomass also increased.
60
4.3 Root Biomass
To fully assess vegetative growth and response, dry biomass of roots was
determined. Root washing was done to extract roots, which were dried at 75º C for
48 hours and weighed. Surprisingly, the untreated Hagerstown control soil produced
fewer roots than all of the AMD-affected soils, even though it produced the most
above ground biomass. A reason for this could be a natural survival tactic of plants
within inhospitable environments to put more energy in their rooting systems for
pursuit of nutrients. Among the AMD-impacted soils, high-rate compost treatments
produced the most biomass, followed by low-rate compost treatment. The lime-only
treatment resulted in the least biomass. It appeared that when soil conditions were
inhospitable, root growth depended on concentrations of easily accessible nutrients
from the compost (Appendix C). Plant roots uptake nutrients by three different
methods. First, there is root interception, this occurs when the nutrients directly
around the root is depleted the roots grow into un-depleted soil. Secondly, mass flow
contributes to nutrient uptake, dissolved nutrients flow with the soil water being
drawn by the root. Diffusion is the last way roots receive nutrients, nutrient ions move
from areas of high concentration to areas of lower depleted concentration around the
root surface (Brady and Weil, 1996). Figure 4.2 and 4.3 show root biomass by
treatment and also by zone.
61
Dry Root Biomass g/column
0
10
20
30
40
50
Control Lime Low High
Figure 4.2: Average dry root biomass produced by amendment with standard error. More compost to AMD soil produced more root biomass. The Hagerstown control produced the least amount of biomass
Dry Root Biomass g/column
0
10
20
30
40
50
Control Red Orange Gray
Figure 4.3: Average root biomass produced by zone with standard error. More roots seemed to be produced in areas of less soil acidity, besides Hagerstown control.
62
4.4 pH of Leachate
The pH of leachate was measured to evaluate the chemistry of soil solutions in
the columns supporting the vegetative root systems (Table 4.5).
Red St err Orange St err Gray St err Hagerstown St err Control - - - - - - 6.48 0.04 Lime 2.34 0.09 2.67 0.02 3.15 0.22 - - Low Compost 2.47 0.10 2.65 0.05 2.78 0.03 - -
High Compost 2.38 0.05 2.93 0.08 2.85 0.06 - -
Table 4.5: pH of leachate of columns by zone and treatment with standard errors.
All amended soils from the red zone exhibited lower pH values because of
their higher reserve acidity and lower soil pH. Soils from the gray zone had higher
pH leachate values because of less reserve acidity. However, the Hagerstown control
soil had an average leachate pH value of 6.48. Therefore, the initial pH of the soil
affects soil solution pH available to roots.
4.5 Electrical Conductivity of Leachate
Electrical conductivity was measured to determine the overall quantity of ions
present in soil solution (Table 4.6).
Red St err Orange St err Gray St err Hagerstown St err Control - - - - - - 0.126 0.02 Lime 3.020 0.23 1.823 0.42 1.195 0.30 - - Low Compost 2.960 0.36 2.460 0.13 1.684 0.19 - -
High Compost 2.853 0.13 2.060 0.24 1.702 0.16 - -
Table 4.6: Electrical conductivity (dS/m) of zones and treatments with standard errors. Soils with a lower pH produces and leachate with higher EC values.
63
All amended soils from the red zone had higher EC values than soils from the
other two zones, with the lowest EC observed in gray zone soils. This descending
order of EC values was opposite to that observed with pH, in which lower soil pH
values resulted in higher EC values (Figure 4.4). A negative correlation (R2 = 0.66)
was observed between EC and pH. Soil water has a strong effect on the values of soil
EC, and soil EC relates to soil properties such as texture and organic matter, all which
could have a major impact on crop yield (From the Ground Up Agronomy News,
2002). Therefore, water EC values can be used to evaluate soil properties to an
extent.
EC vs pHy = -2085.7x + 7804.8
R2 = 0.6565
0
500
1000
1500
2000
2500
3000
3500
4000
0 0.5 1 1.5 2 2.5 3 3.5 4
pH
EC
Figure 4.4: Relationship between EC (µS/cm) and pH. As pH decreases EC increases.
64
4.6 Elements Present in Leachate
Leachate was analyzed with an ICP (ion coupled plasma chromatograph) for
analytes (Table 4.7). Some differences in leachates were observed among treatments
and soil types. The Hagerstown control soil had substantially lower metal
concentrations in its leachate. Sodium and potassium concentrations in leachates
increased as compost rates increased, due to the 7.89 dS/m of sodium and 1.38% dry
weight basis of K in the original compost amendment (Table 2.2). Analytes from high
to low concentrations was as follows Ca, Mg, Na, K, Al, and Fe. The high
concentrations of Al, Fe, and Mg would be due to the higher solubility of these ions at
low pH. Such high concentrations result from the inherent properties of the acid soils
which are rich in iron oxides. Table 4.8 shows results of the stream water running
though the kill zone, which also has high values except for sodium which was not
detectable. This observation supported the explanation that compost was the source of
sodium in column leachates.
Al Ca Fe K Mg Na
Hagerstown control 0.22 13.9 0.2 5.7 3.82 9.5
Lime 22.22 116.50 3.61 22.05 50.85 20.4
Low 35.80 183.31 1.85 42.98 62.84 54.8
High 33.23 130.17 1.59 46.61 49.26 77.0
Table 4.7: Table of average leachate results in µg/L for two leaching events spaced one month apart listed by treatment along with Hagerstown soil controls.
Table 4.8: Table of averaged total element stream metals in µg/L.
Al Ca Fe K Mg Mn Ni Pb S Zn 44.76 49.23 114.0 1.65 29.99 4.12 0.16 0.02 277.79 0.37
65
4.7. Conclusion
The abundance of water in the red zone seemed to favor the increase of plant
biomass. In the field study, soils in the red zone produced the most plant biomass,
followed by the gray zone and then the orange zone. However, in the greenhouse
study, all soils received equal quantities of water and the soil columns were allowed
to drain. Because red zone soils produced less biomass in the greenhouse than in the
field, high water availability in the red zone soils appeared to have lessened plant
stresses in the field. Soils from the gray zone produced more plant biomass in both
the field and greenhouse studies, although gray zone soils still produced 4 times less
biomass than the Hagerstown soils. Root biomass measurements showed that more
roots grew in AMD-affected soils than in the control Hagerstown soil. The leachate
measurements indicated that roots in AMD-affected soils were subjected to high
metal concentrations, especially high aluminum. Since iron contents in leachates
were 100 times lower than in stream water, this may have indicated that iron was
strongly fixed in the soils and unavailable for leaching. Overall, the greenhouse study
indicated that compost additions helped plants grow and survive in soils with poor-
quality soil water chemistry.
66
References
Brady, N.C. and R.R. Weil. The Nature and Properties of Soils. Eleventh Ed. Prentice Hall Inc. 1996.
Soil Electrical Conductivity Mapping of Agricultural Fields. From the Ground Up
Agronomy News. Colorado State Soil and Crop Extension. 2002. http://www.extsoilcrop.colostate.edu/Newsletters/2002/Sensors/SoilEC.htm. verified November 17, 2008.
Teasdale, J.R. C.B. Coffman, and R.W. Mangum. 2007. Potential Long – Term
Benefits of No – Tillage and Organic Cropping Systems for Grain Production and Soil Improvement. Agronomy Journal. 99, 1297 – 1305.
Virto, I. P. Barre`, C. Chenu. 2008. Microaggregation and Organic Matter Storage at
the Silt – Size Scale. Geoderma. 146, 326 – 335.
67
Chapter 5
Summary and Conclusions
5.1 Summary
The objective of this study was to test the efficacy of low rate additions of
lime and compost for revegetating an acid mine drainage kill zone in comparison to
other revegetation techniques. Two application rates of compost were used in this
study: 27 and 54 Mg per hectare fresh weight basis. These rates were approximately
equivalent to 4,560 and 9,130 kg C and 426 and 853 kg N total per hectare,
respectively. Use of minimal inputs is more cost-effective and would permit
allocation of resources to other degraded sites. The main findings from meeting the
four objectives in this study are summarized below.
5.2 Objective Summary
5.2.1 Objective 1: Establish and Measure Growth of Vegetation in Field Plots
Three zones were identified at the field site based on moisture and depth of
iron oxide deposits: red; orange; and gray (Figure 2.5). Three treatments were
applied: lime only; lime plus 27 Mg compost/ha, and lime plus 54 Mg compost /ha.
All treatment plots received surface straw mulch. Seed germination rates were similar
across all treatments and zones. During the first year, oats from the straw mulch layer
germinated and grew in all treatment plots. During the second year plants from the
“wildlife” seed mixture replaced the oats as dominant vegetation. Plots with lime and
either compost rate produced more plant biomass and better cover than the lime-only
68
treatment. According to a Penn State 2007 forage trials report (Penn State Extension,
2007), aboveground biomass of orchard grass and fescue can average 7,000 kg/ha.
The greatest quantity of mixed species plant biomass on a dry weight basis was 2,740
kg/ha (Figure 3.9), or about 39% of potential grass production under optimal growth
conditions. Compared to the 2006 plant communities dominated by oats, plant
diversity increased in 2007, even though plant biomass was lower than in 2006. In
2007 more native successional plants were observed. In 2008, it was observed that
many treated plots contained birch seedlings averaging 4 cm tall.
5.2.2 Objective 2: Measure Soil Quality Indicators in Field Plots
Two years after plot establishment, soil quality indicators in all treated plots
had improved from the original 2006 conditions. The average percent organic matter
content of field site surface soils in all plots increased from 5.0% as unamended to
5.7% two growing seasons later as amended by loss on ignition method. The average
pH increased from 3.1 in unamended soils to 5.3 in amended soils. In the compost-
treated plots, the concentrations of phosphorus, potassium, magnesium, and calcium
increased dramatically almost to within optimum nutrient ranges. Reserve acidity
dropped by half after soils were amended by all three treatments. Base cation percent
concentration increased: potassium doubled, magnesium increased 5 times, and
calcium increased 6 times. Changes in metal concentrations varied: zinc decreased
slightly, copper increased slightly, and sulfur increased 200 ppm. Although these
soils would not be considered prime soil for vegetation, their quality indicators had
improved enough to support observed vegetation. Plots receiving high rates of
69
compost improved more than with low rates of compost, but not dramatically. Low
rates of compost appeared to be sufficient for plant establishment.
5.2.3 Objective 3: Measure Changes in Soil Biological Properties in Field Plots
Biological properties are more responsive indicators of soil quality than
chemical and physical properties because they change more quickly following
disturbance or alteration of soil management. One biological property measured was
recovery and enumeration of viable bacteria expressed as log colony-forming units
(CFU) per gram dry soil. Between 2006 and 2007 the mean CFU g-1 in all unamended
soils decreased from 5.61 to 4.42 log. Mean CFU g-1 in all amended soils showed
little or no change from 2006 (7.60) and 2007 (7.51).
Another biological indicator that was measured included soil microbial
biomass carbon measured as the carbon “flush”, or difference in the carbon
concentrations between extracts of fumigated and unfumigated samples. One
unexpected result was that in 2006 half of the unamended soils had greater C flush
values than amended soils. High microbial C flush values could have been due to the
mossy biofilms (appendix C) found on the surfaces of the unamended red zone. All
but one amended plot showed an increase in microbial biomass from 2006 to 2007.
The final biological indicator evaluated was respired soil carbon measured as
µg CO2-C per g soil per hour. Of the three zones, two zones (orange and gray)
showed an overall increase in amended plots from 2006 to 2007. The largest increase
was 1.9 µg CO2-C/ g soil hour-1 in the high-rate compost treatment in the gray zone.
The amended soils in the red zone however showed a decrease in respired CO2-C by
70
as much as 0.23 µg CO2-C / g soil hour-1. This decrease could have been due to the
higher acidity values in the red zone or to waterlogged conditions, which would lead
to slower mineralization. For unamended soils in the red zone in 2007, respired CO2
also decreased. This would support the explanation that respiration in the red zone
soils was lower in 2007 due to higher moisture content.
5.2.4 Objective 4: Compare Leached Soil Columns in Greenhouse with Field Soils
The replicated greenhouse study showed the same vegetative response as the
field with one exception. In contrast to the field study, soils from the red zone did not
produce the most biomass in the greenhouse. Since soil columns were consistently
watered and drained during the greenhouse experiment, the lower plant biomass from
red zone soil columns supports the explanation that red zone soils in the field had
higher moisture content than soils in the other two zones. Soils with lime + compost
also produced more biomass, compared to soils with lime only. In the greenhouse
study, an un-degraded Hagerstown soil, used as a control, received only the seed
mixture (no lime or compost amendment). Even without amendments, the “healthy”
control soil produced more aboveground plant biomass. Another measured
vegetative response for the greenhouse study was belowground biomass of roots,
measured in total grams of dry weight per column. Unexpectedly, the Hagerstown
soil produced less root biomass than all of the AMD soils. In the AMD soils the most
roots were produced in soils receiving the higher compost additions, which would
also have resulted in less acidity than the other AMD soils.
71
The leaching results indicated the chemical constituents in the soil pore water
that would be available for root uptake. In general, the pH of leachates from AMD
soils were under 3.0, whereas the Hagerstown soils were 6.48. This acidity had a
great impact on roots and biomass production. Also, when leachate pH was lower,
the EC values of pore water were greater. (Al) aluminum, (Ca) calcium, (Fe) iron,
(K) potassium, (Mg) magnesium, and (Na) sodium were measured. The control soil
had the lowest cation leaching values. AMD soil leachates contained ten times or
greater cation concentrations compared to Hagerstown soil. K and Na concentrations
increased in pore water as compost amendment increased.
5.3 Conclusion
This study shows that large amounts of manure or biosolids are not needed for
vegetation to become established in AMD kill zone soils. Revegetation using minimal
quantities (27 and 54 Mg/ha compost, in comparison to 134 Mg/ha dry weight
biosolids) of amendments is therefore feasible on degraded lands (abandoned strip
mine lands) that are not subject to Pennsylvania post-mining regulations requires
specified levels of plant coverage. For example, mining companies cannot recover
their bonds from the Commonwealth of PA unless abandoned lands have 70% plant
coverage in five years. Also, no more than 1% of total land area can have less than
30% ground cover, and no single area exceeding 3,000 ft2 can have less than 30%
ground cover (Sopper, 1994). Percent cover by the ten method as used in this research
can not relate to the quadrant visual method used by DEP to determine if proper plant
coverage is achieved for bond release. When low rates of organic amendment are
72
used, there will be more “black gold” to apply to the remaining mine lands. As of
2002, the estimated 184,431 acres of abandoned mine lands in Pennsylvania would
require 50 years to eliminate all high – priority abandoned mine land sites at current
funding rates (POWR, 2002). Lack of vegetation on abandoned mine lands during
this period would continue to pose hazards, high potential for erosion, eyesores, and
economic losses.
An important finding in this study was that a fast-growing annual nurse crop
appears to aid in the establishment of sown species. According to Halofsy and
McCormick, (2005) dense growth of perennial, non-native grasses may inhibit or
retard the natural establishment of successional species. Also, by planting species that
are more adapted to lower pH values, establishment of successional vegetation will be
facilitated. Low pH values of soils in the Sylvan Grove kill zone seemed to be the
major limiting factor, but with substantial moisture observed in the red zone, plants
and biological processes were observed to tolerate the acidity to a greater extent. If
reserve acidity is decreased and a small amount of nutrients are added, nurse crops
can lead to the establishment of native vegetation by natural successional processes
and lead to greater plant diversity.
5.4 Directions for Future Studies
Many other experiments would be possible at the Sylvan Grove kill zone site
in the future. For example, other vegetative species could be planted for energy
biomass. Additional research could be done on microbial properties, especially the
mossy surface biofilms that appear to act as protective soil mats. Because the best
73
plant response was observed in the gray zone soils, one recommendation that could
come out of this study would be to remove the surface layer of iron oxides prior to
planting. These iron oxides could possibly be re-used as a material for adsorbing
excess phosphorus in drainage ditches. Also, the iron oxides could be used as paint
pigments.
74
References
Penn State College of Agricultural Sciences, Agricultural Research and Cooperative Extension. 2007 Forage Trials Report. The Pennsylvania State University. 2007.
Halofsy, J.E. and L.H. McCormick. 2005. Establishment and Growth of Experimental Grass Species Mixtures on Coal Mine Sites Reclaimed with Municipal Biosolids. Environmental Management. Vol. 35, No. 5, pp. 569-578.
Pennsylvania Organization for Watersheds and Rivers. Abandoned Mine Reclamation
in Pennsylvania. 2002. Harrisburg, PA. Sopper, W.E. 1994. Manual for the Revegetation of Mine Lands in the Eastern United
States Using Municipal Biosolids. WVU National Research Center for Coal and Energy, Technical Communications Division.
75
Appendix A: Soil Descriptions
BRINKERTON SERIES
The Brinkerton series consists of very deep, poorly drained soils formed in medium textured colluvium derived from acid gray shale and siltstone. They are on footslopes of uplands. Slope ranges from 0 to 15 percent. Permeability is moderate in the surface layer, moderately slow in the upper subsoil, and slow in the fragipan and substratum. Mean annual precipitation is about 42 inches. Mean annual air temperature is about 52 degrees F.
TYPICAL PEDON: Brinkerton silt loam - pasture. (Colors are for moist soil unless otherwise noted.)
Ap--0 to 8 inches; dark grayish brown (2.5Y 4/2) silt loam; weak fine granular structure; friable; few fine irregular brown (10YR 5/3) concretions; neutral;abrupt smooth boundary. (6 to 12 inches thick)
Btg1--8 to 14 inches; grayish brown (2.5Y 5/2) silty clay loam; moderate medium subangular and angular blocky structure; firm, sticky, plastic; common distinct clay films on faces of peds; common fine and medium prominent strong brown (7.5YR 5/6) masses of iron accumulation in the matrix; very strongly acid; gradual wavy boundary.
Btg2--14 to 21 inches; grayish brown (2.5Y 5/2) silty clay loam; moderate fine and medium blocky structure; firm,sticky, plastic; common distinct clay films and silt coats on faces of peds; many medium faint gray (N 6/0) iron depletions in the matrix; very strongly acid; gradual wavy boundary. (Combined thickness of the Bt horizon is 5 to 18 inches.)
Btxg1--21 to 29 inches; grayish brown (2.5Y 5/2) silt loam; moderate very coarse prismatic structure parting to moderate medium platy and moderate fine blocky; firm, brittle,slightly sticky, plastic; gray (5Y 5/1) prism faces; few distinct clay films on faces of peds; few distinct irregular black (N 2/0) coatings; many fine and medium prominent strong brown (7.5YR 5/6) masses of iron accumulation in the matrix; very strongly acid; clear wavy boundary.
Btxg2--29 to 34 inches; grayish brown (2.5Y 5/2) silt loam; moderate very coarse prismatic structure parting to moderate thick platy and moderate medium blocky;firm, brittle,slightly sticky, plastic; gray (5Y 5/1) prism faces; few distinct clay films on
76
faces of peds; many fine black (N 2/0) concretions; many fine and medium prominent yellowish red (5YR 4/6) masses of iron accumulation in the matrix; 5percent rock fragments; moderately acid; clear wavy boundary. (Combined thickness of the Btxg horizon is 8 to 32 inches.)
Btx--34 to 42 inches; pale brown (10YR 6/3) silt loam; weak very coarse prismatic structure parting to weak thick platy and weak medium subangular blocky; firm, brittle, slightly sticky, plastic; gray (5Y 5/1) prism faces; very few faint clay films on faces of peds; many fine black (N 2/0) concretions; common medium faint gray (N 6/0) iron depletions in the matrix and many medium prominent strong brown (7.5YR 5/6) masses of iron accumulation in the matrix; 10 percent rock fragments; moderately acid; gradual wavy boundary. (0 to 15 inches thick)
C--42 to 65 inches; brown (10YR 5/3) channery silt loam; weak very coarse prismatic structure; firm, slightly sticky, slightly plastic; grayish brown (2.5Y 5/2) prism faces; common medium faint grayish brown (2.5Y 5/2) iron depletions in the matrix; 15 percent rock fragments; moderately acid.
TYPE LOCATION: Indiana County, Pennsylvania; East Mahoning Township, 1.0 mile west of Marion Center. Latitude 40 degrees, 40 minutes, 12 seconds N. Longititude 79 degrees, 06 minutes, 36 seconds W.
RANGE IN CHARACTERISTICS: Solum thickness ranges from 40 to 65 inches. Depth to bedrock is greater than 60 inches. Depth to the fragipan ranges from 11 to 30 inches. Rock fragments range from 0 to 10 percent by volume above the fragipan, from 0 to 30 in the fragipan, and from 10 to 80 percent in the C horizon. Reaction ranges from very strongly acid to moderately acid in the solum, unless limed, and from strongly through slightly acid in the C horizon.
The A horizon is neutral or has hue of 10YR or 2.5Y, value of 3 to 6,and chroma of 0 to 3. Texture of the fine-earth ranges from silt loam to silty clay loam.
The Bt horizon is neutral or has hue of 7.5YR through 5Y, value of 4 to 6, and chroma of 0 to 2. Texture of the fine-earth is silty clay loam or silt loam.
The Btx horizon is neutral or has hue of 7.5YR to 5Y, value of 4 to 6, and chroma of 0 to 3, and has redoximorphic features with shades of gray, brown and yellow. Texture of the fine-earth is silt loam, loam, clay loam, or silty clay loam.
The C horizon is neutral or has hue of 7.5YR to 2.5Y,value of 4 to 6, and chroma of 0 to 4, and has redoximorphic features with shades of gray and brown. Texture of the fine-earth is silt loam, silty clay loam, or loam.
COMPETING SERIES: There are no competing series in the same family.
77
The Calvert, Croton, Doylestown, Robertsville, Sheffield, and Thorndale series may be in the same family when they are classified to the 8th Edition of the Keys to Soil Taxonomy. Calvert and Croton soils have sola less than 40 inches thick. Doylestown soils have 60 to 80 percent silt in the textural control section. Robertsville soils do not have an argillic horizon above the fragipan. Sheffield soils have neutral reaction in the lower part of the fragipan. Thorndale soils either do not have rock fragments or they are dominated by schist.
The Andover, Armagh, Frenchtown, Mullins, Nolo, Purdy, Shelmadine, Tyler, and Watchung series are in related families. Andover,Armagh, Mullins, Nolo, Purdy, Shelmadine, and Tyler soils have less than 35 percent base saturation. Frenchtown soils average more than 15 percent fine sand and coarser in the textural control section. Watchung soils average more than 35 percent clay in the textural control section.
GEOGRAPHIC SETTING: Brinkerton soils are nearly level to sloping soils on concave footslopes and around heads of drainageways. Slopes range from 0 to 15 percent. The soils developed in medium textured colluvium from acid gray shale and siltstone. The climate is humid and temperate, with mean annual precipitation of 35 to 50 inches; mean annual air temperature ranges from 47 to 56 degrees F., and the growing season ranges from 120 to 180 days.
GEOGRAPHICALLY ASSOCIATED SOILS: Berks, Cavode, Dekalb, Gilpin, Hazleton, Rayne, Weikert, and Wharton soils are on nearby uplands. Berks, Dekalb, and Hazleton soils do not have argillic horizons. Cavode and Wharton soils do not have fragipans. Gilpin and Rayne are well drained and do not have fragipans. Weikert soils have a lithic contact within 20 inches and do not have an argillic horizon. The moderately well and somewhat poorly drained Comly, the moderately well drained Buchanan and the somewhat poorly drained Portville soils are in the same drainage sequence.
DRAINAGE AND PERMEABILITY: Poorly drained, with slow to rapid runoff. Permeability is moerate in the surface layer, moderately slow in the upper subsoil, and slow in the fragipan and substratum.
USE AND VEGETATION: Wooded areas of mixed hardwoods consist of northern red oak, sugar maple, and black cherry with some hemlock and white pine. Cleared areas are chiefly used for pasture.
DISTRIBUTION AND EXTENT: Pennsylvania, Maryland, New York, and West Virginia. MLRA 124, 125, 126, 127, 128, 130, 147, and 148. The series is of large extent.
MLRA OFFICE RESPONSIBLE: Morgantown, West Virginia
SERIES ESTABLISHED: Fayette County, Pennsylvania, 1939.
78
REMARKS: This soil now classifies with CEC activity class of semiactive. Competing series may change as similar soils are reclassified.
Diagnostic horizons and other features recognized in this pedon are: a. Ochric epipedon - the zone from the surface of the soil to a depth of about 8 inches (Ap horizon). b. Argillic horizon - the zone from 8 to 21 inches (Btg horizon). c. Fragipan - the zone from 21 to 42 inches (Btxg and Btx horizons).
ADDITIONAL DATA: Characterization sample S58PA32-3 was used as a basis for placing the Brinkerton series in the Fragiaqualfs great group.
National Cooperative Soil Survey U.S.A.
ERNEST SERIES
The Ernest series consists of very deep, moderately well drained soils with moderately slow to slow permeability. These soils formed in colluvium from shale, siltstone, and sandstone. They are on foot slopes and colluvial fans. Slopes ranges from 0 to 50 percent. Mean annual temperature is 51 degrees F and mean annual precipitation is 43 inches.
TYPICAL PEDON: Ernest silt loam - formerly cultivated. (Colors are for moist soil.)
Ap--0 to 7 inches, dark grayish brown (10YR 4/2) silt loam; moderate fine granular structure; friable; common roots; 5 percent rock fragments; very strongly acid; clear wavy boundary. (5 to 11 inches thick.)
BA--7 to 10 inches, strong brown (7.5YR 5/8) silt loam; moderate fine subangular blocky structure; friable; common roots; 5 percent siltstone fragments; very strongly acid; clear wavy boundary. (0 to 12 inches thick.)
Btl--10 to 18 inches, strong brown (7.5YR 5/6) silty clay loam; moderate medium subangular blocky structure; friable; few roots; common brown (10YR 4/3) coatings on faces of peds; few faint clay films on faces of peds; 10 percent siltstone fragments; very strongly acid; clear wavy boundary. (6 to 14 inches thick.)
79
Bt2--18 to 27 inches, yellowish brown (10YR 5/6) silty clay loam; moderate medium subangular blocky structure; friable; common distinct clay films on faces of peds; many fine strong brown (7.5YR 5/6) iron concentrations and light brownish gray (10YR 6/2) iron depletions; 10 percent siltstone fragments; very strongly acid; clear wavy boundary. (0 to 15 inches thick.)
Btx--27 to 47 inches, light yellowish brown (10 YR 6/4) channery silt loam; weak very coarse prismatic structure parting to weak medium and coarse subangular blocky; firm and brittle; common distinct clay films along face of prisms; common black concretions; many fine light brownish gray (10YR 6/2) iron depletions and strong brown (7.5YR 5/6) iron concentrations; 20 percent siltstone fragments; very strongly acid; clear wavy boundary. (10 to 40 inches thick.)
C--47 to 60 inches, light brownish gray (2.5Y 6/2) silt loam; massive; friable; many fine brown (7.5YR 4/4) iron concentrations; 10 percent siltstone fragments; very strongly acid.
TYPE LOCATION: Fayette County, West Virginia; about 25 yards east of Route 41/13, south of junction with West Virginia 41 and about 1 mile east of Layland.
RANGE IN CHARACTERISTICS: Solum thickness ranges from 36 to 72 inches. Depth to the top of the fragipan is 20 to 36 inches. Depth to bedrock is generally greater than 5 feet. Fragments of shale, siltstone, and fine grained sandstone range from 0 to 25 percent in individual subhorizons of the A; 0 to 30 percent in the BA horizon and in individual subhorizons of the Bt; 5 to 40 percent in the Bx horizon; and 5 to 50 percent in the C horizon. Reaction is very strongly acid to strongly acid in all horizons except the Ap, which may have moderately acid reaction.
The Ap horizon has hues of 10 YR or 7.5YR, with values of 4 or 5, and chromas of 2 through 4. The A horizon, where undisturbed, is 1 to 5 inches thick, has hues of 10YR or 7.5YR, values of 2 or 3, and chroma of 1 or 2. The E horizon, where present, is 2 to 6 inches thick, has hue of 10YR, with values of 4 or 5, and chromas of 2 through 4. Texture is silt loam in the fine-earth fraction.
The BA and Bt horizons have hues of 10YR or 7.5YR, with values of 4 through 6, and chromas of 3 through 8. High and low chroma redoximorphic features are within the upper 10 inches of the argillic horizon. Textures are silt loam with less than 20 percent sand or silty clay loam in the fine-earth fraction. The Bt horizon has weak or moderate, fine to coarse subangular blocky structure. In some pedons, the argillic horizon has prismatic structure that parts to subangular blocky structure.
The Btx horizon has hues of 7.5YR through 2.5Y, values of 4 through 6, and chromas of 2 through 8, and it has redoximorphic features. Texture is loam, silt loam, clay loam, or silty clay loam in the fine-earth fraction. The Btx horizon has weak, very coarse prismatic structure parting to subangular blocky or platy structure.
80
The C horizon has 10YR, 7.5YR, or 2.5Y hue, value of 4 through 7, and chroma of 2 through 6. Texture is loam, silt loam, clay loam, silty clay loam, or silty clay in the fine-earth fraction.
COMPETING SERIES: These are the Belvoir, Buchanan, Calverton, Cookport, Glenville, Kedron, and Raritan in the same family and the Clarksburg, Monongahela, and Tilsit in related families. Belvoir, Buchanan, and Cookport soils have Bt horizons with more than 20 percent sand and are lower in silt. Belvoir soils, in addition, have pebbles of quartz and granodiorite. Calverton soils have fewer rock fragments in the solum and include very slow permeability and somewhat poor drainage. Glenville soils have fragments of schist and quartzite and contain mica. Kedron soils have Bt horizons with the hues redder than 5YR. Raritan soils have rounded rock fragments. Clarksburg soils have a base saturation of more than 35 percent and lack low chroma redoximorphic features in the upper 10 inches of the argillic horizon. Monongahela soils commonly have few rock fragments in the solum and lack low chroma redoximorphic features in the upper 10 inches of the argillic horizon and have less than 15 percent sand coarser than very fine sand.
GEOGRAPHIC SETTING: Ernest soils are on foot slopes and colluvial fans. Slopes are dominantly 15 to 35 percent, but range from 0 to 50 percent. These soils formed in acid colluvium from shale, siltstone, and sandstone. Mean annual temperature varies from 47 to 59 degrees F, and mean annual precipitation varies from 30 to 65 inches. The growing season ranges from 120 to 180 days.
GEOGRAPHICALLY ASSOCIATED SOILS: These are the Berks, Brinkerton, Clymer, Dekalb, Gilpin, Shelocta, Wharton, and Weikert soils. The Berks, Dekalb, and Gilpin soils have bedrock at depths of 20 to 40 inches and lack a fragipan. Brinkerton soils are in a fine-silty family and have base saturation greater than 35 percent at a depth of 30 inches below the top of the fragipan. Clymer soils lack a fragipan and have more than 20 percent sand in the particle-size control section. Shelocta soils lack a fragipan and low chroma redoximorphic features in the upper 10 inches of the argillic horizon. Wharton soils lack a fragipan and have more than 35 percent clay in the particle-size control section. Weikert soils lack a fragipan and have bedrock at depths of 10 to 20 inches.
DRAINAGE AND PERMEABILITY: Moderately well drained. Runoff is medium to rapid. Permeability is moderate in A, BA, and Bt horizons and moderately slow or slow in Btx and C horizons.
USE AND VEGETATION: Much of the land is cleared and used for pasture and crops. Woodland stands consist of mixed hardwoods with some white pine and hemlock.
DISTRIBUTION AND EXTENT: West Virginia, Maryland, Pennsylvania, Ohio, New York and Virginia. MLRA 124, 125, 126, 127, 128, 130, and 147. The soils of this series are of large extent.
81
MLRA OFFICE RESPONSIBLE: Morgantown, West Virginia
SERIES ESTABLISHED: Indiana County, Pennsylvania, 1931
REMARKS: Diagnostic horizons and features recognized in this pedon are: Argillic horizon - the zone from 10 to 47 inches (Bt1, Bt2, and Btx horizons). Fragipan - the zone from 27 to 47 inches (Btx horizon).
National Cooperative Soil Survey U.S.A.
HAGERSTOWN SERIES
The Hagerstown series consists of deep and very deep, well drained soils formed in residuum of hard gray limestone. Slope ranges from 0 to 45 percent. Permeability is moderate. Mean annual precipitation is 30 to 45 inches. Mean annual air temperature is 45 to 58 degrees.
TYPICAL PEDON: Hagerstown silt loam, on a 4 percent northwest slope in a small grain field. (Colors are for moist soil unless noted otherwise)
Ap1--0 to 7 inches; dark brown or brown (7.5YR 4/4) silt loam; moderate medium subangular blocky structure; friable; many fine and common medium roots; many fine and common medium tubular pores; neutral; abrupt smooth boundary.
Ap2--7 to 10 inches; dark brown or brown (7.5YR 4/4) silt loam; weak coarse platy structure; firm; many fine and few medium roots; common fine and medium tubular pores; 1 percent limestone channers; neutral; abrupt smooth boundary. (combined thickness of Ap horizons 6 to 12 inches)
BE--10 to 17 inches; strong brown (7.5YR 5/6) silt loam; common medium distinct dark brown or brown (7.5YR 4/2) organic stains in pores; moderate medium subangular blocky structure; friable; common fine and few medium roots; many fine and medium tubular and vesicular pores; few distinct clay films in pores; neutral; clear wavy boundary. (0 to 8 inches thick)
Bt1--17 to 26 inches; yellowish red (5YR 4/6) silty clay loam; common medium distinct very dark gray (5YR 3/1) iron manganese stains on faces and interiors of peds; common fine distinct very dark gray (5YR 3/1) iron manganese concretions;
82
many medium dark brown or brown (7.5YR 4/3) organic stains in pores; moderate medium subangular blocky structure; friable; common fine roots; many fine and medium vesicular and tubular pores; many distinct clay films on ped faces and in pores; 2 percent limestone channers; slightly acid; clear wavy boundary.
Bt2--26 to 45 inches; reddish brown (2.5YR 4/4) silty clay; many fine and medium distinct very dark gray (5YR 3/1) iron manganese stains; common fine distinct very dark gray (5YR 3/1) iron manganese concretions; common medium distinct dark brown or brown (7.5YR 4/3) organic stains in pores; strong fine subangular blocky structure; friable; common fine roots; many fine and medium vesicular and tubular pores; many prominent clay films on ped faces and in pores; 3 percent limestone channers; slightly acid; gradual wavy boundary.
Bt3--45 to 63 inches; red (2.5YR 4/6) clay; common medium distinct brownish yellow (10YR 6/8) lithochromic mottles; many medium distinct very dark gray (5YR 3/1) iron manganese stains; strong fine platy structure; friable; common fine and few medium roots; many fine and medium vesicular and tubular pores; common prominent clay films on ped faces and in pores; 5 percent limestone channers; neutral; gradual wavy boundary. (combined thickness of Bt horizons 20 to 50 inches)
BCt--63 to 71 inches; yellowish red (5YR 4/6), dark brown or brown (7.5YR 4/3) variegated silty clay loam; many medium prominent yellowish brown (10YR 5/8) lithochromic mottles; weak medium subangular blocky structure; friable; common fine roots; common fine and few medium vesicular and tubular pores; common distinct clay films on ped faces; 10 percent limestone channers; slightly acid.
TYPE LOCATION: Washington County, Maryland; north 2,300 feet of the intersection of Wheeler Road and Maryland Route 34, east 1,200 feet, Keedysville area. Funkstown USGS topographic quadrangle Lat. 39 degrees 30 minutes 03 seconds North and Long. 77 degrees 41 minutes 13 seconds West. NAD 83
RANGE IN CHARACTERISTICS: Solum thickness ranges from 40 to 72 inches, however, clay content decreases by more than 20 percent if deeper than 60 inches. Depth to hard limestone ranges from 40 to 84 inches or more. In limed soils, the upper part of the solum ranges from slightly acid through slightly alkaline and the lower part of the solum and substratum ranges from moderately acid through neutral. Hagerstown soils are low in rock fragments with less than 15 percent by volume. The weighted average clay content of the textural control section is between 35 and 60 percent.
The A or Ap horizon has hue of 10YR, 7.5YR, or 5YR, value of 3 to 5, and chroma of 2 to 4. Texture is silt loam, loam, clay loam, and silty clay loam.
The BE horizon has hue of 7.5YR or 5YR, value of 4 or 5, and chroma of 4 to 8. Texture is loam or silt loam.
83
The Bt horizon has hue of 5YR or 2.5YR, value of 4 or 5, and chroma of 4 to 8. Subhorizons of some pedons are 7.5YR. Texture is silty clay, clay, or silty clay loam.
The BC or BCt horizon has hue of 7.5YR to 2.5YR, value of 4 or 5, and chroma of 4 to 8; it ranges from being uniform in color to moderately variegated. Texture is silty clay, clay, clay loam, or silty clay loam.
The C horizon if present has hue of 10YR to 2.5YR, value of 4 to 6, and chroma of 4 to 8; it ranges from being uniform in color to moderately or highly variegated. Texture ranges from silt loam, loam, clay loam, silty clay loam to clay. In many pedons the C horizon is absent or is a very thin transition horizon between solum and bedrock.
COMPETING SERIES: In the same family is the Bland series. The Bland soils have sola less than 40 inches thick and are less than 40 inches to bedrock.
GEOGRAPHIC SETTING: Hagerstown soils occupy valley floors and the adjacent hills. In some areas rock outcrops are common surface features. Most slopes are less than 15 percent but range up to 45 percent. The soils developed in materials weathered from hard gray limestone of rather high purity. The climate is temperate and moderately humid, with a mean annual temperature of 45 to 58 degrees F. and mean annual precipitation of 30 to 45 inches.
GEOGRAPHICALLY ASSOCIATED SOILS: These are the Athol, Baltimore, Benevola, Clarksburg, Duffield, Dunmore, Edom, Elliber, Elk, Frankstown, Frederick, Conestoga, Murrill, and Opequon soils. Athol, Baltimore, Conestoga, Duffield, Elk, Frankstown, Murrill and Wiltshire soils have less than 35 percent clay in the textural control section. Baltimore and Benevola soils have an Ap horizon with a value of less than 3.5. Clarksburg, Dunmore and Frederick soils have a Bt horizon 50 to 75 inches thick that is dominantly kaolinitic in mineralogy. Edom soils have sola less than 40 inches thick. Opequon soils are less than 20 inches to bedrock.
DRAINAGE AND PERMEABILITY: Well drained. The potential for surface runoff is moderate to high. Permeability is moderate.
USE AND VEGETATION: General crops, pastures, orchards, and truck crops. Large areas are in non-farm uses. Native vegetation is mixed hardwoods, including black walnut.
DISTRIBUTION AND EXTENT: Pennsylvania, Maryland, Virginia, West Virginia, Kentucky and Tennessee; possibly Ohio, Indiana, and Missouri. The series is of large extent.
MLRA OFFICE RESPONSIBLE: Morgantown, West Virginia
SERIES ESTABLISHED: Lancaster County, Pennsylvania.
84
REMARKS: Previously revised by EDM-BLM-JEW in 10/98. New type location processed in 12/2003. (Decision to do this was made in 1997 ago. Sample reference number S92MD043-013
National Cooperative Soil Survey U.S.A.
85
Appendix B: Chemical Measurements of Field Soil Samples by
Treatment and Zone from Sylvan Grove Kill Zone Study
P K Mg Ca Meq
100 /g Meq
100 /g
Year Amendment Zone Treat. pH ppm ppm ppm ppm CEC res.
Appendix C: Chapter 3 & 4 Data Presented in Table Form
Zone and Treatment
% moisture
2006 Zone and Treatment
% moisture
2006 Zone and Treatment
% moisture
2006 Orange Lime 32 Gray Lime 29 Red Lime 75 Orange Low 28 Gray Low 31 Red Low 68 Orange High 31 Gray High 31 Red High 84
Orange Lime
Outside 29 Gray Lime Outside 24 Red Lime
Outside 75
Orange Low Outside 27 Gray Low
Outside 25 Red Low Outside 75
Orange High Outside 27 Gray High
Outside 26 Red High Outside 75
Zone and Treatment
% moisture
2007 Zone and Treatment
% moisture
2007 Zone and Treatment
% moisture
2007 Orange Lime 29 Gray Lime 25 Red Lime 79 Orange Low 26 Gray Low 28 Red Low 63 Orange High 26 Gray High 28 Red High 80
Orange Lime
Outside 26 Gray Lime Outside 22 Red Lime
Outside 77
Orange Low Outside 24 Gray Low
Outside 23 Red Low Outside 75
Orange High Outside 24 Gray High
Outside 23 Red High Outside 79
Table C – 1: Percent soil moisture taken at the end of 2006 & 2007 growing season. Results are shown for inside amended plots and area directly outside of that plot. Orange and gray zone moistures can be considered as typical field moisture values. Red zone soils have very high moisture contents and could almost be considered water logged.
R. Low 2.53f 0.01 4.07d 0.02 2.15h 0.07 3.84cde 0.42
R. High 2.55f 0.005 3.79d 0.07 2.50fgh 0.37 4.22c 0.55
O. Lime 2.82ef 0.065 4.81c 0.06 2.95fg 0.08 5.29b 0.32
O. Low 2.89ef 0.02 5.42b 0.15 3.04efg 0.06 5.21b 0.16
O. High 2.92ef 0.2 4.99c 0.02 3.07efg 0.08 5.08b 0.30
G. Lime 3.20e 0.05 5.87a 0.41 3.28efd 0.03 6.38a 0.06
G. Low 2.99ef 0.06 5.94a 0.28 3.19defg 0.10 6.45a 0.09
G. High 2.86ef 0.005 6.08a 0.11 3.12efg .005 6.62a 0.08
Table C – 2: pH values of unamended and amended soils by zones and treatments with standard errors. Unamended soils of all zones are very acidic pH < 3.20 but pH of amended soils increased. Furthermore there was a slight increase from 2006 to 2007 of amended soils. * Varying letters within a year implies statistical differences. **Statistics were run separately for each year between amended and unamended.
Error R. Lime 6.24d* 0.029 5.04d 0.035 7.00b 0.067 6.81c 0.146 O. Lime 4.29f** 0.212 4.01e 0.020 7.79a 0.097 7.29bc 0.087 G. Lime 6.65bcd 0.154 4.67d 0.229 7.94a 0.048 7.82ab 0.151 R. Low 5.11e 0.141 3.62e 0.259 6.95cb 0.114 7.41bc 0.298 O. Low 5.41e 0.336 4.98d 0.208 7.98a 0.042 7.53b 0.073 G. Low 6.50cd 0.158 3.91e 0.422 8.00a 0.039 8.24a 0.017 R. High 5.43e 0.249 4.64d 0.463 6.93cb 0.060 7.23bc 0.101 O. High 4.28f 0.142 3.97e 0.188 7.78a 0.043 7.53b 0.078 G. High 6.57bcd 0.090 4.91d 0.268 7.99a 0.059 8.28a 0.020
Table C – 3: Average log CFU/g soil of both unamended and amended soils for 2006 and 2007 growing season along with standard error. Amended soils produced more CFU’s/g soil than unamended soils and there was less variability.* Varying letters within a year implies statistical differences. ** Statistics were run separately for each year between amended and unamended.
91
(Fum - UnFum) (Fum -
UnFum) (Fum - UnFum) (Fum -
UnFum)
2006 Amended
std err
2006 Unamended
std err
2007 Amended
std err
2007 Unamended
std err
R. Lime 26.6abcd* 14.3 44.6a 3.8 43.8bcd 5.3 48.4bc 4.5
R. Low 41.2abc 9.8 44a 19.2 35.5cde 2.7 52.9b 15.7
R. High 45.8a 8.8 43.2a 5.5 47.8bc 1.8 40.4bcde 4.6
O. Lime 8.6d - ** 9.8d - 19.15fg 3.6 13.1g 1.8
O. Low 9.8d - 14.9bcd 0.04 18.9fg 1.5 10g 0.6
O. High 19.6abcd 6.1 8.58d 3.58 28.5ef 2.9 10.4g 0.68
G. Lime 11.82d 2.18 3.4d 0.002 32def 2.6 8.9g 0.5
G. Low 13.2cd 0.72 2.16d 0.77 79.2a 2.74 10.9g 1.1
G. High 14.3bcd 0.29 0.87d - 87.2a 1.8 11g 0.78
Table C – 4: Average microbial biomass obtained by fumigated C values minus unfumigated C values. Biomass given in ug C/g soil. Amended values are larger than unamended soils (besides in red zone with a undisturbed biofilm confounding results), do to the increase in organic matter input of compost.* Different letters within a given year indicates significant differences. ** Only one replicate was done, do to a shortage of soil.
92
Figure C - 1: Picture of biofilm coating soil surface on red zone.
Figure C – 2: Picture of red zone vegetation 2007.
93
2006 2006 2006 2006 2007 2007 2007 2007 Amended St.
err Unamended St
err Amended St
err Unamended St
err R. Lime 0.88bcd* 0.06 0.89bcd 0.05 0.73cde 0.04 0.49ed 0.03 R. Low 1.14a 0.03 0.78cd 0.17 1.01bc 0.08 0.45ef 0.11 R. High 1.21a 0.08 0.77cd 0.19 0.98bc 0.17 0.57de 0.10 O. Lime 0.81cd 0.05 0.12e 0.03 0.82bcd 0.22 0.17fg 0.03 O. Low 0.99abc 0.08 0.08e 0.01 0.91bc 0.10 0.13fg 0.01 O. High 1.06ab 0.10 0.09e 0.01 1.14b 0.10 0.13fg 0.03 G. Lime 0.74d 0.02 0.08e 0.01 0.78cde 0.07 0.10g 0.03 G. Low 0.84bcd 0.06 0.10e 0.01 2.49a 0.22 0.11g 0.01 G. High 0.85bcd 0.02 0.09e 0.01 2.75a 0.09 0.07g 0.00 Table C – 5: Average soil respired carbon C-Co2/g soil hour-1 by amendment, zone and year. R = red, O = orange, G = gray. *Different letters within each year indicates a significant difference, 2006 and 2007 were analyzed separately.
Plot % Cover May St err % Cover
July St err
R. Lime 6.5c 1.5 14d 1.0
O. Lime 34bc 29.0 59.5cd 38.5
G. Lime 59.5bc 33.5 80.5cd 11.5
R. Low 297.5a 29.5 292.5a 7.5
O. Low 123bc 12.0 133.5bc 7.5
G. Low 277a 83.0 229a 40.0
R. High 306a 27.0 306a 56.0
O. High 153b 49.0 214.5ab 2.5
G. High 313.5a 12.5 272a 5.0
Table C – 6: Percent biomass cover for May and July 2007. There were significant changes between lime only treatments and compost treatments. All composted gray zone treatments did the same as composted red zones and better than orange zone. The red lime only amendment did the worst among all treatments * Differences in letters signify statistical differences. R = red zone, O = orange zone, and G = gray zone.
94
kg/ha 2006
St. error
kg/ha 2007
St. error
R. Lime 442d* 274 23d 10.4 R. Low 1651abc 392.6 934b 34.7 R. High 2580a 162.6 1440a 200.6 O. Lime 945bcd 145.3 314cd 198.2 O. Low 1159bcd 134.5 651bc 44 O. High 1844abc 348 1001b 71.3 G. Lime 928cd 28.8 241d 20.9 G. Low 2144ab 91.3 915b 126.2 G. High 2740a 817.6 865b 109.2
Table C – 7: Average dry biomass produced in kg/ha for 2006 and 2007 growing season by treatment and zone. *Differing letters indicates that there is a significant difference from others within same year.
Root Biomass st err
Control 9.43 0.43 Lime 16.79 2.61 Low 32.31 9.03 High 36.59 6.61
Table C – 8: Average dry root biomass weight of greenhouse study. High compost treatment produced the most root biomass. Control = a standard Hagerstown soil, not AMD soil.