24
Revenue The other part of the equation!
| Date post: | 08-Mar-2016 |
| Category: |
Documents |
| Upload: | dan-martin |
| View: | 214 times |
| Download: | 0 times |

Revenue
The other part of the equation!
Objectives• Explain the difference between
Average, Marginal and Total Revenue• Draw these lines graphically• Explain the implications for a firm’s
profit making decisions

Outcomes• A: To have drawn the three types of
revenue curves• M: To understand clearly where
these are derived from• S: Be able to make the link between
these revenue, cost and profit situations

Back to Basics• Profit is
represented by the Greek letter ∏ Pi
• Profit = Total Revenue – Total Cost

Total Revenue• This is the firms
total earnings from sales of a product
• TR= PxQ
TRTR

Average Revenue• The amount earned
per unit sold
• AR = TR/Q
• So if the firm earns £5000 from 1000 units then AR = £5
• But this is simply the price!
ARAR

Marginal Revenue• This is the additional
total revenue from selling one more unit.
• MR = ∆TR/ ∆Q.
• So if the firm sells 20 extra units for a total of £100 then MR = £5
MRMR
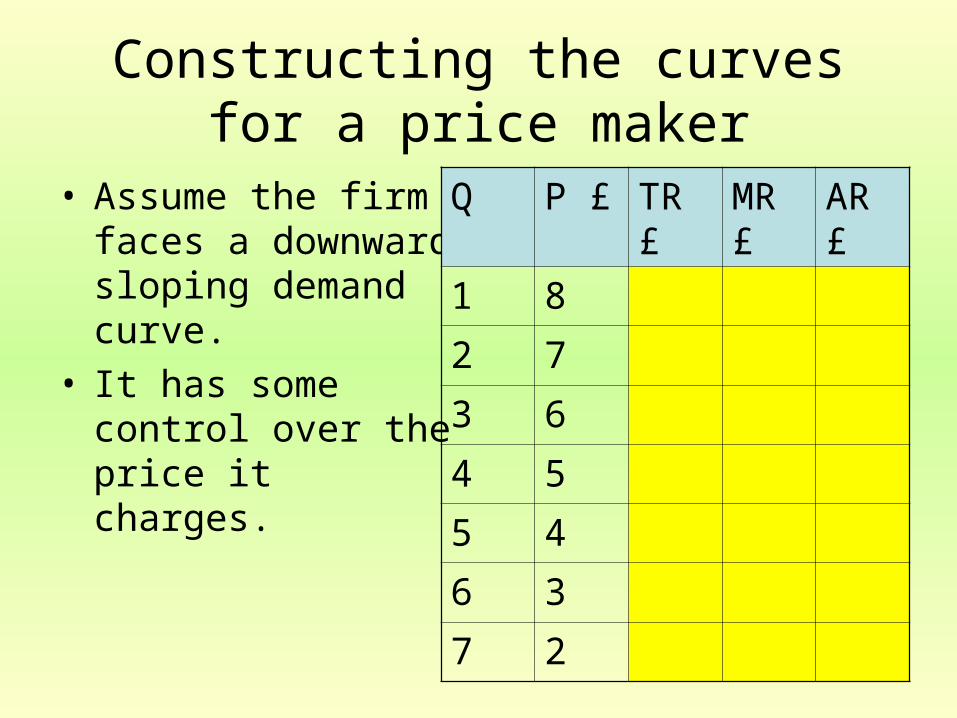
Constructing the curves for a price maker
• Assume the firm faces a downward sloping demand curve.
• It has some control over the price it charges.
Q P £ TR £
MR £
AR £
1 82 73 64 55 46 37 2

Constructing the curves for a price maker
• Assume the firm faces a downward sloping demand curve.
• It has some control over the price it charges.
Q P £ TR £
MR £
AR £
1 8 8 82 7 14 63 6 18 44 5 20 25 4 20 06 3 18 -27 2 14 -4

What sort of business would this be?
• Monopoly• Limited
Competition• Differentiated
products

Price Taker• What sort of
business would have no control over price at all?
• Perfectly Competitive

Conditions facing a price takerQ P £ TR £ MR £0 51 52 53 54 55 56 5
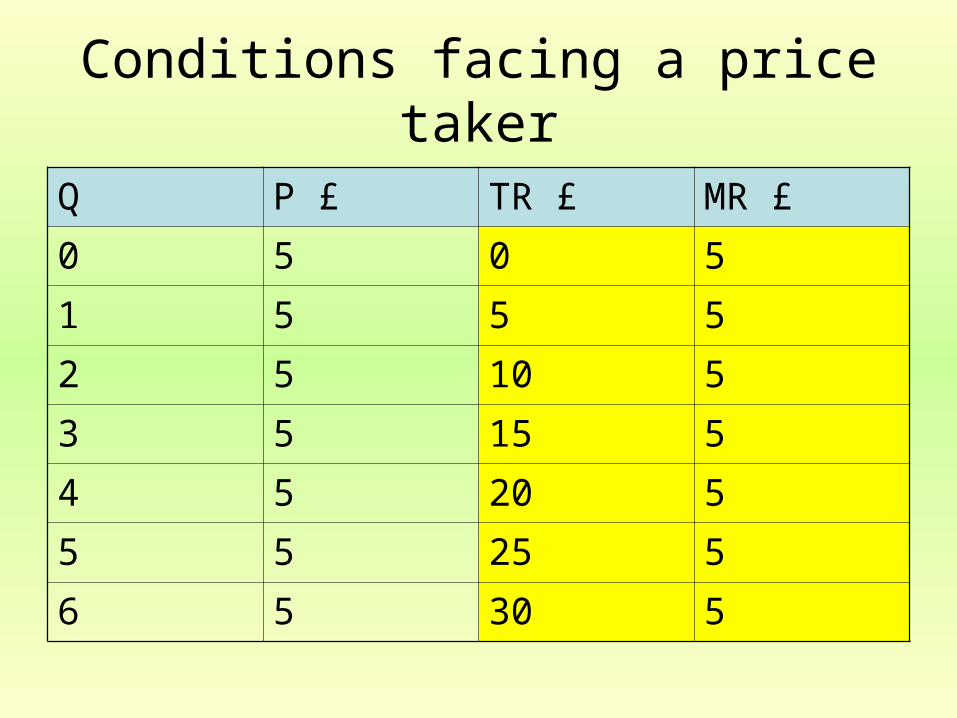
Conditions facing a price takerQ P £ TR £ MR £0 5 0 51 5 5 52 5 10 53 5 15 54 5 20 55 5 25 56 5 30 5

Why is the MR curve not the Demand Curve?

Objectives• Emphasise link between MR and AR• Clarify any confusion!• Relate to price making businesses.

Outcomes• All will understand the reasons for AR
representing a price makers demand curve
• All will have drawn accurate diagrams representing the AR and MR curves.
Recap• Marginal means the change in total
caused by one additional unit
• Average is the total divided by the number of units

AR and MR curves
Average Revenue
Marginal Revenue

Another Table!Quantity
Price TR MR
1 10 108
2 9 186
3 8 244
4 7 282
5 6 300
6 5 30-2
7 4 28

Quantity
Price= AR£
TR £ MR £
1 10 108
2 9 186
3 8 244
4 7 282
5 6 300
6 5 30-2
7 4 28
Suppose Price is currently £10, 1 unit will sell.The business wants to increase its sales so cuts price to £9.This means it sells another unit for £9. BUT it has also had to sell the first one at £9 as well!It would have been able to sell this for £10 before.So the total change to revenue is +£9 from the second unit but -£1 from having to discount the first.MR = £8

Got it??• The AR curve is still
the demand curve and the MR curve simply shows the change in revenue form the last unit.

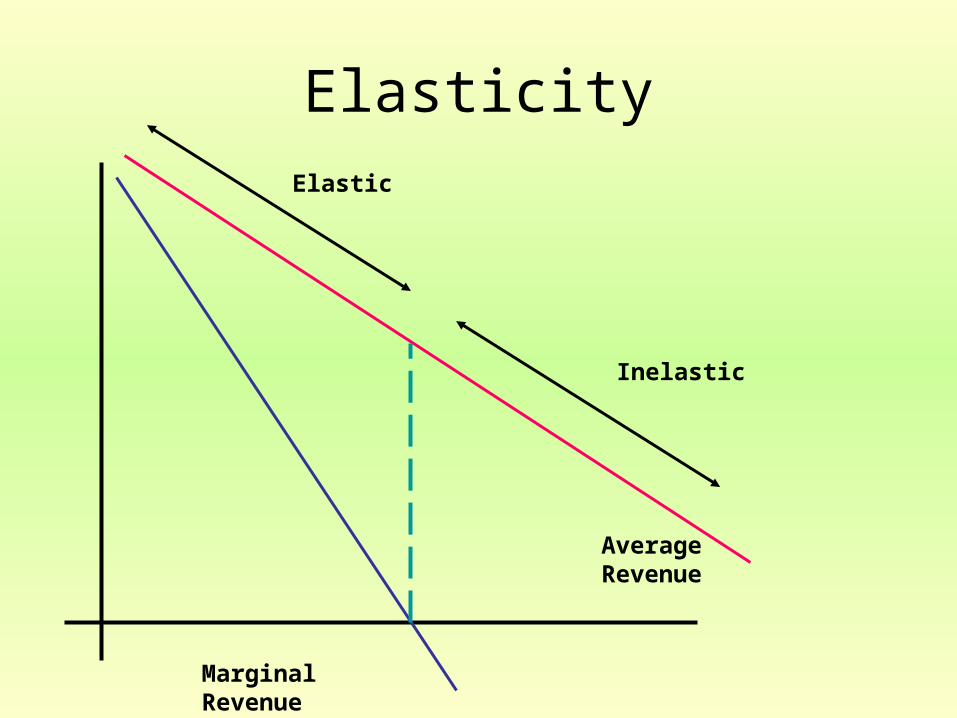
Elasticity
Average Revenue
Marginal Revenue
Elastic
Inelastic

You what???• Remember elasticity measures the
relationship between price and quantity demanded
• If D is elastic then a fall in price will lead to a larger increase in demand and as a result revenue will rise.
• If D is inelastic a fall in price will cause a less than proportional increase in demand and revenue will fall.
Elasticity
Average Revenue
Marginal Revenue
Elastic
Inelastic


