64
HPLC Method HPLC Method Development Development

HPLC Method HPLC Method DevelopmentDevelopment
Part 1. General Chromatographic Theory
Part 2. The Stationary Phase: An Overview of HPLC Media
Part 3. The Role of the Mobile Phase in Selectivity
Part 4. Column Care and Use
3
The Liquid Chromatographic Process
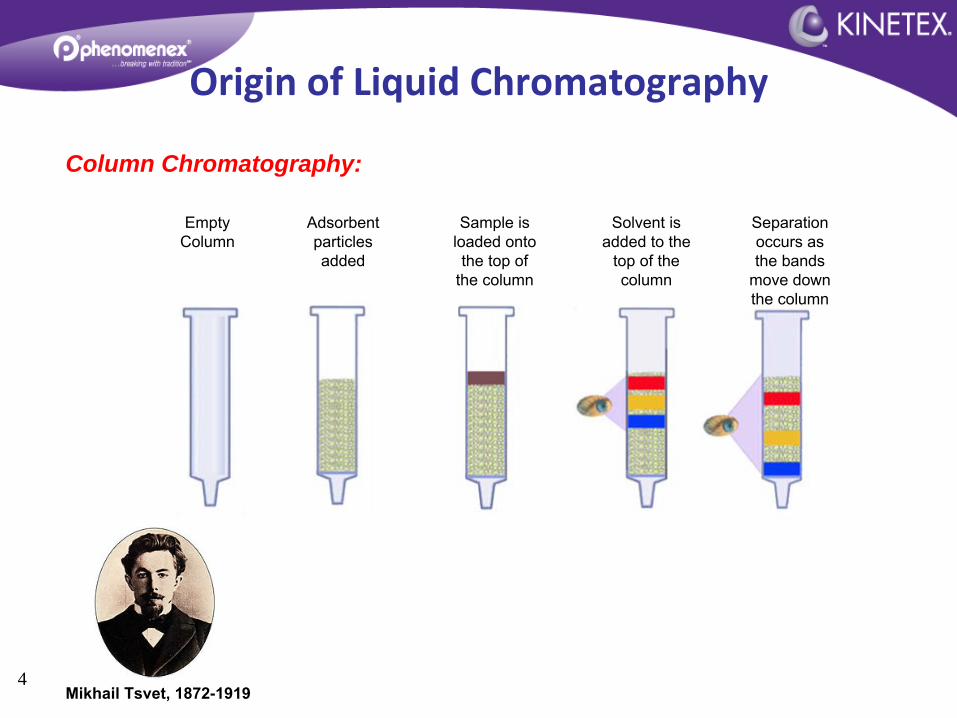
4Mikhail Tsvet, 1872-1919
Origin of Liquid Chromatography
Empty Column
Adsorbent particles added
Sample is loaded onto the top of
the column
Solvent is added to the
top of the column
Separation occurs as the bands
move down the column
Column Chromatography:

5
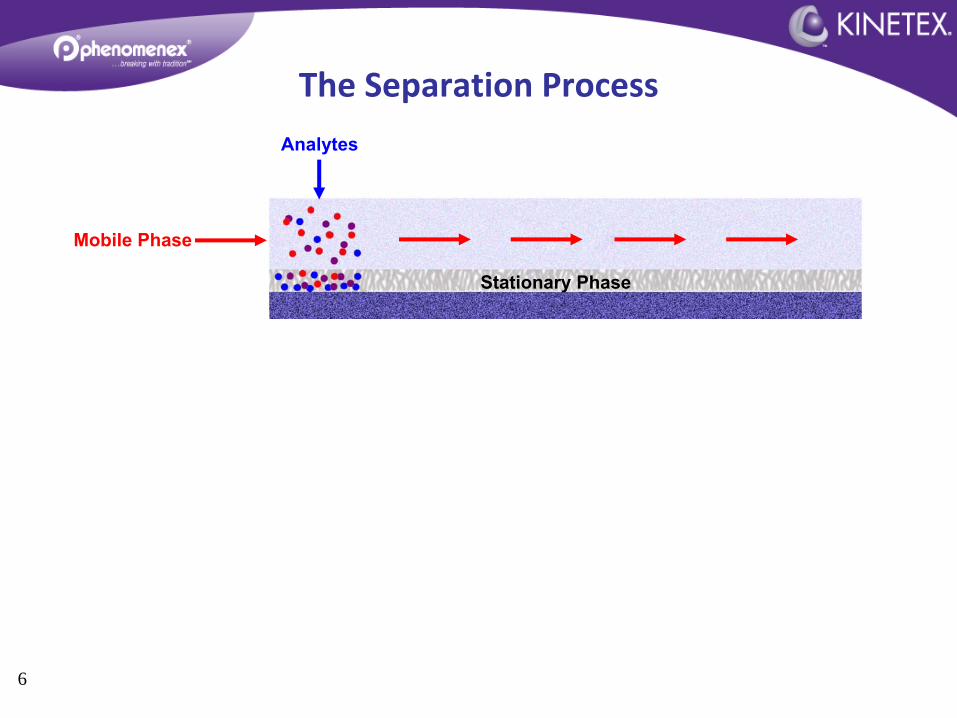
Basis of Chromatographic SeparationSeparation of compounds by HPLC depends on the interaction of analyte molecules with the
stationary phase
and the
mobile phase.
Mobile Phase Stationary Phase
6
Mobile Phase
Stationary Phase
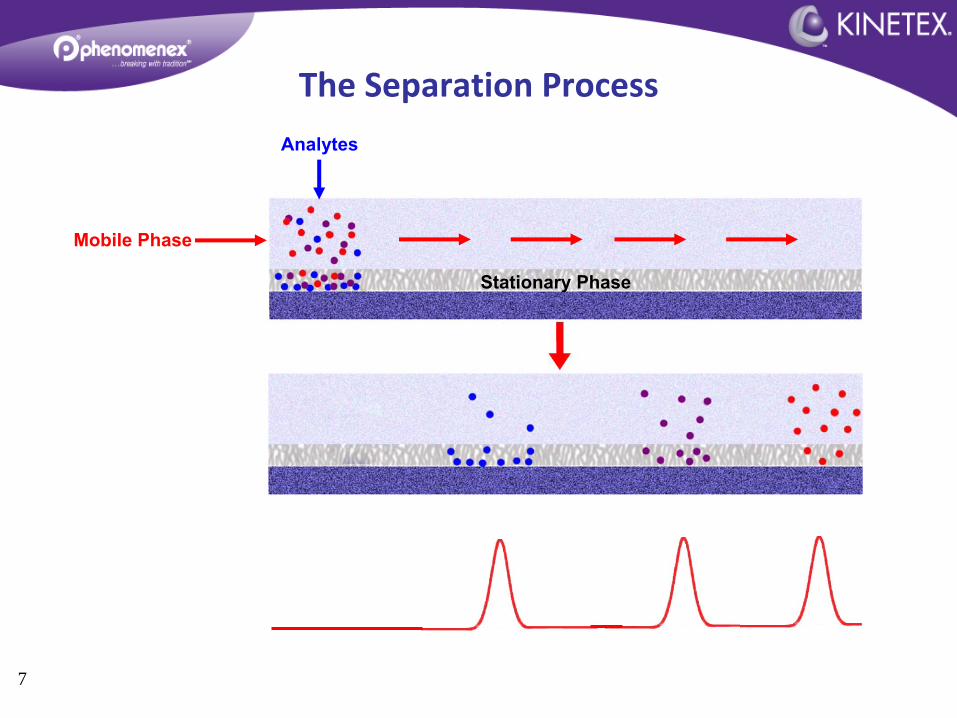
Analytes
The Separation Process
7
Mobile Phase
Stationary Phase
Analytes
The Separation Process
8
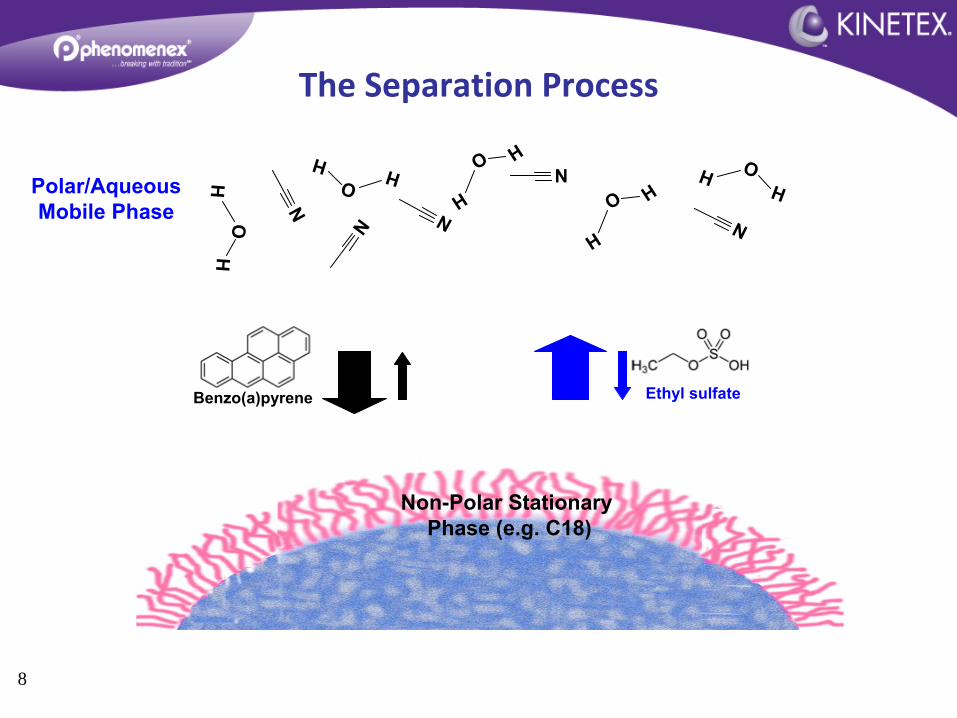
Non-Polar Stationary Phase (e.g. C18)
O H
H
OH
H OH
H
N
N
N
N
N
O H
H
OH H
Polar/AqueousMobile Phase
Benzo(a)pyrene Ethyl sulfate
The Separation Process

9
Ethyl sulfateBenzo(a)pyrene
Hydrophobic Interactions
10
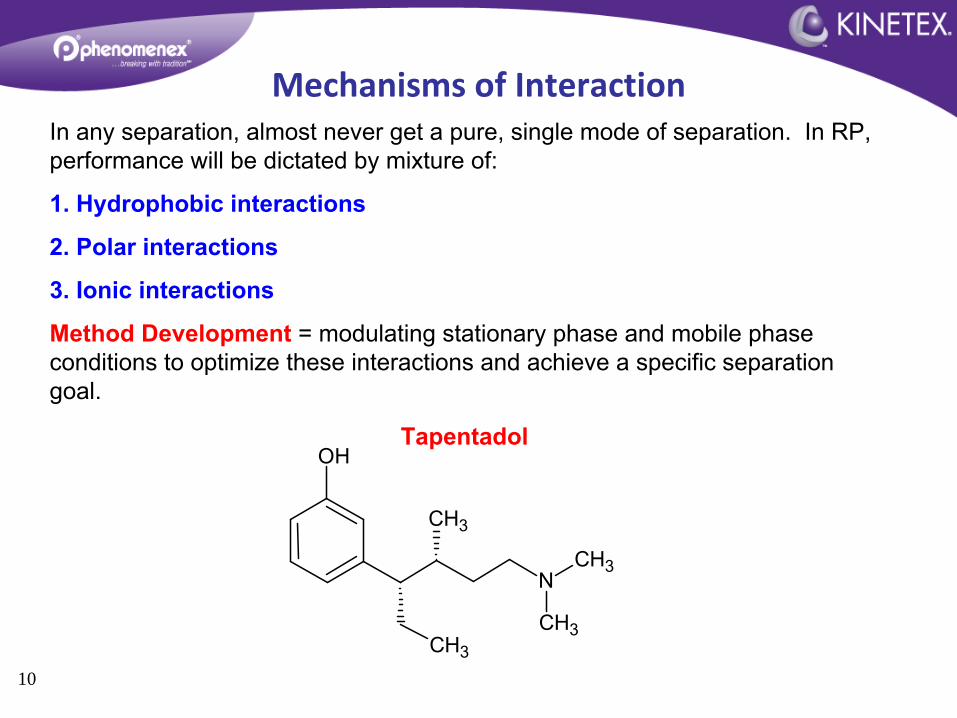
In any separation, almost never get a pure, single mode of separation. In RP, performance will be dictated by mixture of:
1. Hydrophobic interactions
2. Polar interactions
3. Ionic interactions
Method Development
= modulating stationary phase and mobile phase conditions to optimize these interactions and achieve a specific
separation goal.
OH
N
CH3
CH3
CH3
CH3
Tapentadol
Mechanisms of Interaction
11
S iO
S iO
S iO
S iO
S iO
S iO
S iO
S iO
S iO
S iO HCH 3
OH O H OH O H O H O H OH O H O H O H
O O O- O H O O OO
S iS i S i
S iS iCH 3
C H 3
CH 3C H 3
CH 3C H 3
CH 3 C H 3
C H 3C H 3 C H 3 CH 3
C H 3
C H 3
C H 3O H
OH
N
CH3
CH3
CH3CH3
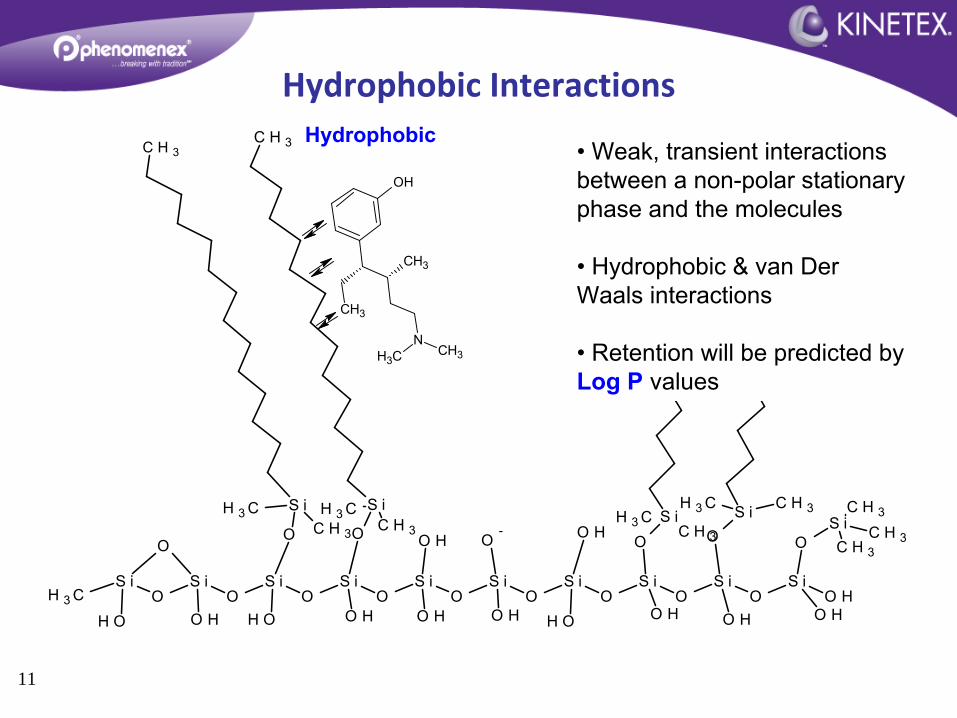
Hydrophobic•
Weak, transient interactions between a non-polar stationary phase and the molecules
•
Hydrophobic & van Der
Waals interactions
•
Retention will be predicted by Log P
values
Hydrophobic Interactions
12
S iO
S iO
S iO
S iO
S iO
S iO
S iO
S iO
S iO
S iO HCH 3
OH O H OH O H O H O H OH O H O H O H
O O O- O H O O OO
S iS i S i
S iS iCH 3
C H 3
CH 3C H 3
CH 3C H 3
CH 3 C H 3
C H 3C H 3 C H 3 CH 3
C H 3
C H 3
C H 3O H
OH
N
CH3
CH3
CH3CH3
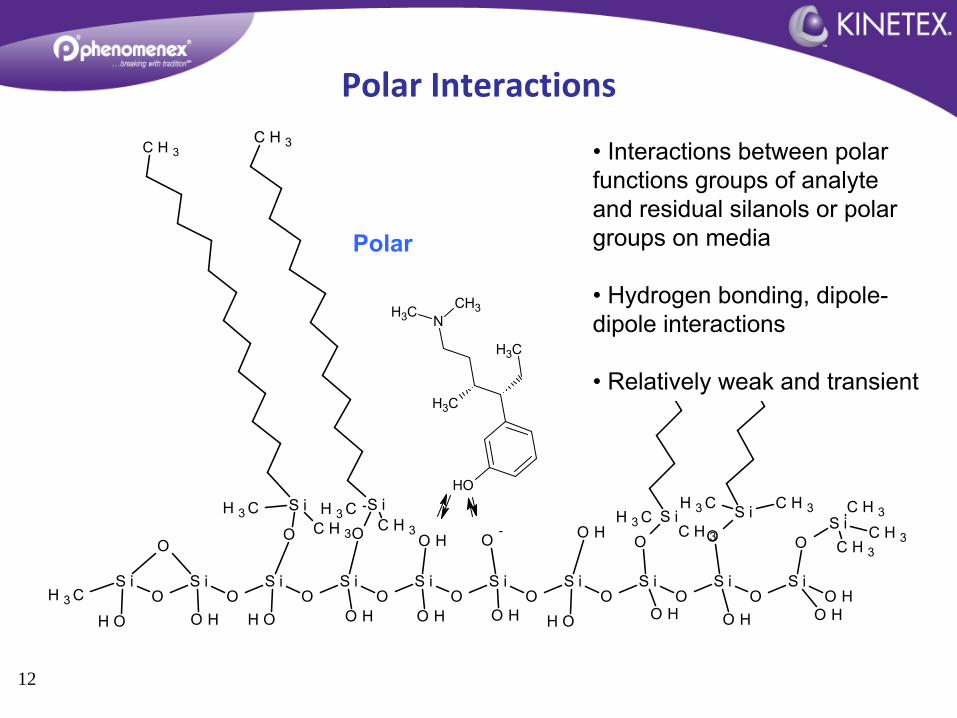
Polar
•
Interactions between polar functions groups of analyte and residual silanols or polar groups on media
•
Hydrogen bonding, dipole-
dipole interactions
• Relatively weak and transient
Polar Interactions
13
S iO
S iO
S iO
S iO
S iO
S iO
S iO
S iO
S iO
S iO HCH 3
OH O H OH O H O H O H OH O H O H O H
O O O- O H O O OO
S iS i S i
S iS iCH 3
C H 3
CH 3C H 3
CH 3C H 3
CH 3 C H 3
C H 3C H 3 C H 3 CH 3
C H 3
C H 3
C H 3O H
OH
NH+
CH3
CH3
CH3CH3
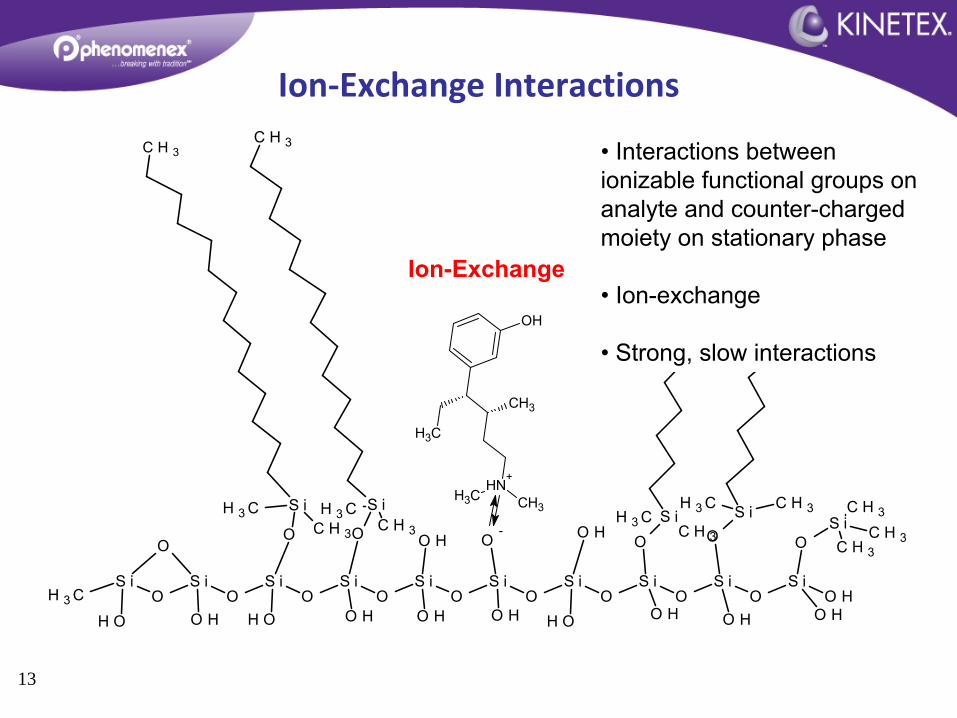
Ion-Exchange
•
Interactions between ionizable functional groups on analyte and counter-charged moiety on stationary phase
• Ion-exchange
• Strong, slow interactions
Ion‐Exchange Interactions

14
Chromatographic Measurements
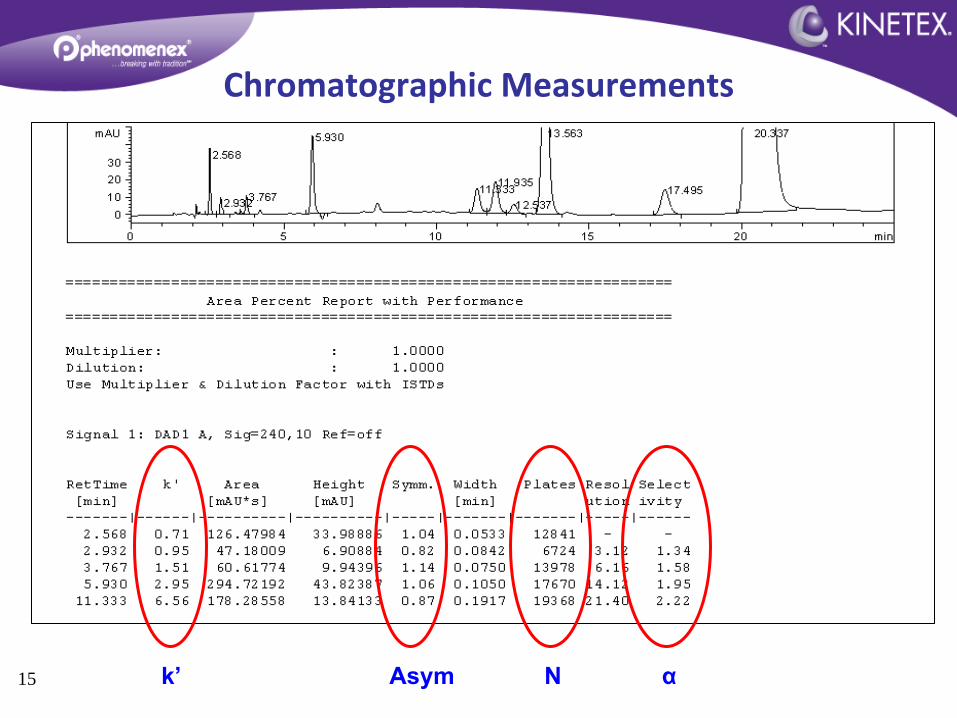
15 k’ Asym N α
Chromatographic Measurements
16
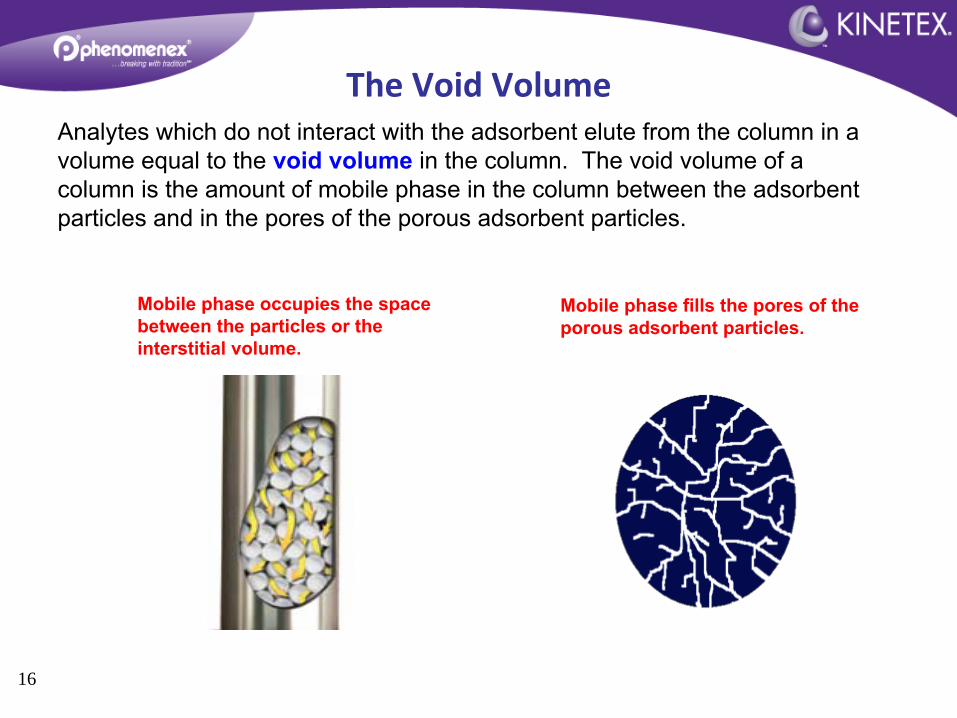
Analytes which do not interact with the adsorbent elute from the
column in a volume equal to the void volume
in the column. The void volume of a column is the amount of mobile phase in the column between the adsorbent particles and in the pores of the porous adsorbent particles.
Mobile phase occupies the space between the particles or the interstitial volume.
Mobile phase fills the pores of the porous adsorbent particles.
The Void Volume
17
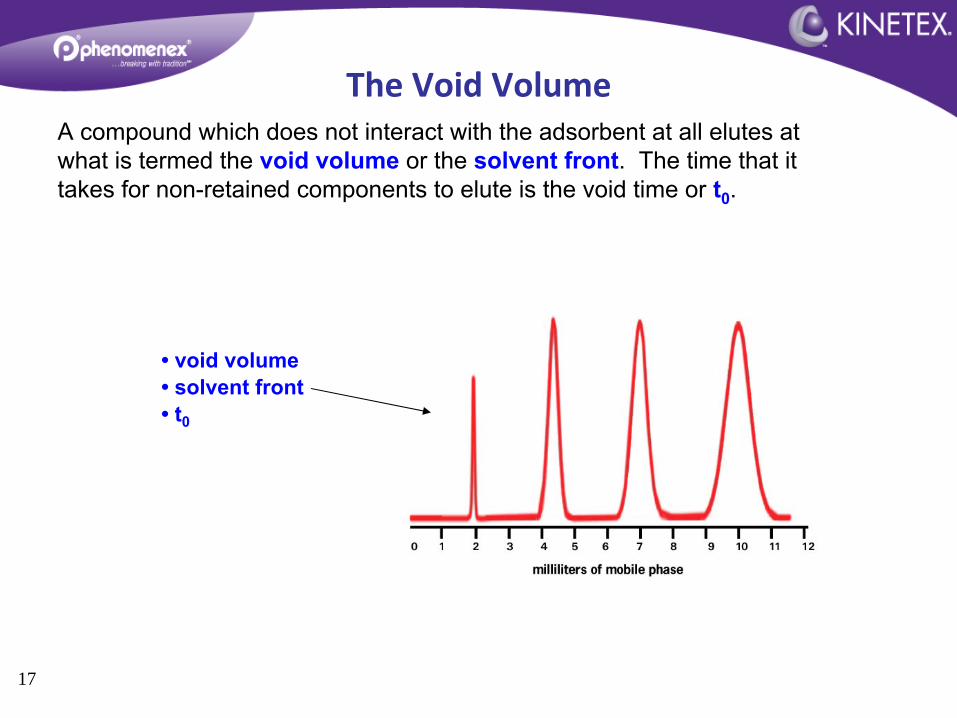
A compound which does not interact with the adsorbent at all elutes at what is termed the void volume
or the solvent front. The time that it takes for non-retained components to elute is the void time or t0
.
• void volume•
solvent front• t0
The Void Volume
18
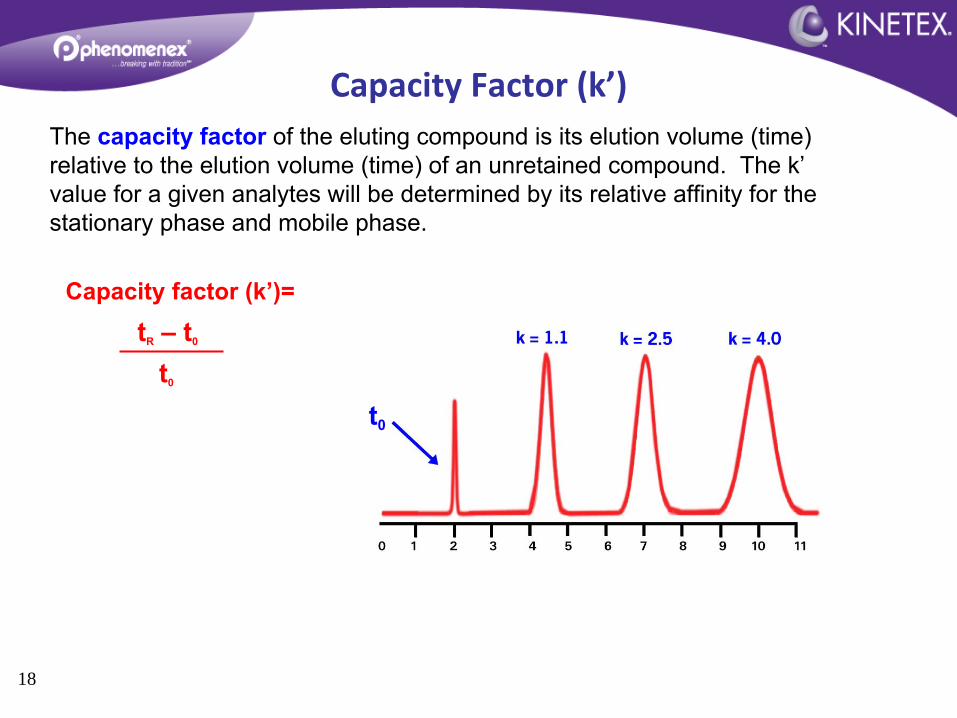
The capacity factor
of the eluting compound is its elution volume (time) relative to the elution volume (time) of an unretained
compound. The k’
value for a given analytes will be determined by its relative affinity for the stationary phase and mobile phase.
t0
Capacity factor (k’)=
tR
– t0
t0
Capacity Factor (k’)
19
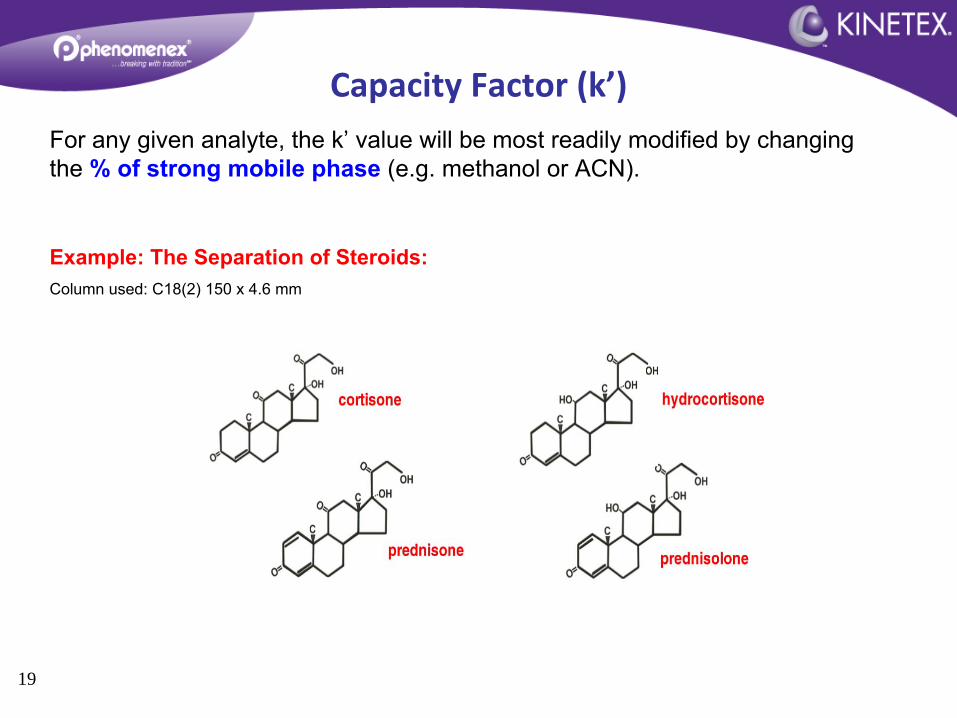
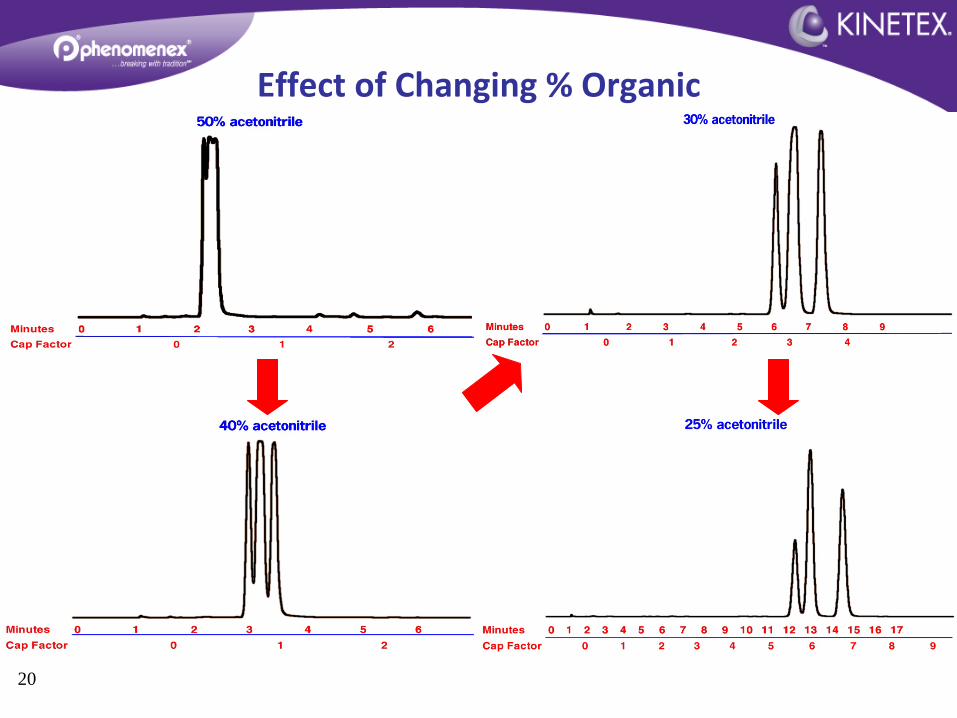
For any given analyte, the k’
value will be most readily modified by changing the % of strong mobile phase
(e.g. methanol or ACN).
Example: The Separation of Steroids:Column used: C18(2) 150 x 4.6 mm
Capacity Factor (k’)
20
Effect of Changing % Organic
21
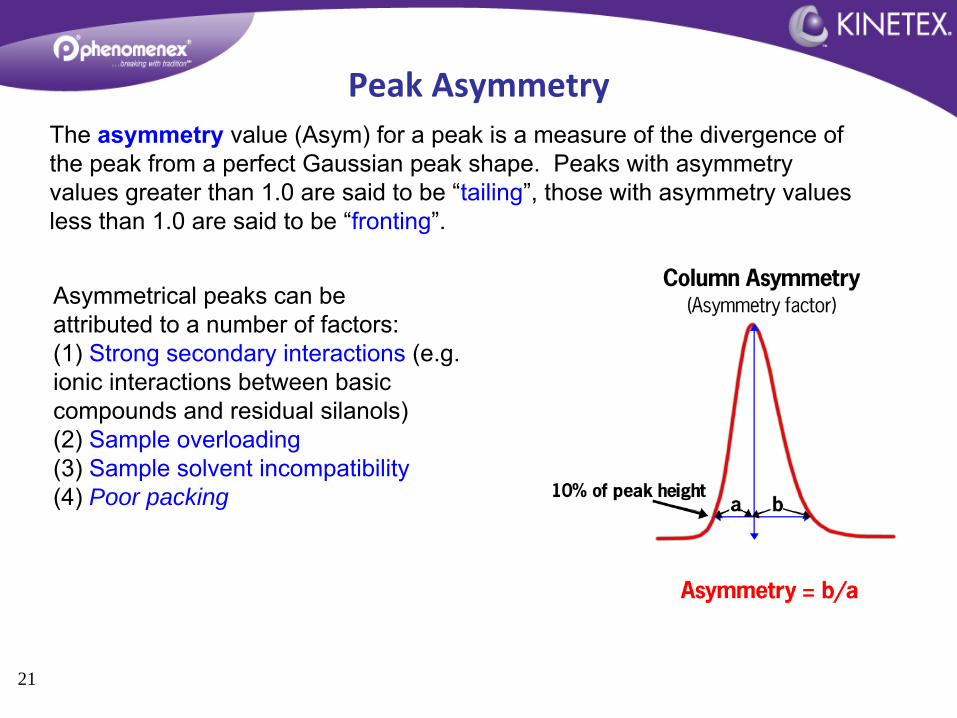
The asymmetry
value (Asym) for a peak is a measure of the divergence of the peak from a perfect Gaussian peak shape. Peaks with asymmetry values greater than 1.0 are said to be “tailing”, those with asymmetry values less than 1.0 are said to be “fronting”.
Asymmetrical peaks can be attributed to a number of factors:(1) Strong secondary interactions
(e.g. ionic interactions between basic compounds and residual silanols)(2) Sample overloading(3) Sample solvent incompatibility(4) Poor packing
Peak Asymmetry
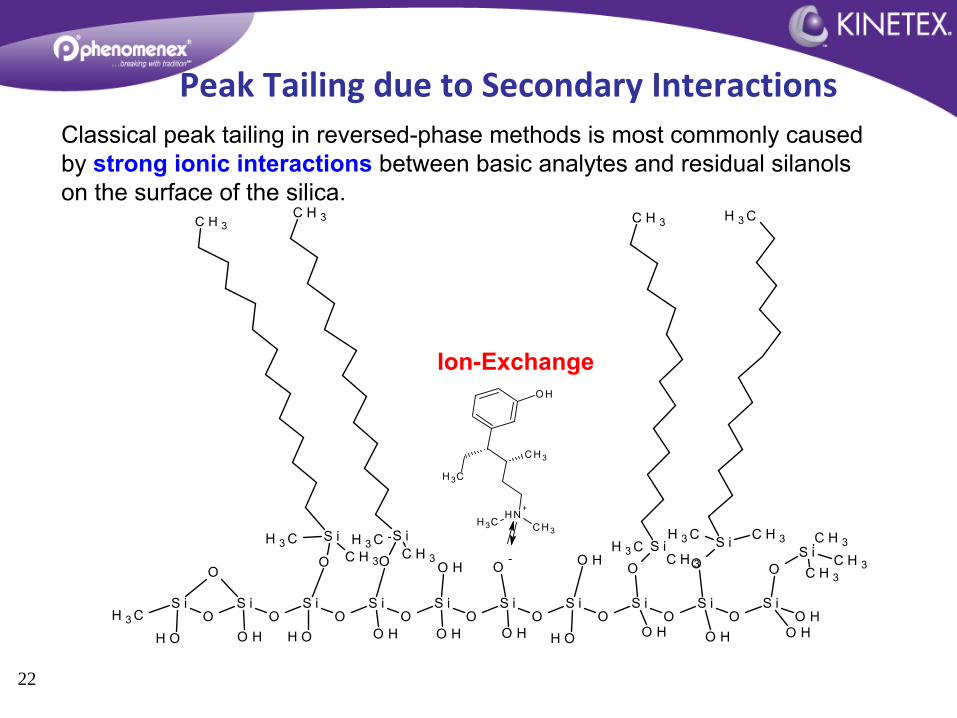
Classical peak tailing in reversed-phase methods is most commonly caused by strong ionic interactions
between basic analytes and residual silanols on the surface of the silica.
S iO
S iO
S iO
S iO
S iO
S iO
S iO
S iO
S iO
S iO HCH 3
OH O H OH O H O H O H OH O H O H O H
O O O- O H O O OO
S iS i S i
S iS iCH 3
C H 3
CH 3C H 3
CH 3C H 3
CH 3 C H 3
C H 3C H 3 C H 3 CH 3
C H 3
C H 3
C H 3O H
O H
NH+
CH 3
C H 3
CH 3CH 3
Ion-Exchange
22
Peak Tailing due to Secondary Interactions
2323
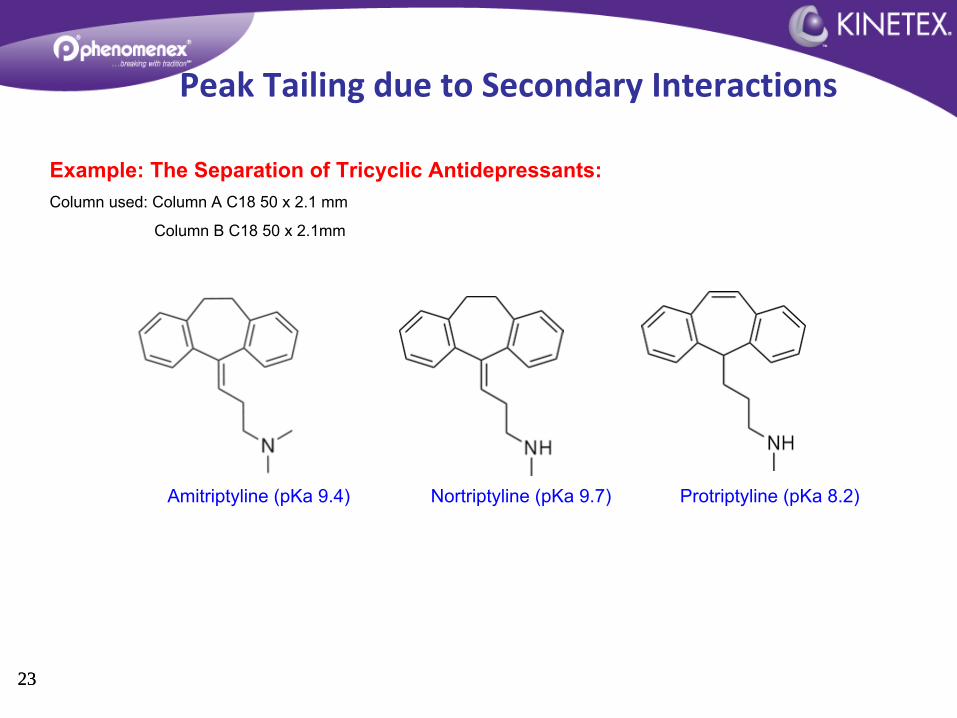
Example: The Separation of Tricyclic Antidepressants:Column used: Column A C18 50 x 2.1 mm
Column B C18 50 x 2.1mm
Amitriptyline (pKa 9.4) Nortriptyline (pKa 9.7) Protriptyline
(pKa 8.2)
Peak Tailing due to Secondary Interactions
24
Sample 28 (Halo C18-50x2, 2.7 um, MeOH:0.1% ... Max. 1.1e5 cps.
3.4 3.6 3.8 4.0 4.2 4.4 4.6 4.8 5.0 5.2 5.4 5.6 5.8 6.0Time, min
1
2 3
45
6
7 8
Sample 28 (Halo C18-50x2, 2.7 um, MeOH:0.1% ... Max. 1.1e5 cps.
3.4 3.6 3.8 4.0 4.2 4.4 4.6 4.8 5.0 5.2 5.4 5.6 5.8 6.0Time, min
4
6
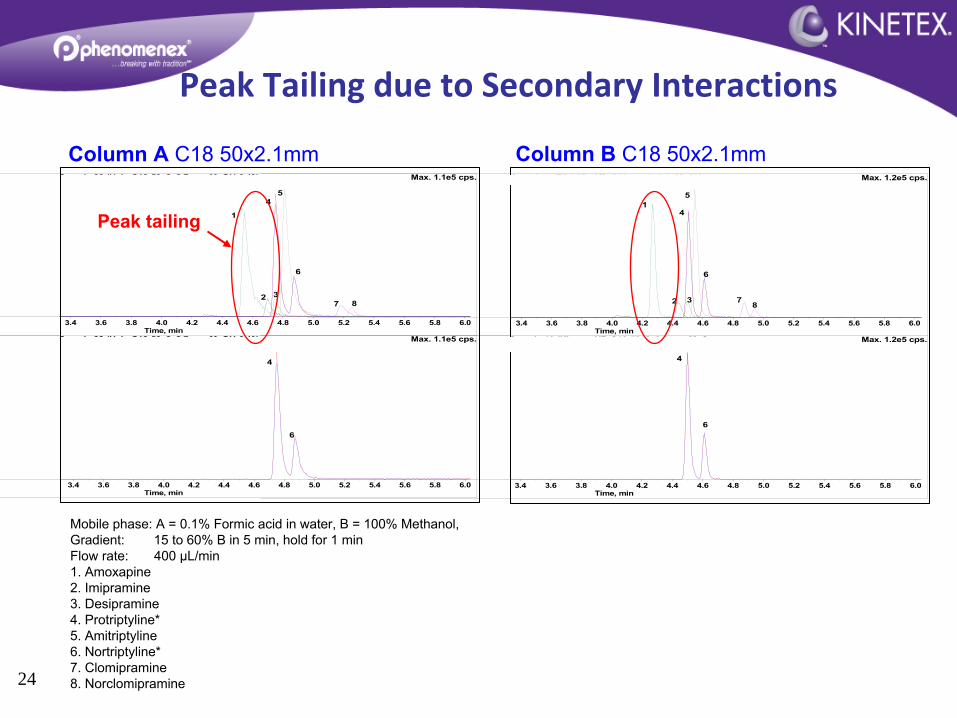
Mobile phase: A = 0.1% Formic acid in water, B = 100% Methanol,Gradient: 15 to 60% B in 5 min, hold for 1 minFlow rate: 400 µL/min1. Amoxapine2. Imipramine3. Desipramine4. Protriptyline*5. Amitriptyline6. Nortriptyline*7. Clomipramine8. Norclomipramine
Sample 7 (TCA-Kin-XB-C18, 50x2, 2.6, MeOH 0.... Max. 1.2e5 cps.
3.4 3.6 3.8 4.0 4.2 4.4 4.6 4.8 5.0 5.2 5.4 5.6 5.8 6.0Time, min
2 3
1
4
5
6
78
15
Sample 13 (Kinetex XB-C18-50x2, 2.6 um, MeO... Max. 1.2e5 cps.
3.4 3.6 3.8 4.0 4.2 4.4 4.6 4.8 5.0 5.2 5.4 5.6 5.8 6.0Time, min
4
6
Column B
C18 50x2.1mmColumn A
C18 50x2.1mm
Peak tailing
Peak Tailing due to Secondary Interactions
25
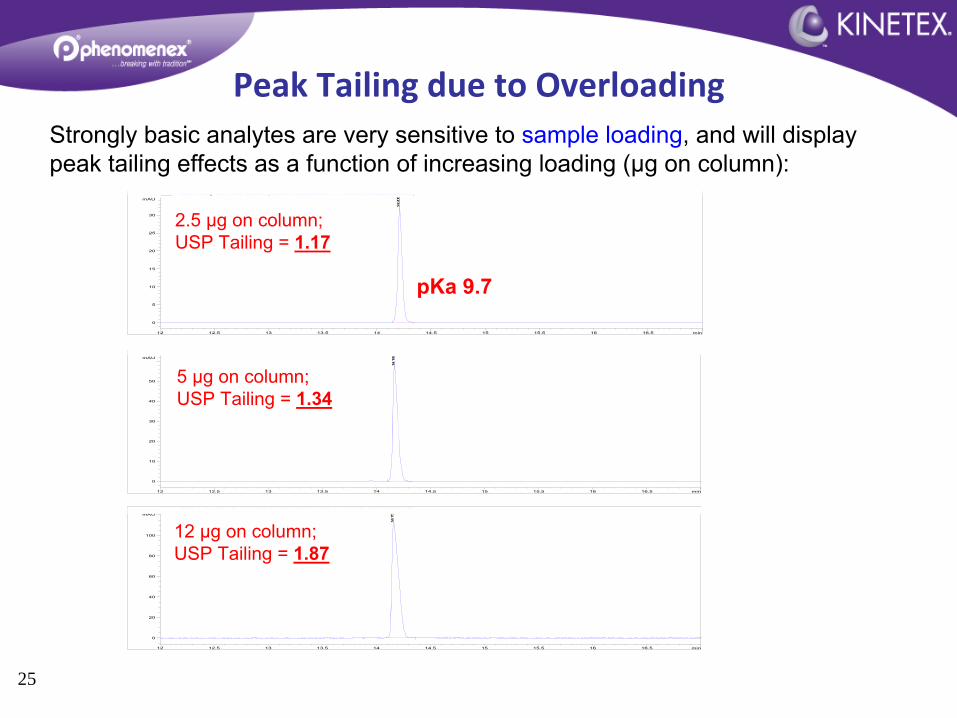
Strongly basic analytes are very sensitive to sample loading, and will display peak tailing effects as a function of increasing loading (µg on column):
min12 12.5 13 13.5 14 14.5 15 15.5 16 16.5
mAU
0
20
40
60
80
100
DAD1 C, Sig=254,4 Ref=300,100 (DJ040611\DJGSK 2011-04-06 12-28-48\GSK000010.D)
14.15
7
12 µg on column; USP Tailing = 1.87
min12 12.5 13 13.5 14 14.5 15 15.5 16 16.5
mAU
0
10
20
30
40
50
DAD1 C, Sig=254,4 Ref=300,100 (DJ040611\DJGSK 2011-04-06 12-28-48\GSK000008.D)
14.16
9
5 µg on column; USP Tailing = 1.34
min12 12.5 13 13.5 14 14.5 15 15.5 16 16.5
mAU
0
5
10
15
20
25
30
DAD1 C, Sig=254,4 Ref=300,100 (DJ040611\DJGSK 2011-04-06 12-28-48\GSK000006.D)
14.20
8
2.5 µg on column;USP Tailing = 1.17
pKa 9.7
Peak Tailing due to Overloading
26
min1.8 1.9 2 2.1 2.2 2.3 2.4 2.5 2.6 2.7
mAU
0
250
500
750
1000
1250
1500
1750
2000
2250
DAD1 A, Sig=240,10 Ref=off (MT042211\DJGSK 2011-04-22 09-12-57\MUPIROCIN000001.D)
5
1.905
2.145
2.495
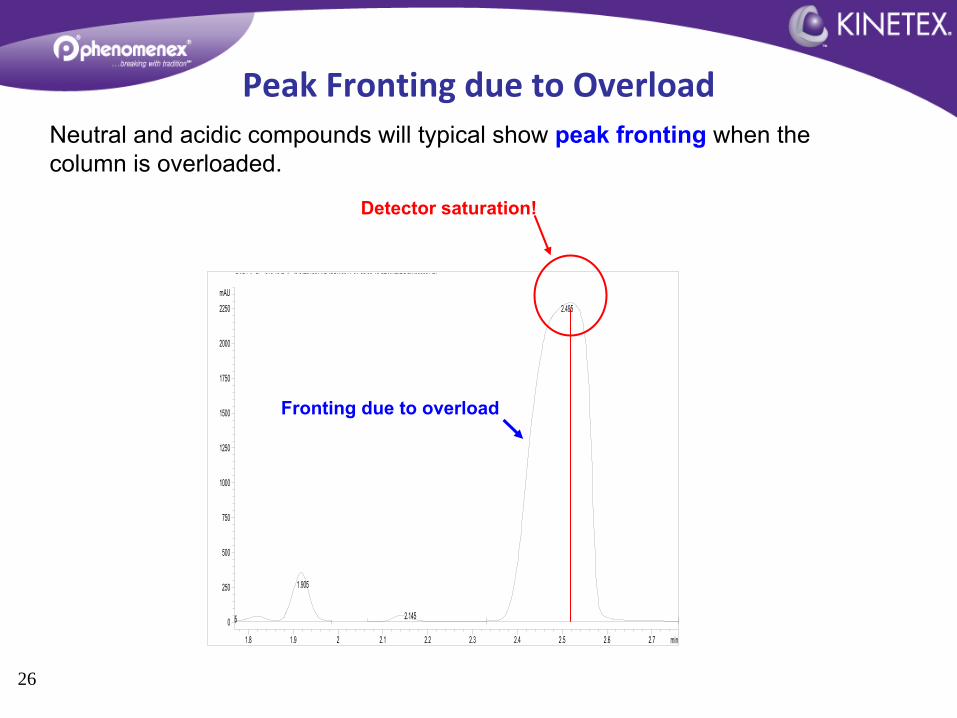
Fronting due to overload
Neutral and acidic compounds will typical show peak fronting
when the column is overloaded.
Detector saturation!
Peak Fronting due to Overload
27
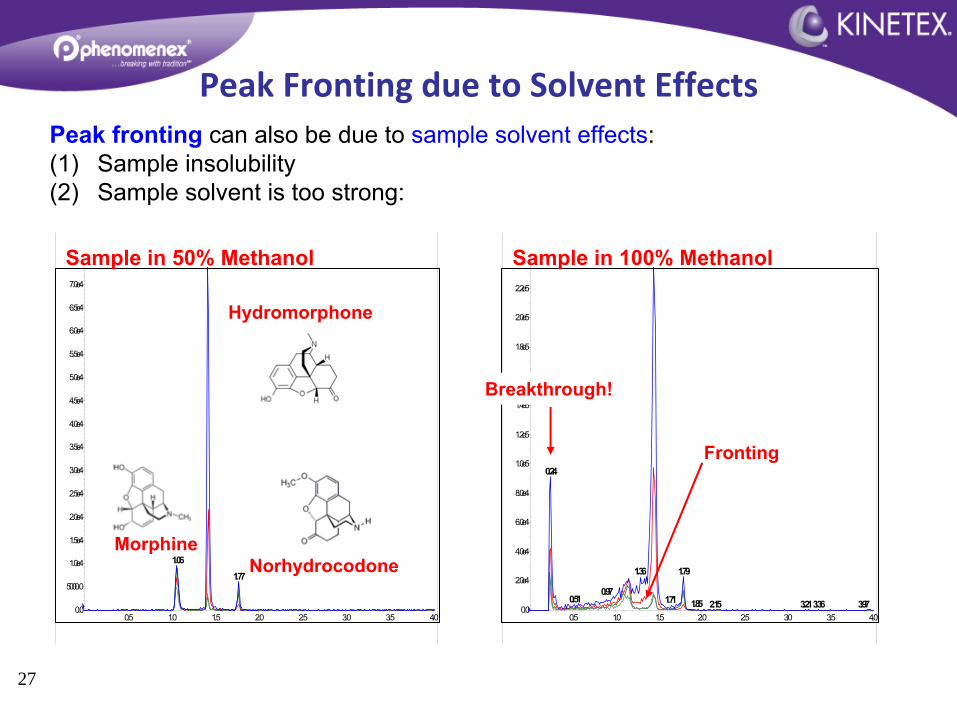
Peak fronting
can also be due to sample
solvent effects:(1)
Sample insolubility(2)
Sample solvent is too strong:
0.5 1.0 1.5 2.0 2.5 3.0 3.5 4.00.0
2.0e4
4.0e4
6.0e4
8.0e4
1.0e5
1.2e5
1.4e5
1.6e5
1.8e5
2.0e5
2.2e5
0.24
1.791.36
0.970.51 1.71 1.85 3.972.15 3.213.36
Sample in 100% Methanol
Breakthrough!
Fronting
0.5 1.0 1.5 2.0 2.5 3.0 3.5 4.00.0
5000.0
1.0e4
1.5e4
2.0e4
2.5e4
3.0e4
3.5e4
4.0e4
4.5e4
5.0e4
5.5e4
6.0e4
6.5e4
7.0e4
1.061.77
Sample in 50% Methanol
Morphine
Hydromorphone
Norhydrocodone
Peak Fronting due to Solvent Effects
28
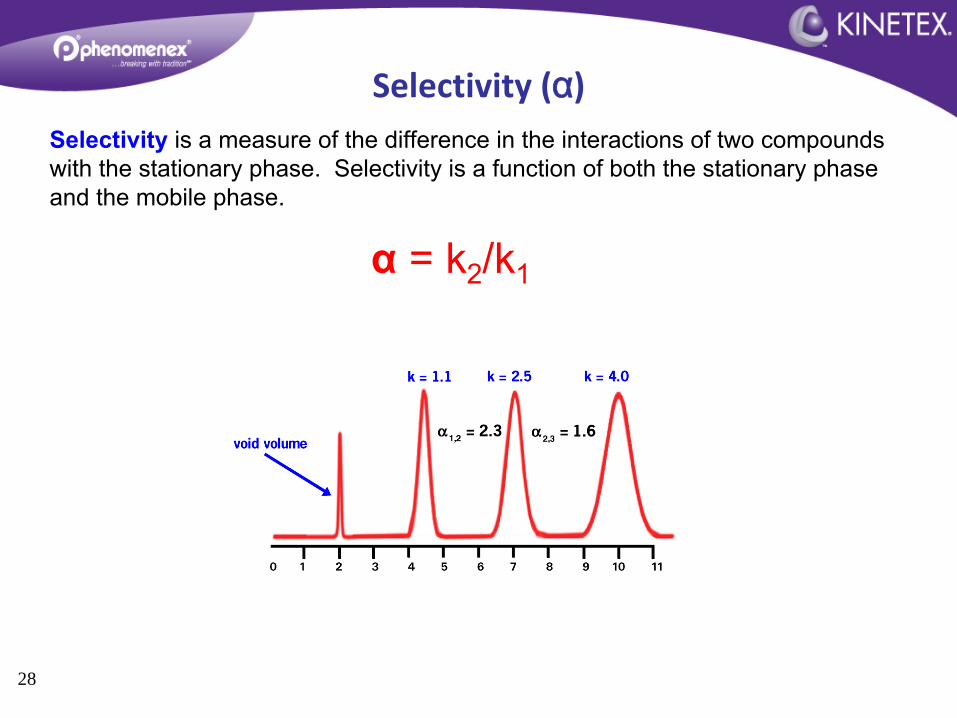
Selectivity
is a measure of the difference in the interactions of two compounds with the stationary phase. Selectivity is a function of both the stationary phase and the mobile phase.
α
= k2
/k1
Selectivity (α)

2929
The choice of stationary phase
will often have a dramatic effect on the selectivity of analytes.
OH
H H
OCH3
H
Estrone
OH
H H
OHCH3
H
Estradiol
m i n1 2 3 4 5
m A U
0
2 5
5 0
7 5
1 0 0
1 2 5
1 5 0
1 7 5 C18 Column 1+2
α
= 1.0
Phenyl Column 1
2
m i n1 2 3 4 5
m A U
0
2 0
4 0
6 0
8 0
1 0 0
α
= 2.3
Selectivity (α)
30
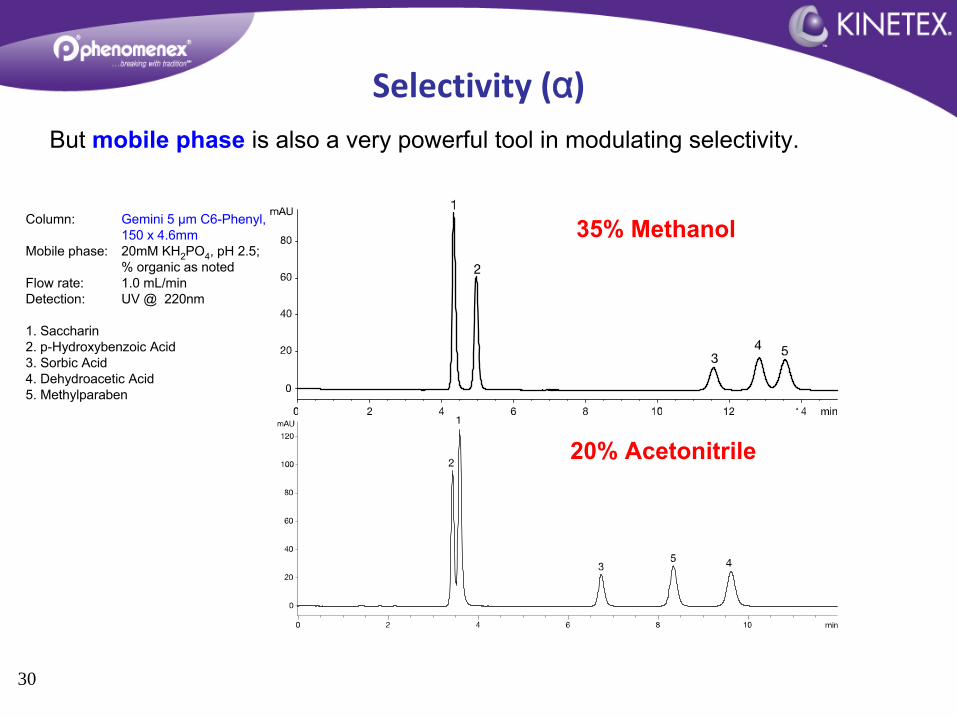
But mobile phase
is also a very powerful tool in modulating selectivity.
35% Methanol
20% Acetonitrile
Column:
Gemini 5 µm C6-Phenyl, 150 x 4.6mm
Mobile phase: 20mM KH2
PO4
, pH 2.5; % organic as noted
Flow rate:
1.0 mL/minDetection:
UV @ 220nm
1. Saccharin2. p-Hydroxybenzoic
Acid3. Sorbic
Acid4. Dehydroacetic
Acid5. Methylparaben
Selectivity (α)
3131
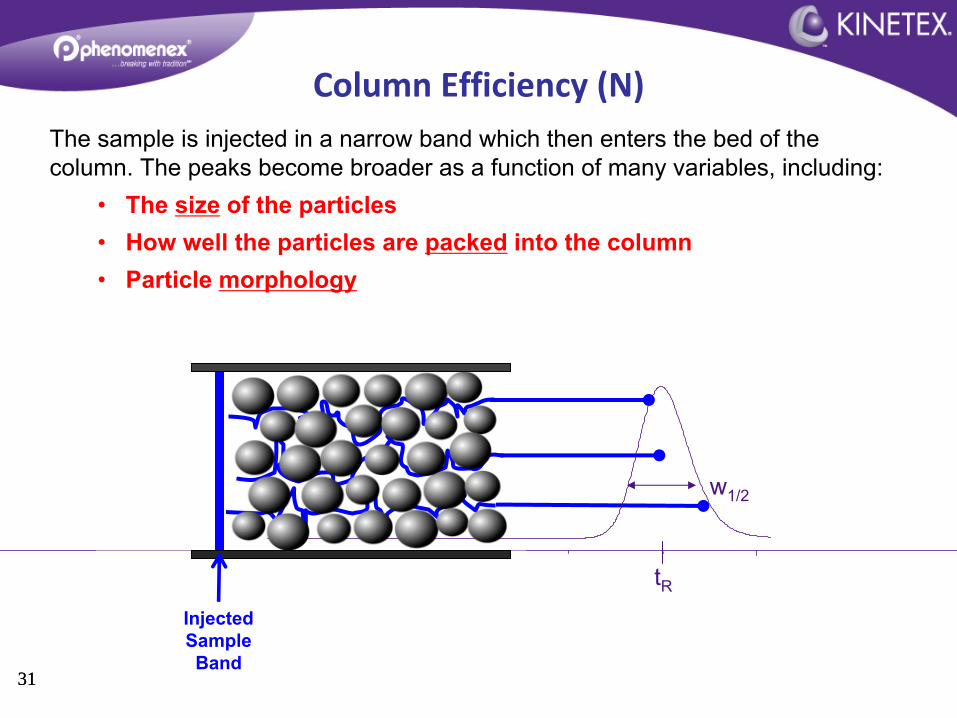
The sample is injected in a narrow band which then enters the bed of the column. The peaks become broader as a function of many variables, including:
• The size
of the particles• How well the particles are packed
into the column• Particle morphology
w1/2
tRInjected Sample Band
Column Efficiency (N)
32
W
W1/2
tR
Peak Width (W)
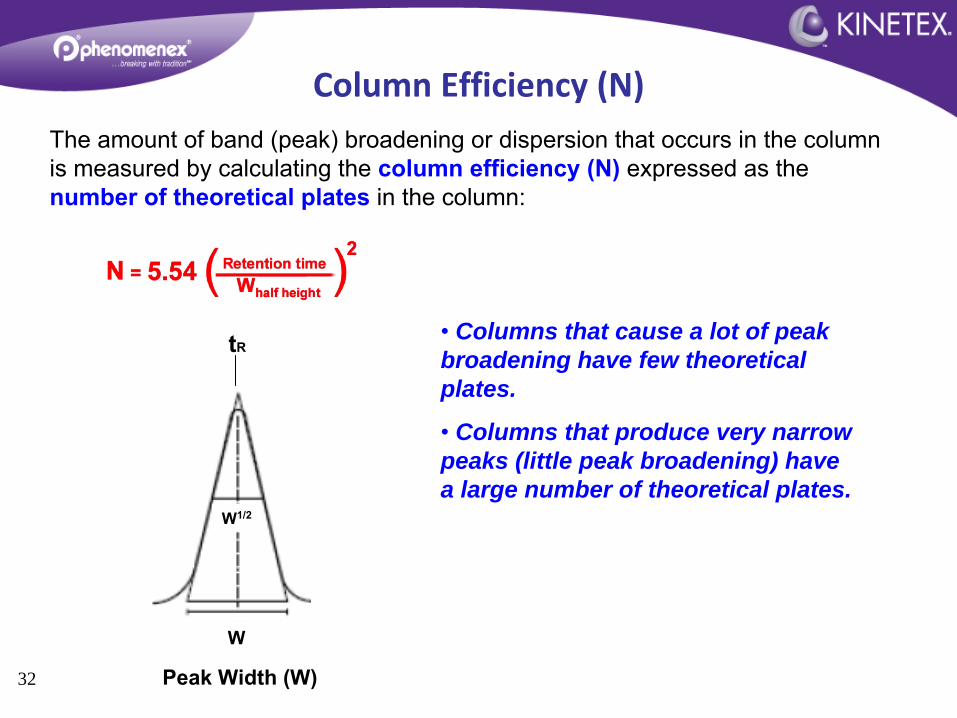
The amount of band (peak) broadening or dispersion that occurs in the column is measured by calculating the column efficiency (N)
expressed as the number of theoretical plates
in the column:
•
Columns that cause a lot of peak broadening have few theoretical plates.
•
Columns that produce very narrow peaks (little peak broadening) have a large number of theoretical plates.
Column Efficiency (N)
33
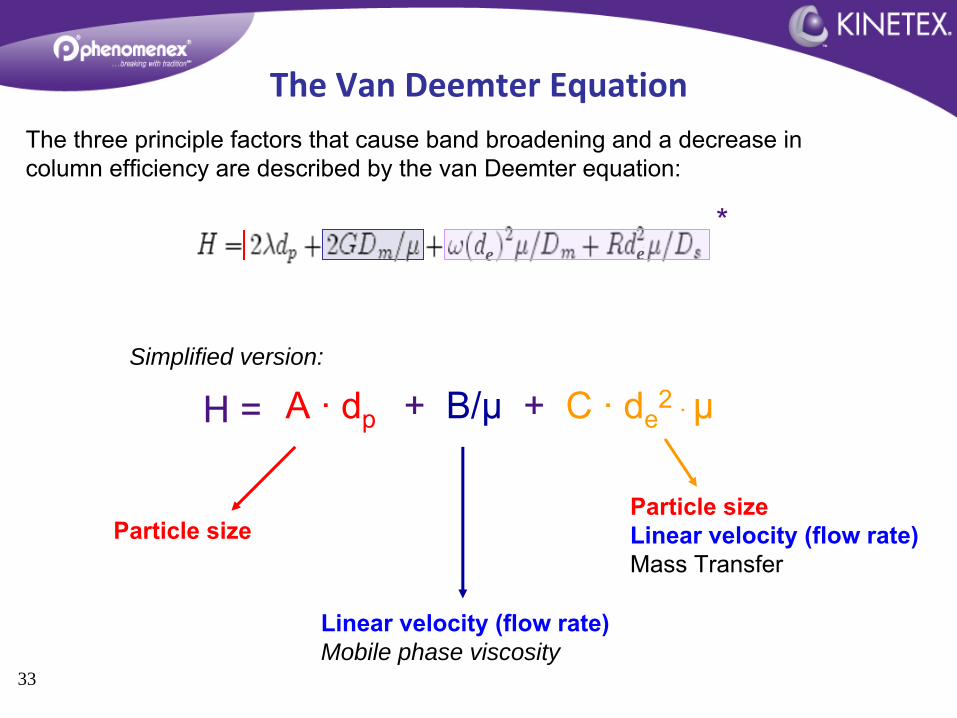
The three principle factors that cause band broadening and a decrease in column efficiency are described by the van Deemter equation:
e*
e
A ·
dp + B/µ
+ C ·
de2 ·
µH =Simplified version:
Particle size
Linear velocity (flow rate)Mobile phase viscosity
Particle sizeLinear velocity (flow rate)Mass Transfer
The Van Deemter Equation
34
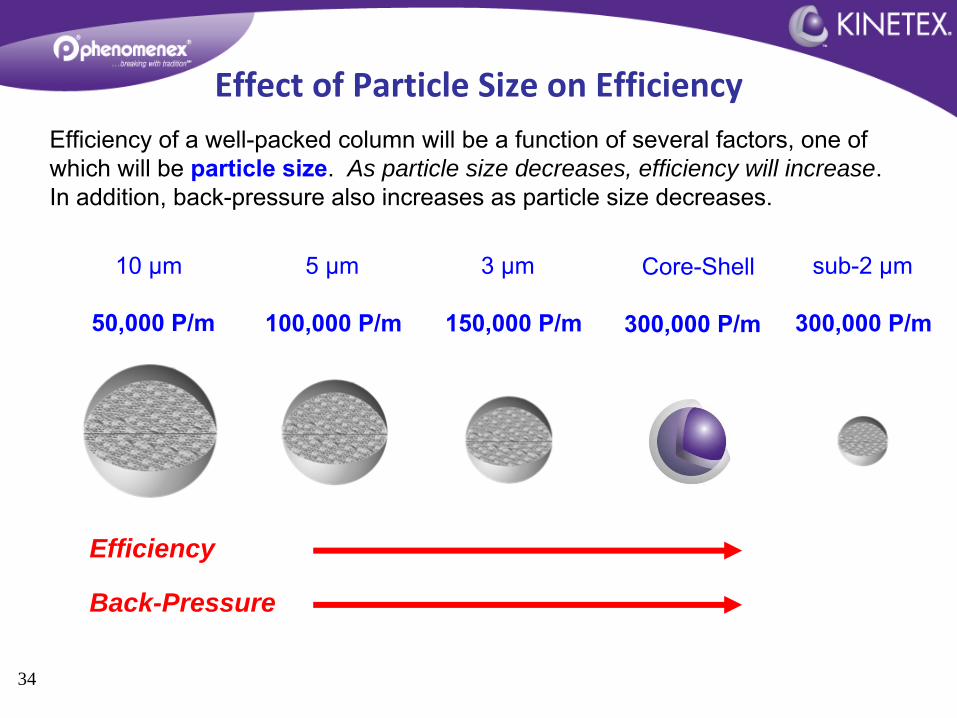
Efficiency of a well-packed column will be a function of several factors, one of which will be particle size. As particle size decreases, efficiency will increase. In addition, back-pressure also increases as particle size decreases.
10 µm
50,000 P/m
5 µm
100,000 P/m
3 µm
150,000 P/m
sub-2 µm
300,000 P/m
Efficiency
Back-Pressure
Core-Shell
300,000 P/m
Effect of Particle Size on Efficiency
35
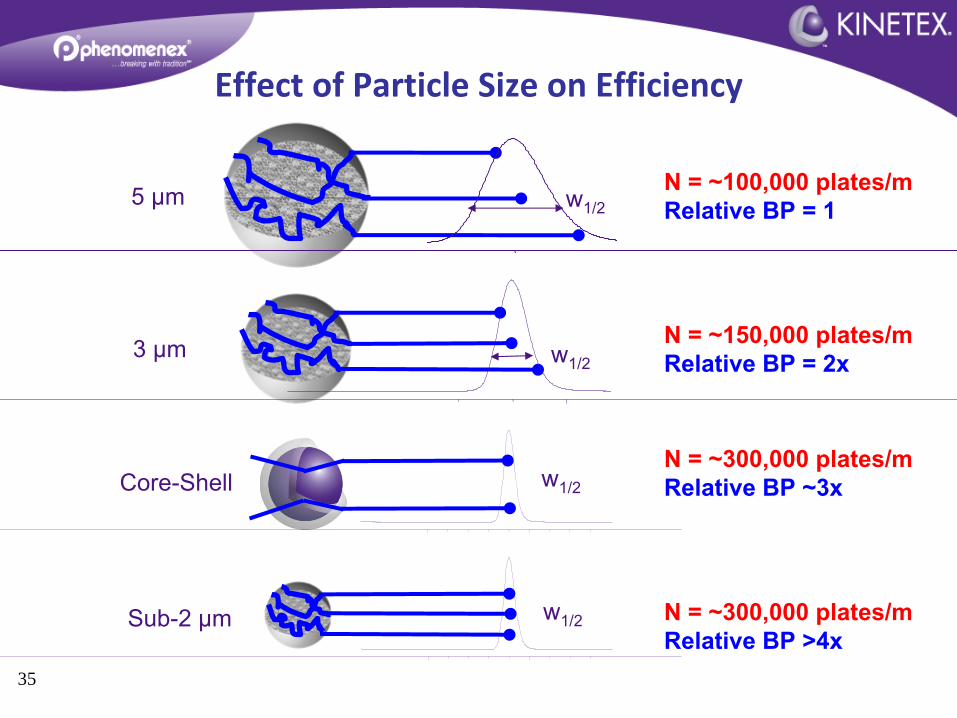
w1/2
w1/2
w1/2
5 µm
3 µm
Sub-2 µm
N = ~100,000 plates/mRelative BP = 1
N = ~150,000 plates/mRelative BP = 2x
N = ~300,000 plates/mRelative BP >4x
w1/2Core-ShellN = ~300,000 plates/mRelative BP ~3x
Effect of Particle Size on Efficiency

36
For a given particle size, column efficiency will be directly proportional to the length of the column. However, pressure
and elution time
will also be directly proportional to the column length.
25 cm 25,000 Plates40 min250 Bar
15 cm 15,000 Plates24 min150 Bar
10 cm 10,000 Plates16 min100 Bar
5 cm 5,000 Plates8 min50 Bar
Effect of Column Length on Efficiency
37
Column Length (mm)
Efficiency dp 5m
250 25,000
150 15,000
100 10,000
50 5,000
Balancing Column Length and Particle Size
Column Length (mm)
Efficiency dp 5m
Efficiency dp 3m
250 25,000 37,500
150 15,000 22,500
100 10,000 15,000
50 5,000 7,500
Column Length (mm)
Efficiency dp 5m
Efficiency dp 3m
Efficiency sub-2m / Core-shell
250 25,000 37,500
150 15,000 22,500 45,000
100 10,000 15,000 30,000
50 5,000 7,500 15,000
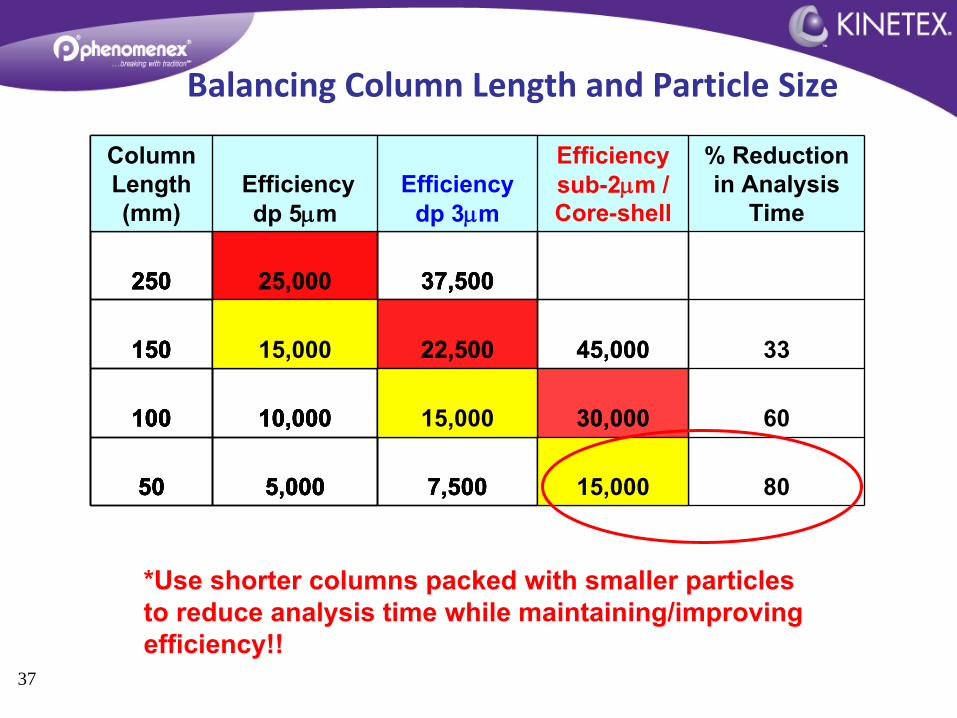
Column Length (mm)
Efficiency dp 5m
Efficiency dp 3m
Efficiency sub-2m / Core-shell
% Reduction in Analysis
Time
250 25,000 37,500
150 15,000 22,500 45,000 33
100 10,000 15,000 30,000 60
50 5,000 7,500 15,000 80
*Use shorter columns packed with smaller particles to reduce analysis time while maintaining/improving efficiency!!
38
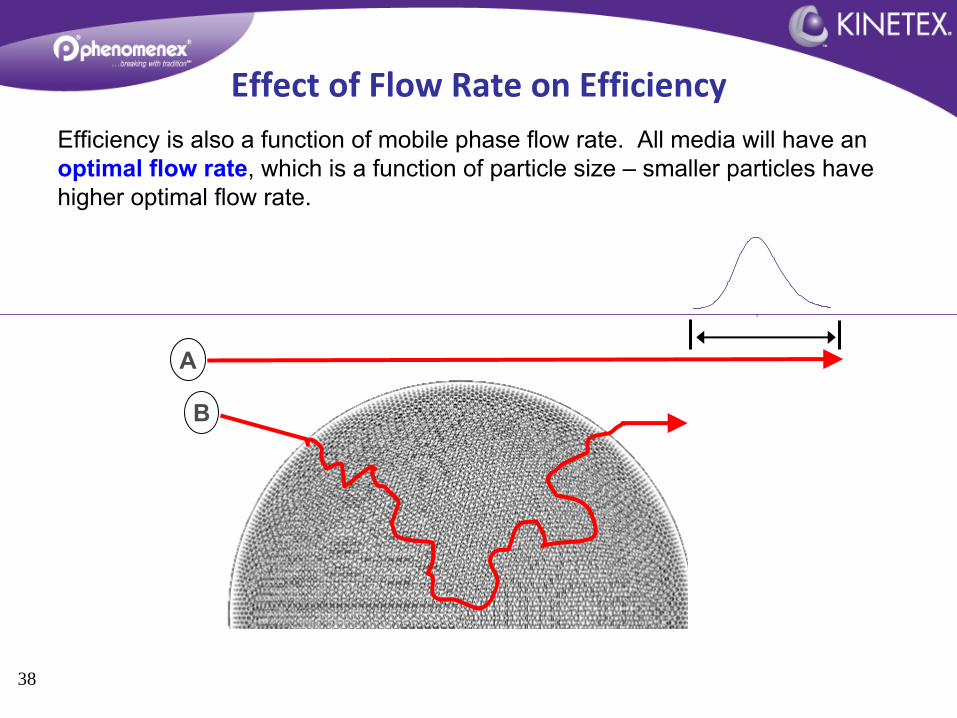
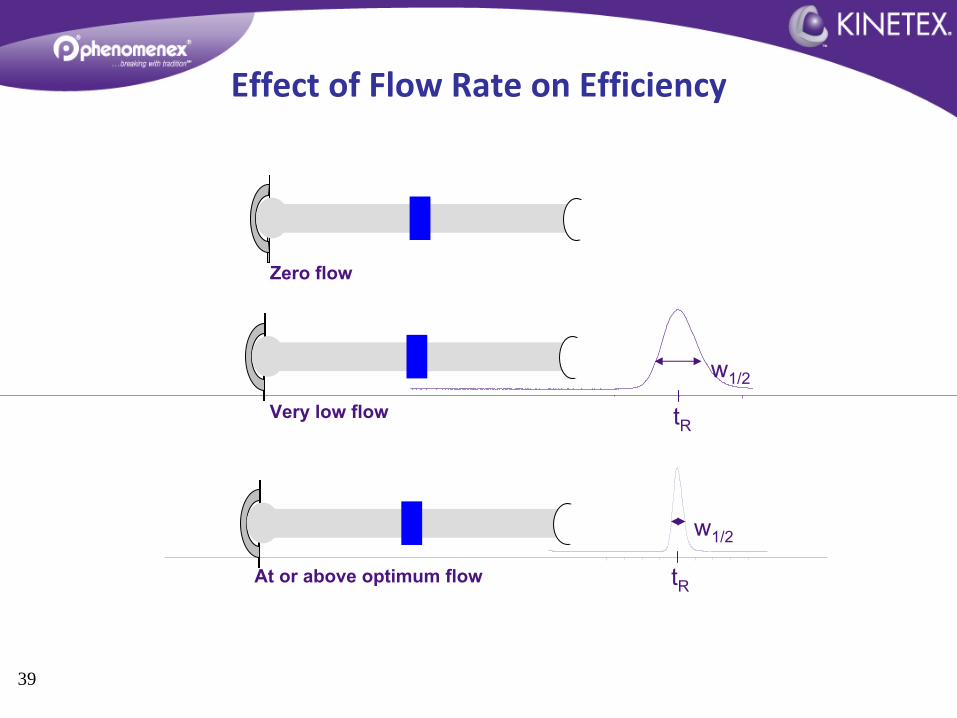
Efficiency is also a function of mobile phase flow rate. All media will have an optimal flow rate, which is a function of particle size –
smaller particles have higher optimal flow rate.
A
B
Effect of Flow Rate on Efficiency
39
w1/2
tR
w1/2
tR
Very low flow
At or above optimum flow
Zero flow
Effect of Flow Rate on Efficiency
40
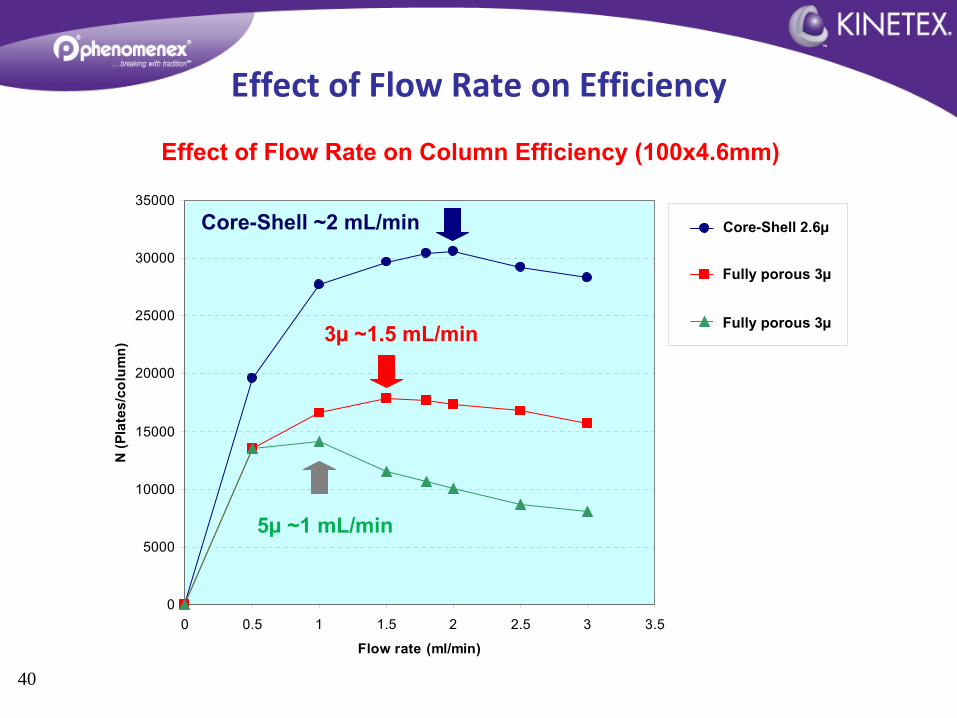
Effect of Flow Rate on Column Efficiency (100x4.6mm)
0
5000
10000
15000
20000
25000
30000
35000
0 0.5 1 1.5 2 2.5 3 3.5
Flow rate (ml/min)
N (P
late
s/co
lum
n)
Core-Shell 2.6
Luna 3u
Luna 5u
5µ
~1 mL/min
3µ
~1.5 mL/min
Core-Shell ~2 mL/min
Effect of Flow Rate on Efficiency
Core-Shell 2.6µ
Fully porous 3µ
Fully porous 3µ
41
The chromatographic measurements that we have discussed so far will all play a significant role in method development.
1. Capacity factor (k’)
–
retention of analyte relative to void t0
•
Controlled by modulating %strong mobile phase
2. Peak asymmetry
–
peak shape (fronting, tailing, symmetrical)•
Result of secondary interactions (e.g. Ionic in RP mode)•
Sensitive to sample loading & sample solvent effects
3. Selectivity (α)
–
difference in the k’
of two analytes•
Will be determined by mobile phase composition and nature of stationary phase
4. Efficiency (N)
–
function of peak width and retention•
Determined by particle size, column length, flow rate•
Column packing will affect efficiency (vendor)
Review
42
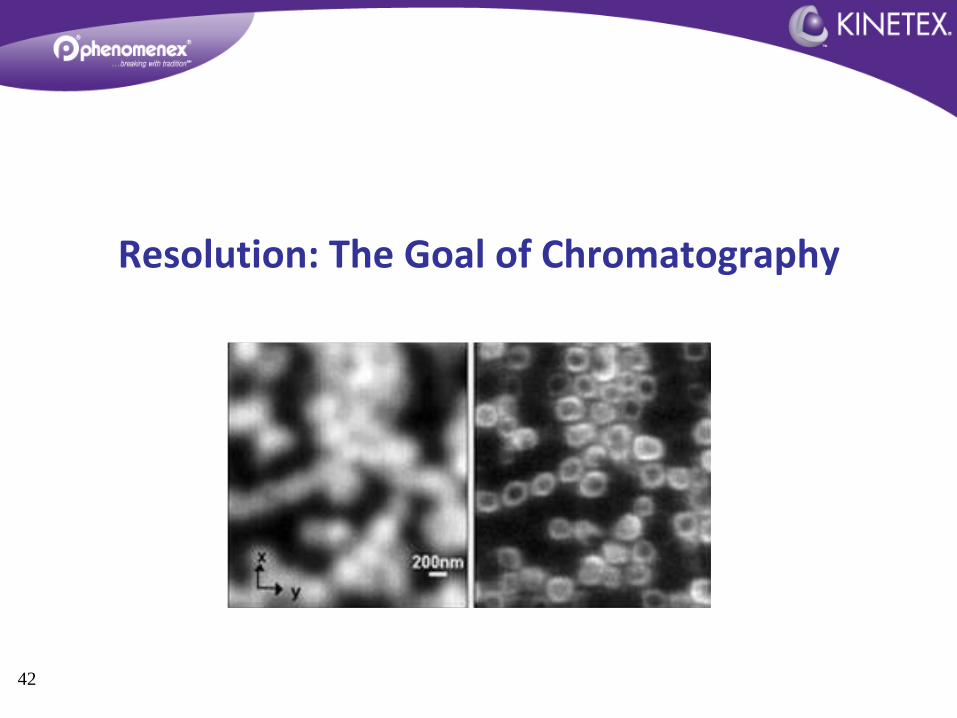
Resolution: The Goal of Chromatography
43
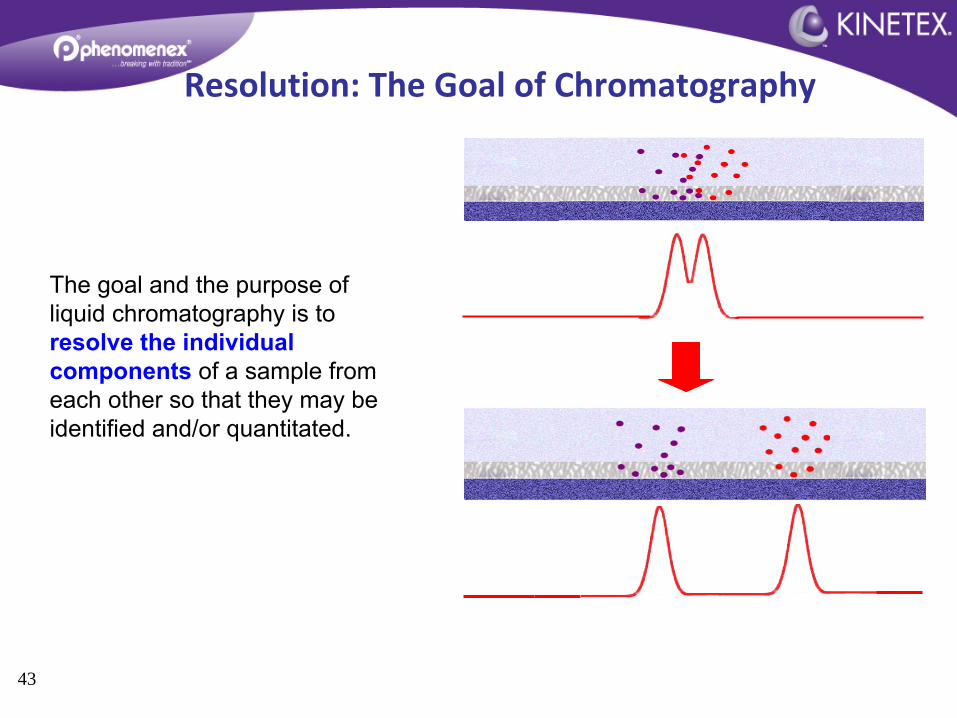
The goal and the purpose of liquid chromatography is to resolve the individual components
of a sample from each other so that they may be identified and/or quantitated.
Resolution: The Goal of Chromatography
44
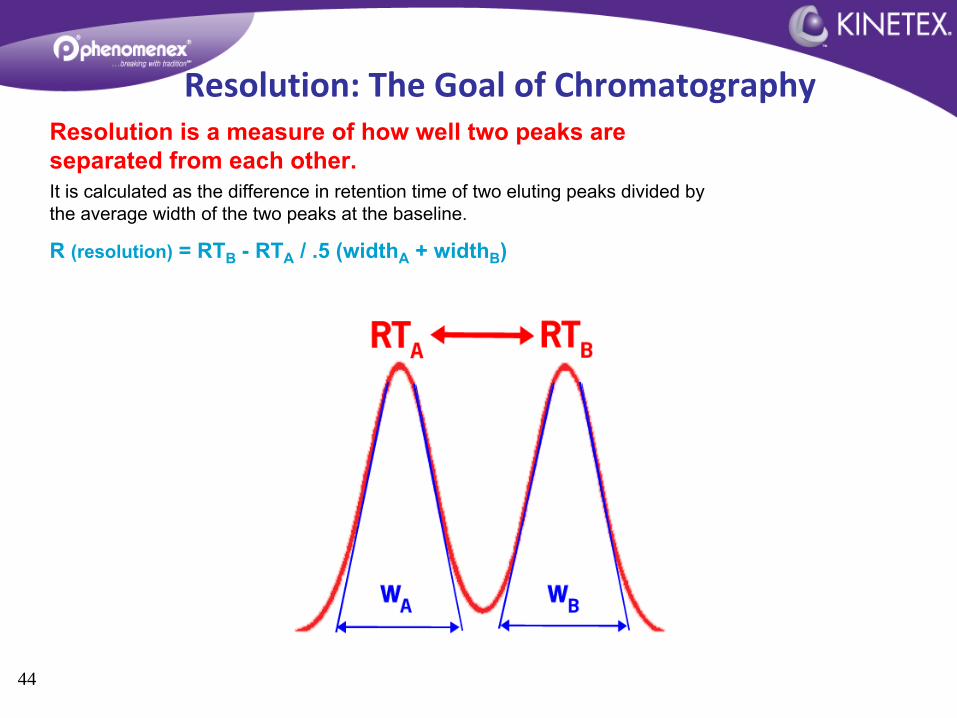
Resolution is a measure of how well two peaks are separated from each other.It is calculated as the difference in retention time of two eluting peaks divided by the average width of the two peaks at the baseline.
R (resolution)
= RTB
- RTA
/ .5 (widthA
+ widthB
)
Resolution: The Goal of Chromatography
45
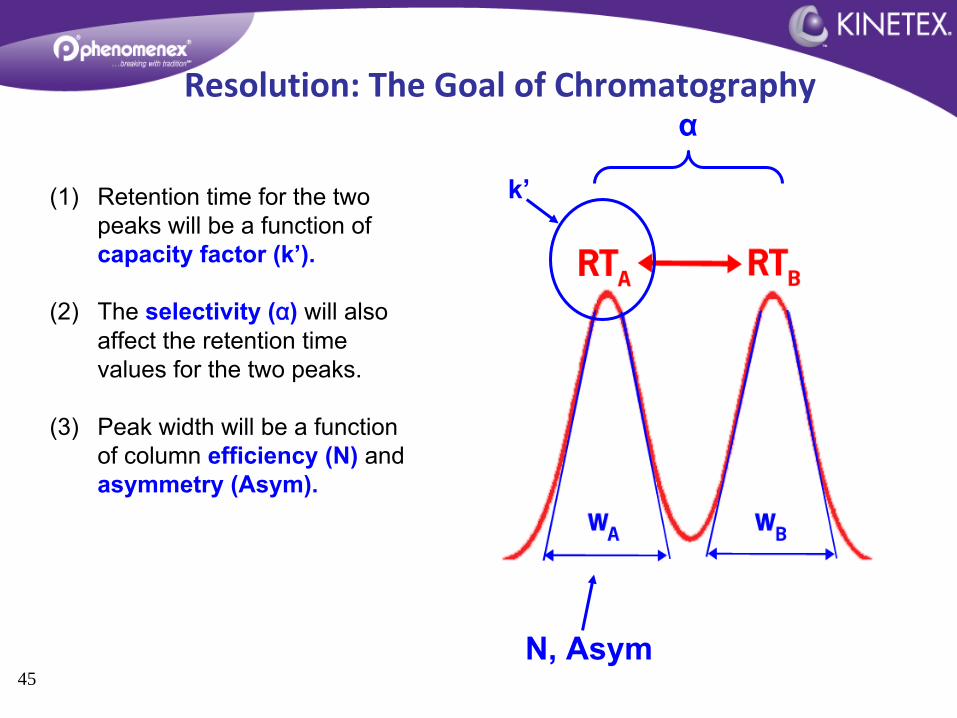
(1)
Retention time for the two peaks will be a function of capacity factor (k’).
(2)
The selectivity (α)
will also affect the retention time values for the two peaks.
(3)
Peak width will be a function of column efficiency (N)
and asymmetry (Asym).
k’
α
N, Asym
Resolution: The Goal of Chromatography
46
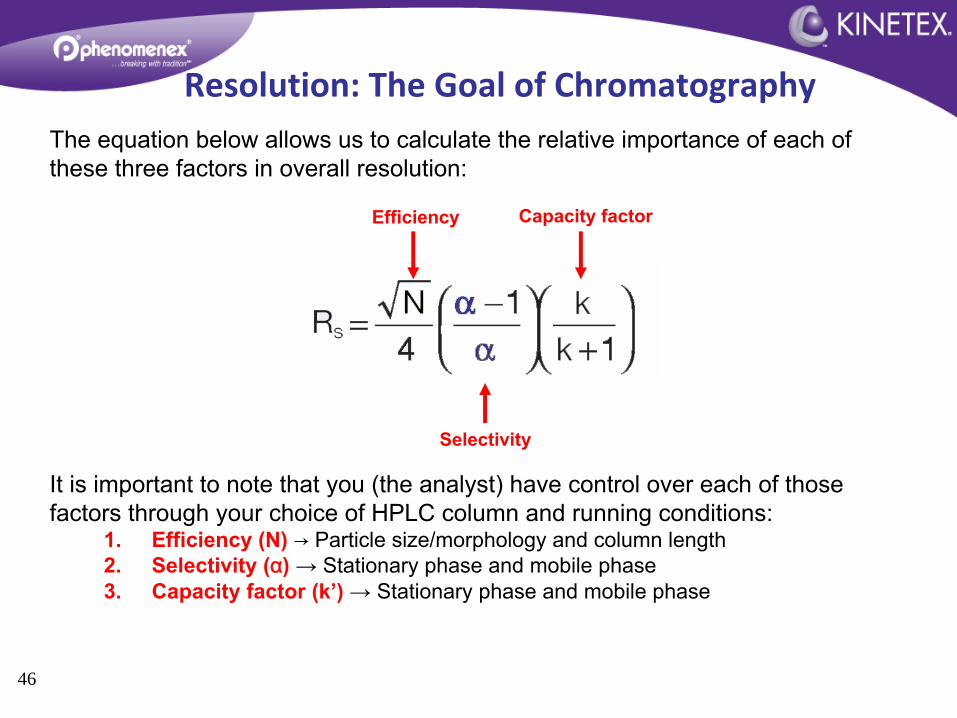
Selectivity
Capacity factorEfficiency
The equation below allows us to calculate the relative importance of each of these three factors in overall resolution:
It is important to note that you (the analyst) have control over
each of those factors through your choice of HPLC column and running conditions:
1.
Efficiency (N)
→
Particle size/morphology and column length2.
Selectivity (α)
→ Stationary phase and mobile phase3.
Capacity factor (k’)
→ Stationary phase and mobile phase
Resolution: The Goal of Chromatography
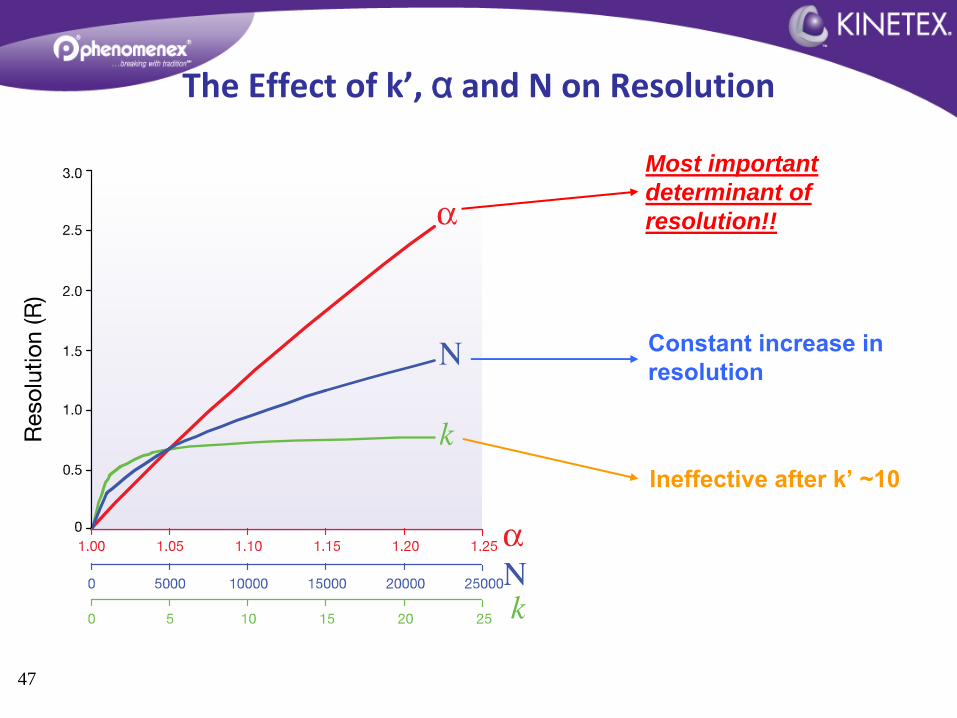
47
Ineffective after k’
~10
Constant increase in resolution
Most important determinant of resolution!!
The Effect of k’, α
and N on Resolution
48
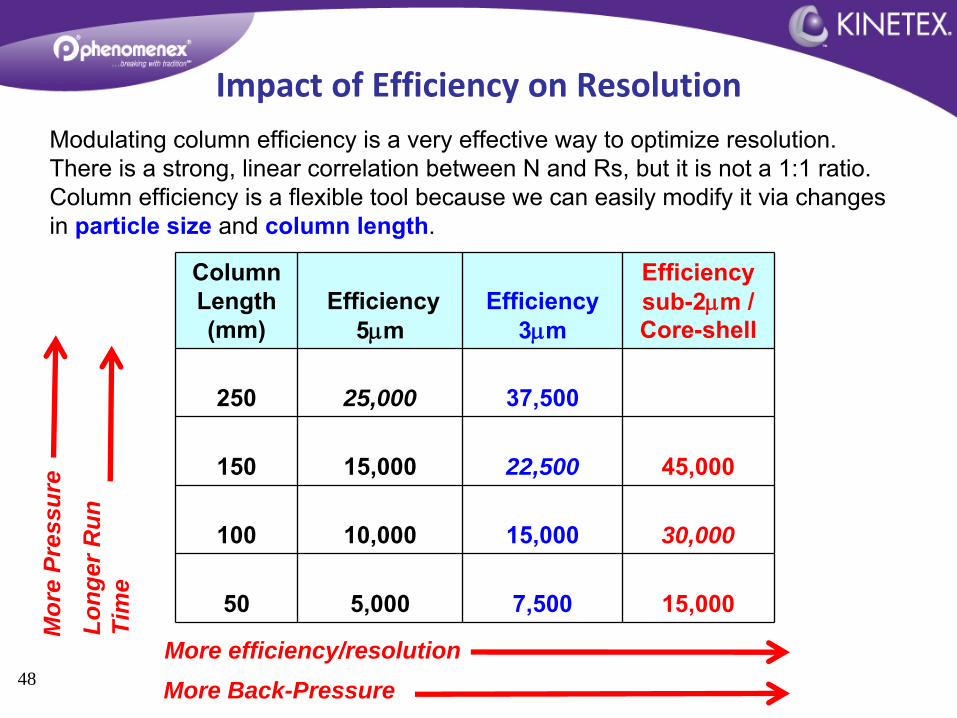
Modulating column efficiency is a very effective way to optimize
resolution. There is a strong, linear correlation between N and Rs, but it is not a 1:1 ratio. Column efficiency is a flexible tool because we can easily modify it via changes in particle size
and column length.
Column Length (mm)
Efficiency 5m
Efficiency 3m
Efficiency sub-2m / Core-shell
250 25,000 37,500
150 15,000 22,500 45,000
100 10,000 15,000 30,000
50 5,000 7,500 15,000
More efficiency/resolution
Long
er R
unTi
me
More Back-Pressure
Mor
e Pr
essu
reImpact of Efficiency on Resolution
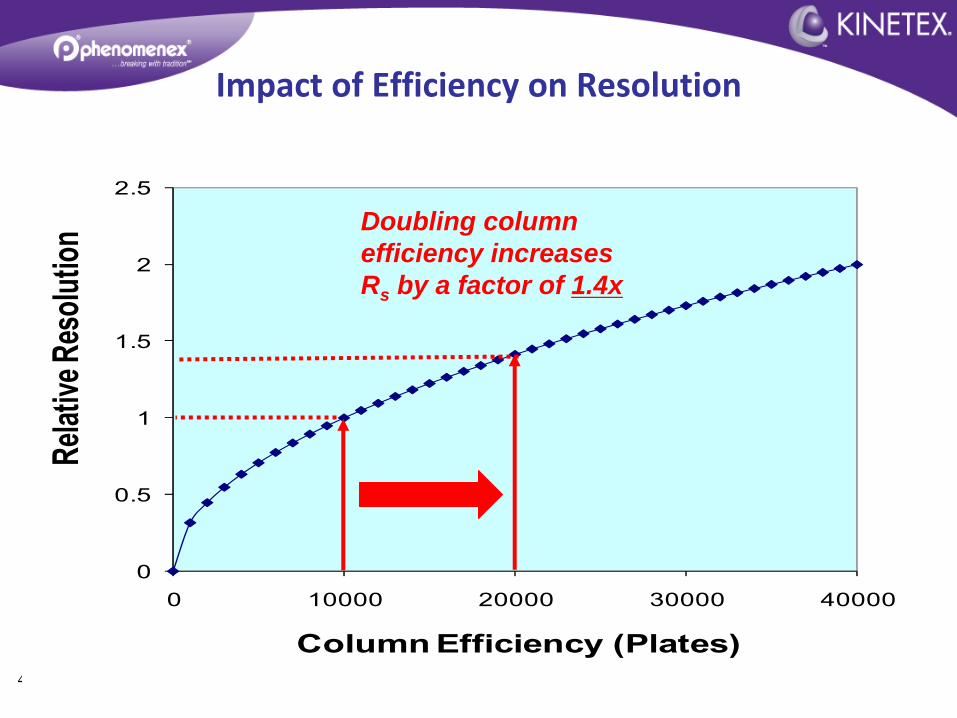
49
0
0.5
1
1.5
2
2.5
0 10000 20000 30000 40000
Relat
ive Re
solut
ion
Column Efficiency (Plates)
Doubling column efficiency increases Rs by a factor of 1.4x
Impact of Efficiency on Resolution

50
1.
For method development, start with an intermediate column length, packed with the smallest particle size that system pressure limitations will allow.•
Conventional HPLC 3 µm 150x4.6mm or core-shell 100x4.6mm•
UPLC sub-2 µm or core-shell particle•
Work at optimal flow rate for that particle size
2.
Fine-tune
for maximum productivity:•
Excessive resolution shorter column, increase flow rate•
Insufficient resolution longer column; modify flow rate to compensate for pressure
Optimizing Efficiency for Maximum Resolution
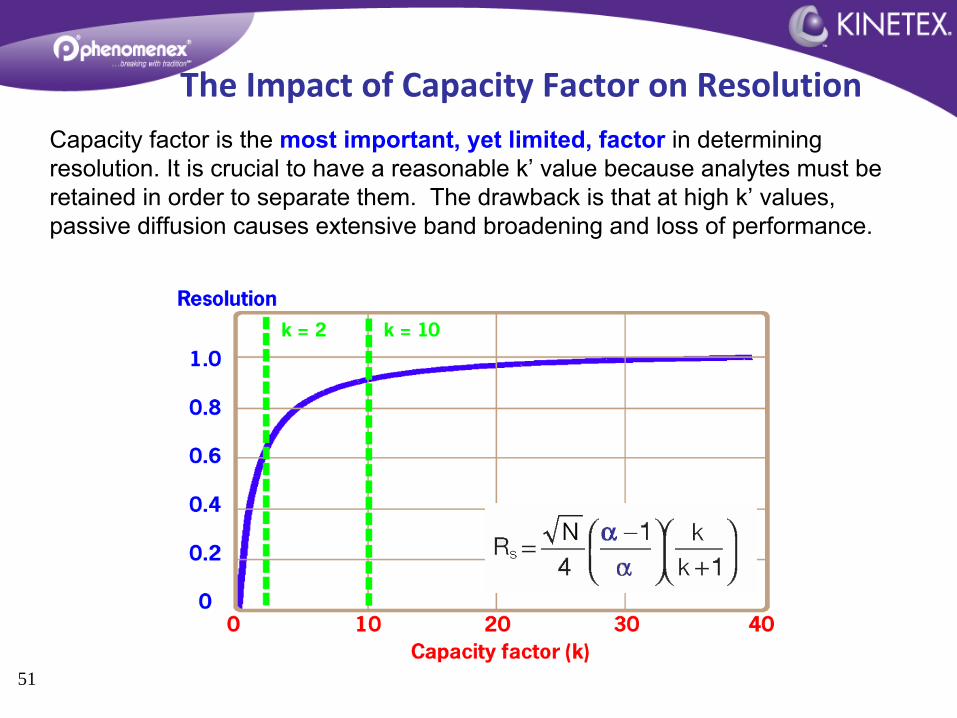
51
Capacity factor is the most important, yet limited, factor
in determining resolution. It is crucial to have a reasonable k’
value because analytes must be retained in order to separate them. The drawback is that at high k’
values, passive diffusion causes extensive band broadening and loss of performance.
The Impact of Capacity Factor on Resolution
52
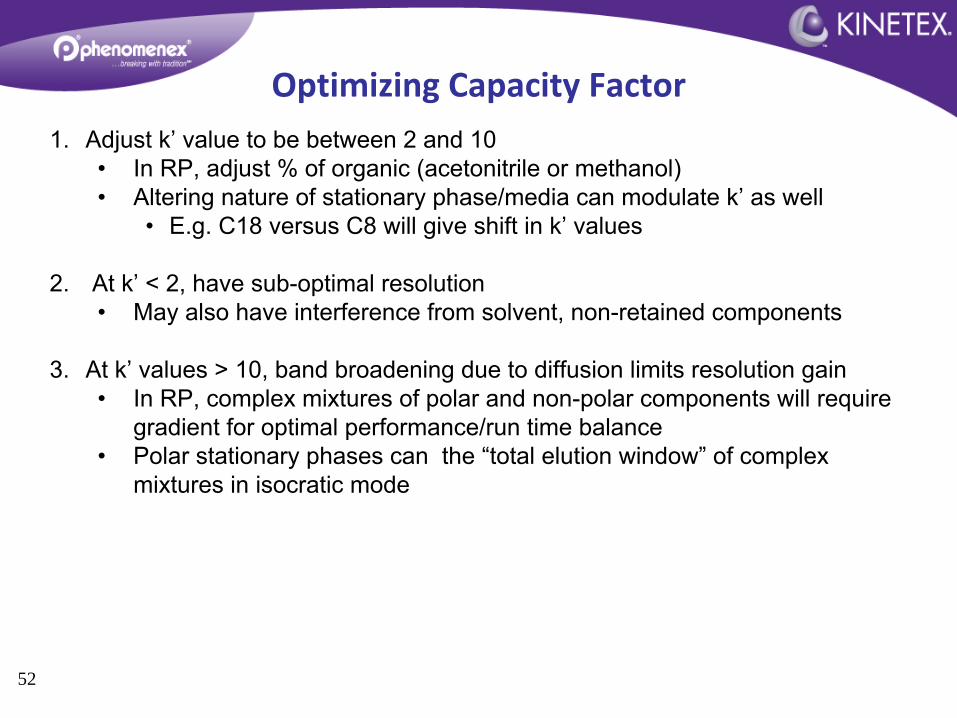
1.
Adjust k’
value to be between 2 and 10•
In RP, adjust % of organic (acetonitrile or methanol)•
Altering nature of stationary phase/media can modulate k’
as well•
E.g. C18 versus C8 will give shift in k’
values
2.
At k’
< 2, have sub-optimal resolution•
May also have interference from solvent, non-retained components
3.
At k’
values > 10, band broadening due to diffusion limits resolution
gain•
In RP, complex mixtures of polar and non-polar components will require gradient for optimal performance/run time balance
•
Polar stationary phases can the “total elution window”
of complex mixtures in isocratic mode
Optimizing Capacity Factor
53
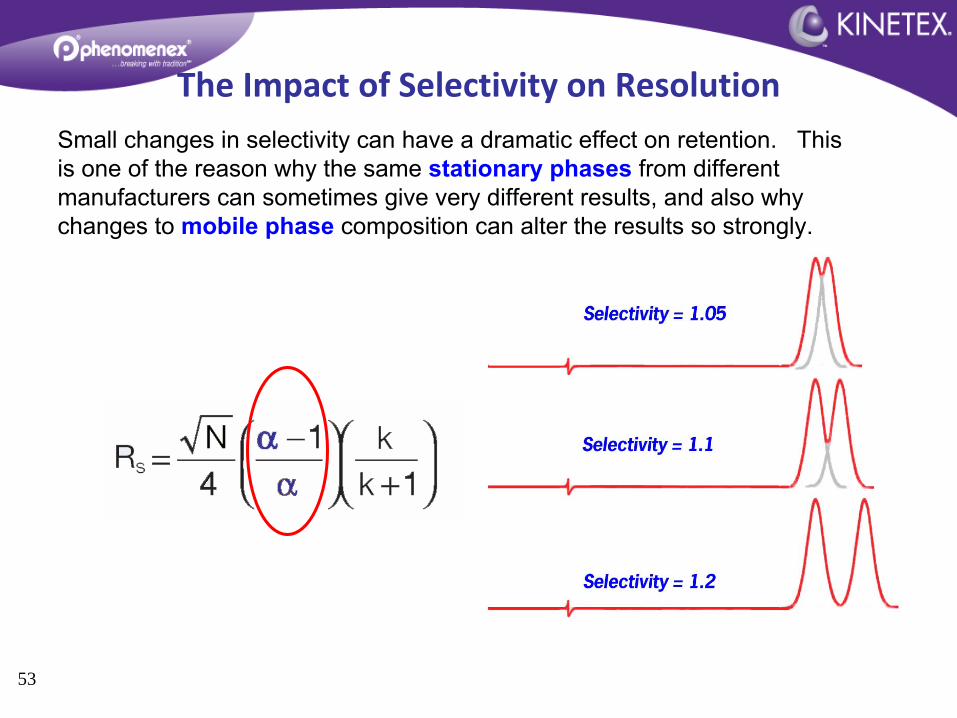
Small changes in selectivity can have a dramatic effect on retention. This is one of the reason why the same stationary phases
from different manufacturers can sometimes give very different results, and also why changes to mobile phase
composition can alter the results so strongly.
The Impact of Selectivity on Resolution

54
Method Development Exercise 1: Optimization to Reduce Analysis Time and
Increase Productivity
55
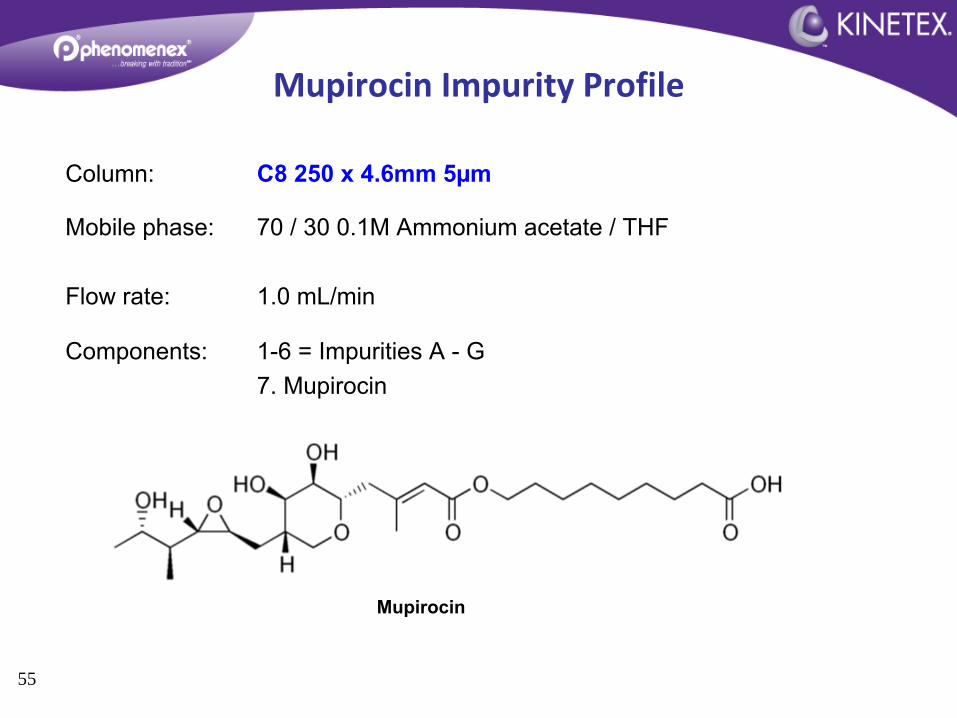
Column: C8 250 x 4.6mm 5µm
Mobile phase:
70 / 30 0.1M Ammonium acetate / THF
Flow rate:
1.0 mL/min
Components:
1-6 = Impurities A -
G7. Mupirocin
Mupirocin
Mupirocin Impurity Profile
min0 2 4 6 8 10 12 14 16
mAU
0
25
50
75
100
125
150
175
DAD1 A, Sig=240,10 Ref=off (Z:\1\DATA\MT050211\DJGSK 2011-05-02 15-34-44\MUPIROCIN000001.D)
1
2 3
5
6
7
~16min
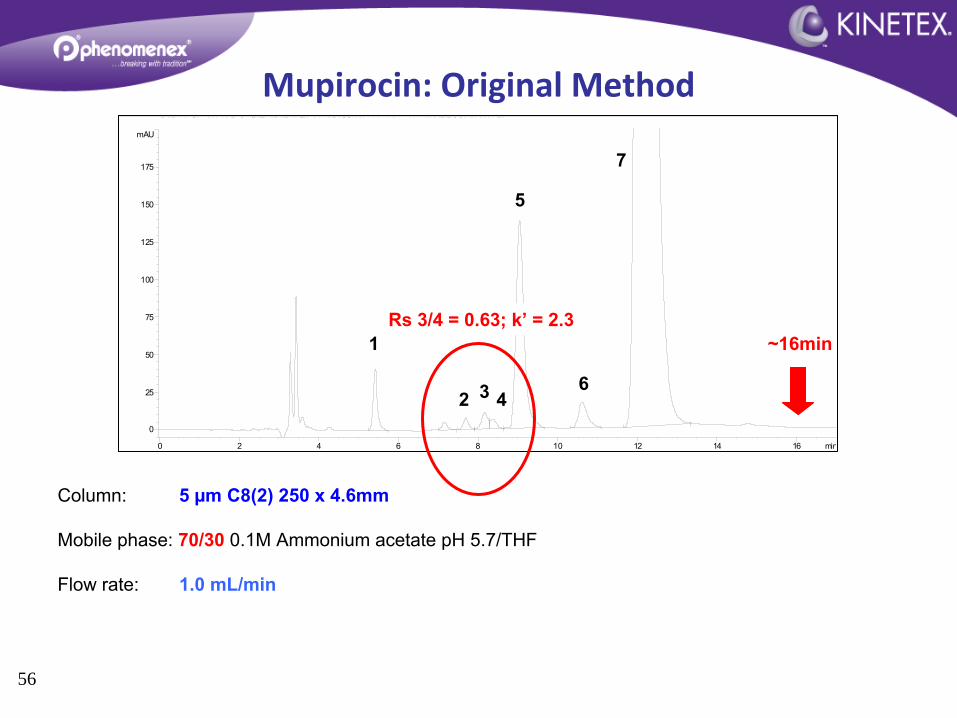
Column:
5 µm
C8(2) 250 x 4.6mm
Mobile phase: 70/30
0.1M Ammonium acetate pH 5.7/THF
Flow rate:
1.0 mL/min
4
Rs 3/4 = 0.63; k’
= 2.3
56
Mupirocin: Original Method
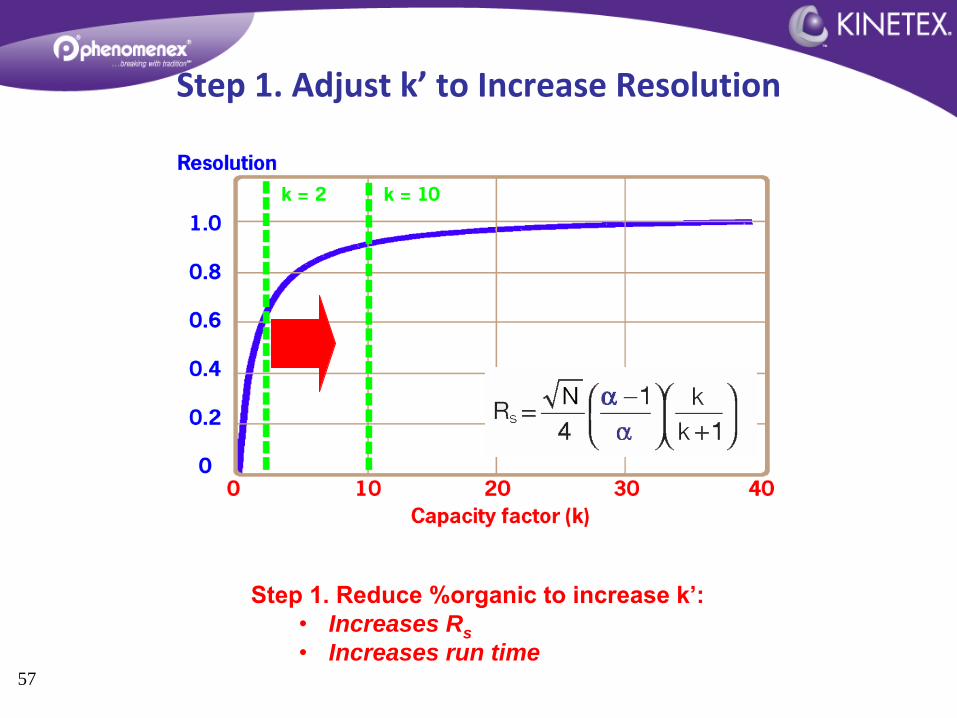
57
Step 1. Reduce %organic to increase k’:•
Increases Rs•
Increases run time
Step 1. Adjust k’
to Increase Resolution
58
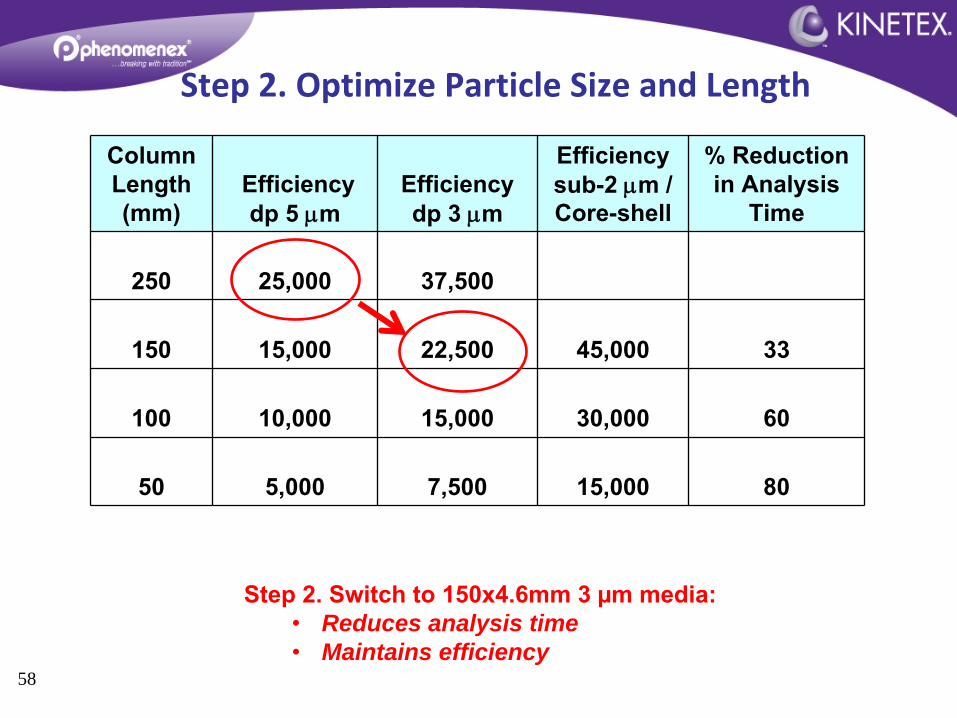
Column Length (mm)
Efficiency dp 5 m
Efficiency dp 3 m
Efficiency sub-2 m / Core-shell
% Reduction in Analysis
Time
250 25,000 37,500
150 15,000 22,500 45,000 33
100 10,000 15,000 30,000 60
50 5,000 7,500 15,000 80
Step 2. Switch to 150x4.6mm 3 µm media:•
Reduces analysis time•
Maintains efficiency
Step 2. Optimize Particle Size and Length
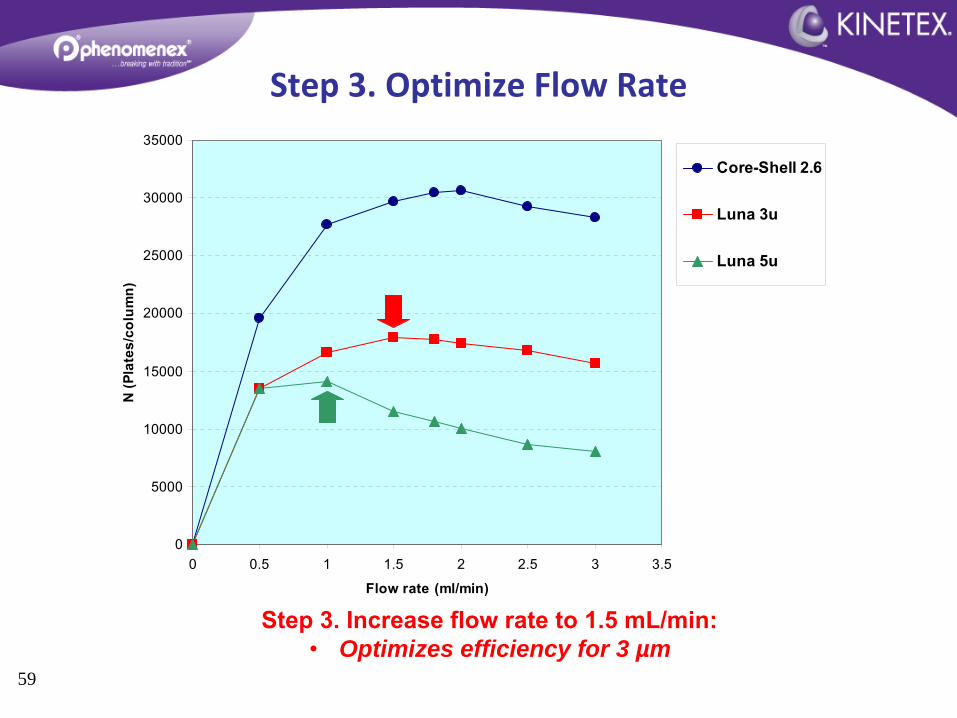
0
5000
10000
15000
20000
25000
30000
35000
0 0.5 1 1.5 2 2.5 3 3.5
Flow rate (ml/min)
N (P
late
s/co
lum
n)
Core-Shell 2.6
Luna 3u
Luna 5u
59
Step 3. Increase flow rate to 1.5 mL/min:•
Optimizes efficiency for 3 µm
Step 3. Optimize Flow Rate
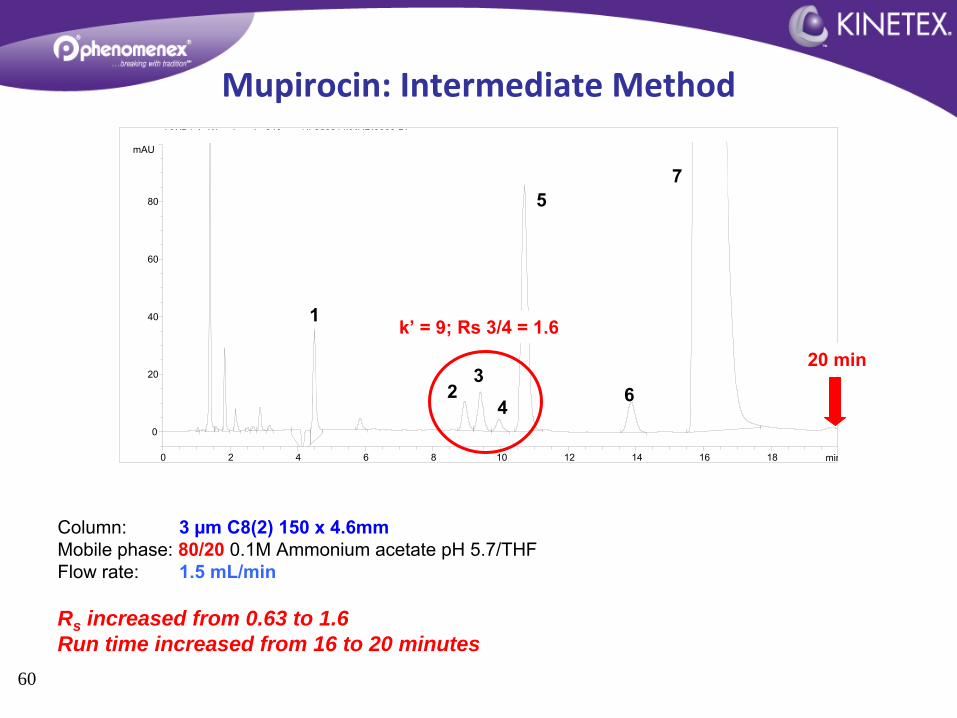
min0 2 4 6 8 10 12 14 16 18
mAU
0
20
40
60
80
VWD1 A, Wavelength=240 nm (JL050211\MUPI0003.D)
1
23
4
5
6
7
Column:
3 µm
C8(2) 150 x 4.6mmMobile phase: 80/20
0.1M Ammonium acetate pH 5.7/THFFlow rate:
1.5 mL/min
Rs increased from 0.63 to 1.6Run time increased from 16 to 20 minutes
20 min
k’
= 9; Rs 3/4 = 1.6
60
Mupirocin: Intermediate Method
61
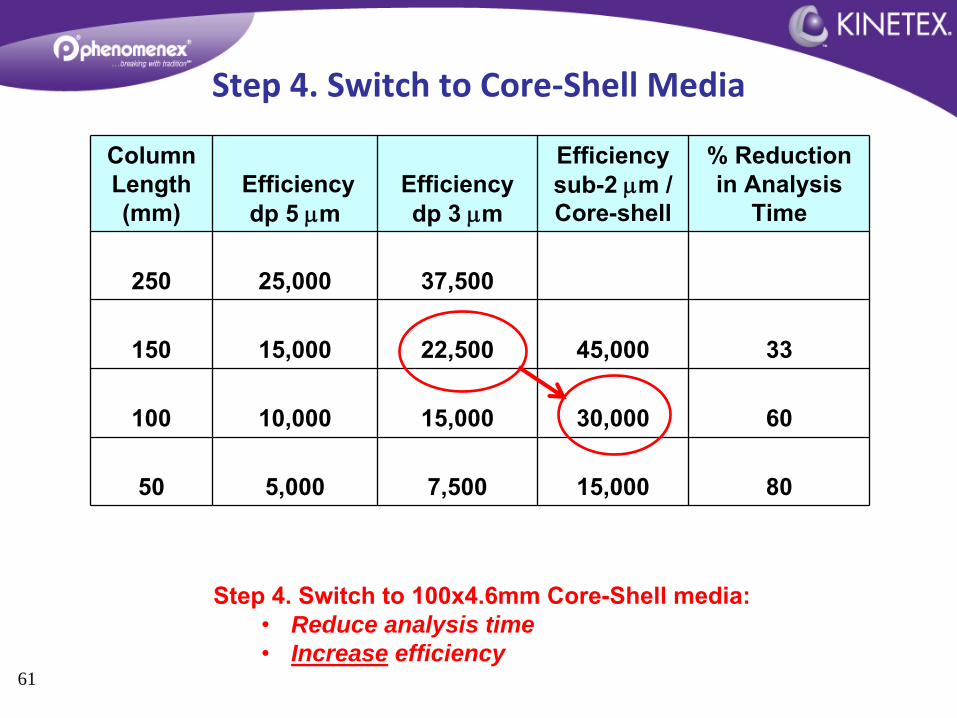
Column Length (mm)
Efficiency dp 5 m
Efficiency dp 3 m
Efficiency sub-2 m / Core-shell
% Reduction in Analysis
Time
250 25,000 37,500
150 15,000 22,500 45,000 33
100 10,000 15,000 30,000 60
50 5,000 7,500 15,000 80
Step 4. Switch to 100x4.6mm Core-Shell media:•
Reduce analysis time•
Increase efficiency
Step 4. Switch to Core‐Shell Media
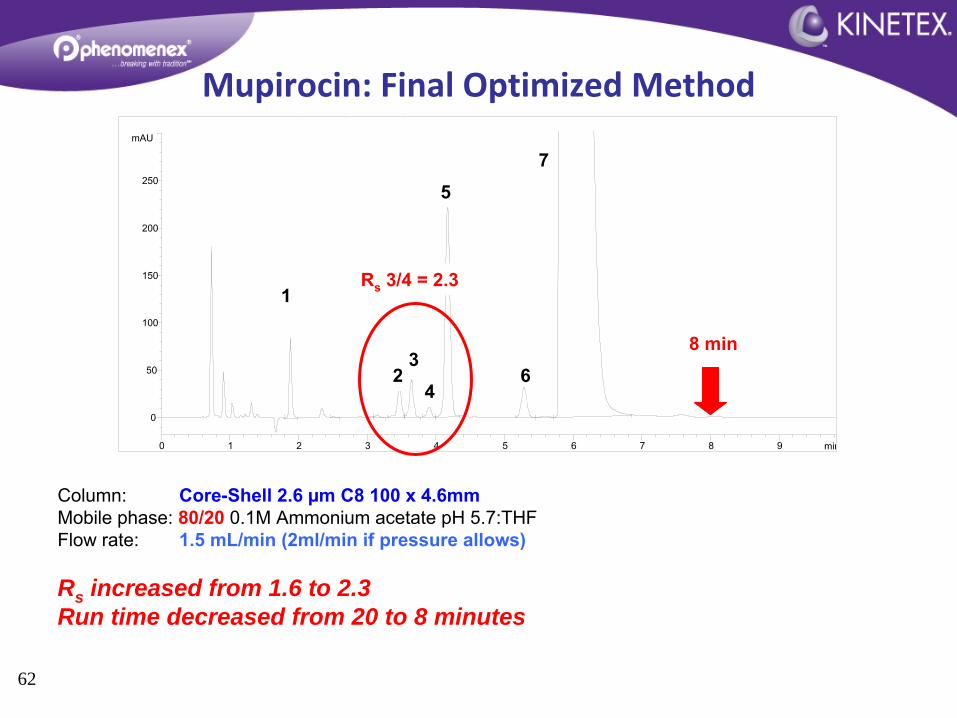
min0 1 2 3 4 5 6 7 8 9
mAU
0
50
100
150
200
250
VWD1 A, Wavelength=240 nm (JL050211\MUPI0006.D)
Column:
Core-Shell 2.6 µm
C8 100 x 4.6mmMobile phase: 80/20
0.1M Ammonium acetate pH 5.7:THFFlow rate:
1.5 mL/min (2ml/min if pressure allows)
Rs increased from 1.6 to 2.3Run time decreased from 20 to 8 minutes
8 min
1
5
6
7
23
4
Rs
3/4 = 2.3
62
Mupirocin: Final Optimized Method
min0 1 2 3 4 5 6 7 8 9
mAU
0
50
100
150
200
250
VWD1 A, Wavelength=240 nm (JL050211\MUPI0006.D)
8 min1
5
6
7
23
4
Rs
3/4 = 2.3
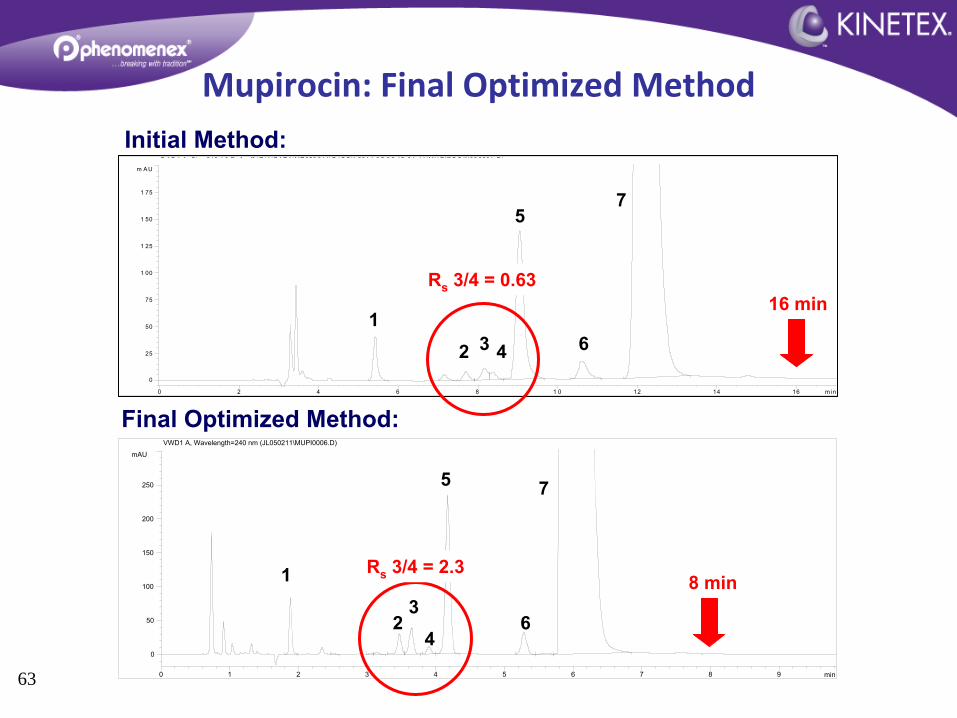
Final Optimized Method:min0 2 4 6 8 1 0 12 14 16
m AU
0
25
50
75
1 00
1 25
1 50
1 75
D AD 1 A , S ig= 240,1 0 R ef=o ff ( Z:\1 \DAT A\MT 050 211\ DJ G SK 201 1-0 5-0 2 15 -34 -44 \MU PIRO C IN00 0001 .D)
12 3
5
6
7
16 min
4
Rs
3/4 = 0.63
Initial Method:
63
Mupirocin: Final Optimized Method

64
End of Part I


