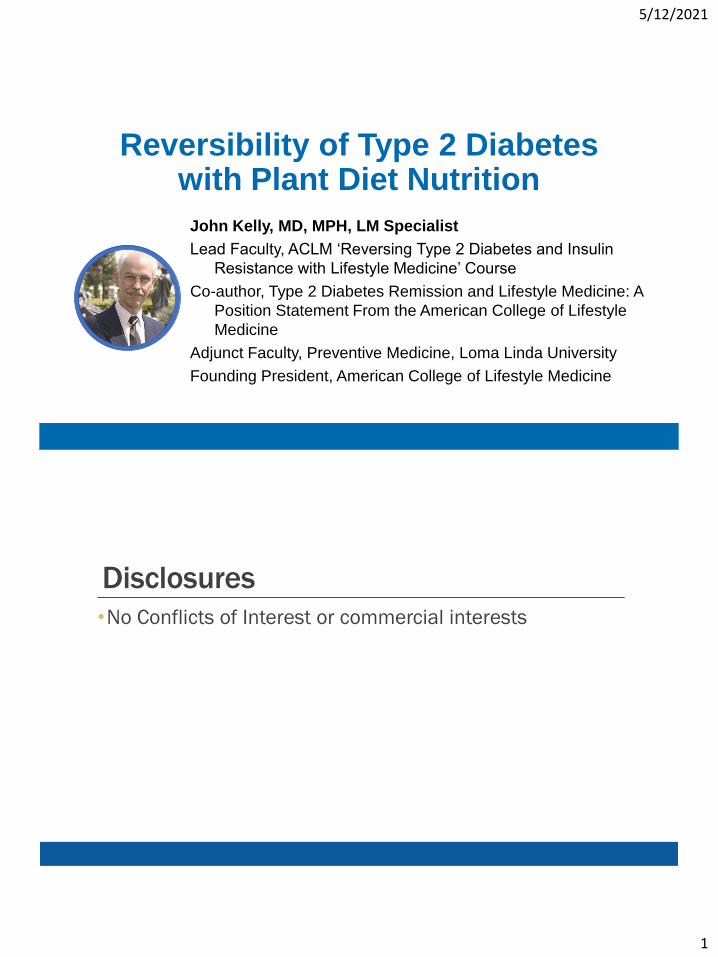
5/12/2021 1 Reversibility of Type 2 Diabetes with Plant Diet Nutrition John Kelly, MD, MPH, LM Specialist Lead Faculty, ACLM ‘Reversing Type 2 Diabetes and Insulin Resistance with Lifestyle Medicine’ Course Co-author, Type 2 Diabetes Remission and Lifestyle Medicine: A Position Statement From the American College of Lifestyle Medicine Adjunct Faculty, Preventive Medicine, Loma Linda University Founding President, American College of Lifestyle Medicine Disclosures • No Conflicts of Interest or commercial interests
Transcript
5/12/2021
1
Reversibility of Type 2 Diabeteswith Plant Diet Nutrition
John Kelly, MD, MPH, LM Specialist
Lead Faculty, ACLM ‘Reversing Type 2 Diabetes and Insulin
Resistance with Lifestyle Medicine’ Course
Co-author, Type 2 Diabetes Remission and Lifestyle Medicine: A
Position Statement From the American College of Lifestyle
Medicine
Adjunct Faculty, Preventive Medicine, Loma Linda University
Founding President, American College of Lifestyle Medicine
Disclosures
•No Conflicts of Interest or commercial interests
5/12/2021
2
Learning Objectives1. Discuss the definition and criteria for type 2 diabetes remission as
published in the ADA Diabetes Care Journal
2. Examine the evidence-based research that establishes that type 2 diabetes and insulin resistance are reversible
3. Summarize the ACLM Position Statement on Type 2 Diabetes Remission and Lifestyle Medicine
5/12/2021
3
Just imagine…
•A diet that could induce b-cell neogenesis
•A way of eating that could restore b-cell function in the pancreas without stem cells and the risks they pose…
•Well, you do not have to imagine it!
• It has been done twice in a mouse model of diabetes!
•Using an Intermittent Fasting-Mimicking Diet…
Wei, S., Han, R., Zhao, J. et al. Intermittent administration of a fasting-mimicking diet intervenes in diabetes progression, restores β cells and reconstructs gut microbiota in mice. Nutr Metab(Lond) 15, 80 (2018).
5/12/2021
4
Che
ng e
t al.
Fast
ing-M
imic
king
Die
t Pro
mote
s N
gn3
-Drive
n b
-
Cell
Regene
ration
to R
eve
rse D
iabete
s. C
ell.
2017;1
68:7
75-
788.
Just imagine…
• In mice a 4-day fasting-mimicking diet (FMD) induces a stepwise expression of Sox17 and Pdx-1, followed by Ngn3-driven generation of insulin-producing b-cells resembling that observed during pancreatic development
•FMD cycles restore insulin secretion and glucose homeostasis in both type 2 and type 1 diabetes mouse models
Cheng et al. Fasting-Mimicking Diet Promotes Ngn3-Driven b-Cell Regeneration to Reverse
Diabetes. Cell. 2017;168:775-788.
5/12/2021
5
Just imagine…
• In human type 1 diabetes pancreatic islets, fasting conditions reduce PKA and mTOR activity and induce Sox2 and Ngn3 expression and insulin production.
•The effects of the FMD are reversed by IGF-1 treatment and recapitulated by PKA and mTOR inhibition.
Cheng et al. Fasting-Mimicking Diet Promotes Ngn3-Driven b-Cell Regeneration to Reverse
Diabetes. Cell. 2017;168:775-788.
Authors conclusion…
“These results indicate that a FMD promotes the reprogramming of pancreatic cells to restore insulin generation in islets from T1D patients and reverse both T1D and T2D phenotypes in mouse models.”
Cheng et al. Fasting-Mimicking Diet Promotes Ngn3-Driven b-Cell Regeneration to Reverse
Diabetes. Cell. 2017;168:775-788.
5/12/2021
6
Discuss the definition and criteria for type 2 diabetes remission as published in the ADA Diabetes Care Journal
Progressive History of Diabetes Remission• For decades the official ADA position stated
that diabetes was an “incurable, progressive” condition, based upon UKPDS findings [1]
• With time multiple lines of evidence indicated that lifestyle change, with subsequent weight loss, could reverse the disease [2]
• A 2009 Consensus group proposed a definition with criteria for remission/reversal [3]
1. UK Prospective Diabetes Study Group. UKPDS 38. BMJ 1998 Sep 12;317(7160):703-13.
2. Trapp KB, Barnard ND. Curr Diab Rep. 2010;10:152-58. Lim EL, et al. Reversal of type 2 diabetes: normalization of beta cell function in
association with decreased pancreas and liver triacylglycerol. Diabetologia. 2011 Oct;54(10):2506-14. Lean MEJ, et al. Primary care-led
weight management for remission of type 2 diabetes (DiRECT): an open-label, cluster-randomised trial. Lancet 2018 Feb;391:541-551.
3. Buse JB, et al. How do we define cure of diabetes? Diabetes Care 2009 Nov;32(11):2133-35.
5/12/2021
7
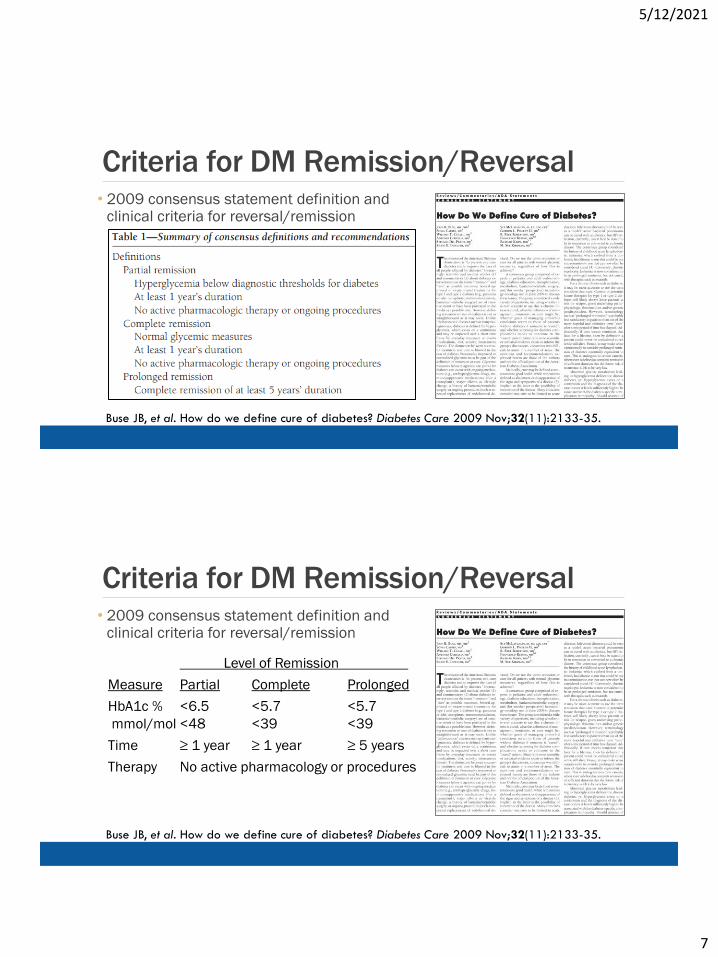
Criteria for DM Remission/Reversal• 2009 consensus statement definition and
clinical criteria for reversal/remission
Buse JB, et al. How do we define cure of diabetes? Diabetes Care 2009 Nov;32(11):2133-35.
Level of Remission .
Measure Partial Complete Prolonged
HbA1c <6.5 <5.7 <5.7
mmol/mol <39 <48 <48
Time ≥ 1 year ≥ 1 year ≥ 5 years
Therapy No active pharmacology or procedures
Criteria for DM Remission/Reversal• 2009 consensus statement definition and
clinical criteria for reversal/remission
Buse JB, et al. How do we define cure of diabetes? Diabetes Care 2009 Nov;32(11):2133-35.
Level of Remission .
Measure Partial Complete Prolonged
HbA1c % <6.5 <5.7 <5.7
mmol/mol <48 <39 <39
Time ≥ 1 year ≥ 1 year ≥ 5 years
Therapy No active pharmacology or procedures
5/12/2021
8
Criteria for DM Remission/Reversal• Association of British Clinical
Diabetologists and the Primary Care Diabetes Society published a different definition and criteria1. Glycemia below the threshold currently for
Nagi D, Hambling C, Taylor R. Remission of type 2 diabetes: a position statement from the Association of
British Clinical Diabetologists (ABCD) and the Primary Care Diabetes Society (PCDS). Br J Diabetes.
2019;19:73-76.
Examine the evidence-based research that establishes that type 2 diabetes and insulin resistance are reversible
5/12/2021
9
Evidence of Remission: More Dramatic Changes Required •UKPDS actually proved T2DM is progressive and irreversible with no lifestyle changes
•Gastric bypass has ~60-85% remission rate by ‘forcing’ reduction of caloric intake (starvation also puts T2DM in remission)
•Counterpoint very-low calorie diet (VLCD) reversed liver and pancreas triacylglycerol in 4-8 weeks
Mazur A. Why were "starvation diets" promoted for diabetes in the pre-insulin period? Nutr J. 2011;10;23.
Khorgami Z, Shoar S, Saber AA, et al. Outcomes of Bariatric Surgery Versus Medical Management for Type 2 Diabetes
Mellitus: a Meta-Analysis of Randomized Controlled Trials. Obes Surg. 2018 Nov 6.
Lim EL, et al. Reversal of type 2 diabetes: normalisation of beta cell function in association with decreased pancreas and
liver triacylglycerol. Diabetologia 2011 June 9.
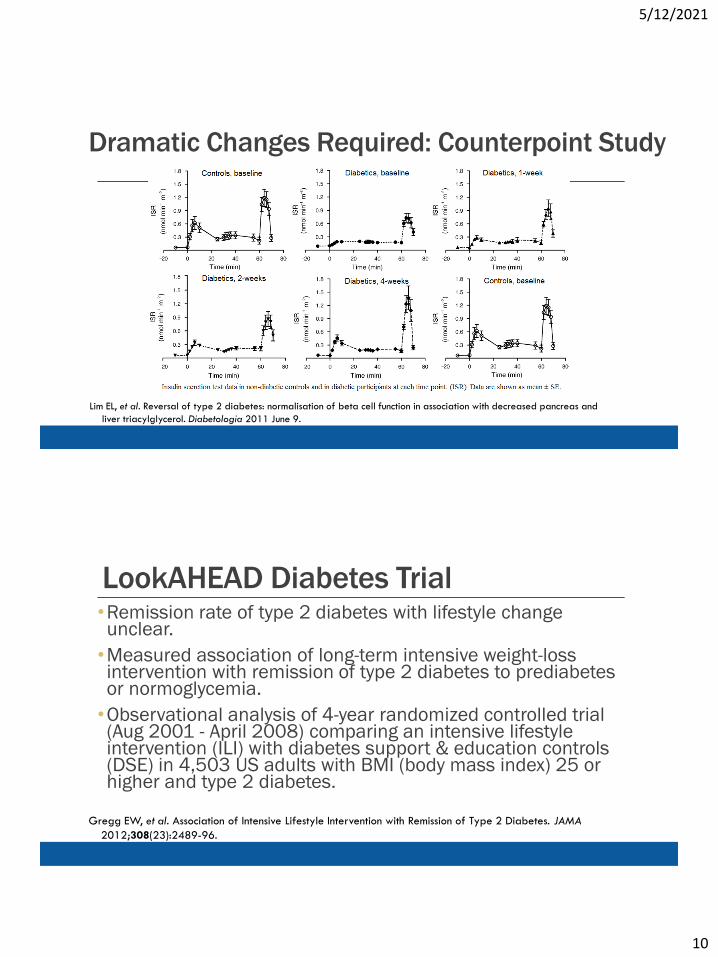
Dramatic Changes Required: Counterpoint Study
Lim EL, et al. Reversal of type 2 diabetes: normalisation of beta cell function in association with decreased pancreas and
liver triacylglycerol. Diabetologia 2011 June 9.
5/12/2021
10
Dramatic Changes Required: Counterpoint Study
Lim EL, et al. Reversal of type 2 diabetes: normalisation of beta cell function in association with decreased pancreas and
liver triacylglycerol. Diabetologia 2011 June 9.
LookAHEAD Diabetes Trial•Remission rate of type 2 diabetes with lifestyle change unclear.
•Measured association of long-term intensive weight-loss intervention with remission of type 2 diabetes to prediabetes or normoglycemia.
•Observational analysis of 4-year randomized controlled trial (Aug 2001 - April 2008) comparing an intensive lifestyle intervention (ILI) with diabetes support & education controls (DSE) in 4,503 US adults with BMI (body mass index) 25 or higher and type 2 diabetes.
Gregg EW, et al. Association of Intensive Lifestyle Intervention with Remission of Type 2 Diabetes. JAMA
2012;308(23):2489-96.
5/12/2021
11
LookAHEAD Diabetes Trial
•Randomly assigned to ILI, which included weekly group and individual counseling in the first 6 months, followed by 3 sessions per month for the second 6 months, and twice-monthly contact and regular refresher group series and campaigns in years 2 to 4 (n=2,241), OR to
•DSE, which was an offer of 3 group sessions per year on diet, physical activity, and social support (n=2,262).
Gregg EW, et al. Association of Intensive Lifestyle Intervention with Remission of Type 2 Diabetes. JAMA
2012;308(23):2489-96.
LookAHEAD Diabetes Trial
•MEASURES: Partial or complete remission defined as transition from meeting diabetes criteria to prediabetes or nondiabetic glycemia (fasting glucose <126 mg/dL (<7 mmol/L) and hemoglobin A1c <6.5% (<48 mmol/mol) with no anti-hyperglycemic medication)
•RESULTS: ILI participants lost more weight than DSE participants at years 1 & 4, and had greater fitness increases at years 1 & 4 (P < .001)
Gregg EW, et al. Association of Intensive Lifestyle Intervention with Remission of Type 2 Diabetes. JAMA
2012;308(23):2489-96.
5/12/2021
12
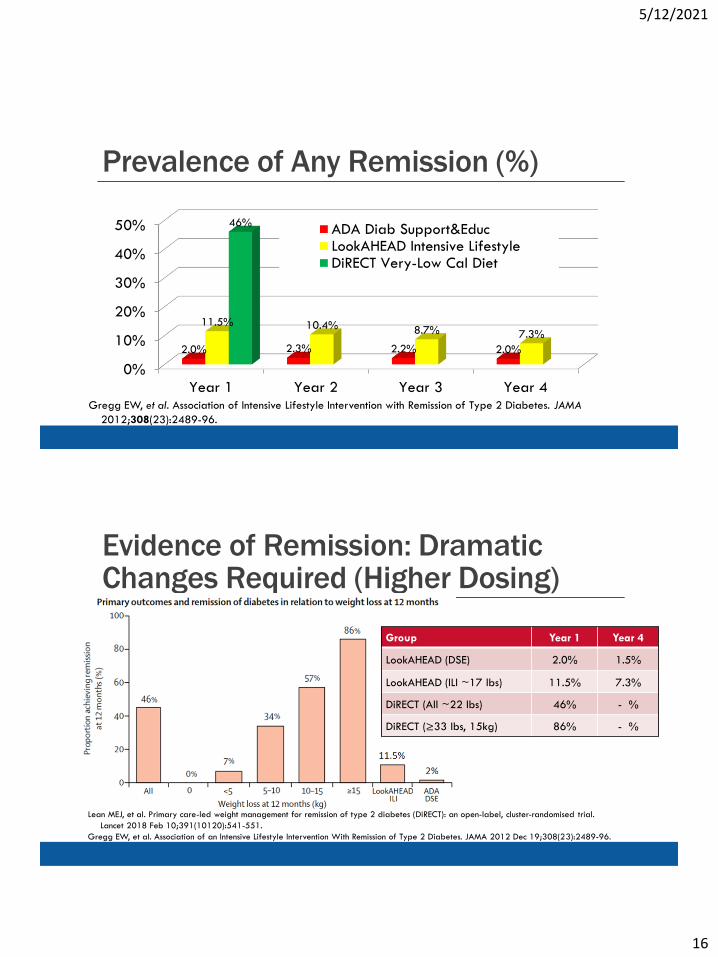
LookAHEAD Diabetes Trial•RESULTS: •The ILI group was significantly more likely to experience any remission (partial or complete), with prevalence of 11.5% during year 1 and 7.3% at year 4, compared with 2.0% for the DSE group at both time points (P < .001)
•More ILI participants had continuous, sustained remission for at least 2, 3, and 4 years compared with DSE participants
•CONCLUSIONS: Intensive lifestyle intervention was associated with greater likelihood of partial remission of type 2 diabetes compared with diabetes support & education
Gregg EW, et al. Association of Intensive Lifestyle Intervention with Remission of Type 2 Diabetes. JAMA
2012;308(23):2489-96.
DiRECT Diabetes Trial• GOALS: Assess whether intensive weight management within routine
primary care would achieve remission of type 2 diabetes
• METHODS: • Open-label, cluster-randomized trial at 49 primary care practices in
Scotland and the Tyneside region of England. • Practices were randomly assigned (1:1) to provide either a weight
management program (intervention) or best-practice care by guidelines (control)
• Stratification for study site (Tyneside or Scotland) and practice size (>5,700 or ≤5,700)
• Inclusion criteria: 20-65 years who had been diagnosed with type 2 diabetes within the past 6 years, had a body-mass index of 27-45 kg/m2, not receiving insulin.
Lean MEJ, et al. Primary care-led weight management for remission of type 2 diabetes (DiRECT): an open-
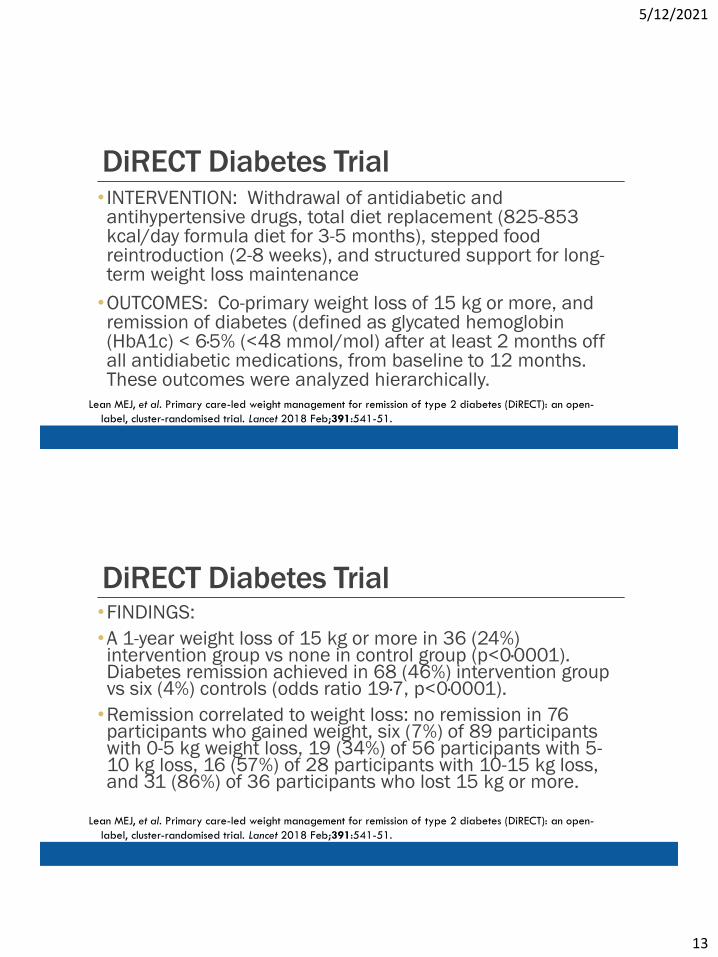
DiRECT Diabetes Trial• INTERVENTION: Withdrawal of antidiabetic and antihypertensive drugs, total diet replacement (825-853 kcal/day formula diet for 3-5 months), stepped food reintroduction (2-8 weeks), and structured support for long-term weight loss maintenance
•OUTCOMES: Co-primary weight loss of 15 kg or more, and remission of diabetes (defined as glycated hemoglobin (HbA1c) < 6·5% (<48 mmol/mol) after at least 2 months off all antidiabetic medications, from baseline to 12 months. These outcomes were analyzed hierarchically.
Lean MEJ, et al. Primary care-led weight management for remission of type 2 diabetes (DiRECT): an open-
•A 1-year weight loss of 15 kg or more in 36 (24%) intervention group vs none in control group (p<0·0001). Diabetes remission achieved in 68 (46%) intervention group vs six (4%) controls (odds ratio 19·7, p<0·0001).
•Remission correlated to weight loss: no remission in 76 participants who gained weight, six (7%) of 89 participants with 0-5 kg weight loss, 19 (34%) of 56 participants with 5-10 kg loss, 16 (57%) of 28 participants with 10-15 kg loss, and 31 (86%) of 36 participants who lost 15 kg or more.
Lean MEJ, et al. Primary care-led weight management for remission of type 2 diabetes (DiRECT): an open-
DiRECT Diabetes Trial•Weight loss 10 kg intervention and 1 kg controls (diff -8·8 kg, p<0·0001).
•Quality of life, measured by the EuroQol 5 Dimensions visual analogue scale, improved by 7.2 points in intervention and decreased by 2.9 in controls (diff 6.4 points, p=0·0012).
• INTERPRETATION: Findings show that, at 12 months, almost half of participants had remission to non-diabetic state off antidiabetic drugs. “Remission of type 2 diabetes is a practical target for primary care.”
Lean MEJ, et al. Primary care-led weight management for remission of type 2 diabetes (DiRECT): an open-
Evidence of Remission: More Dramatic Changes Required (Higher Dosing)• DiRECT VLCD & weight-maintenance diet reversed 46% T2DM
• With ≥15 kg loss → reversed 86% (similar to gastric bypass, but without adverse side-effects)
• LookAHEAD study: DSE ~2% remission (partial or complete), intensive lifestyle intervention (ILI) ~12% year-1 and <6% year-4 (ILI ~300-400% better than DSE)
• Conclusion? ILI doesn’t work → need gastric bypass
• Actually demonstrates ILI treatment not dramatic enough (too mild)Lean MEJ, et al. Primary care-led weight management for remission of type 2 diabetes (DiRECT): an open-
Clinical Remission/ Reversal• So… how can we best reduce calories, without losing nutrients?
• Reduce caloric density without dropping essential nutrients (health = nutrients / calories)
• Simplest way: greatly increase whole, unprocessed plant foods of color
• Plants high in nutrients, fiber and water, low in fats and calories
5/12/2021
24
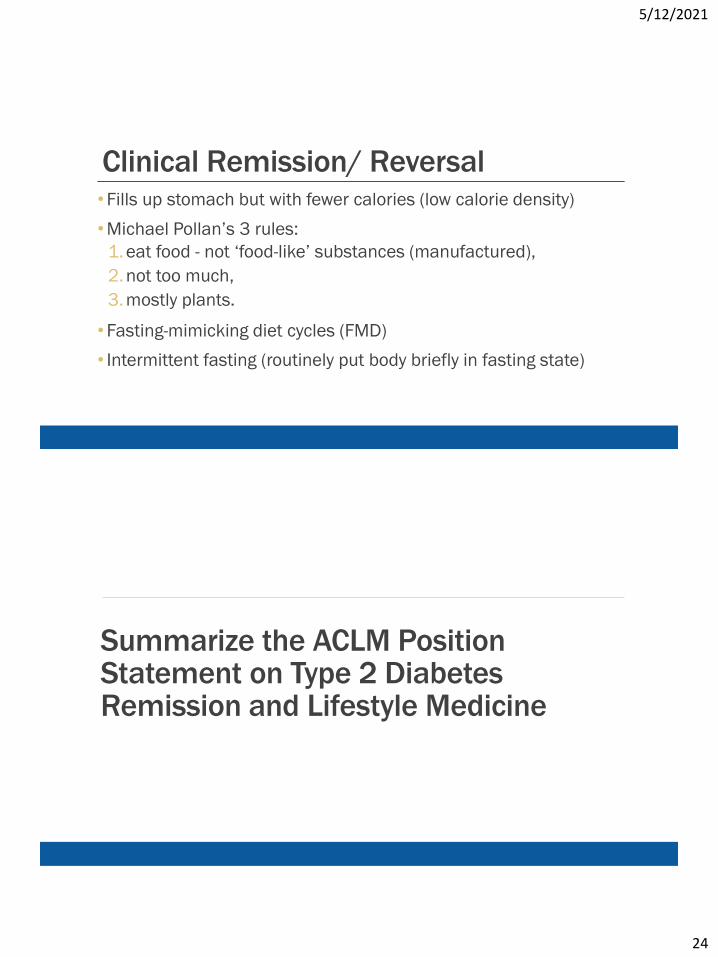
Clinical Remission/ Reversal• Fills up stomach but with fewer calories (low calorie density)
• Michael Pollan’s 3 rules:
1. eat food - not ‘food-like’ substances (manufactured),
2. not too much,
3. mostly plants.
• Fasting-mimicking diet cycles (FMD)
• Intermittent fasting (routinely put body briefly in fasting state)
Summarize the ACLM Position Statement on Type 2 Diabetes Remission and Lifestyle Medicine
5/12/2021
25
Kelly J, Karlsen M, Steinke G. Type 2 Diabetes Remission and Lifestyle Medicine: A Position Statement From the American College of
Lifestyle Medicine. American Journal of Lifestyle Medicine. 2020;14(4):406-419. doi:10.1177/1559827620930962
CONCLUSION: As incidence of T2D continues
to rise, the current best evidence from multiple
intervention studies supports remission with
intensive lifestyle modifications as the prefer-
red treatment and standard of care. To
achieve remission, appropriate, therapeutic
dosing of lifestyle modifications is necessary,
including a hypocaloric diet.
Future research should focus on high-quality
intervention trials to further quantify the
potential of different lifestyle modifications,
including consumption of a whole-food plant
diet, to achieve remission of T2D in
comparison to standard pharmacologic
treatment and surgical interventions.
ACLM’s Position1. Sufficiently intensive lifestyle modifications are capable of producing
clinical improvements and/or remission in T2D patients.
2. The optimal treatment to bring about remission includes a whole food, plant-based (WFPB) dietary pattern, coupled with regular moderate exercise.
Therefore:
3. Remission should always be the preferred clinical goal, and lifestyle medicine interventions shown to produce remission should therefore become the standard of care.
5/12/2021
26
Appropriate Therapeutic Dosing
• Intensity of lifestyle interventions must be matched to the severity and acuteness of the condition being treated (just as with medication and surgery)
•Reversal of advanced hyperglycemia requires intensive lifestyle interventions that produce significant weight loss
•Counterpoint, Counterweight and DiRECT trials demonstrate that liquid meal substitutes can achieve this
Clinical Experience with Plant Diet
•ACLM members and others have shown that WFPB diets can also achieve remission, esp. combined with fasting
•The position paper reviewed multiple intervention studies and found that dosing intensity largely determines success or failure to achieve remission
•Research needed to compare meal substitutes with WFPB diet, and other diets and interventions
5/12/2021
27
Clinical Goal of T2D Remission
•Weight of evidence shows that properly-dosed lifestyle interventions can produce remission in a major portion of T2D patients
•Medication-based treatment alone is insufficient to achieve remission
•Surgical interventions can achieve remission, but with significant risk and undesired side-effects
Fasting-mimicking Diet•The FMD is a plant-based diet designed to attain fasting-like effects on the serum levels of IGF-1, IGFBP-1, glucose, and ketone bodies while providing both macro-and micronutrients to minimize the burden of fasting and adverse effects.
•Day 1 of the FMD supplies ~4600 kJ (11% protein, 46% fat, and 43% carbohydrate), whereas days 2 to 5 provide ~3000 kJ (9% protein, 44% fat, and 47% carbohydrate) per day.
Wei M, et al. Fasting-mimicking diet and markers/risk factors for aging, diabetes, cancer, and
cardiovascular disease. Sci Transl Med 2017 Feb 15;9:eaai8700.
Fasting-mimicking Diet•The FMD comprises proprietary formulations belonging to USC and L-Nutra (www.prolonfmd.com) of vegetable-based soups, energy bars, energy drinks, chip snacks, tea, and a supplement providing high levels of minerals, vitamins, and essential fatty acids (fig. S4).
•All items to be consumed per day were individually boxed to allow the subjects to choose when to eat while avoiding accidentally consuming components of the following day.
Wei M, et al. Fasting-mimicking diet and markers/risk factors for aging, diabetes, cancer, and
cardiovascular disease. Sci Transl Med 2017 Feb 15;9:eaai8700.
5/12/2021
29
Fasting-mimicking Diet Content• The human version of the FMD is a propriety (L-Nutra) plant-based diet designed to
attain fasting-like effects on the serum levels of IGF-I, IGFBP1, glucose and ketone bodies while providing both macro and micronutrients to minimize the burden of fasting and adverse effects (Brandhorst et al., 2015).
• Day 1 of the FMD supplies ~4600 kJ (1060 kcal; 11% protein, 46% fat, 43% carbohydrate), whereas days 2-5 provide ~3000 kJ (690 kcal; 9% protein, 44% fat, 47% carbohydrate) per day.
• The FMD comprises proprietary formulations of vegetable-based soups, energy bars, energy drinks, chip snacks, tea, and a supplement providing high levels of minerals, vitamins and essential fatty acids (Figure S3). All items to be consumed per day were individually boxed to allow the subjects to choose when to eat while avoiding accidentally consuming components of the following day. For the human subjects, a suggested FMD meal plan was provided that distributes the study foods to be consumed as breakfast, lunch, snacks, and dinner. See lists below for ingredients and supplements.
Wei M, et al. Fasting-mimicking diet and markers/risk factors for aging, diabetes, cancer, and
cardiovascular disease. Sci Transl Med 2017 Feb 15;9:eaai8700.