+ All Categories
Home > Documents > Review A review of the usefulness of relative bulk density ... · This means that in Swedish...

Review A review of the usefulness of relative bulk density ... · This means that in Swedish...

Date post: 03-May-2018
Category:
Upload: vocong
View: 219 times
Download: 1 times
Share this document with a friend
15
Review A review of the usefulness of relative bulk density values in studies of soil structure and compaction Inge Ha ˚kansson a,* , Jerzy Lipiec b a Department of Soil Sciences, Swedish University of Agricultural Sciences, PO Box 7014, S-75007 Uppsala, Sweden b Polish Academy of Sciences, Institute of Agrophysics, PO Box 201, 20-290 Lublin 27, Poland Received 25 September 1997; received in revised form 2 September 1998; accepted 20 October 1999 Abstract The state of compactness is an important soil structure and quality attribute, and there is a need to find a parameter for its characterization that gives directly comparable values for all soils. The use of some relative bulk density value for this purpose, particularly the degree of compactness (Ha ˚kansson, 1990), is discussed in this review. The degree of compactness has been defined as the dry bulk density of a soil as a percent of a reference bulk density obtained by a standardized uniaxial compression test on large samples at a stress of 200 kPa. The bulk density should be determined at standardized moisture conditions, to prevent problems caused by water content variations in swelling/shrinking soils. The degree of compactness (D) makes results of soil compaction experiments more generally applicable. Whereas the bulk density or porosity optimal for crop growth vary greatly between soils, the optimal D-value is virtually independent of soil composition. Critical limits of penetration resistance (3 MPa) and air-filled porosity (10%, v/v) are similarly related to the D-value and matric water tension in most soils. As the D-value increases above the optimal, the tension range offering non-limiting conditions becomes increasingly limited. The D-value of the plough layer induced by a given number of passes by a certain vehicle is similar in all soils, provided the moisture conditions are comparable. The degree of compactness facilitates modelling of soil and crop responses to machinery traffic. Although this parameter was primarily introduced for use in annually disturbed soil layers, its use may be extended to undisturbed soil layers. # 2000 Elsevier Science B.V. All rights reserved. Keywords: Soil compaction; Soil structure; Relative bulk density; Degree of compactness; Aeration; Penetration resistance; Matric water tension; Crop growth; Machinery traffic 1. Introduction To characterize the state of compactness of a soil layer, dry bulk density and total porosity are the most frequently used parameters. However, to characterize soil properties from a soil quality point of view, e.g., with respect to crop production, these parameters are unsatisfactory, since they lead to crop response curves and optimum values with respect to crop yield that are different for different soils. To overcome this problem, efforts have been made to find a parameter that eliminates, as much as possible, the differences between soils in crop response curves and optimum Soil & Tillage Research 53 (2000) 71–85 * Corresponding author. Tel.: 46-18-67-1210; fax: 46-18-67- 2795. 0167-1987/00/$ – see front matter # 2000 Elsevier Science B.V. All rights reserved. PII:S0167-1987(99)00095-1
Transcript

Review

A review of the usefulness of relative bulk density values in

studies of soil structure and compaction

Inge HaÊkanssona,*, Jerzy Lipiecb

aDepartment of Soil Sciences, Swedish University of Agricultural Sciences, PO Box 7014, S-75007 Uppsala, SwedenbPolish Academy of Sciences, Institute of Agrophysics, PO Box 201, 20-290 Lublin 27, Poland

Received 25 September 1997; received in revised form 2 September 1998; accepted 20 October 1999

Abstract

The state of compactness is an important soil structure and quality attribute, and there is a need to ®nd a parameter for its

characterization that gives directly comparable values for all soils. The use of some relative bulk density value for this

purpose, particularly the degree of compactness (HaÊkansson, 1990), is discussed in this review. The degree of compactness has

been de®ned as the dry bulk density of a soil as a percent of a reference bulk density obtained by a standardized uniaxial

compression test on large samples at a stress of 200 kPa. The bulk density should be determined at standardized moisture

conditions, to prevent problems caused by water content variations in swelling/shrinking soils. The degree of compactness (D)

makes results of soil compaction experiments more generally applicable. Whereas the bulk density or porosity optimal for

crop growth vary greatly between soils, the optimal D-value is virtually independent of soil composition. Critical limits of

penetration resistance (3 MPa) and air-®lled porosity (10%, v/v) are similarly related to the D-value and matric water tension

in most soils. As the D-value increases above the optimal, the tension range offering non-limiting conditions becomes

increasingly limited. The D-value of the plough layer induced by a given number of passes by a certain vehicle is similar in all

soils, provided the moisture conditions are comparable. The degree of compactness facilitates modelling of soil and crop

responses to machinery traf®c. Although this parameter was primarily introduced for use in annually disturbed soil layers, its

use may be extended to undisturbed soil layers. # 2000 Elsevier Science B.V. All rights reserved.

Keywords: Soil compaction; Soil structure; Relative bulk density; Degree of compactness; Aeration; Penetration resistance; Matric water

tension; Crop growth; Machinery traf®c

1. Introduction

To characterize the state of compactness of a soil

layer, dry bulk density and total porosity are the most

frequently used parameters. However, to characterize

soil properties from a soil quality point of view, e.g.,

with respect to crop production, these parameters are

unsatisfactory, since they lead to crop response curves

and optimum values with respect to crop yield that are

different for different soils. To overcome this problem,

efforts have been made to ®nd a parameter that

eliminates, as much as possible, the differences

between soils in crop response curves and optimum

Soil & Tillage Research 53 (2000) 71±85

* Corresponding author. Tel.: �46-18-67-1210; fax: �46-18-67-

2795.

0167-1987/00/$ ± see front matter # 2000 Elsevier Science B.V. All rights reserved.

PII: S 0 1 6 7 - 1 9 8 7 ( 9 9 ) 0 0 0 9 5 - 1

values. This has mainly been made by relating the bulk

density to some reference bulk density obtained by a

standardized compaction test. In this way, a parameter

often simply named the relative bulk density has been

used rather than the bulk density itself to characterize

the state of soil compactness. As a reference test, a

standard Proctor test was used by Pidgeon and Soane

(1977), Carter (1990) and da Silva et al. (1994) and a

uniaxial compression test by van Wijk and Beuving

(1984).

In Swedish soil compaction research, HaÊkansson

(1973) and Eriksson et al. (1974) introduced a uniaxial

compression test as such a reference test and named

the resulting relative-bulk-density parameter the

`̀ degree of compactness''. This parameter was origin-

ally intended for characterization of the conditions in

soil layers disturbed annually by tillage. So far, it has

mainly been used in experimental work on soil and

crop responses to agricultural machinery traf®c. The

degree of compactness, D, was de®ned as the dry bulk

density of a soil layer in percent of a reference dry bulk

density of the same soil obtained by a standardized,

long-term uniaxial compression test at a stress of

200 kPa. HaÊkansson (1990) provided a detailed

description of the procedures. For its determination,

very large soil samples have generally been used.

Field sampling (normally at ®eld capacity water con-

tent, Section VII) has mostly been made using a 0.5 m2

frame, and in the uniaxial test, the sample volume has

been 12 l. This parameter has also been used in Nor-

way (Riley, 1983, 1988) and in Poland (Lipiec et al.,

1991). A nearly identical parameter was used by da

Silva et al. (1997), but they just named it the relative

bulk density or the relative compaction. The only

difference of possible importance was that they used

smaller samples.

The main objective of introducing the degree of

compactness to characterize the state of soil compact-

ness was to simplify various compaction studies. The

initial hypothesis was that the use of the degree of

compactness rather than bulk density or porosity

would lead to less site-speci®c, and consequently, to

more generally applicable experimental results. This

parameter was thought to be a `̀ high-level integrating

parameter for soil physical quality'' (Topp et al.,

1997). It was expected to be a useful link between

studies of soil responses to machinery traf®c and

studies of crop responses to the resulting soil condi-

tions. It was also thought to facilitate modelling of soil

and crop responses to ®eld traf®c and to enhance

understanding and practical utilization of experimen-

tal results among farmers.

The objective of this paper is to review the informa-

tion available today on the merits of using some

relative bulk density value such as the degree of

compactness to characterize the state of compactness

of a tilled soil layer in studies of soil and crop

responses to machinery traf®c. The possibilities of

extending the use of such a parameter to soil layers not

annually disturbed by tillage are also discussed, as

well as problems caused by water content variations in

swelling/shrinking soils. Although not explicitly dis-

cussed, from the review it can be deduced that some

relative bulk density value may be a useful indicator of

soil quality even with respect to other soil functions

than crop production.

2. Crop response to the degree of compactness ofthe plough layer

When using dry bulk density or porosity to char-

acterize the state of compactness of soils with respect

to crop growth, it is well known that the crop response

curves may be very different for soils with different

texture and organic matter content, and the same is

true for the optimal values, i.e., the values of these

parameters resulting in maximum crop yields (e.g.,

HaÊkansson, 1966; Edling and Fergedal, 1972;

Petelkau, 1984; Boone, 1986; Lipiec and Simota,

1994). In contrast, HaÊkansson (1990) used the degree

of compactness in a series of about 100 ®eld experi-

ments in a wide range of soils with spring barley

(Hordeum vulgare L.) as a common test crop. In the

experiments, tractor traf®c had been used to create a

series of D-values in the 4±25 cm layer. A good and

uniform, 4 cm deep seedbed had been created in all

treatments to make sure that a good and uniform crop

establishment was obtained irrespective of the com-

pactness of the 4±25 cm layer. To verify that D is

independent of soil texture, a regression analysis was

carried out to study the in¯uences of soil texture and

organic matter content on the optimal D-value with

respect to grain yield (Dopt) in the layer between

sowing and ploughing depths (about 4±25 cm). The

results are illustrated in Fig. 1. The `̀ best'' regression

72 I. HaÊkansson, J. Lipiec / Soil & Tillage Research 53 (2000) 71±85

equation found was

Dopt � 90:3ÿ0:216C � 0:0038C2ÿ0:214H

�2 < C < 60; 1 < H < 11; n � 102; r2 � 0:07� (1)

where C is the clay content and H is the organic matter

content (%). When only C was included in the model

the regression equation was

Dopt � 87:3� 0:0007C

�2 < C < 60; n � 102; r2 � 0:00� (2)

This means that in Swedish mineral soils with clay

contents ranging between 2 and 60% and organic

matter contents between 1 and 11%, the mean optimal

D-value was virtually the same (about 87) independent

of soil texture. Since the group of soils constitutes a

representative sample of arable mineral soils in Swe-

den, the very low r2-values imply that, for these soils,

the main objective of introducing the degree of com-

pactness was nearly achieved. However, Eq. (1) indi-

cates a slight curvilinear relationship between Dopt and

clay content (p < 0.05). Dopt also decreased slightly

with the organic matter content, but this decrease was

not statistically signi®cant. These results indicate that

most of the variation in Dopt in Fig. 1 was caused by

other factors than soil composition, particularly the

variations in weather between sites and years (Section

3.4). Very similar Dopt as in Sweden was obtained in

experiments with spring sown small grain cereals, in

most cases barley, in Norway (Riley, 1983, 1988) and

in Poland (Lipiec et al., 1991). Furthermore, ongoing

work (Braunack, M., 1998, pers. commun.) indicates

that Dopt for sugar-cane in Queensland, Australia, is

very similar to that for barley in Scandinavia.

Thus, it can be stated that the use of the degree of

compactness to characterize the state of soil compact-

ness eliminates most of the differences in crop

response between soils. Organic soils seem to be an

exception. In such a soil, HaÊkansson (1990) obtained

an optimal D-value some units lower than that in

mineral soils, which is in agreement with Eq. (1).

At least part of the reason was thought to be that the

reference test, being developed and tested only in

mineral soils, was not suf®ciently adapted to organic

soils. When used in organic soils, the test may have to

be modi®ed by reducing the loading time (which may

require shallower samples and/or porous plates at both

ends of the samples during loading) and extending the

time for rebound of the soil after unloading.

While the degree of compactness eliminates most of

the differences between soils in optimal D-value,

variations caused by other factors still remain. The

weather seems to be the most important of these

factors (Section 3.4). Various crops also have some-

what different D-optima. HaÊkansson (1986) summar-

ized results of a series of compaction experiments in

Sweden (part of the series in Fig. 1) where different

crops or varieties had been grown side by side with

barley used as a common reference crop. A grouping

of the crops studied with respect to the optimal D-

value in the 4±25 cm layer is presented in Table 1. The

range between groups 1 and 4 in this table was

estimated to be about 5 D-units. Since the mean Dopt

for barley in the whole series of 102 experiments was

about 87, mean Dopt for groups 1±4 in Table 1 can be

estimated to about 87, 85, 84 and 82, respectively. The

placement of the crops in these groups, however, may

to some extent depend on the varieties. In the experi-

ments, there was some evidence for varietal differ-

ences, and such differences are also reported from

other investigations (Lipiec and Simota, 1994).

The order between the crops may also depend on

which of the growth factors that is the most limiting.

The latter may be illustrated by investigations in peas

and barley by Grath (1996). When these crops were

grown side by side in a well-drained soil where

compaction did not cause oxygen de®ciency and

Fig. 1. Estimated optimal degree of compactness with respect to

grain yield (Dopt) in the 4±25 cm layer (the plough layer excluding

the seedbed) in 102 individual field experiments with spring sown

barley carried out in Sweden in 1969±1981 in soils with clay

contents between 2 and 60% and organic matter contents between 1

and 11%. Regression curves according to Eq. (1) are drawn for soil

organic matter contents (H) of 1 and 10%. (Data from the

investigation by HaÊkansson, 1990.)

I. HaÊkansson, J. Lipiec / Soil & Tillage Research 53 (2000) 71±85 73

where no root rot infestation occurred, both crops

responded similarly to soil compaction. In contrast,

peas grown in the same year in an adjacent ®eld, where

compaction caused oxygen de®ciency in the soil and

where heavy infestation by Aphanomyces root rot

occurred, responded much more negatively to com-

paction.

In the series of ®eld experiments summarized by

HaÊkansson (1986) it was also observed that on soils

where the crop suffered from manganese de®ciency

the optimal D-value was higher than normal, but when

spraying the crop with manganese sulphate to elim-

inate this de®ciency, Dopt was moved to the normal

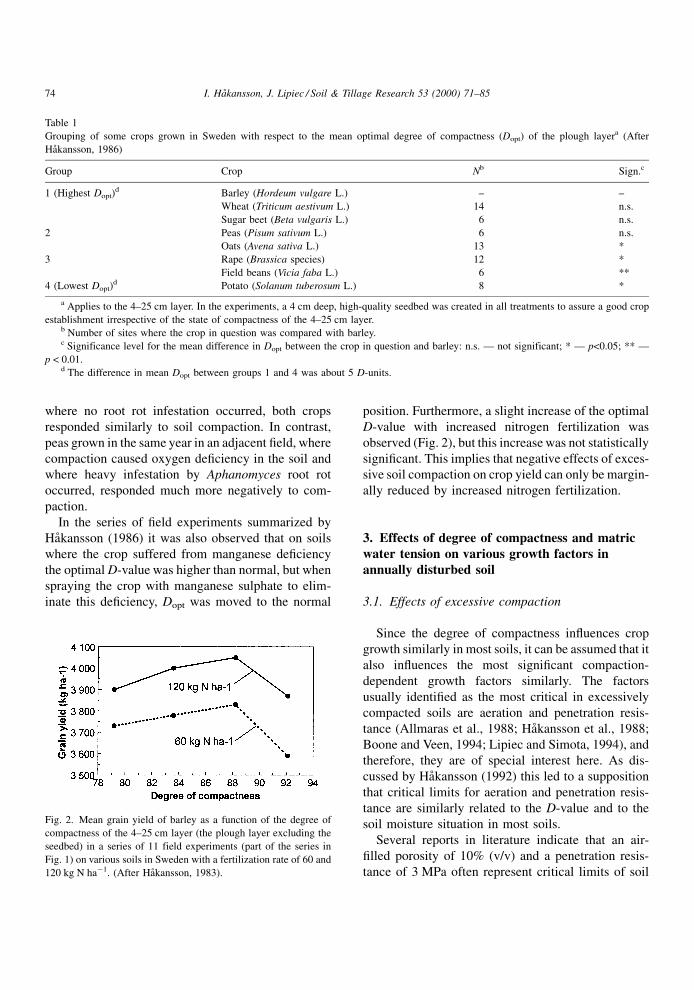
position. Furthermore, a slight increase of the optimal

D-value with increased nitrogen fertilization was

observed (Fig. 2), but this increase was not statistically

signi®cant. This implies that negative effects of exces-

sive soil compaction on crop yield can only be margin-

ally reduced by increased nitrogen fertilization.

3. Effects of degree of compactness and matricwater tension on various growth factors inannually disturbed soil

3.1. Effects of excessive compaction

Since the degree of compactness in¯uences crop

growth similarly in most soils, it can be assumed that it

also in¯uences the most signi®cant compaction-

dependent growth factors similarly. The factors

usually identi®ed as the most critical in excessively

compacted soils are aeration and penetration resis-

tance (Allmaras et al., 1988; HaÊkansson et al., 1988;

Boone and Veen, 1994; Lipiec and Simota, 1994), and

therefore, they are of special interest here. As dis-

cussed by HaÊkansson (1992) this led to a supposition

that critical limits for aeration and penetration resis-

tance are similarly related to the D-value and to the

soil moisture situation in most soils.

Several reports in literature indicate that an air-

®lled porosity of 10% (v/v) and a penetration resis-

tance of 3 MPa often represent critical limits of soil

Table 1

Grouping of some crops grown in Sweden with respect to the mean optimal degree of compactness (Dopt) of the plough layera (After

HaÊkansson, 1986)

Group Crop Nb Sign.c

1 (Highest Dopt)d Barley (Hordeum vulgare L.) ± ±

Wheat (Triticum aestivum L.) 14 n.s.

Sugar beet (Beta vulgaris L.) 6 n.s.

2 Peas (Pisum sativum L.) 6 n.s.

Oats (Avena sativa L.) 13 *

3 Rape (Brassica species) 12 *

Field beans (Vicia faba L.) 6 **

4 (Lowest Dopt)d Potato (Solanum tuberosum L.) 8 *

a Applies to the 4±25 cm layer. In the experiments, a 4 cm deep, high-quality seedbed was created in all treatments to assure a good crop

establishment irrespective of the state of compactness of the 4±25 cm layer.b Number of sites where the crop in question was compared with barley.c Significance level for the mean difference in Dopt between the crop in question and barley: n.s. Ð not significant; * Ð p<0.05; ** Ð

p < 0.01.d The difference in mean Dopt between groups 1 and 4 was about 5 D-units.

Fig. 2. Mean grain yield of barley as a function of the degree of

compactness of the 4±25 cm layer (the plough layer excluding the

seedbed) in a series of 11 field experiments (part of the series in

Fig. 1) on various soils in Sweden with a fertilization rate of 60 and

120 kg N haÿ1. (After HaÊkansson, 1983).

74 I. HaÊkansson, J. Lipiec / Soil & Tillage Research 53 (2000) 71±85

aeration and rootability, respectively (GlinÂski and

SteÎpniewski, 1985; Boone et al., 1986; Allmaras et

al., 1988; Boone, 1988; Bengough and Mullins, 1990).

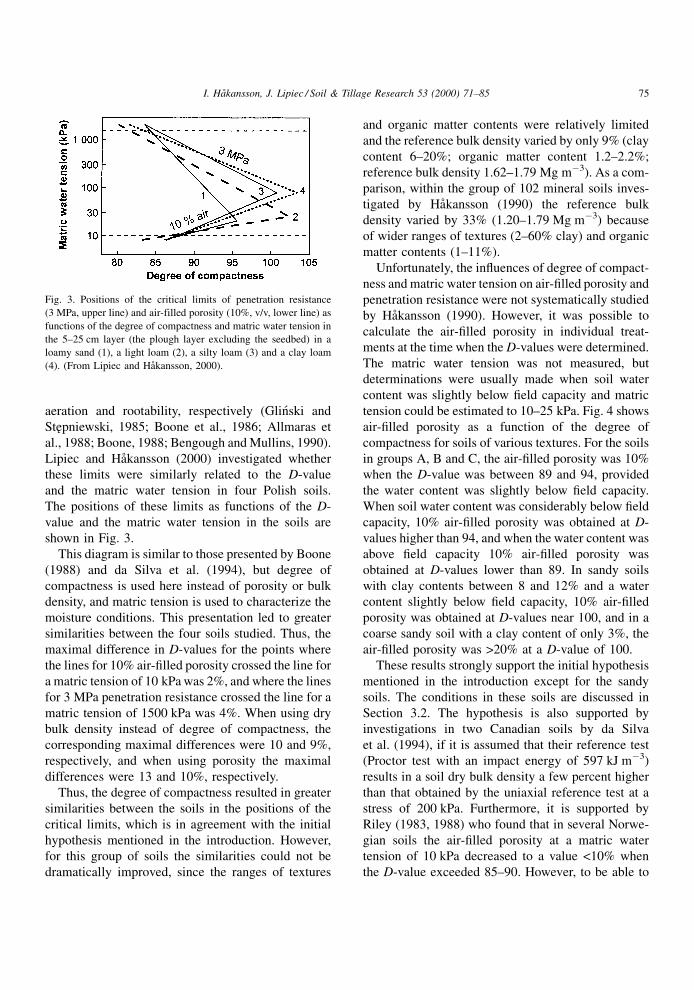
Lipiec and HaÊkansson (2000) investigated whether

these limits were similarly related to the D-value

and the matric water tension in four Polish soils.

The positions of these limits as functions of the D-

value and the matric water tension in the soils are

shown in Fig. 3.

This diagram is similar to those presented by Boone

(1988) and da Silva et al. (1994), but degree of

compactness is used here instead of porosity or bulk

density, and matric tension is used to characterize the

moisture conditions. This presentation led to greater

similarities between the four soils studied. Thus, the

maximal difference in D-values for the points where

the lines for 10% air-®lled porosity crossed the line for

a matric tension of 10 kPa was 2%, and where the lines

for 3 MPa penetration resistance crossed the line for a

matric tension of 1500 kPa was 4%. When using dry

bulk density instead of degree of compactness, the

corresponding maximal differences were 10 and 9%,

respectively, and when using porosity the maximal

differences were 13 and 10%, respectively.

Thus, the degree of compactness resulted in greater

similarities between the soils in the positions of the

critical limits, which is in agreement with the initial

hypothesis mentioned in the introduction. However,

for this group of soils the similarities could not be

dramatically improved, since the ranges of textures

and organic matter contents were relatively limited

and the reference bulk density varied by only 9% (clay

content 6±20%; organic matter content 1.2±2.2%;

reference bulk density 1.62±1.79 Mg mÿ3). As a com-

parison, within the group of 102 mineral soils inves-

tigated by HaÊkansson (1990) the reference bulk

density varied by 33% (1.20±1.79 Mg mÿ3) because

of wider ranges of textures (2±60% clay) and organic

matter contents (1±11%).

Unfortunately, the in¯uences of degree of compact-

ness and matric water tension on air-®lled porosity and

penetration resistance were not systematically studied

by HaÊkansson (1990). However, it was possible to

calculate the air-®lled porosity in individual treat-

ments at the time when the D-values were determined.

The matric water tension was not measured, but

determinations were usually made when soil water

content was slightly below ®eld capacity and matric

tension could be estimated to 10±25 kPa. Fig. 4 shows

air-®lled porosity as a function of the degree of

compactness for soils of various textures. For the soils

in groups A, B and C, the air-®lled porosity was 10%

when the D-value was between 89 and 94, provided

the water content was slightly below ®eld capacity.

When soil water content was considerably below ®eld

capacity, 10% air-®lled porosity was obtained at D-

values higher than 94, and when the water content was

above ®eld capacity 10% air-®lled porosity was

obtained at D-values lower than 89. In sandy soils

with clay contents between 8 and 12% and a water

content slightly below ®eld capacity, 10% air-®lled

porosity was obtained at D-values near 100, and in a

coarse sandy soil with a clay content of only 3%, the

air-®lled porosity was >20% at a D-value of 100.

These results strongly support the initial hypothesis

mentioned in the introduction except for the sandy

soils. The conditions in these soils are discussed in

Section 3.2. The hypothesis is also supported by

investigations in two Canadian soils by da Silva

et al. (1994), if it is assumed that their reference test

(Proctor test with an impact energy of 597 kJ mÿ3)

results in a soil dry bulk density a few percent higher

than that obtained by the uniaxial reference test at a

stress of 200 kPa. Furthermore, it is supported by

Riley (1983, 1988) who found that in several Norwe-

gian soils the air-®lled porosity at a matric water

tension of 10 kPa decreased to a value <10% when

the D-value exceeded 85±90. However, to be able to

Fig. 3. Positions of the critical limits of penetration resistance

(3 MPa, upper line) and air-filled porosity (10%, v/v, lower line) as

functions of the degree of compactness and matric water tension in

the 5±25 cm layer (the plough layer excluding the seedbed) in a

loamy sand (1), a light loam (2), a silty loam (3) and a clay loam

(4). (From Lipiec and HaÊkansson, 2000).

I. HaÊkansson, J. Lipiec / Soil & Tillage Research 53 (2000) 71±85 75

show more de®nitely to which extent the hypothesis

holds true, it would be necessary, and also very

valuable, to study the variations in the positions of

the critical limits in a suf®ciently wide range of soils

by new investigations speci®cally designed for this

purpose. The investigations carried out so far have had

other primary purposes. New investigations might

even result in methods by which the D-value can be

estimated from combined measurements of matric

water tension and penetration resistance (provided it

is possible to handle the complications caused by

hysteresis effects and by age-hardening after soil

disturbance).

3.2. A schematic diagram

Fig. 5 shows in a schematic form the approximate

positions of the critical limits of penetration resistance

and air-®lled porosity as functions of the degree of

compactness and matric water tension in annually

disturbed soils. This ®gure is derived from the results

presented in Figs. 3 and 4, and it seems to be applic-

able to most soils with only minor variations.

Thus, at a matric water tension of 10 kPa (®eld

capacity in humid regions), most soils can be expected

to have an air-®lled porosity <10% when D is higher

than about 87, and >10% when D is lower than that.

The higher the D-value the higher is the tension (the

lower the water content) at which aeration becomes

critical. At a matric tension of 1500 kPa (wilting

point) the penetration resistance of most soils can

be expected to exceed 3 MPa when D exceeds 85.

The higher the D-value the lower is the tension (the

higher the water content) at which penetration resis-

tance becomes critical.

When D is lower than about 85, neither soil aeration

nor penetration resistance become critical within the

10±1500 kPa tension range. However, the higher the

D-value the more limited is the tension range offering

adequate conditions (the unshaded area in the dia-

gram), and before D reaches 100 this range usually

vanishes.

Fig. 4. Air-filled porosity as a function of the degree of compactness of the 4±25 cm layer (the plough layer excluding the seedbed) in soils

with various textures. In most cases (solid lines), the determinations were made at a soil water content slightly below field capacity (estimated

matric tension 10±25 kPa). In some cases (broken lines), the matric tension was estimated to be either lower than 10 kPa or higher than 25 kPa.

Ranges of clay and organic matter contents are: in group A 28±59% and 2.8±4.9%, respectively, in group B 10±27% and 2.9±4.9%,

respectively, and in group C 15±16% and 3.1±8.3%, respectively. In group D the ranges are 8±12% and 1.4±4.0% respectively, except for one

soil with only 3% clay and 1.0% organic matter. (Unpublished results from the investigation by HaÊkansson, 1990).

76 I. HaÊkansson, J. Lipiec / Soil & Tillage Research 53 (2000) 71±85

In a situation represented by the shaded area in the

upper right corner of Fig. 5, root growth rate is

severely reduced by mechanical impedance. This

may lead to a limited root system and seriously

reduced uptake of water and nutrients. However, the

water tension often increases slowly from an origin-

ally low value and remains within the unshaded area

until many roots have penetrated the compacted layer.

Then it may be less serious if the critical limit is

subsequently exceeded. Under Scandinavian condi-

tions, the likelihood of a rapid increase in water

tension in the deeper parts of the plough layer is

greatest in soils with an intermediate clay content

(Heinonen, 1985; Stenberg et al., 1995), and this

may be the reason for the curvilinear relationship

between Dopt and clay content (Eq. (1); Fig. 1).

In the shaded area in the lower right corner of Fig. 5,

oxygen de®ciency occurs in the soil. This causes

problems whenever it restrains normal development

of the root system or when the situation in a substantial

part of an existing root zone turns critical for more

than a short period. The maximum tolerable length of

a period with oxygen de®ciency depends on several

factors such as growth stage, temperature, biological

activity and buffering capacity of the soil. Most stu-

dies of aeration effects on plants have been performed

at early growth stages in pot or lysimeter experiments

(GlinÂski and SteÎpniewski, 1985). At these stages, the

tolerable periods of oxygen stress may vary from a few

hours to several days depending on plant species.

After establishment, the period can be longer (Cannell

and Jackson, 1981). A characteristic plant response to

oxygen stress in the root zone is stomatal closure

(Drew, 1990) which does not completely recover when

aeration is improved (Sojka, 1992; Lipiec et al., 1996).

It is too simplistic, of course, to suggest that an

abrupt change occurs from a completely non-restric-

tive to a completely restrictive situation as soon as one

of the critical limits is exceeded. In reality, as illu-

strated by Lipiec and HaÊkansson (2000), there is a

gradual change, which must be taken into considera-

tion in any detailed studies.

Furthermore, the critical limits may vary between

soils. In soils with a relatively high clay content and a

continuous and reasonably stable macropore system,

aeration can be adequate for crop growth at a lower

air-®lled porosity than 10% (v/v), even though some

intra-aggregate sites may be anaerobic. Thus, HaÊkans-

son (1965) reported that good root development and

crop growth was obtained in a clay loam soil at an air-

®lled porosity of 5% (v/v) and McAfee et al. (1989)

reported adequate aeration of a clay soil at an air-®lled

porosity of 8% (v/v). On the other hand, in sandy soils

with low content of ®ne material, the critical air-®lled

porosity is generally higher than 10% due to lack of

stable and continuous macropores. Thus, Bakker et al.

(1987, cit. by Boone and Veen, 1994) found that the

diffusion coef®cient approached zero at a consider-

ably higher air-®lled porosity in sand than in clay, and

LindstroÈm (1990) reported that the air-®lled porosity

had to be as high as 30% in a sandy loam for the air

permeability to become adequate, while about 10%

was suf®cient in some clay soils. SteÎpniewski (1981)

observed that the oxygen diffusion coef®cient

approached zero at a higher air-®lled porosity in a

soil with 8% clay than in three soils with 19±30% clay.

These results indicate that the critical limit of air-

®lled porosity will be higher than 10% in many sandy

soils. On the other hand, in these soils the line for 10%

air-®lled porosity will often be found in a lower

position than that indicated in Fig. 5. This is the case

for the sandy soils shown in Fig. 4, particularly in the

soil with the lowest clay content. Similar results were

reported by da Silva et al. (1994). Therefore, the

critical limit of air-®lled porosity may still fall in a

Fig. 5. Schematic diagram showing how a soil air content of 10%

(v/v) and a penetration resistance of 3 MPa, usually regarded as

critical limits with respect to plant growth, are related to the degree

of compactness and matric water tension of the plough layer

(excluding the seedbed). As demonstrated in field experiments,

problems for crop growth occur even in the upper left corner of the

diagram, and it is supposed that these are mainly caused by low

unsaturated hydraulic conductivity and/or poor root-to-soil contact.

I. HaÊkansson, J. Lipiec / Soil & Tillage Research 53 (2000) 71±85 77

position similar to that in Fig. 5, except for very coarse

sandy soils.

Even the critical limit for penetration resistance in

disturbed soil layers may vary slightly between soils,

but these relations still seem to be poorly known

(Bengough and Mullins, 1990). Probably the critical

limit is usually lower in sandy soils than in clay soils,

because of the differences in soil structure. The studies

of stained pores by Lipiec and HaÊkansson (2000)

indicate that compaction may reduce not only the

volume of macropores but also their continuity. This

may in¯uence the critical limits of both penetration

resistance and air-®lled porosity and render them less

general. In addition, as the matric water tension

increases, the critical limit for penetration resistance

decreases and may approach zero (the roots wilt) at a

tension of 1500 kPa (Dexter, 1987; da Silva et al.,

1994).

As indicated above, crop responses to excessive soil

compaction can largely be explained by the relations

illustrated in Fig. 5. However, the degree of compact-

ness in¯uences many growth factors besides those

illustrated in this ®gure, and this may presumably

affect the crop response curves, at least in speci®c

situations.

3.3. Reason for problems in too loose soils

Numerous ®eld experiments show that crop growth

is reduced not only in excessively compacted soils but

also in very loose soils, particularly when the growing

season, or at least the ®rst part of it, is dry. Therefore,

there are some problems for the crops even in the

shaded, upper left corner of the diagram (Fig. 5). Less

information is available on the nature of these pro-

blems, but experience from ®eld experiments indi-

cates that even these problems are similar in most

soils. One of the problems seems to be low unsaturated

hydraulic conductivity (Kemper et al., 1971). Thus,

Lipiec and Tarkiewicz (1988) reported that the

hydraulic conductivity of a loamy sand at high matric

water tension was low in loose soil, which limited the

water supply to plants in soils with a low root density.

Another problem is poor root-to-soil contact (Kooistra

et al., 1992; Lipiec et al., 1993). Both low unsaturated

hydraulic conductivity and poor root-to-soil contact

may negatively in¯uence uptake of water and nutrients

(Veen et al., 1992). The problems for the plants in this

corner of the diagram (Fig. 5) would deserve com-

prehensive investigations, but are probably very com-

plicated.

3.4. Influences of various weather conditions

From Fig. 5 it can be concluded that the crop

response to the state of compactness of a soil can

only be understood if the dynamics of the moisture

conditions throughout the growing season is also

considered. This may explain the experimental results

showing that the D-value optimal with respect to crop

growth has varied considerably between years (Fig. 1).

From several investigations it seems as if the optimal

state of soil compactness usually is higher in years

with a continuously dry than in years with a continu-

ously wet growing season (HaÊkansson, 1966; Edling

and Fergedal, 1972; Voorhees et al., 1985; Voorhees,

1987). However, Lipiec and Simota (1994) quoted

several examples with opposite results. Furthermore,

in the extensive Swedish series of ®eld experiments

(Fig. 1) no simple and consistent rules for the in¯u-

ence of the mean weather conditions during the whole

growing season on the optimal D-value were found,

probably because of variations in conditions during

the seasons. In many cases, the conditions during some

short critical period may have been the most decisive.

4. Relations between external loading anddegree of compactness

A D-value of 100 indicates the densest state that can

be attained in the laboratory when a uniaxial stress of

200 kPa is applied to a soil that is previously loosened

in a way similar to that of soil tillage. The type of

loading by a wheel in the ®eld resembles to same

degree that of the uniaxial loading. Therefore, in all

soils, it can be assumed that a D-value slightly higher

than 100 is the highest that can be induced in the

plough layer by wheel traf®c that causes a maximal

vertical, normal stress in the soil of 200 kPa. If the

stress is lower/higher, the highest possible D-value is

also lower/higher. However, the D-value will also be

affected by several other factors such as soil water

content, wheel slip, vibration and number and duration

of loading events. Nevertheless, the resulting D-value

after a certain number of passes by a certain machine

78 I. HaÊkansson, J. Lipiec / Soil & Tillage Research 53 (2000) 71±85

with a given axle load and ground contact stress

will be rather similar in all soils, provided the

moisture conditions are comparable. A certain altera-

tion of the moisture conditions at the time of traf®c

also alters the compaction effects similarly in most

soils, provided the moisture conditions are suitably

characterized.

The statements in the previous paragraph are based

on results obtained by Ljungars (1977), Lipiec et al.

(1991), Etana (1995) and Arvidsson (1997). In all

these studies the same number of passes by machines

of the same type at comparable moisture conditions in

the spring resulted in very similar D-values in the

plough layer of soils with very different textures.

Arvidsson (1997) even showed that a compression

index calculated on the basis of tractor traf®c in the

®eld did not increase with the clay content, while a

traditional uniaxial laboratory test on the same soils, in

agreement with many other laboratory investigations,

resulted in a compression index that increased sub-

stantially with the clay content. Arvidsson (1997)

suggested several possible reasons for the discrepancy

between the laboratory and ®eld results, but probably

the main reason was a difference in loading time.

In ®eld investigations in several Swedish autumn

ploughed soils, Ljungars (1977) studied the effects of

tractor traf®c in spring on the degree of compactness

of the layer between sowing depth and ploughing

depth (about 4±24 cm). Examples of his results are

given in Fig. 6, which shows the D-value after 1, 3 and

9 passes by a 4.03 Mg tractor in a clay soil and in a ®ne

sandy loam at four moisture situations. These situa-

tions represent the range encountered in practice dur-

ing seedbed preparation in spring at the actual sites

and were subjectively classi®ed as wet, moist, normal

and dry. At the intermediate water contents the D-

values were similar in both soils, but alteration of the

water content in¯uenced the D-values in the clay soil

much more than in the ®ne sandy loam. This was

probably because the same alteration of the water

content, within the actual moisture range, in¯uenced

the matric water tension much more in the former soil

than in the latter. Unfortunately, however, the matric

tension was not measured.

da Silva et al. (1997) investigated the effects of

tillage, wheel traf®c, soil texture and organic matter

content on dry bulk density and relative bulk density

(determined in nearly the same way as the degree of

compactness) as characteristics of the state of soil

compactness. While dry bulk density was strongly

in¯uenced by all these factors, the use of the relative

bulk density virtually eliminated the effects of soil

texture and organic matter content and enhanced the

effects of soil tillage and machinery traf®c.

It can be concluded that various factors related to

the ®eld traf®c affect the D-value in the plough layer

very similarly in all soils with only moderate and

probably rather consistent differences between various

textural groups. It would be of great interest to system-

atically study these differences.

Fig. 6. Degree of compactness of the plough layer (excluding the seedbed) as a function of soil water content in two Swedish autumn

ploughed fields after 1, 3 and 9 passes in spring by a 4.03 Mg tractor (rear axle 3.03 Mg, tyres 12.4 � 36''; front axle 1.00 Mg, tyres

7.50 � 16''). The D-values are means for two inflation pressures in the rear tyres (150 and 70 kPa). In both cases, inflation pressure in the front

tyres was 110 kPa. In each field, traffic was applied at four moisture situations, subjectively classified as (from right to left) wet, moist, normal

and dry. Bars show mean standard error for individual data points. (After Ljungars, 1977).

I. HaÊkansson, J. Lipiec / Soil & Tillage Research 53 (2000) 71±85 79

From the studies by Etana et al. (1997) it can be

derived that the use of matric water tension to

characterize the soil moisture situation probably

results in more general relations than the use of

soil water content. In Fig. 7 the data from Fig. 3 in

Etana et al. (1997) were redrawn with the use of matric

tension rather than water content to characterize the

moisture situation. The D-values presented in this

®gure were obtained by short-term loading, whereas

the reference test was made by long-term loading.

Therefore, the maximum D-values after the same

stress as in the reference test (200 kPa) was less than

100.

When presented as in Fig. 7, the groups of curves

for different soils show considerably greater simila-

rities than the original groups of curves (Fig. 3 in

Etana et al., 1997). However, it cannot be excluded

that some more sophisticated method to characterize

the moisture conditions may result in still greater

similarities. The results in Fig. 7 indicate that the

two soils in Fig. 6 might also have shown more similar

results if matric tension instead of water content had

been used to characterize the moisture situation.

It appears possible to go one step further and

combine the groups of curves for the individual soils

in Fig. 7 into a common diagram, provided this

diagram covers a suf®ciently wide range of stresses

and D-values. An effort of that kind is made in Fig. 8.

From one curve to the next in this diagram the stress is

doubled. However, the scales on the axes must be

adjusted to ®t the individual soils. One of the curves

(a) with the stress �a reaches the D-axis at a right angle

at D � Da. Consequently, �a and Da would be two

important characteristics of the curve system. For

instance, both of them are much higher for the sandy

loam than for the heavy clay. The area in the diagram

can be divided into four sections. In Section I, D is

linearly related to the log of stress and to the matric

tension. The distance, �D, between the parallel curves

(larger for clay than for sandy loam) and their slopes

would be two other important characteristics. The

same is true for the positions and slopes of the lines

Fig. 7. Degree of compactness obtained after short-term loading of large samples from the plough layer of light clay, heavy clay, humus-rich

clay and sandy loam with different matric water tensions by a series of uniaxial stresses (25±400 kPa, loading time 20 s, followed by

unloading). Data from Fig. 3 in Etana et al. (1997) are redrawn here using matric tension rather than water content to characterize the soil

moisture situation.

80 I. HaÊkansson, J. Lipiec / Soil & Tillage Research 53 (2000) 71±85

delimiting Section I. In Section II, the linearity is

broken and the compaction is limited because of a

high water saturation (>90%). In Sections III and IV

the relations are non-linear for other reasons. It will

probably be possible to ®nd rather simple and con-

sistent relations between soil texture and organic

matter content on one hand and the individual para-

meters that characterize the curve system in this

diagram on the other. This, however, requires an

extensive study. Furthermore, as indicated by Arvids-

son (1997) the parameters may differ between tradi-

tional compaction tests in the laboratory and wheel

induced compaction in the ®eld.

For simplicity, the curves in Fig. 7 were drawn

without considering the changes in matric tension that

occurred as a result of compaction (Etana et al., 1997).

Instead, the tension measured after application of the

lowest uniaxial stress (25 kPa) was used throughout

the diagrams. In reality, in situations falling in Section

I of Fig. 8, the tension usually increased when stresses

increased, whereas in Section II it decreased. Further-

more, no compensation was made for the effects of

swelling/shrinking of the soils with changing water

content (compare Section VII). The D-values in the

diagrams were calculated using bulk density at the

existing water content. To make the D-values of

swelling/shrinking soils fully comparable, ideally they

should have been adjusted for changes in bulk density

that would have occurred if all soil samples after

compaction had been brought to the same matric water

tension, e.g., to ®eld capacity. Then, swelling would

have reduced the bulk density and D-values in the drier

soils and shrinking would have increased these values

in the wetter soils. If the two factors mentioned in this

paragraph had been considered, some of the diagrams

would have been considerably distorted.

Results and discussions above indicate that it is

easier to model machinery-induced compaction of the

plough layer in terms of degree of compactness than in

terms of bulk density. The results will also be less site-

speci®c, and therefore, more generally applicable.

They can also be more directly used to estimate crop

responses. This approach was used in the model by

Arvidsson and HaÊkansson (1991), which is probably

the only model available today that goes all the way

from machinery traf®c to crop response.

5. Alternative methods to determine referencebulk density values

We have argued that the degree of compactness is a

useful parameter in studies of soil and crop responses

to machinery traf®c and facilitates generalization of

the results. However, as discussed by HaÊkansson

(1990), relative bulk density values based on some

other reference test may offer similar advantages. It

would be of great interest to compare the positions of

critical limits for aeration and penetration resistance

when using alternative reference tests. The bulk den-

sity values obtained by a standard Proctor test is higher

than the values obtained by the uniaxial reference test

at a stress of 200 kPa. In the study by HaÊkansson

(1990) with six soils of various textures, the values

obtained by a Proctor test with an impact energy of

2.6 MJ mÿ3 was between 7 and 17% higher than those

obtained by the uniaxial reference test at a stress of

200 kPa. Unfortunately, the differences between the

soils in this respect were too large to be disregarded.

Therefore, it is of importance to decide which of these

two tests or other possible reference tests should be

used.

The reference test that results in the greatest simi-

larities between soils in the positions of the critical

limits of air-®lled porosity and penetration resistance

in a diagram similar to that in Fig. 3 seems to be the

most useful one in agricultural applications, but the

Fig. 8. A conceptual diagram showing how the groups of curves

for the soils in Fig. 7 can be combined into one diagram provided

this covers a sufficiently wide range of matric tensions, soil

densities and stresses.

I. HaÊkansson, J. Lipiec / Soil & Tillage Research 53 (2000) 71±85 81

®nal choice should be supported by an extensive ®eld

experimentation under various soil and moisture con-

ditions. However, as compared with the uniaxial test

with a stress of 200 kPa no great improvement seems

to be possible.

6. Use of the degree-of-compactness concept inundisturbed soil layers

So far, the degree-of-compactness concept has gen-

erally been used only for layers annually loosened by

tillage. However, it may be useful for untilled layers,

such as the subsoil or the surface layer under no-till, as

well. In such case, however, some alterations of the

pretreatment of the soil samples for the reference test

and of the procedure for this test may be required. To

get accurate and reproducible values it seems neces-

sary to make sure that a non-negligible part of the soil

after pretreatment does not have an aggregate density

that is greater than the bulk density that can be

obtained by the stress applied in the test. Furthermore,

it must be noted that the critical limits of air-®lled

porosity and penetration resistance, and consequently,

the relations between D and crop growth, probably

differ between undisturbed and annually disturbed

soils. The main reason would be a better continuity

and stability of the macropores in undisturbed soils.

The great signi®cance of continuous and stable

macropores such as biopores, interpedal voids or

dessication cracks for the root growth as well as for

gas, water and solute transport has been shown by

many authors (e.g., Allmaras et al., 1988; Hatano and

Sakuma, 1990; Edwards et al., 1992; Whalley and

Dexter, 1994) and may be advantageous in many

respects, e.g., from the point of view of N conservation

(Lipiec and SteÎpniewski, 1995). Among the macro-

pores, biopores may be the most resistant to vertical

compression. The improved macropore continuity and

stability in undisturbed soils lead to a reduction of the

critical limit of air-®lled porosity in undisturbed as

compared to disturbed soil (Boone et al., 1986; Lind-

stroÈm and McAfee, 1989), even though part of the soil

may be water-®lled and anoxic (Zausig et al., 1993).

Continuous and stable macropores through a hard

layer may also enable root growth, while the strength

of the soil matrix is too high for root penetration. This

will move the critical limit of penetration resistance to

a higher value (e.g., Ehlers et al., 1983). On the other

hand, when a soil layer is no longer disturbed, age-

hardening may gradually increase soil strength as

measured with a penetrometer (Dexter et al., 1988).

This would, for instance, move the position of the

3 MPa line in Fig. 5 downwards, but is probably less

important than the increase in the critical value.

Therefore, it may be supposed that the critical limits

for both air-®lled porosity and penetration resistance

will generally move in such a way that the require-

ments of the plants are met at higher D-values in

untilled than in tilled soils. This means that the

unshaded area in Fig. 5 is widened, and probably

more so in clay soils than in sandy soils because of

the differences in structure between these groups of

soils. It also means that the curve showing the crop

yield as a function of D is ¯atter in untilled than in

tilled soil.

These suppositions are supported by many reports

in the literature that demonstrate that reduced tillage

often results in good crop growth, even when soil bulk

density is considerably higher than in a system with

annual ploughing. This seems to particularly apply to

soils with intermediate to high clay content and less to

coarse-textured soils (Rydberg, 1992). Thus, both

Rydberg (1987), Comia et al. (1994) and Etana et

al. (1999) showed that good crop growth was obtained

in ®ne-textured soils even when the D-value in the

deeper parts of a previous plough layer after reduction

of the tillage depth was as high as 95±106. It may be

hypothesized that the optimal degree of compactness

in an undisturbed soil is similar to that in a disturbed

soil, but that a higher degree of compactness is less

negative, particularly in ®ne-textured soils, because of

the better macropore continuity. If the positions of the

critical limits in various soils under tilled and untilled

conditions were systematically compared and possible

problems with the reference test solved, the applic-

ability of the degree-of-compactness concept could

probably be extended to untilled soil layers such as the

topsoil under permanent grass or direct drilling, or

even the subsoil. This, however, would require further

studies.

7. Problems of soil swelling/shrinking whendetermining the degree of compactness

In swelling/shrinking soils, the water content in¯u-

ences the bulk density. Bulk density changes caused

82 I. HaÊkansson, J. Lipiec / Soil & Tillage Research 53 (2000) 71±85

by changes in water content are largely reversible, and

ideally, the D-value should not be in¯uenced by the

reversible part of the bulk density changes. There are

two possibilities to achieve this. The method used with

reasonable success by HaÊkansson (1990) was to deter-

mine the bulk density in the ®eld at a standardized

moisture condition which was as close to ®eld capa-

city as possible. In the ®eld, however, the situation

cannot be completely standardized because of the

spatial and temporal variations in moisture conditions,

the hysteresis effects involved, and the fact that swel-

ling takes time. Another possibility might be to deter-

mine the bulk density at an arbitrary moisture state but

correct the value with respect to the deviation from the

standardized condition. However, such methods have

not been developed, yet this problem is very impor-

tant.

The swelling/shrinking problem is not limited to the

case when the state of soil compactness is character-

ized by the degree of compactness. It is just as large

when bulk density or porosity are directly used. In

many investigations reported in the literature, how-

ever, it is disregarded, and this has probably often led

to misinterpretations of the results, e.g., when tem-

poral changes in bulk density in long-term ®eld

experiments are reported.

To some extent, the magnitude of the problem

depends on the method of bulk density determination.

For instance, when carrying out core sampling, wide

desiccation cracks are probably usually avoided. This

means that the bulk density values obtained are in¯u-

enced by the swelling/shrinking not only in the ver-

tical direction but also in the horizontal. When using

large samples such as in the frame sampling technique

(HaÊkansson, 1990), desiccation cracks are included in

the samples, and only the vertical swelling/shrinking

in¯uences the results. However, even this may have

great importance.

8. Conclusions

Whereas the bulk density and porosity optimal for

crop growth vary considerably between soils, the

optimal degree of compactness of annually disturbed

soils is virtually independent of soil texture and

organic matter content. The main reason is that critical

limits of penetration resistance and air-®lled porosity

are related to the degree of compactness and matric

water tension in a very similar way in most soils.

Therefore, the degree of compactness is a more useful

parameter than bulk density or porosity in studies of

biological effects of soil compaction. It is also more

useful in studies of the effects of ®eld traf®c on soil

conditions. Whereas bulk density and porosity of the

plough layer induced by a certain number of passes by

a particular machine vary considerably between soils,

the degree of compactness is very similar, provided the

moisture situation is comparable. Therefore, this para-

meter can form a useful link between studies within

various parts of the casual chain: machinery traf®c±

soil compactness±soil properties±crop growth. It can

also facilitate the modelling of soil and crop responses

to ®eld traf®c. It seems possible to extend the use of

the degree-of-compactness concept to soil layers not

annually disturbed by tillage, but this would require

further methodological studies. When using bulk den-

sity or any parameter derived from this, such as the

degree of compactness, to characterize the state of soil

compactness in swelling/shrinking soils, attention

must be payed to the soil moisture content.

References

Allmaras, R.R., Kraft, J.M., Miller, D.E., 1988. Effects of soil

compaction and incorporated crop residue on root health. Ann.

Rev. Phytopathol. 26, 219±243.

Arvidsson, J., 1997. Soil compaction in agriculture Ð from soil

stress to plant stress. Ph.D. Thesis. Acta Universitatis

Agriculturae Sueciae, Agraria 41. Swedish University of

Agricultural Sciences, Uppsala, 146 pp.

Arvidsson, J., HaÊkansson, I., 1991. A model for estimating crop

yield losses caused by soil compaction. Soil Till. Res. 20, 319±

332.

Bakker, J.W., Boone, F.R., Boekel, P., 1987. Diffusion of gases in

soil and oxygen diffusion coefficients in Dutch arable soils.

Institute of Land Water Management Research (ICW),

Wageningen, The Netherlands, Report 20, 44 pp. (in Dutch).

Bengough, A.G., Mullins, C.E., 1990. Mechanical impedance to

root growth: a review of experimental techniques and root

growth responses. J. Soil Sci. 41, 341±358.

Boone, F.R., 1986. Towards soil compaction limits for crop growth.

Neth. J. Agric. Sci. 34, 349±360.

Boone, F.R., 1988. Weather and other environmental factors

influencing crop responses to tillage and traffic. Soil Till.

Res. 11, 283±324.

Boone, F.R., van der Werf, H.M.G., Kroesbergen, B., ten Hag,

B.A., Boers, A., 1986. The effect of compaction of the arable

layer in sandy soils on the growth of maize for silage. 1.

I. HaÊkansson, J. Lipiec / Soil & Tillage Research 53 (2000) 71±85 83

Critical matric water potentials in relation to soil aeration and

mechanical impedance. Neth. J. Agric. Sci. 34, 155±171.

Boone, F.R., Veen, B.W., 1994. Mechanisms of crop responses to

soil compaction. In: Soane, B.D., van Ouwerkerk, C. (Eds.),

Soil Compaction in Crop Production. Elsevier, Amsterdam, pp.

237±264.

Cannell, R.Q., Jackson, M.B., 1981. Alleviating aeration stresses.

In: Arkin, G.F., Taylor, H.M. (Eds.), Modifying the root

environment to reduce crop stress. ASAE Monograph No. 4,

pp. 141±192.

Carter, M.R., 1990. Relative measures of soil bulk density to

characterize compaction in tillage studies on fine sandy loams.

Can. J. Soil Sci. 70, 425±433.

Comia, R.A., Stenberg, M., Nelson, P., Rydberg, T., HaÊkansson, I.,

1994. Soil and crop responses to different tillage systems. Soil

Till. Res. 29, 335±355.

da Silva, A.P., Kay, B.D., Perfect, E., 1994. Characterization of the

least limiting water range of soils. Soil Sci. Soc. Am. J. 58,

1775±1781.

da Silva, A.P., Kay, B.D., Perfect, E., 1997. Management versus

inherent soil properties effects on bulk density and relative

compaction. Soil Till. Res. 44, 81±93.

Dexter, A.R., 1987. Mechanics of root growth. Plant Soil 98, 303±

312.

Dexter, A.R., Horn, R., Kemper, W.D., 1988. Two mechanisms of

age-hardening of soil. J. Soil Sci. 39, 163±175.

Drew, M.C., 1990. Growth under oxygen stress. In: Waisel, Y.,

Eshel, A., Kafkafi, U. (Eds.), Plant Roots. The Hidden Half.

Marcel Dekker, New York, pp. 331±350.

Edling, P., Fergedal, L., 1972. Experiments on soil compaction

1968±69. Agricultural College of Sweden, Uppsala, Division of

Soil Management, Report 31, 71 pp. (in Swedish).

Edwards, W.M., Shipitalo, M.J., Dick, W.A., Owens, L.B., 1992.

Rainfall intensity affects transport of water and chemicals

through macropores in no-till soil. Soil Sci. Soc. Am. J. 56, 52±

58.

Ehlers, W., KoÈpke, U., Hesse, F., BoÈhm, W., 1983. Penetration

resistance and root growth of oats in tilled and untilled loess

soil. Soil Till. Res. 3, 261±275.

Eriksson, J., HaÊkansson, I., Danfors, B., 1974. The effect of soil

compaction on soil structure and crop yields. Swedish Institute

of Agricultural Engineering, Uppsala, Report 354, 82 pp. (in

Swedish; Transl., Aase, J.K., U.S.D.A.±A.R.S., Washington,

DC, USA).

Etana, A., 1995. Compaction effects of mechanical stress on some

Swedish arable soils. Ph.D. Thesis. Reports and Dissertations

24. Department of Soil Science, Swedish University of

Agricultural Sciences, Uppsala, 110 pp.

Etana, A., Comia, R.A., HaÊkansson, I., 1997. Effects of uniaxial

stress on the physical properties of four Swedish soils. Soil

Till. Res. 44, 13±21; Erratum 1999, Soil Till. Res. 50, 177±

183.

Etana, A., HaÊkansson, I., Zagal, E., BucÏas, S., 1999. Effects of

tillage depth on organic carbon content and physical properties

in five Swedish soils. Soil Till. Res. 52, 129±139.

GlinÂski, J., SteÎpniewski, W., 1985. Soil Aeration and Its Role for

Plants. CRC Press, Boca Raton, FL, 200 pp.

Grath, T., 1996. Effects of agricultural machinery traffic on pea

growth and penetration resistance in the subsoil. Ph.D.Thesis.

Acta Universitatis Agriculturae Sueciae, Agraria 8 134 pp.

HaÊkansson, I., 1965. Studies into the structure of the topsoil in a

field with an uneven crop. GrundfoÈrbaÈttring 18, 121±136 (in

Swedish with English summary).

HaÊkansson, I., 1966. Experiments with different degrees of

compaction in the topsoil and upper part of the subsoil.

GrundfoÈrbaÈttring 19, 281±332 (in Swedish with English

summary).

HaÊkansson, I., 1973. The sensitivity of different crops to soil

compaction. In: Sixth International Conference on Soil Tillage,

Wageningen, The Netherlands, 24±29 September 1973. Sum-

maries, pp. 14:1±4.

HaÊkansson, I., 1983. On the reasons for influences of machinery

traffic on crop yield. In: Proceedings of the Symposium: Zmeny

Pudniho Prostredi ve vztahu k intenzifikacnim faktorum. Dum

techniky CSVTS Ceske Budejovice, Brno, pp. 57±66 (in

German).

HaÊkansson, I., 1986. Review of soil compaction problems in

agriculture on the basis of Swedish research. Report 71.

Division of Soil Management, Swedish University of Agricul-

tural Sciences, Uppsala, pp. 5±19.

HaÊkansson, I., 1990. A method for characterizing the state of

compactness of the plough layer. Soil Till. Res. 16, 105±120.

HaÊkansson, I., 1992. The degree of compactness as a link between

technical, physical and biological aspects of soil compaction.

In: Proceedings of the International Conference on Soil

Compaction and Soil Management, Tallinn, Estonia, 8±12 June

1992. Estonian Institute of Agriculture and Land Improvement,

Saku, Estonia, pp. 75±78.

HaÊkansson, I., Voorhees, W.B., Riley, H., 1988. Vehicle and wheel

factors influencing soil compaction and crop response in

different traffic regimes. Soil Till. Res. 11, 239±282.

Hatano, R., Sakuma, T., 1990. The role of macropores on rooting

pattern and movement of water and solutes in various field

soils. Transactions of the 14th International Congress on Soil

Science, vol. II, pp. 130±135.

Heinonen, R., 1985. Soil management and crop water supply.

Department of Soil Science, Swedish University of Agricultural

Sciences, Uppsala, 105 pp.

Kemper, W.D., Stewart, B.A., Porter, L.K., 1971. Effects of

compaction on soil nutrient status. In: Barnes, K.K., Charleton,

W.M., Taylor, H.M., Throckmorton, R.I., Vanden Berg, G.E.

(Eds.), Compaction in Agricultural Soils. American Society of

Agricultural Engineering, St. Joseph, MI, pp. 178±189.

Kooistra, M.J., Schoonderbeck, D., Boone, F.R., Veen, B.W., van

Noordwijk, M., 1992. Root-soil contact of maize, as measured

by a thin-section technique. Plant Soil 139, 119±129.

LindstroÈm, J., 1990. Methods for measurement of soil aeration.

Ph.D.Thesis. Reports and Dissertations 5. Department of

Soil Science, Swedish University of Agricultural Sciences,

151 pp.

Lipiec, J., HaÊkansson, I., Tarkiewicz, S., Kossowski, J., 1991. Soil

physical properties and growth of spring barley as related to

the degree of compactness of two soils. Soil Till. Res. 19, 307±

317.

84 I. HaÊkansson, J. Lipiec / Soil & Tillage Research 53 (2000) 71±85

Lipiec, J., HaÊkansson, I., 2000. Influences of degree of compact-

ness and matric water tension on some important plant growth

factors. Soil Till. Res. 53, 87±94.

Lipiec, J., Ishioka, T., Hatano, R., Sakuma, T., 1993. Effect of

structural discontinuity on root and shoot growth and water use

of maize. Plant Soil 157, 65±74.

Lipiec, J., Ishioka, T., Szustak, A., Pietrusiewicz, J., SteÎpniewski,

W., 1996. Effects of soil compaction and transient oxygen

deficiency on growth, water use and stomatal resistance of

maize. Acta Agric. Scand., B: Soil Plant Sci. 46, 186±191.

LindstroÈm, J., McAfee, M., 1989. Aeration studies on arable soil. 2.

The effect of a grass ley or cereal on the structure of a heavy

clay. Swedish J. Agric Res. 19, 155±161.

Lipiec, J., Simota, C., 1994. Role of soil and climate factors in

influencing crop responses to soil compaction in Central and

Eastern Europe. In: Soane, B.D., van Ouwerkerk, C. (Eds.),

Soil Compaction in Crop Production. Elsevier, Amsterdam, pp.

365±390.

Lipiec, J., SteÎpniewski, W., 1995. Effects of soil compaction and

tillage systems on uptake and losses of nutrients. Soil Till. Res.

35, 37±52.

Lipiec, J., Tarkiewicz, S., 1988. Hydraulic resistance of soil in

relation to its density. Pol. J. Soil Sci. XXI(1), 1±6.

Ljungars, A., 1977. Importance of different factors on soil

compaction by tractors. Measurements in 1974±1976. Report

52. Division of Soil Management, Agricultural College of

Sweden, Uppsala, 43 pp. (in Swedish with English summary).

McAfee, M., LindstroÈm, J., Johansson, W., 1989. Effects of pre-

sowing compaction on soil physical properties, soil atmosphere

and growth of oats on a clay soil. J. Soil Sci. 40, 707±717.

Petelkau, H., 1984. Effects of harmful compaction on soil

properties and crop yields and measures to reduce compaction.

Tagungsber. Akad. Landwirtsch, Wiss. Berlin 227, 25±34 (in

German with English summary).

Pidgeon, J.D., Soane, B.D., 1977. Effects of tillage and direct

drilling on soil properties during the growing season in a long-

term barley mono-culture system. J. Agric. Sci. Camb. 88, 431±

442.

Riley, H., 1983. Relations between soil density and cereal yield.

Forsk. Fors. Landbruket 34, 1±11 (in Norwegian with English

summary).

Riley, H., 1988. Cereal yields and soil physical properties in re-

lation to the degree of compactness of some Norwegian soils. In:

Proceedings of the 11th Conference of International Soil Tillage

Research Organisation, vol. 1, Edinburgh, UK, pp. 109±114.

Rydberg, T., 1987. Studies in ploughless tillage in Sweden 1975±

1986. Report 76. Division of Soil Management, Swedish

University of Agricultural Sciences, Uppsala, 129 pp. (in

Swedish, with English summary).

Rydberg, T., 1992. Ploughless tillage in Sweden. Results and

experiences from 15 years of field trials. Soil Till. Res. 22,

253±264.

Sojka, R.E., 1992. Stomatal closure in oxygen-stressed plants. Soil

Sci. 154, 269±280.

Stenberg, M., HaÊkansson, I., von PolgaÂr, J., Heinonen, R., 1995.

Sealing, crusting and hardsetting soils in Sweden Ð occur-

rence, problems and research. In: So, B.H., Smith, G.D., Raine,

S.R., Schafer, B.M., Loch, R.J. (Eds.), Proceedings of the

Second International Symposium on Sealing, Crusting and

Hardsetting Soils: Productivity and Conservation. The Uni-

versity of Queensland, Brisbane, Australia, pp. 287±292.

SteÎpniewski, W., 1981. Oxygen diffusion and strength as related to

soil compaction. II. Oxygen diffusion coefficient. Pol. J. Soil

Sci. XIV(1), 3±13.

Topp, G.C., Reynolds, W.D., Cook, F.J., Kirby, J.M., Carter, M.R.,

1997. Physical attributes of soil quality. In: Gregorich, E.G.,

Carter, M.R. (Eds.), Soil Quality for Crop Production and

Ecosystem Health, Developments in Soil Science. Elsevier,

Amsterdam, vol. 25, pp. 21±58.

van Wijk, A.L.M., Beuving, J., 1984. Relative density: a

characterization of the degree of compaction of soils.

Zeitschrift fuÈr Vegetationstechnik 7 (July±September), 90±

94.

Veen, B.W., van Noordwijk, M., de Willigen, P., Boone, F.R.,

Kooistra, M.J., 1992. Root-soil contact of maize, as measured

by a thin-section technique. Plant Soil 139, 131±138.

Voorhees, W.B., 1987. Influence of compaction on plant growth.

In: Proceedings of the Fertilizer, Aglime and Pest Management

Conference. University of Wisconsin, Madison, WI, vol. 26, pp.

151±160.

Voorhees, W.B., Evans, S.D., Warnes, D.D., 1985. Effect of

preplant wheel traffic on soil compaction, water use, and

growth of spring wheat. Soil Sci. Soc. Am. J. 49, 215±220.

Whalley, W.R., Dexter, A.R., 1994. Root development and

earthworm movement in relation to soil strength and structure.

Arch. Acker- Pfl. Boden 38, 1±40.

Zausig, J., SteÎpniewski, W., Horn, R., 1993. Oxygen concentration

and redox potential gradients in unsaturated model soil

aggregates. Soil Sci. Soc. Am. J. 57, 908±916.

I. HaÊkansson, J. Lipiec / Soil & Tillage Research 53 (2000) 71±85 85


Recommended