REVIEW Applications of microarrays to histopathology M van de Rijn & C B Gilks 1 Department of Pathology, Stanford University Medical Center, Stanford, CA, USA, and 1 Genetic Pathology Evaluation Center of the Department of Pathology and Prostate Centre, Vancouver General Hospital, British Columbia Cancer Agency and University of British Columbia, Vancouver, BC, Canada van de Rijn M & Gilks C B (2004) Histopathology 44, 97–108 Applications of microarrays to histopathology High-throughput microarray technologies have the potential to impact significantly on the practice of histopathology over the coming years. Global gene expression profiling allows for a systematic search of all human genes for novel diagnostic and prognostic markers and for potential therapeutic targets. Likewise, gene copy number changes can be determined on a gene-by-gene basis using microarrays. Tissue micro- arrays are an efficient method to extend and validate the findings obtained from the initial ‘discovery’ phase of the research, done using cDNA microarrays. In addition, tissue microarrays can be used for quality assurance for immunohistochemical and in situ hybrid- ization procedures. In this review we give a brief overview of microarray technology and research uses, and discuss potential applications of microarrays in the practice of diagnostic histopathology. Keywords: gene arrays, in situ hybridization, tissue microarrays Technology Gene microarray technology rests on the ability to deposit many (tens of thousands) different DNA sequences on a small surface, usually a glass slide (often referred to as a ‘chip’). The different DNA fragments are arranged in rows and columns such that the identity of each fragment is known through its location on the array. A variety of methods exist to deposit these DNA sequences on the chip and these are discussed in detail elsewhere. 1–3 Once synthesized, these chips can be used to measure the mRNA expression levels for tens of thousands of genes from a tissue sample by hybridizing fluorescently labelled cDNA from that tissue to the chip (Figure 1a). The ability to measure, in principle, the expression of all human genes in a single experiment is an enormous increase over the previously available techniques for measuring gene expression [Northern blot, reverse transcriptase-polymerase chain reaction (RT-PCR)], where only a few genes could be studied per experi- ment. Such ‘global expression profiling’ not only looks at orders of magnitude more genes than was possible previously, but also has the advantage that the genes examined are not influenced by preselection of genes. An analogy would be looking for microorganisms by PCR compared with streaking a sample on a culture plate; the former will only identify organisms specific- ally sought with the primer sets used, while the second approach is restricted only by the organism’s ability to grow under the conditions chosen. The study of the expression of most, if not all, genes in a specimen is not hypothesis-driven as most research used to be, 1 but is instead referred to as ‘discovery-type research’ or, in a less flattering description, as ‘fishing expeditions’. Whereas cDNA derived from a tumour is hybridized to a chip to study gene expression levels, alterations in DNA copy number (gene amplification or deletion) can be measured by hybridizing fluorescently labelled DNA from a tumour specimen to these chips. 4,5 This technique is also applicable to DNA isolated from formalin-fixed paraffin-embedded material 6 and Address for correspondence: M van de Rijn MD, Department of Pathology, Stanford University Medical Center, 300 Pasteur Drive, Stanford, CA 94305, USA. e-mail: [email protected]Ó 2004 Blackwell Publishing Limited. Histopathology 2004, 44, 97–108
Transcript
REVIEW
Applications of microarrays to histopathology
M van de Rijn & C B Gilks1
Department of Pathology, Stanford University Medical Center, Stanford, CA, USA, and 1Genetic Pathology Evaluation
Center of the Department of Pathology and Prostate Centre, Vancouver General Hospital, British Columbia Cancer Agency
and University of British Columbia, Vancouver, BC, Canada
van de Rijn M & Gilks C B
(2004) Histopathology 44, 97–108
Applications of microarrays to histopathology
High-throughput microarray technologies have thepotential to impact significantly on the practice ofhistopathology over the coming years. Global geneexpression profiling allows for a systematic search of allhuman genes for novel diagnostic and prognosticmarkers and for potential therapeutic targets. Likewise,gene copy number changes can be determined on agene-by-gene basis using microarrays. Tissue micro-arrays are an efficient method to extend and validate
the findings obtained from the initial ‘discovery’ phaseof the research, done using cDNA microarrays. Inaddition, tissue microarrays can be used for qualityassurance for immunohistochemical and in situ hybrid-ization procedures. In this review we give a briefoverview of microarray technology and research uses,and discuss potential applications of microarrays in thepractice of diagnostic histopathology.
Keywords: gene arrays, in situ hybridization, tissue microarrays
Technology
Gene microarray technology rests on the ability todeposit many (tens of thousands) different DNAsequences on a small surface, usually a glass slide(often referred to as a ‘chip’). The different DNAfragments are arranged in rows and columns suchthat the identity of each fragment is known through itslocation on the array. A variety of methods exist todeposit these DNA sequences on the chip and these arediscussed in detail elsewhere.1–3 Once synthesized,these chips can be used to measure the mRNAexpression levels for tens of thousands of genes froma tissue sample by hybridizing fluorescently labelledcDNA from that tissue to the chip (Figure 1a). Theability to measure, in principle, the expression of allhuman genes in a single experiment is an enormousincrease over the previously available techniques formeasuring gene expression [Northern blot, reverse
transcriptase-polymerase chain reaction (RT-PCR)],where only a few genes could be studied per experi-ment. Such ‘global expression profiling’ not only looksat orders of magnitude more genes than was possiblepreviously, but also has the advantage that the genesexamined are not influenced by preselection of genes.An analogy would be looking for microorganisms byPCR compared with streaking a sample on a cultureplate; the former will only identify organisms specific-ally sought with the primer sets used, while the secondapproach is restricted only by the organism’s ability togrow under the conditions chosen. The study of theexpression of most, if not all, genes in a specimen is nothypothesis-driven as most research used to be,1 but isinstead referred to as ‘discovery-type research’ or, in aless flattering description, as ‘fishing expeditions’.Whereas cDNA derived from a tumour is hybridizedto a chip to study gene expression levels, alterations inDNA copy number (gene amplification or deletion) canbe measured by hybridizing fluorescently labelled DNAfrom a tumour specimen to these chips.4,5
This technique is also applicable to DNA isolatedfrom formalin-fixed paraffin-embedded material6 and
Address for correspondence: M van de Rijn MD, Department of
Pathology, Stanford University Medical Center, 300 Pasteur Drive,
has the advantage that it can be used to studyspecimens stored in surgical pathology archives. Todate, it has not proven practical to extract usablemRNA reliably for gene expression profiling fromarchival tissue blocks. While gene arrays can generatehuge amounts of data, the technology remains com-plex, the arrays are expensive, and, for gene expressionstudies, require fresh frozen material.
Tissue microarrays (TMAs) are constructed bytransferring cores of paraffin-embedded tissue to pre-cored holes in a recipient paraffin block.7 Over 500cores can be placed in a single block by this technique.
Sections cut from TMA blocks can then be used forimmunohistochemistry (IHC) or in situ hybridizationstudies (Figure 1b). TMAs are similar to gene expres-sion microarrays in having samples arrayed in rowsand columns on a glass slide; they differ in that eachelement on the TMA slide corresponds to a singlepatient sample, allowing multiple patient samples to beassessed for a single molecular marker in one experi-ment, while gene expression arrays allow assessment ofthousands of molecular markers on a single patientsample per experiment (Figure 2).
Bioinformatics
The amount of data generated by studies using genemicroarrays is astonishing. For example, by studying40 tumours on gene arrays with 40 000 gene spots,1.6 million data points are obtained. On a somewhatsmaller scale, a TMA with 400 tumours on which 20stains are performed will yield 8000 immunostainresults. It is clear that such enormous numbers of datapoints require novel analytical methods. The manage-ment and utilization of these data represent arguablythe single biggest challenge to histopathologists inmaximizing the utility of these technologies.
For gene microarray analysis two broad categories ofanalysis exist, specifically supervised analysis in which
a
b
Figure 1. a, Representative image of a 42 000 genespot cDNA
microarray hybridized with green fluorescently labelled reference
cDNA and red fluorescently labelled sample cDNA. Each spot
measures a fraction of a millimetre and represents an individual
unique gene. The degree of redness of each spot reflects the relative
amount of mRNA for that particular gene in the sample tested. b, Part
of section of a 284-core lymphoma tissue microarray19 stained with
Bcl-2 antibody. Each core has a cross-sectional diameter of 0.6 mm.
Gene arrays
One sample,many markers
Gene expression
Geneamplification/deletion
Tissue arrays
Many samples,one marker
Antibodies
In situhybridization
Figure 2. Gene microarrays and tissue microarrays (TMAs) are
complementary in the features that can be examined. While gene
microarrays are used to test the level of expression for many
thousands of genes in relatively few samples, TMAs are used to test
the staining pattern of relatively few markers on a large number of
samples. In addition, TMAs can give much more information about
the specific site of gene expression as they can distinguish, for
example, between protein expressed in tumour cells versus that in
surrounding connective tissue cells. Likewise they can distinguish
predominantly nuclear localization of protein from membrane
localization, an important consideration when searching for novel
directed questions are asked of the dataset,8–10 andunsupervised analysis in which the dataset is organizedbased on similarities in gene expression levels in thedifferent tumours, without consideration of informa-tion other than gene expression levels, such as clinicalor pathological data.11 Both types of analysis have theiradvantages and disadvantages and many researchersapply both when examining the large datasets gener-ated by gene array studies. An example of unsupervisedanalysis is shown in Figure 3. A number of softwarepackages have been developed to aid in these studiesand many are available on the web (e.g. http://rana.lbl.gov/EisenSoftware.htm). It has become stand-ard practice for research groups to make the entire
dataset on which a publication is based available onthe worldwide web. In fact, many journals nowrequire this for publication of array datasets. In thismanner other researchers can use their own analyticalmethods to mine multiple datasets.12 Examples of suchwebsites are: http://genome-http://www.stanford.edu/MicroArray, http://www-genome.wi.mit.edu/cgi-bin/cancer/publications/pub_menu.cgi, and http://www.rii.com/publications/default.htm, where datasets canbe downloaded and ⁄ or clustered through a user-friendly interface.
Given the fact that the datasets can be of stag-gering size and that multiple different analytical tech-niques exist, it is not surprising that at first glance
publications from two different groups on the sametumour may not identify the same sets of genes asbeing of (for example) prognostic significance. Itshould be kept in mind that most reports thatdiscuss gene microarray findings show one inter-pretation of a large dataset. The results of thisinterpretation may vary somewhat depending on anumber of factors. These include the type of arraysused, the genes represented on them, and theanalysis techniques used. Significant differences canbe found when supervised versus unsupervisedmethods of analysis are used. In particular, thetype of question that is asked of the dataset can leadto significantly different gene lists. An example ofthis can be seen in the data from two differentgroups studying breast carcinoma. In one study,supervised analysis was used to determine which setof genes would predict outcome in breast carcinomapatients.9 In a study from another group, unsuper-vised clustering was used to determine the related-ness between different cases of breast carcinomawithin that group, an example of unsupervisedanalysis; as a result, the presence of a previouslynot recognized subtype of breast carcinoma that hada poor clinical outcome was discovered.13 At firstglance these two approaches showed very littleoverlap in the genes identified as being significantin classification. A recent report demonstrated,however, that when the same analytical approachwas applied to both datasets, very significant overlapexisted.14 Other variations in the data present inreports are the results of differences in the degree ofvariation in expression required from the genes forinclusion in the final published dataset (referred toas data filtering). It is for this reason that the entireunfiltered dataset of array studies should be madeavailable to the research community, so that com-parisons between the results from different groupscan be made.15 Another reason for publishing theentire dataset of gene expression profiling experi-ments lies in the fact that few if any of thelaboratories working in this field have the ability tofollow up on all the leads from these experiments.By publishing the entire dataset and not just thosedata described in the manuscript an enormousamount of data has already been made public onthe worldwide web. These datasets present anexcellent opportunity for members of the surgicalpathology community to search for new potentialmarkers for specific diseases.
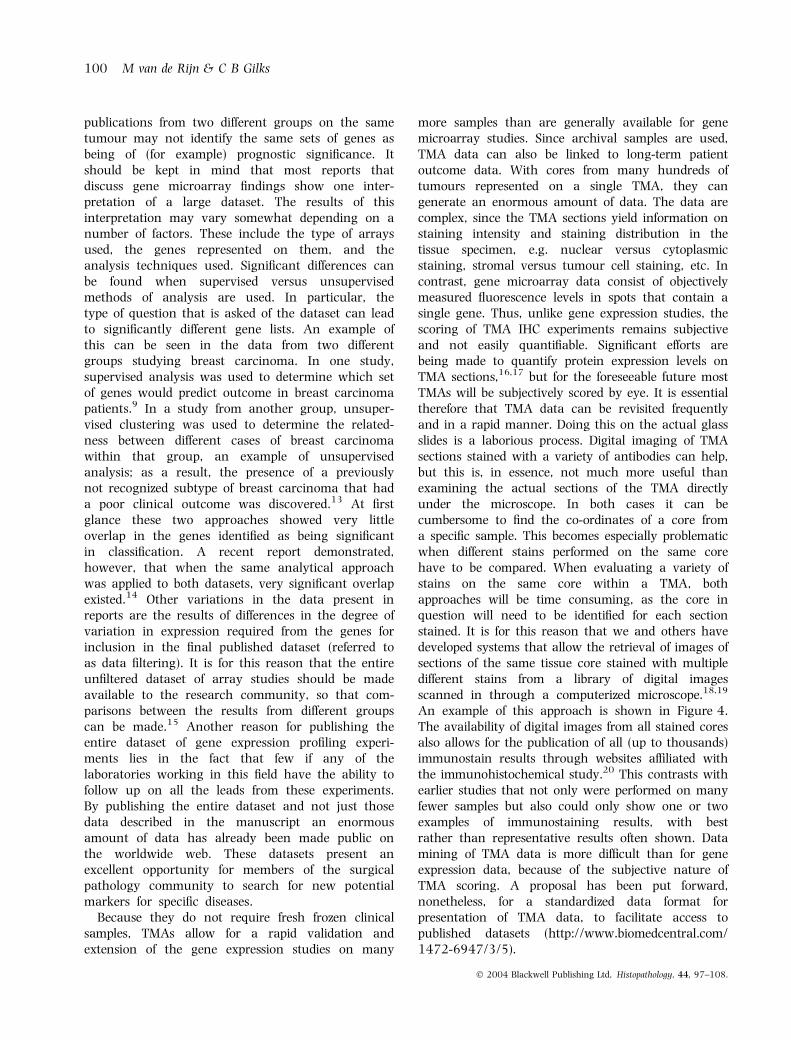
Because they do not require fresh frozen clinicalsamples, TMAs allow for a rapid validation andextension of the gene expression studies on many
more samples than are generally available for genemicroarray studies. Since archival samples are used,TMA data can also be linked to long-term patientoutcome data. With cores from many hundreds oftumours represented on a single TMA, they cangenerate an enormous amount of data. The data arecomplex, since the TMA sections yield information onstaining intensity and staining distribution in thetissue specimen, e.g. nuclear versus cytoplasmicstaining, stromal versus tumour cell staining, etc. Incontrast, gene microarray data consist of objectivelymeasured fluorescence levels in spots that contain asingle gene. Thus, unlike gene expression studies, thescoring of TMA IHC experiments remains subjectiveand not easily quantifiable. Significant efforts arebeing made to quantify protein expression levels onTMA sections,16,17 but for the foreseeable future mostTMAs will be subjectively scored by eye. It is essentialtherefore that TMA data can be revisited frequentlyand in a rapid manner. Doing this on the actual glassslides is a laborious process. Digital imaging of TMAsections stained with a variety of antibodies can help,but this is, in essence, not much more useful thanexamining the actual sections of the TMA directlyunder the microscope. In both cases it can becumbersome to find the co-ordinates of a core froma specific sample. This becomes especially problematicwhen different stains performed on the same corehave to be compared. When evaluating a variety ofstains on the same core within a TMA, bothapproaches will be time consuming, as the core inquestion will need to be identified for each sectionstained. It is for this reason that we and others havedeveloped systems that allow the retrieval of images ofsections of the same tissue core stained with multipledifferent stains from a library of digital imagesscanned in through a computerized microscope.18,19
An example of this approach is shown in Figure 4.The availability of digital images from all stained coresalso allows for the publication of all (up to thousands)immunostain results through websites affiliated withthe immunohistochemical study.20 This contrasts withearlier studies that not only were performed on manyfewer samples but also could only show one or twoexamples of immunostaining results, with bestrather than representative results often shown. Datamining of TMA data is more difficult than for geneexpression data, because of the subjective nature ofTMA scoring. A proposal has been put forward,nonetheless, for a standardized data format forpresentation of TMA data, to facilitate access topublished datasets (http://www.biomedcentral.com/1472-6947/3/5).
It has been suggested that gene expression profilingcould replace histopathological examination of tissuesamples.21 We do not think so. The reason is thathistopathology is inexpensive and highly effective inprediction of behaviour and response to therapy.Moreover, it seems likely that much of the prognosticinformation in a tumour is already adequately definedthrough determination of tumour grade, size, presenceof necrosis, etc. As well, histopathological examinationis required to assess resection margins, a significantconsideration for any tumour where complete surgicalexcision is important in therapy. Nevertheless, we
believe that many significant opportunities exist forapplication of gene expression profiling to improvepatient care.
First, there is a finite amount of information avail-able in a histological section of tumour, and we believethat we are reaching the limits of classification basedpurely on morphology. This creates an opportunity touse gene expression profiling as a diagnostic adjunct toimprove the diagnostic subclassification of tumours; inthe case of lymphomas, in particular, we have seen theimportance of flow cytometry, IHC, cytogenetics andmolecular diagnostics in improving diagnostic accu-racy over that afforded by light microscopy alone.The significance of finding novel subclassifications of
Sectionbased review
Digital image of one sectiondoes not allow comparison of stains on one core
Combined digital images ofmany sections from same core
Bcl-2 staining
600 µm
H&E
Bcl-2
Ki-67
S-100
Corebasedreview
Click on tumour
C
D
E
BA
TMA
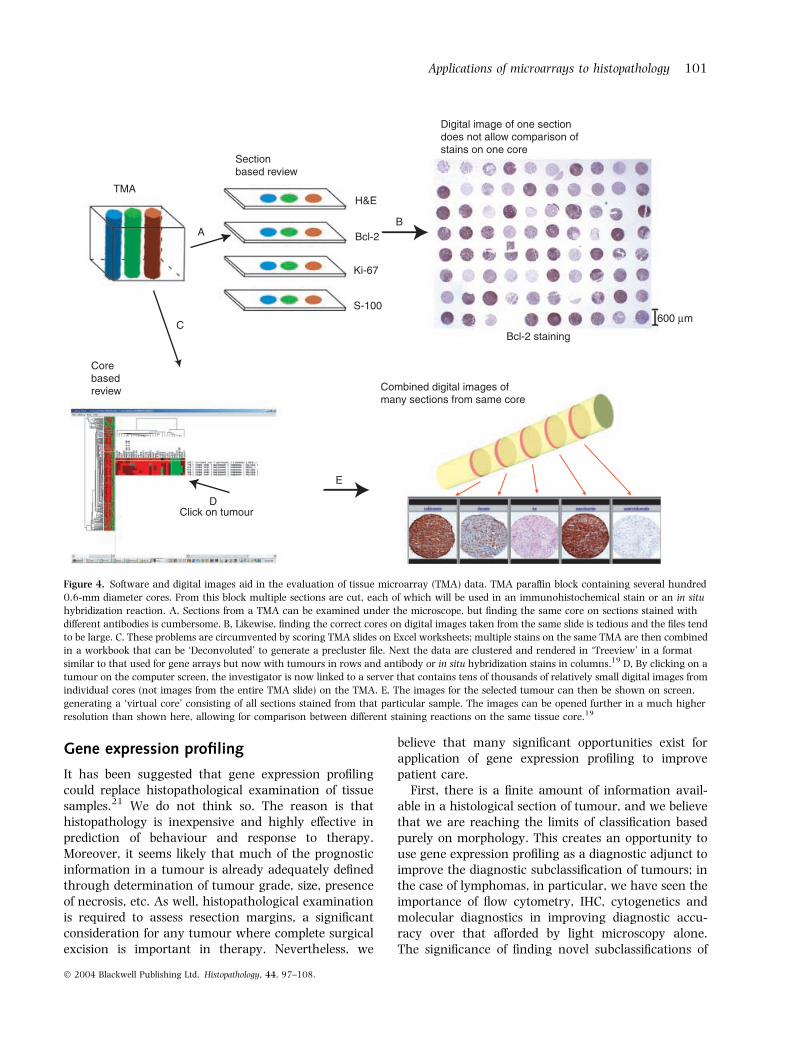
Figure 4. Software and digital images aid in the evaluation of tissue microarray (TMA) data. TMA paraffin block containing several hundred
0.6-mm diameter cores. From this block multiple sections are cut, each of which will be used in an immunohistochemical stain or an in situ
hybridization reaction. A, Sections from a TMA can be examined under the microscope, but finding the same core on sections stained with
different antibodies is cumbersome. B, Likewise, finding the correct cores on digital images taken from the same slide is tedious and the files tend
to be large. C, These problems are circumvented by scoring TMA slides on Excel worksheets; multiple stains on the same TMA are then combined
in a workbook that can be ‘Deconvoluted’ to generate a precluster file. Next the data are clustered and rendered in ‘Treeview’ in a format
similar to that used for gene arrays but now with tumours in rows and antibody or in situ hybridization stains in columns.19 D, By clicking on a
tumour on the computer screen, the investigator is now linked to a server that contains tens of thousands of relatively small digital images from
individual cores (not images from the entire TMA slide) on the TMA. E, The images for the selected tumour can then be shown on screen,
generating a ‘virtual core’ consisting of all sections stained from that particular sample. The images can be opened further in a much higher
resolution than shown here, allowing for comparison between different staining reactions on the same tissue core.19
existing tumour types lies, of course, in the possibilitythat previously unrecognized subsets of tumours mayshow an increased response to certain therapies. Geneexpression profiling has already been shown to be ableto provide prognostically significant molecular sub-classification of breast carcinomas,8,10,13,14,22 lymph-omas,23–26 lung carcinomas,27,28 gliomas,29 andmedulloblastomas30 beyond what is possible based onconventional histopathological examination, and thislist will continue to grow in the years to come.
Second, gene expression profiling could be appliedto cases that are diagnostically challenging usingcurrent techniques, e.g. small blue cell tumours,31 softtissue sarcomas,32–34 carcinomas of unknown pri-mary site. The experience with this type of applicationis very preliminary indeed. In a study of dermato-fibrosarcoma protuberans (DFSP), we were able todistinguish examples of DFSP from cellular fibroushistiocytoma and myxofibrosarcoma based on theirgene expression profiles,6 but more experience, inclu-ding correlation with clinical outcome, is required todemonstrate that gene expression profiling is a signi-ficant improvement over the histological evaluation ofthese cases.
Third, gene expression profiling can be used todiscover new markers that might predict a response totargeted therapy. Examples of existing markers areoestrogen receptor (ER) and HER2 in breast carcinomaand kit in gastrointestinal stromal tumour. Recently,we found that epidermal growth factor receptor (EGFR)was expressed at higher levels in synovial sarcomathan in a variety of other sarcomas.20,32 Partly as aresult of this finding a clinical trial is now beingperformed at the European Organization for theResearch and Treatment of Cancer using an EGFRinhibitory drug. All cell surface markers that showrelative specificity for a particular tumour are potentialtargets for therapy, either by using antibody-mediateddrug delivery or through small molecule inhibitors offunctional proteins.
Is it possible that gene arrays themselves may oneday find application in surgical pathology laboratories?It seems likely that with increasing simplification ofRNA isolation techniques, reverse transcription meth-ods, etc., the use of gene arrays within diagnosticlaboratories may have some future applications. How-ever, there are two significant impediments to theintroduction of gene expression profiling into routinediagnostic practice, even if all the quality assuranceand reproducibility issues could be addressed. First, thesubgroups identified based on gene expression profilingcan potentially be identified by techniques alreadywidely in use, including IHC and in situ hybridization. If
equivalent information can be obtained through thesemethods, especially if they are less expensive than geneexpression profiling, as seems likely, it will remain atool of discovery rather than a tool of routine diagnosis.As an example, the ‘basal’ phenotype of breast carcin-oma, identified by gene expression profiling as being amarker of worse prognosis,13,14 can also be identifiedby immunostaining for cytokeratins 5 ⁄ 6 and 17.35
Second, the ability to offer prognostic information thatdoes not influence patient management, even highlystatistically significant prognostic information, is oflimited clinical impact. Although the differencebetween 40% and 60% survival at 5 years is highlysignificant, the impact on an individual patient, unlessit influences treatment decisions, is unlikely to besufficient to justify the cost of obtaining that informa-tion by gene expression profiling.
Array-based comparative genomichybridization
Gene microarrays have been used for comparativegenomic hybridization. In this technique, genomicDNA is fluorescently labelled and used to determinethe presence of gene loss or amplification.4,5,36,37
Array-based comparative genomic hybridization(aCGH) has been used to map genetic abnormalitiesin a wide range of tumours, including breast carcin-oma,37 DFSP,6 bladder carcinoma,38 fallopian tubecarcinoma,39 gastric carcinoma,40 melanoma,41 andlymphoma,42 to name a few. aCGH has also beensuccessfully applied to high-resolution molecularkaryotyping of patients with genetic disorders.41,43
Unlike gene expression array analysis, for which freshfrozen tissue is required, aCGH can also be performedon material isolated from formalin-fixed paraffin-embedded samples.6,44 Thus the large collections ofclinical samples stored in the archives of histopathologylaboratories are suitable for research. The importanceof this aspect is that many samples with existingclinical follow-up and many samples from definedclinical trial protocols are available for study. The lattersamples are particularly valuable, as samples fromrandomized clinical trials allow testing of the influenceof specific gene amplification events on response to thetherapy. A variety of techniques for aCGH are beingused, and many researchers use arrays that are madefrom bacterial artificial chromosome (BAC) fragments.At Stanford the same cDNA gene arrays used for geneexpression are utilized for aCGH. This allows for a directcomparison between gene expression profiles andgenomic copy number alterations,6,36 and it becomes
clear from these studies that a significant percentage ofgenes that are highly expressed at the mRNA level alsoshow an amplification of the genes at the DNA level.Several potential clinical applications for aCGH exist.For example, in pilot experiments we have shown thatclassical cases of melanoma and Spitz naevus can bedistinguished using cDNA gene arrays [45]. Thesefindings are in agreement with results of previousstudies employing conventional CGH or fluorescencein situ hybridization (FISH) techniques.46–48 Of course,these studies need to be extended to include many moresamples and should evaluate the utility of thesetechniques on samples that are ambiguous on histo-logical examination, comparing histological examina-tion versus aCGH in predicting behaviour. In the caseof melanocytic lesions, the ability to use paraffin-embedded material is especially important as the entirelesion is usually submitted for histology, with no frozenmaterial left for additional studies.
tissue microarrays
TMAs have different but complementary applications,compared with gene expression profiling or aCGH.Immunohistochemical studies on TMAs have beenused for validation of gene expression profilingresults,49 documenting that in most instancesincreased mRNA expression correlates with increasedprotein levels. This is not invariably the case; forexample a1-antitrypsin is expressed at very high levelsin hepatocytes but rapidly exported so that there isrelatively little intracellular protein,50 and caspase-3protein is undetectable in skeletal muscle despite thepresence of abundant mRNA transcripts, through post-transcriptional regulation of protein synthesis.51 In arecent study, Ginestier et al. showed that there can besignificant differences between RNA expression levelsas measured by hybridization to nylon membranes andprotein levels as measured by IHC.52
Identification of molecules of interest by gene expres-sion profiling can be rapidly validated by IHC only ifthere are existing antibodies against the gene product inquestion. After demonstration of a relatively increasedmRNA expression of the EGFR in synovial sarcoma,32
we could confirm the presence of high protein levels forthis molecule using an existing antibody on a TMAcontaining over 40 synovial sarcomas.20 For individualgenes identified as being of importance for diagnosis,prognostication, or prediction of response to therapy bygene expression profiling, TMAs offer the most directapproach to validation. This is also true for geneamplification events identified by aCGH; validation ofthe importance of specific amplicons can be rapidly
accomplished through FISH or chromogenic ISH ana-lysis of TMAs. For ISH to detect gene copy numberchanges there is not even the impediment of needing anantibody, as for any gene on a cDNA microarray it istheoretically possible to generate rapidly a suitableprobe for ISH.
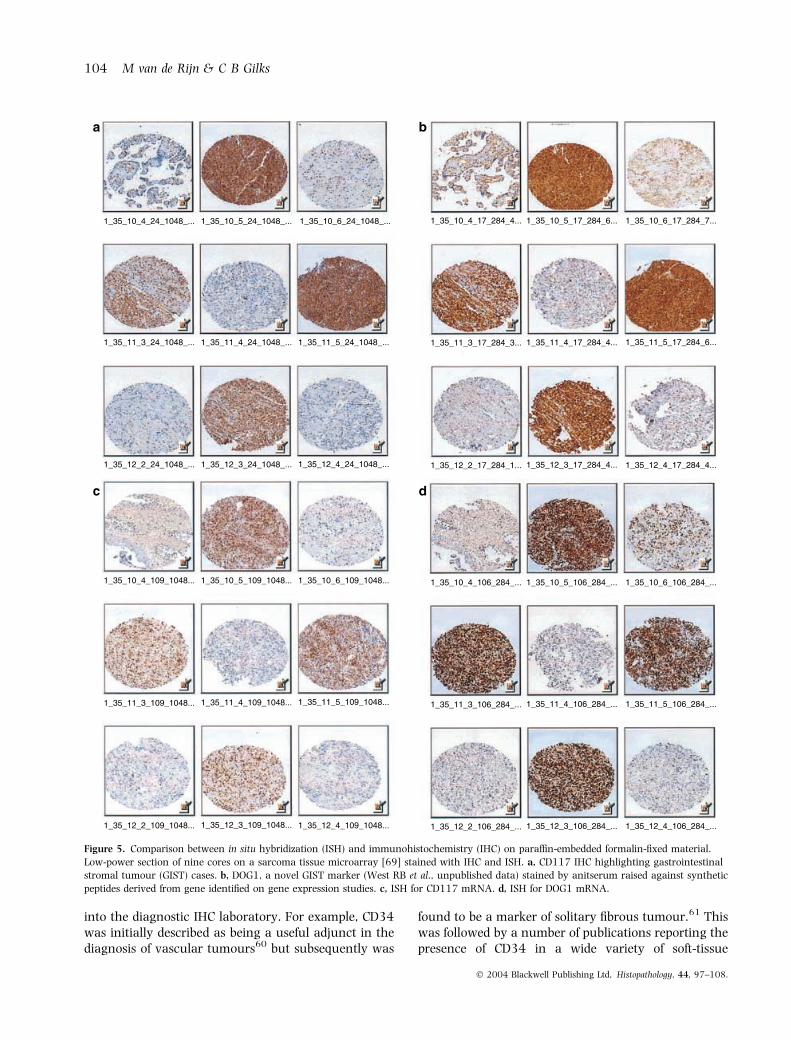
Because IHC is routinely used in diagnostic histopa-thology laboratories and can be applied to formalin-fixed paraffin-embedded tissues, it is probable that afterdiscovery of individual genes of interest through geneexpression profiling, the evolution to clinical practicewill lead first to introduction of new IHC assays, ratherthan introduction of cDNA microarray technology forassessment of these genes. Recently modifications ofprevious mRNA ISH protocols53,54 have allowed appli-cation of this technique to formalin-fixed paraffin-embedded material (Figure 5). It is to be expected thatin the future many of the applications of TMAs willinvolve mRNA ISH, as synthesis of ISH probes can beperformed much more rapidly than generation ofantipeptide antisera or monoclonal antibodies.
As discussed previously, gene expression data canidentify groups of cases with significantly differentoutcomes, where routine histopathological examina-tion does not permit subclassification. Although expres-sion levels of large numbers of genes are used, theultimate cluster grouping can often be reproducedusing a much smaller number of genes (50 or less).Hierarchical clustering analysis can be applied toimmunohistochemical data55 and it is possible thatby using a panel of antibodies, the cluster groupingsderived from gene expression data can be reproducedbased on IHC staining results. Although there have notbeen complete reproductions of the gene expressionexperiments using IHC, primarily because the fullcomplement of necessary antibodies is not available,clustering of cases of lung, endometrial and breastcarcinoma based on IHC staining of TMAs has beendone and has, for endometrial and breast carcinoma,identified groups with differing prognoses (Gilks CB,unpublished data) (Figure 6). Whether application ofpanels of immunomarkers and interpretation of resultsusing clustering to define molecular subgroups oftumours will prove more powerful than the tradi-tional approach of using single markers remains to beseen.
Tissue microarrays composed of numerous differenttissues and tumour types, referred to as ‘prevalenceTMAs’,56 afford the opportunity to establish veryrapidly the prevalence of expression of a given pro-tein.57–59 This ability to determine the sensitivity andspecificity of a new immunostain for a given diagnosisshould revolutionize the introduction of new antibodies
into the diagnostic IHC laboratory. For example, CD34was initially described as being a useful adjunct in thediagnosis of vascular tumours60 but subsequently was
found to be a marker of solitary fibrous tumour.61 Thiswas followed by a number of publications reporting thepresence of CD34 in a wide variety of soft-tissue
tumours.62–64 As a result, some referred to CD34 as‘the vimentin of the nineties’ (R. Kempson, personalcommunication). The advantage of being able to staina large number of cases using TMAs, at minimal cost,means that the staining profile for new antibodies willbe more rapidly established and will not be determinedover a period of years.
TMAs have immediate advantages for quality assur-ance in diagnostic IHC or ISH laboratories. Becauseeach laboratory may use different protocols for fixationand tissue processing, the applicability of publishedstaining results obtained in other laboratories is ques-tionable. All new antibodies introduced into diagnosticuse should undergo a trial with a number of casesprocessed ‘in house’ to ensure that the profile of casesstained is as expected. For reasons of cost, this istypically a limited number of cases. In contrast, use of aTMA composed of numerous tissue and tumour typesprocessed in that laboratory allows a rapid assessmentof the staining profile of a new antibody on materialfrom that laboratory.59,65 This same TMA could thenbe used to test new aliquots of antibody or for periodicassessment of staining to ensure that there had not beena change in the immunoreactivity of cases recognizedby a given antibody over time. TMAs also offeradvantages for testing interlaboratory and interobserv-er variation in staining and interpretation of stainingresults, respectively.59,66,67 Instead of a single case, weused a small TMA with 29 cases of breast carcinoma tocompare results of staining for ER in different laborat-ories. The advantage was that instead of using just asingle strongly ER+ case, we were able to present a set ofcases showing a spectrum of ER positivity; using thisarray we were able to determine that there wasdecreased sensitivity in detection of weak ER+ cases inone of the participating laboratories.66 We were alsoable to ascertain that the interpretation of the stainingwas not the issue, but that it was related to technicalfactors. This would not have been possible based on asection of a single tumour. Von Wasielewski et al. in amuch larger study involving 172 laboratories alsodocumented significant problems in the reproducibilityof recognition of weak ER positivity, and were able totrace the technical basis of poor sensitivity to insuffi-cient antigen retrieval.67 Using the digital imagingsoftware previously described (Figure 4), it would bepossible to have a TMA-based IHC quality assuranceprogramme where participants could, via the internet,compare their staining results on the same tissuesamples with those from other labs.
A final issue for consideration is whether TMAs canreplace whole sections for diagnostic work. This isparticularly relevant for breast carcinoma where ER,
405
brea
st c
arci
nom
as
1
2
3
21 antibodiesa
1.0
0.9
0.8
0.7
0.6
0.5
0.4
0.3
0.2
0.1
0.00 5 10 15 20 25 30
Total follow-up (years) P > 0.001
Dis
ease
-spe
cific
sur
viva
l
b
1
3
2
Figure 6. Hierarchical clustering analysis of 405 cases of breast
carcinoma, based on immunostaining results with 21 antibodies. The
intersection between a column (antibody) and row (tumour) is bright
red when the tumour cells are strongly immunoreactive, dark red or
black when the tumour shows intermediate or weak immunoreac-
tivity, respectively, and green when negative. White indicates missing
data. a, Three different cluster groups (1, 2, and 3) are identified
based on unsupervised hierarchical cluster analysis. b, The disease-
specific survival of the patients in these three groups is significantly
progesterone receptor (PR) and HER2 are routinelyassessed on every case. By batching cases onto TMAs,there would be significant savings in reagent andtechnical costs. This does beg the question of whethercores of tumour are representative of whole sections.Numerous studies have validated the correlationbetween immunostaining of one to four 0.6-mm coresand staining whole sections (reviewed by Simonet al.56). Intriguingly, Torhorst et al. found that theprognostic significance of immunostaining for p53, ERand PR in a large series of breast carcinomas, based onstaining of a single 0.6 mm core, was as good as orbetter than results obtained using whole sections.68
This strongly suggests that the use of small cores canbe equivalent to whole section immunohistochemistryand may, in fact, prove superior, presumably byexclusion of cases with weak, focal staining. Furtherstudies are needed, specifically looking at the cases thatare discordant by TMA versus whole section IHC; ifthese cases behave like the IHC-negative group, thatwould support TMAs as being superior to wholesections, while if they behave like the IHC-positivegroup, it would indicate that the use of small coresresults in false-negative results.
Summary
Potential applications of microarray technology indiagnostic histopathology are summarized in Table 1.There are some immediate applications for TMAs in the
diagnostic laboratory, while gene expression profilingand aCGH face a significant developmental periodbefore they can be routinely used.
Acknowledgements
We express our appreciation to members of ourlaboratories for assistance in data generation, produc-tion of figures, and critical review of this manuscript.
References
1. Brown PO, Botstein D. Exploring the new world of the genome
with DNA microarrays. Nat. Genet. 1999; 21; 33–37.
2. Granjeaud S, Bertucci F, Jordan BR. Expression profiling: DNA
arrays in many guises. Bioessays 1999; 21; 781–790.
3. Lockhart DJ, Winzeler EA. Genomics, gene expression and DNA
arrays. Nature 2000; 15; 827–836.
4. Pinkel D, Segraves R, Sudar D et al. High resolution analysis of
DNA copy number variation using comparative genomic hybrid-
ization to microarrays. Nat. Genet. 1998; 20; 207–211.
5. Pollack JR, Perou CM, Alizadeh AA et al. Genome-wide analysis
of DNA copy-number changes using cDNA microarrays. Nat.
Genet. 1999; 23; 41–46.
6. Linn SC, West RB, Pollack JR et al. Gene expression patterns and
gene copy number changes in dermatofibrosarcoma protuberans.
Am. J. Pathol. 2003; 163; 2383–2395.
7. Kononen J, Bubendorf L, Kallioniemi A et al. Tissue microarrays
for high-throughput molecular profiling of tumor specimens. Nat.
Med. 1998; 4; 844–847.
8. West M, Blanchette C, Dressman H et al. Predicting the clinical
status of human breast cancer by using gene expression profiles.
Proc. Natl. Acad. Sci. USA 2001; 98; 11462–11467.
Table 1. Microarrayapplications in routinediagnostic pathology
Immediate
1 TMAs for characterization of new monoclonal antibodies for IHC andperiodic testing of currently used antibodies for sensitivity andspecificity of staining
2 TMAs for interlaboratory quality assurance programmesfor IHC and ISH
Future
1 TMAs in lieu of whole sections for adjuvant testing (e.g. ER, PR, HER2)
2 Gene expression profiling for differential diagnosis (e.g. small bluecell tumours, carcinoma of unknown primary site)
3 Gene expression profiling for molecular subclassification of tumours(e.g. breast carcinoma, lung carcinoma, lymphoma)
4 aCGH for differential diagnosis (e.g. Spitz naevus versus melanoma)
5 Gene expression profiling and ⁄ or aCGH for identification of moleculartherapeutic targets, with the goal of achieving individualized therapy
TMA, Tissue microarray; IHC, immunohistochemistry; ISH, in situ hybridization; ER, oestrogenreceptor; PR, progesterone receptor; aCGH, array-based comparative genomic hybridization.