Fouling strategies and the cleaning system of NF membranesand factors affecting cleaning efficiency
Ahmed Al-Amoudi a,b, Robert W. Lovitt a,∗a Centre for Complex Fluids Processing, Multidisciplinary Nanotechnology Centre, School of Engineering,
University of Wales, Swansea SA2 8PP, UKb Saline Water Conversion Corporation (SWCC), Saline Water Desalination Research Institute, Saudi Arabia
Received 17 January 2007; received in revised form 25 May 2007; accepted 6 June 2007Available online 14 June 2007
Abstract
Nanofiltration membranes play an important role in the desalination of brackish and seawater as well as membrane mediated waste waterreclamation and other industrial separations. Fouling of nanofiltration (NF) membranes is typically caused by inorganic and organic materialspresent in water that adhere to the surface and pores of the membrane and results in deterioration of performance (reduced membrane flux) with aconsequent increase in costs of energy and membrane replacement.
Natural organic matter (NOM) fouling of NF membranes involves interrelationship between physical and chemical interactions and is describedin this review. Inorganic fouling due to scale formation of sparingly soluble inorganic salts occurs whenever the ionic salt concentration streamexceeds the equilibrium solubility. Scale formation takes place by homogenous or heterogeneous crystallization mechanisms. Biofilm formationalso becomes an issue when its thickness and surface coverage reduces permeability.
There are two strategies that are usually employed to minimize the effect of fouling. The first group includes minimizing of fouling by usingadequate feed pretreatment, membrane treatment and membrane modification. The second group involves membrane remediation by chemicalcleaning which is carried out to restore membrane fluxes.
A large number of chemical cleaning agents are commercially available, and the commonly used ones fall into six categories: alkalis, acids,metal chelating agents, surfactants, oxidation agents and enzymes. In general, these cleaning agents do improve the membrane flux to certainextent. Combination of these chemical agents has also been tried in order to improve the flux restoration. Even though, many of these cleaningagents can restore the flux over 100% (enhanced flux), they can also impair the selectivity of the membrane reducing of the product water quality.
There are many traditional assessment methods for cleaning and at present these are being supplemented by methods using modern surfaceanalysis techniques. These are being now rapidly developed to give a more precise assessment and a better understanding of cleaning processes.Generally, cleaning is assessed by flux, zeta potential measurement, atomic force microscope (AFM) and Fourier transforms infrared technique(FTIR). Atomic force microscope and related techniques are particularly employed in order to evaluate the cleaning efficiency and other surfacephenomena.
There are several factors that can affect the chemical cleaning process which include temperature, pH, concentration of the cleaning chemicals,contact time between the chemical solution and the membrane and the operation conditions such as cross-flow velocity and pressure. The role oftemperature and pH in cleaning are membrane dependent. These factors play very important role in flux recovery. A critical review of these factorsis also presented.
It appears from the literature that only very few papers on cleaning of NF membrane to regenerate membrane performance have been publishedup to date, and there is an urgent need for extensive research work to investigate fouling mechanisms in order to obtain fundamental understandingof fouling to provide more feasible, cost-effective cleaning and performance restoration procedures. This also provides further strategies for theavoidance of fouling through better pretreatment and more appropriate membrane fabrication and modification.
Water scarcity is a major political and economic problem inhe many parts of the world especially in the arid regions such ashe Middle East, Southern Europe, North and mid Africa, Aus-ralia and many states of America such as California, Florida,ew Mexico, etc. The shortage in natural fresh water supply
or domestic purposes is most acute for the Arabian Penin-ula countries – Saudi Arabia, Kuwait, Bahrain, Qatar, Unitedrab Emirates, Oman and Yemen – where demand for water
ncreases annually at a rate of 3% or more [1]. In addition,he rapid further reduction of subterranean aquifers, and thencreasing salinity of these non-renewable sources will con-inue to exacerbate the water shortage problems in many areas
tion for shortages in conventional water resources and hasacknowledged as sustainable and effective process by rep-utable institutions such as the World Bank [3]. This can beachieved either by thermal processes involving evaporationor by membrane filtration involving separation of ions fromwater.
As water demand increases, environment and safety regula-tions are becoming more stringent, greater research efforts havebeen put into the improvement of membrane processes. Duringthe past decade a variety of water treatment membranes has beendeveloped [4]. These membranes have been vastly improved inthe area of water flux, salt rejection, and especially in their abil-ity to maintain high performance levels at substantially loweroperating pressures than their predecessors [5]. Despite these
f the world. Desalination techniques are capable of provid-ng the solution [2]. “Desalination” or “Desalinization” referso water treatment processes that remove salts from salineater. Desalination has already become an acceptable solu-
irflm
mprovements, a decline in membrane performance over a period
esulting from membrane fouling that leads to a decrease in waterux across the membrane and increased salt passage through theembrane [6,7].
6 l of M
totp
i
•
•
•
•
fleottpe
2
snrbimawsbdihohCi[
mafbicH
mea
ftippdtfUpc
bcastttpvAdtb
tpmei
3
3
iofptonb
adfi
A. Al-Amoudi, R.W. Lovitt / Journa
The membrane can be considered the heart of a desalina-ion plant where the cost of membrane unit is about 20–25%f the total capital cost [8]. Consequently, it is very importanto be familiar with factors involved in reduction of membraneerformance and longevity, in particular membrane fouling.
The factors affecting NF separation that can also play anmportant role in membrane fouling and cleaning are as follows:
Membrane properties such as surface roughness pore size dis-tribution, membrane thickness, membrane charge type andcharge density.The chemistry of the treated solution such as solute compo-sition, the size, geometry and the charge of the components,the concentration of ions, the pH and the fouling potential ofthe solution and its interaction with membranes.The operation design of the NF systems, their—capacity,dimensions and flow.The processes environment—temperature and pressure.
This review focuses on the type of foulants that leads toux reduction of fresh water obtained from desalination plant:xplanations of desalination processed and their mechanismf fouling are also reviewed to give clear understanding ofhe cleaning processes. The main objective of this review iso address the key factors in maintaining and restoring thelant performance and the factors that affect the cleaningfficiency.
. Fundamentals of NF separation and selectivity
Nanofiltration (NF) membranes are mainly utilized foroftening brackish waters. The separation characteristics ofanofiltration (NF) stand between ultrafiltration (UF) andeverse osmosis (RO) and the membrane selectivity has ofteneen attributed to the interchange of both molecular siev-ng mechanisms characteristic of ultrafiltration and diffusion
echanisms characteristics of RO. NF membranes are usu-lly made of polyamide based Thin Film Composites (TFC),hich are relatively close to RO membranes in chemical
tructure. However, a key distinguishing feature of RO mem-ranes is their higher rejection of both monovalent andivalent ions, the NF membranes are typically character-zed by lower rejection of monovalent ions, but maintainingigher rejection of divalent ions and higher flux than thatf RO membranes. In general NF membranes have relativelyigh charge and also pores in the order of about 1 nm [9].onsequently both, charge effects and sieving mechanisms
nfluence the rejection behavior of solutes in NF membranes10].
Generally, the basic chemical structure of the synthetic poly-ers used in the preparation of RO, UF and NF membranes are
lmost same apart from the pore size of the membranes. There-ore overlap of properties of RO and UF with NF in terms of
oth transport phenomena and consequent fouling is commonn the area of water treatment. Consequently the cleaning pro-esses for the RO and UF are also similar for NF membrane.ence, this literature review sometimes considers UF and RO
ai(a
embrane Science 303 (2007) 4–28
embranes and their fouling or/and cleaning system in order tolaborate the points where lack of information on NF foulingnd cleaning exists.
The forces of the interaction between the membrane sur-ace and particles in solution are important in understandinghe fouling phenomena. The normal basis for quantify-ng particle–surface interaction is DLVO theory where thearticle–surface interactions in aqueous environments could beredicted by the summation of van der Waals and electrostaticouble layer forces. The Fig. 1 is a schematic description ofhe DLVO interaction profiles and the summation of these twoorces. There are several important features about this diagram:nlike the double layer interaction, the van der Waals interactionotential is largely insensitive to variations in pH and electrolyteoncentration.
Reducing the interaction between the particles and the mem-rane as much possible can reduce the fouling phenomena. Thisan be achieved when the critical values (flux and pressure)rise as a balance between the hydrodynamic force drivingolute towards the pore and the electrostatic forces opposinghis motion. Critical flux stems from the concept that the higherhe flux the stronger is the drag force towards the membrane,he stronger concentration polarization and the higher the com-action of particles. Critical flux is defined as the limiting fluxalue below which a flux decline over time does not occur [11].
number of parameters influenced this critical flux have beeniscussed in detail and can be found elsewhere [12]. It is main-ained that if one operates below the critical flux the fouling cane avoided or minimized.
Fouling is common to all types of membrane separation. Theype of fouling various from Microfiltration (MF) membranerocesses where hydrodynamic force can predominate to ROembrane processes where hydrodynamic forces have minor
ffects compared to the forces associated with particles and theirnteraction with the membrane surface.
. Fouling
.1. Background
To devise effective cleaning strategies a thorough understand-ng of membrane fouling and it causes is required and first partf the review is therefore dedicated to the nature of fouling andouling processes membrane fouling is an extremely complexhenomenon that has not been defined precisely. In general theerm is used to describe the undesirable formation of depositsn membrane surfaces. This occurs when rejected particles areot transported from the surface of the membrane back to theulk stream.
The foulants are typically colloidal materials of one sort ornother and these properties and interaction with the membraneominate fouling/cleaning processes. Colloids are defined asne suspended particles in the size range of a few nanometres to
few micrometers. Examples of common colloids sized foulant
nclude inorganic (clays, silica salt, and metal oxides), organicaggregated natural and synthetic organic), biological (bacteriand other micro-organism) [7,13–18]. Champlin [19] reported
A. Al-Amoudi, R.W. Lovitt / Journal of Membrane Science 303 (2007) 4–28 7
Fig. 1. Schematic energy versus distance profiles of DLVO interaction profiles (a) Surfaces repel strongly; small colloidal particles remain ‘stable’. (b) Surfacecome into stable equilibrium at secondary minimum if it is deep enough; colloids remain’ kinetically ‘stable’. (c) Surfaces come into secondary minimum; colloidsc mainc
tsUhpTscstam
nuItaiptmd
tlubafpo
to(fepm
fl
oagulate slowly. (d) The ‘critical coagulation concentration’. Surfaces may reolloids coalesce rapidly. [10].
hat removing of the particles size of down to 1 �m may not beufficient to avoid fouling in many cases. Not only do MF andF process sometimes fail to remove all colloids below a fewundred nm in diameter but also conventional processes used tore-treat NF feed water fail to remove sub-micron colloids [10].he high concentration of the rejected ions in the membraneurface could encourage aggregation of dissolved matter in toolloidal sized particles. More to the point, the influenced ofalt retention and concentration polarization in the vicinity ofhe membrane surface screens electrostatic particle–membranend particle–particle interactions allowing colloids to foul theembrane.The sites fouling of membrane can be divided into exter-
al surface fouling (build-up of a cake/gel-like layer on thepstream face of a membrane) and pore blocking fouling [20].n a dead-end filtration system, the latter is divided into threeypes: complete pore blocking (blocking a pore by a particle withpproximately the same as the pore size), incomplete pore block-ng (intermediate fouling) and standard pore blocking (gradual
ore narrowing and constriction by particle that is much smallerhan the pore size) [21]. The flux decline of NF membrane is
ainly attributed to the pore blocking and it is observed inead-end and the cross-flow filtration systems.
ib
f
in secondary minimum or adhere; colloids coagulate rapidly. (e) Surfaces and
Vrouwenvelder and Kooij [22] showed that diagnosis of theype/cause of fouling is an essential first step aiming at control-ing fouling. Autopsy gives conclusive information and furthernderstanding about the types and extent of fouling in the mem-rane filtration plant and provides specific ways for reductionnd control of fouling. The tools which have been developedor diagnosis, prediction, reduction, and control of fouling haveroven their value in controlling fouling in practice. An overviewf the tools is shown in Table 1 [23].
A set of coherent tools has been developed for (i) Determininghe fouling potential of the feed water. (ii) Analyzing the foulingf NF and RO membranes. The tools presented can be used toa) assess the cause of fouling, (b) further define criteria foreed water to predict and minimize the risk of fouling and (c)valuate cleaning strategies. Appropriate use of these tools canrovide strategies for cleaning to reduce the operational costs ofembrane plants (Table 1) [23].When fouling takes place on the membrane surfaces its causes
ux decline leading to an increase in production cost due to
ncreased energy demand, chemical cleaning, reduction in mem-rane life expectancy and additional labor for maintenance.
The types of NF Fouling can be classified on the basis ofouling material into three types [22–25]:
8 A. Al-Amoudi, R.W. Lovitt / Journal of M
Tabl
e1
over
view
ofto
ols
avai
labl
efo
rde
term
inin
gth
efo
ulin
gpo
tent
ialo
ffe
edw
ater
and
foul
ing
diag
nosi
sof
NF
and
orm
embr
anes
used
inw
ater
trea
tmen
tado
pted
[90]
Tool
sIn
tegr
ated
diag
nosi
s(a
utop
sy)
Bio
film
mon
itor
ofbi
ofou
ling
form
atio
nra
teB
iofo
ulin
gfo
rmat
ion
rate
MFI
-UF
Scal
eGua
rd
Foul
ing
diag
nosi
sB
iofo
ulin
g,in
orga
nic,
com
poun
dsan
dpa
rtic
les
Bio
foul
ing
Bio
foul
ing
Part
icul
ate
Scal
ing
Met
hod
SEM
,ED
X,X
RD
,FT
IR,A
FM„
XPS
,Z
eta
pote
ntia
l,C
onta
ctan
gle,
NM
Ran
dC
hem
ical
anal
ysis
ofth
efo
ulan
tby
TO
C,I
CP,
HPL
Cet
c.
Ass
imila
ble
orga
nic
carb
on(A
OC
),cy
linde
r(g
lass
)su
rfac
eSp
ecifi
cO
xyge
nC
onsu
mpt
ion
Rat
e(S
OC
R)
Dea
den
deq
uipm
ent
Con
tinuo
uson
-lin
em
onito
r-B
rine
stag
em
odul
ew
itha
sing
lesp
iral
wou
ndm
embr
ane
elem
ent
Com
men
tC
ompa
riso
nof
foul
edan
dun
foul
edsy
stem
isol
ate
the
diff
eren
ces
both
chem
ical
and
phys
ical
prop
ertie
sof
the
mem
bran
e.T
his
confi
rmed
with
wat
ertr
eatm
entp
rope
rtie
spr
ovid
elik
ely
caus
esof
foul
ing
Pred
ictiv
ean
dpr
even
tion
ofB
iofo
ulin
gby
dete
rmin
ing
the
(gro
wth
)po
tent
ialo
fw
ater
Non
-des
truc
tive
met
hod
for
dete
rmin
ing
activ
ebi
omas
sin
mem
bran
esy
stem
s
Part
icul
ate
foul
ing
pote
ntia
lof
wat
erO
ptim
izin
gre
cove
ry,a
cid
dose
and
anti-
scal
antd
ose
1
2
3
3
asiitptrttaroae
pbiatrrgCa[ddisca
Islsmttsert
embrane Science 303 (2007) 4–28
. inorganic fouling due to deposition on membrane surface ofinorganic scales (mainly BaSO4, CaSO4 CaCO3),
. organic fouling due to natural organic material (NOM) foundin the process stream (humic acids, protein and carbohy-drate), and
. biofouling due to microbial attachment to membrane sur-face followed thereafter by their growth and multiplicationin presence of adequate supply of nutrients in the pretreatedfeed or nutrients that deposited on membrane surfaces.
.1.1. Inorganic foulingScale formation at the membrane surface is serious problem
nd resulting from the increased concentration of one or morepecies beyond their solubility limits and their ultimate precip-tation onto the membranes [26]. In order to avoid scaling, its very important to operate NF systems at conditions lowerhan the critical solubility limits, unless the water chemistry andhysical conditions are adjusted to prevent the type of precipita-ion. Currently, due to the complexity of the problem, there is noeliable way to predict the limiting concentration level at whichhere is no a risk of scale formation with a given membrane sys-em and treated water. Similarly, specific antiscalant treatmentsre hard to define with confidence [27]. Schafer et al. [10], haveeported that scaling (scale formation) or precipitation fouling,ccurs in a membrane process whenever the ionic product ofsparingly soluble salt in the concentration stream exceeds its
quilibrium solubility product.The term ‘membrane scaling’ is commonly used when the
recipitate formed is a hard scale on the surface of the mem-rane. Scaling usually refers to the formation of deposits ofnverse-solubility salts such as CaCO3, CaSO4·xH2O, silica,nd calcium phosphate. Inorganic scale formation can even leado physical damage of the NF membrane, and it is difficult toestore NF membrane performance due to the difficulties of scaleemoval and irreversible membrane pore plugging [10]. Thereatest scaling potential species in NF membrane are CaCO3,aSO4·2H2O and silica, while the other potential scaling speciesre BaSO4, SrSO4, Ca(PO4)2, ferric and aluminium hydroxides26,28]. Calcium sulphate precipitates in six different phases,ihydrate (so-called gypsum), two hemihydrates and three anhy-rites, although at ambient temperatures (about 20 ◦C), gypsums the most common. The other phases are the product of gyp-um dehydration at relatively higher temperature, whereas thealcium carbonate precipitates in three phases: calcite, valeritend aragonite.
The most common crystal of calcium carbonate is calcite.t is widely accepted that the crystallization (precipitation) ofalts that takes place on the NF membrane surface requires ateast two stages, a nucleation stage and a crystal growth fromupersaturated solution. It is important to be familiar with theechanism of scale formation in order to avoid flux reduction
hrough membrane. Gilron and Hasson [27,29–31] consideredhat the flux decline was due to the blockage of the membrane
urface by lateral growth of the deposits on the membrane (het-rogeneous crystallization (two phase)) whereas Pervov [29–31]eported that the flux decline was due to the crystal formationhat took place in the bulk solution followed by crystal deposition
A. Al-Amoudi, R.W. Lovitt / Journal of Membrane Science 303 (2007) 4–28 9
F recipil ].
oCwtofttnstptc
c[tpsa
rcHit
ct[taaTitte
ig. 2. Scale formation mechanisms in NF membrane (a) show homogenous piquid phase and solid surface phase and the factor effect the crystallizations [28
n the surface of the membrane (homogenous crystallization).learly, this process will be a mixture of these two extremes andill be affected by membrane morphology and process condi-
ions. Fig. 2 represents homogeneous and heterogeneous modesf crystallization [30]. Her et al. [8,32], reported that if the sur-ace of the solid substrate matches well with the crystal andhe interfacial energy between the two solids is smaller thanhe interfacial energy between the crystal and the solution, thenucleation may take place at a lower saturation ratio on a solidubstrate surface (heterogeneous crystallization) rather than inhe solution (homogenous crystallization) [8,32]. When the bulkhase becomes supersaturated due to the increasing of concen-ration polarisation layer, it is possible that both mechanisms ofrystallization simultaneously occur in NF system [30].
Aluminium oxide, inorganic salts, clays, sand and biologi-al surfaces can also act as suitable substrates for crystallization33]. Dydo et al. [8] have reported that most researchers indicate
hat the gypsum scale precipitates as a bulk phase precipitationrocess (homogenous crystallization) rather than on membraneurface (heterogeneous crystallization). Lee et al. [30] haslso demonstrated that the homogeneous crystallization in the
qttf
tation in the liquid phase while (b) show heterogeneous precipitation between
etentate is a more important mechanism than heterogeneousrystallization of the membrane fouling and flux decline [30].asson et al. [27] have reported that the effect of CaSO4 scaling
n RO and NF membranes on the flux decline was a function ofhe super-saturation level on membrane surface and in the bulk.
Various physical and chemical parameters that affect therystallization process within a membrane system and includeemperature [34,35], pH [36], flow velocity, permeation rate37], types of pretreatment [38], salt concentration and concen-ration polarization [30,39–42], membrane type, materials [37]nd metal ions [43]. In addition to these parameters, NOM haslso been considered to affect various forms of scaling [44].hese factors also have been summarized as to whether they
ncrease or decrease the scaling, in Table 2 and more informa-ion can be found elsewhere [45]. It can be drawn from thisable that there are several factors either alone or combined withach other play an important role in crystallization and subse-
uent cake formation. However, this is further complicated byhe nature of mixed solutions of how these alter substantiallyhe solubility product, strength and morphology of precipitatesrom those in pure state. When the structure of the precipitate is
10 A. Al-Amoudi, R.W. Lovitt / Journal of Membrane Science 303 (2007) 4–28
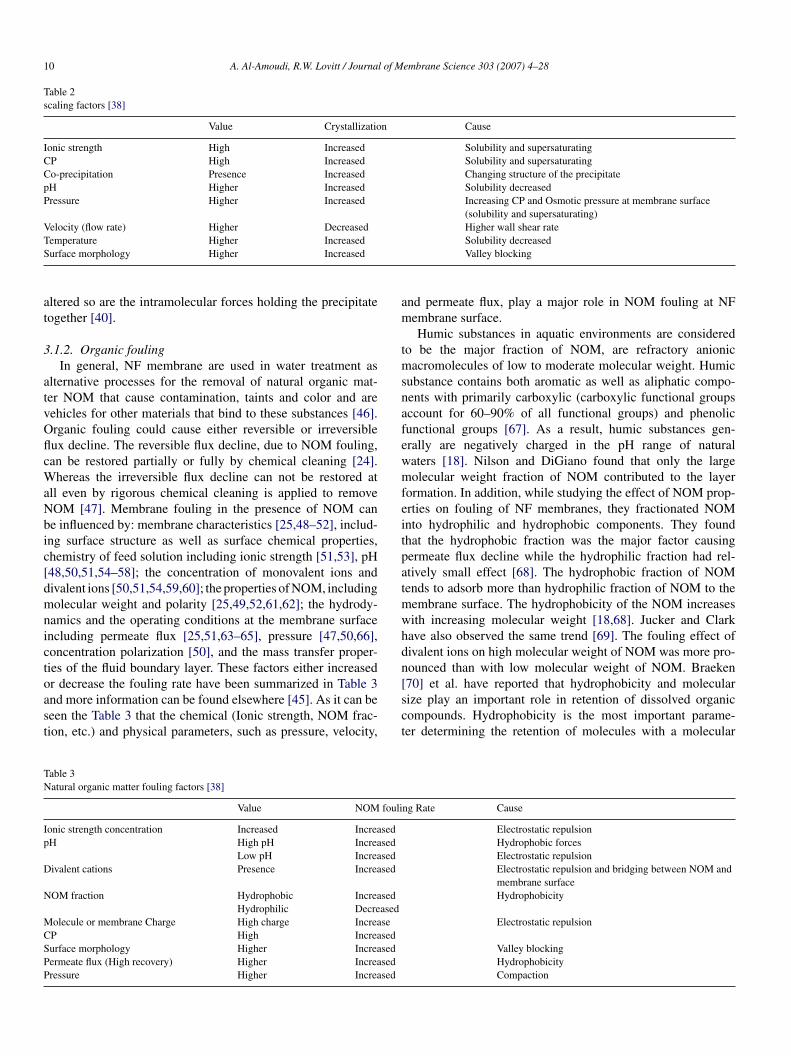
Table 2scaling factors [38]
Value Crystallization Cause
Ionic strength High Increased Solubility and supersaturatingCP High Increased Solubility and supersaturatingCo-precipitation Presence Increased Changing structure of the precipitatepH Higher Increased Solubility decreasedPressure Higher Increased Increasing CP and Osmotic pressure at membrane surface
ltered so are the intramolecular forces holding the precipitateogether [40].
.1.2. Organic foulingIn general, NF membrane are used in water treatment as
lternative processes for the removal of natural organic mat-er NOM that cause contamination, taints and color and areehicles for other materials that bind to these substances [46].rganic fouling could cause either reversible or irreversibleux decline. The reversible flux decline, due to NOM fouling,an be restored partially or fully by chemical cleaning [24].
hereas the irreversible flux decline can not be restored atll even by rigorous chemical cleaning is applied to removeOM [47]. Membrane fouling in the presence of NOM cane influenced by: membrane characteristics [25,48–52], includ-ng surface structure as well as surface chemical properties,hemistry of feed solution including ionic strength [51,53], pH48,50,51,54–58]; the concentration of monovalent ions andivalent ions [50,51,54,59,60]; the properties of NOM, includingolecular weight and polarity [25,49,52,61,62]; the hydrody-
amics and the operating conditions at the membrane surfacencluding permeate flux [25,51,63–65], pressure [47,50,66],oncentration polarization [50], and the mass transfer proper-ies of the fluid boundary layer. These factors either increased
r decrease the fouling rate have been summarized in Table 3nd more information can be found elsewhere [45]. As it can beeen the Table 3 that the chemical (Ionic strength, NOM frac-ion, etc.) and physical parameters, such as pressure, velocity,
[sct
able 3atural organic matter fouling factors [38]
Value NOM fouli
onic strength concentration Increased IncreasedH High pH Increased
OM fraction Hydrophobic IncreasedHydrophilic Decreased
olecule or membrane Charge High charge IncreaseP High Increasedurface morphology Higher Increasedermeate flux (High recovery) Higher Increasedressure Higher Increased
Solubility decreasedValley blocking
nd permeate flux, play a major role in NOM fouling at NFembrane surface.Humic substances in aquatic environments are considered
o be the major fraction of NOM, are refractory anionicacromolecules of low to moderate molecular weight. Humic
ubstance contains both aromatic as well as aliphatic compo-ents with primarily carboxylic (carboxylic functional groupsccount for 60–90% of all functional groups) and phenolicunctional groups [67]. As a result, humic substances gen-rally are negatively charged in the pH range of naturalaters [18]. Nilson and DiGiano found that only the largeolecular weight fraction of NOM contributed to the layer
ormation. In addition, while studying the effect of NOM prop-rties on fouling of NF membranes, they fractionated NOMnto hydrophilic and hydrophobic components. They foundhat the hydrophobic fraction was the major factor causingermeate flux decline while the hydrophilic fraction had rel-tively small effect [68]. The hydrophobic fraction of NOMends to adsorb more than hydrophilic fraction of NOM to the
embrane surface. The hydrophobicity of the NOM increasesith increasing molecular weight [18,68]. Jucker and Clarkave also observed the same trend [69]. The fouling effect ofivalent ions on high molecular weight of NOM was more pro-ounced than with low molecular weight of NOM. Braeken
70] et al. have reported that hydrophobicity and molecularize play an important role in retention of dissolved organicompounds. Hydrophobicity is the most important parame-er determining the retention of molecules with a molecular
ng Rate Cause
Electrostatic repulsionHydrophobic forcesElectrostatic repulsionElectrostatic repulsion and bridging between NOM andmembrane surfaceHydrophobicity
Electrostatic repulsion
Valley blockingHydrophobicityCompaction
A. Al-Amoudi, R.W. Lovitt / Journal of Membrane Science 303 (2007) 4–28 11
Fea
wmf
aihlcwttcoslc[
hgmccp[hm
caccdaa
Fpc
ia
nBtpietmsT
fsaiattaiaafoibsaa
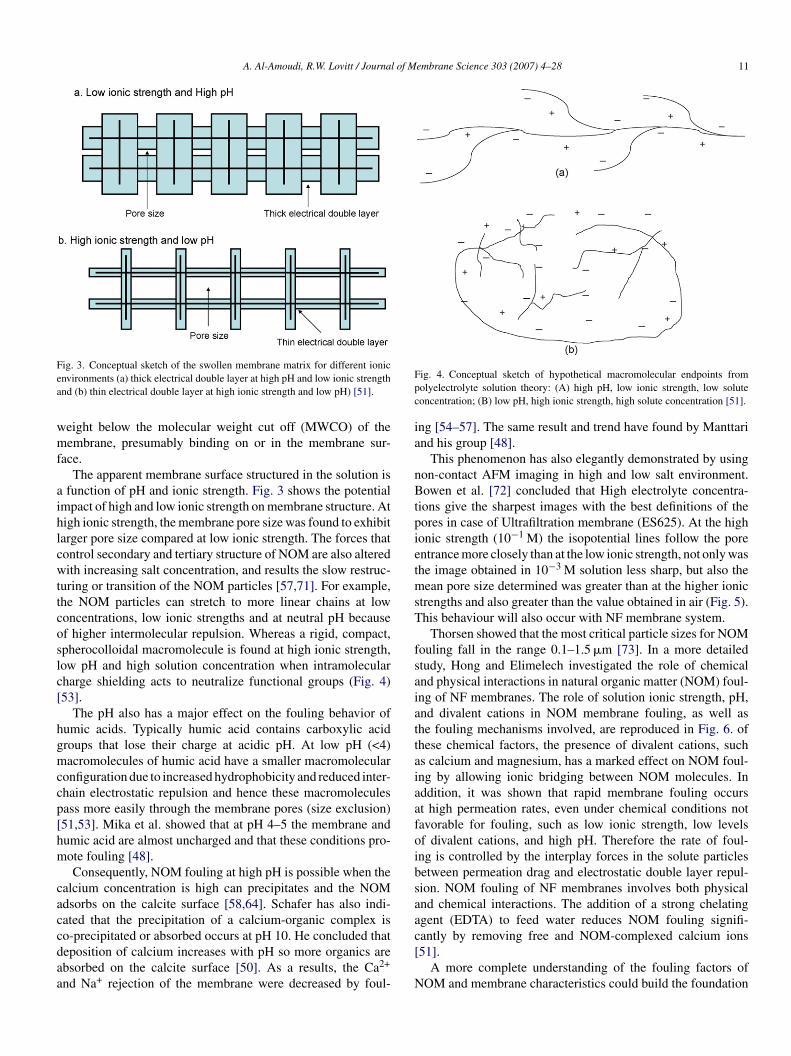
ig. 3. Conceptual sketch of the swollen membrane matrix for different ionicnvironments (a) thick electrical double layer at high pH and low ionic strengthnd (b) thin electrical double layer at high ionic strength and low pH) [51].
eight below the molecular weight cut off (MWCO) of theembrane, presumably binding on or in the membrane sur-
ace.The apparent membrane surface structured in the solution is
function of pH and ionic strength. Fig. 3 shows the potentialmpact of high and low ionic strength on membrane structure. Atigh ionic strength, the membrane pore size was found to exhibitarger pore size compared at low ionic strength. The forces thatontrol secondary and tertiary structure of NOM are also alteredith increasing salt concentration, and results the slow restruc-
uring or transition of the NOM particles [57,71]. For example,he NOM particles can stretch to more linear chains at lowoncentrations, low ionic strengths and at neutral pH becausef higher intermolecular repulsion. Whereas a rigid, compact,pherocolloidal macromolecule is found at high ionic strength,ow pH and high solution concentration when intramolecularharge shielding acts to neutralize functional groups (Fig. 4)53].
The pH also has a major effect on the fouling behavior ofumic acids. Typically humic acid contains carboxylic acidroups that lose their charge at acidic pH. At low pH (<4)acromolecules of humic acid have a smaller macromolecular
onfiguration due to increased hydrophobicity and reduced inter-hain electrostatic repulsion and hence these macromoleculesass more easily through the membrane pores (size exclusion)51,53]. Mika et al. showed that at pH 4–5 the membrane andumic acid are almost uncharged and that these conditions pro-ote fouling [48].Consequently, NOM fouling at high pH is possible when the
alcium concentration is high can precipitates and the NOMdsorbs on the calcite surface [58,64]. Schafer has also indi-ated that the precipitation of a calcium-organic complex is
o-precipitated or absorbed occurs at pH 10. He concluded thateposition of calcium increases with pH so more organics arebsorbed on the calcite surface [50]. As a results, the Ca2+
nd Na+ rejection of the membrane were decreased by foul-
c[
N
ig. 4. Conceptual sketch of hypothetical macromolecular endpoints fromolyelectrolyte solution theory: (A) high pH, low ionic strength, low soluteoncentration; (B) low pH, high ionic strength, high solute concentration [51].
ng [54–57]. The same result and trend have found by Manttarind his group [48].
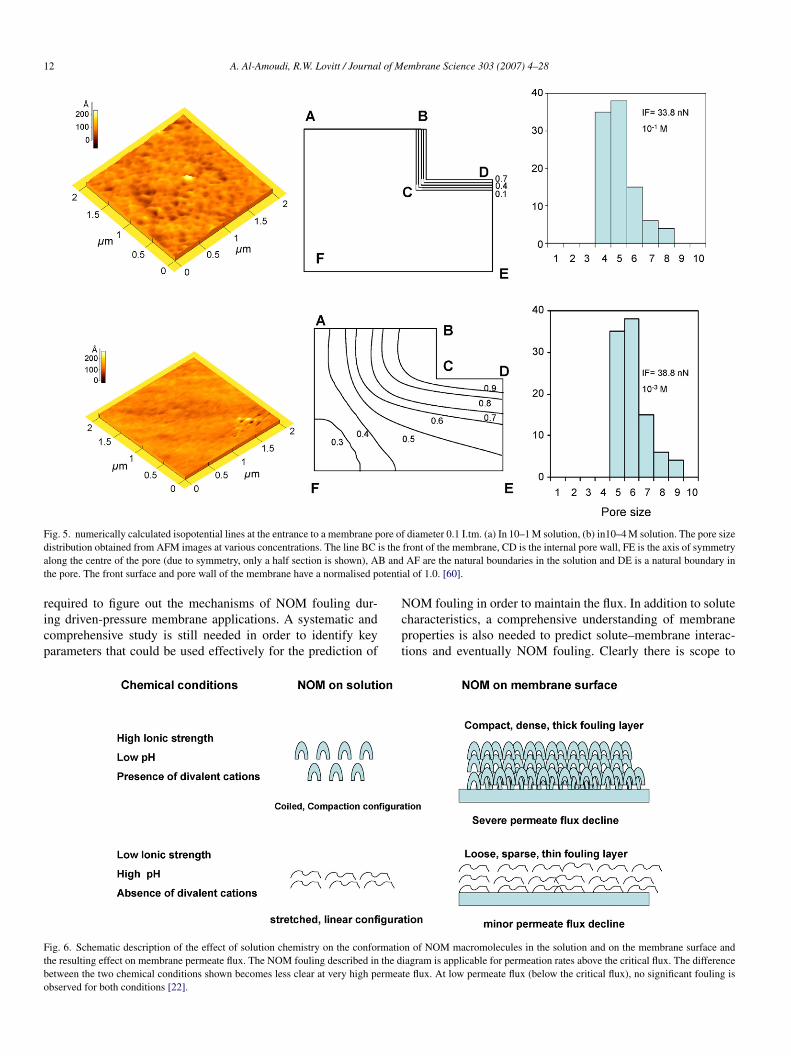
This phenomenon has also elegantly demonstrated by usingon-contact AFM imaging in high and low salt environment.owen et al. [72] concluded that High electrolyte concentra-
ions give the sharpest images with the best definitions of theores in case of Ultrafiltration membrane (ES625). At the highonic strength (10−1 M) the isopotential lines follow the porentrance more closely than at the low ionic strength, not only washe image obtained in 10−3 M solution less sharp, but also the
ean pore size determined was greater than at the higher ionictrengths and also greater than the value obtained in air (Fig. 5).his behaviour will also occur with NF membrane system.
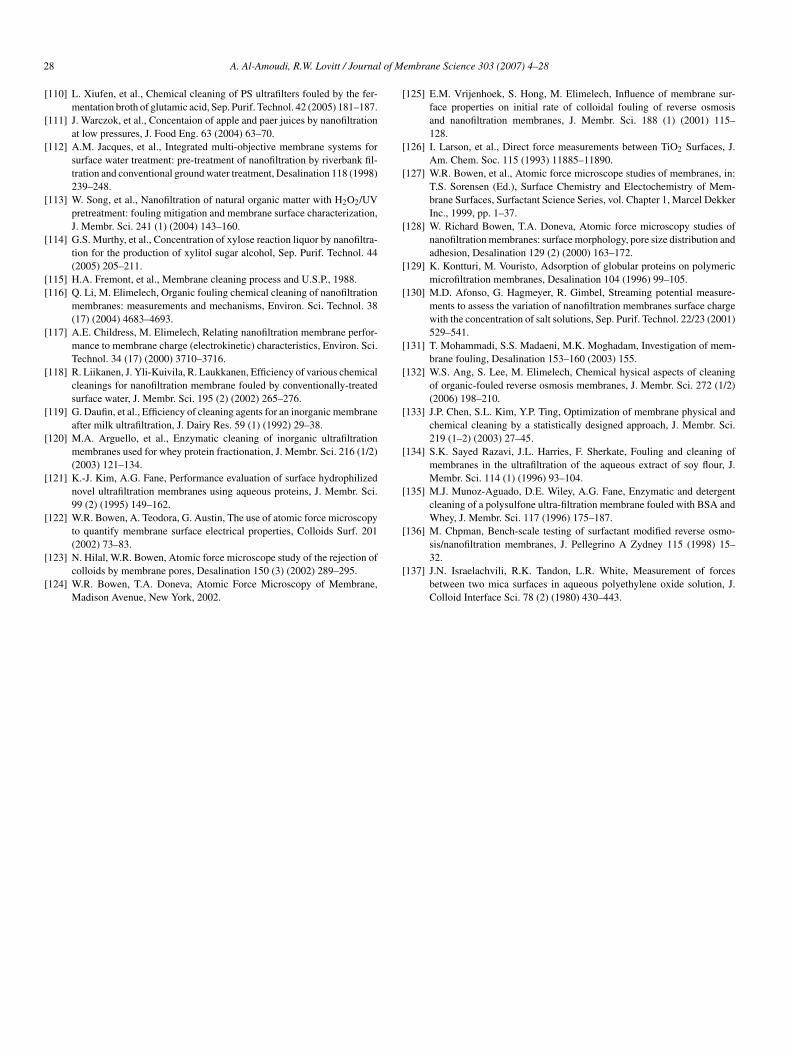
Thorsen showed that the most critical particle sizes for NOMouling fall in the range 0.1–1.5 �m [73]. In a more detailedtudy, Hong and Elimelech investigated the role of chemicalnd physical interactions in natural organic matter (NOM) foul-ng of NF membranes. The role of solution ionic strength, pH,nd divalent cations in NOM membrane fouling, as well ashe fouling mechanisms involved, are reproduced in Fig. 6. ofhese chemical factors, the presence of divalent cations, suchs calcium and magnesium, has a marked effect on NOM foul-ng by allowing ionic bridging between NOM molecules. Inddition, it was shown that rapid membrane fouling occurst high permeation rates, even under chemical conditions notavorable for fouling, such as low ionic strength, low levelsf divalent cations, and high pH. Therefore the rate of foul-ng is controlled by the interplay forces in the solute particlesetween permeation drag and electrostatic double layer repul-ion. NOM fouling of NF membranes involves both physicalnd chemical interactions. The addition of a strong chelatinggent (EDTA) to feed water reduces NOM fouling signifi-
antly by removing free and NOM-complexed calcium ions51].
A more complete understanding of the fouling factors ofOM and membrane characteristics could build the foundation
12 A. Al-Amoudi, R.W. Lovitt / Journal of Membrane Science 303 (2007) 4–28
Fig. 5. numerically calculated isopotential lines at the entrance to a membrane pore of diameter 0.1 I.tm. (a) In 10–1 M solution, (b) in10–4 M solution. The pore sized is thea B andt otenti
ricp
Ftbo
istribution obtained from AFM images at various concentrations. The line BClong the centre of the pore (due to symmetry, only a half section is shown), Ahe pore. The front surface and pore wall of the membrane have a normalised p
equired to figure out the mechanisms of NOM fouling dur-ng driven-pressure membrane applications. A systematic andomprehensive study is still needed in order to identify keyarameters that could be used effectively for the prediction of
Ncpt
ig. 6. Schematic description of the effect of solution chemistry on the conformatiohe resulting effect on membrane permeate flux. The NOM fouling described in the detween the two chemical conditions shown becomes less clear at very high permeabserved for both conditions [22].
front of the membrane, CD is the internal pore wall, FE is the axis of symmetryAF are the natural boundaries in the solution and DE is a natural boundary in
al of 1.0. [60].
OM fouling in order to maintain the flux. In addition to soluteharacteristics, a comprehensive understanding of membraneroperties is also needed to predict solute–membrane interac-ions and eventually NOM fouling. Clearly there is scope to
n of NOM macromolecules in the solution and on the membrane surface andiagram is applicable for permeation rates above the critical flux. The differencete flux. At low permeate flux (below the critical flux), no significant fouling is
l of Membrane Science 303 (2007) 4–28 13
iN
3
iimbopfprsippktwabnoi
3
aTfptac[iemppusmpirosdto
mi
Fig. 7. Membrane arrays—straight and tapered brine stage (a) straight brinestage one pressure vessel contained six element in series), (b) tapered brinestaging in the ratio of 2:1 each presser vessel have six membrane elements),(mp
mw
1
2
3
3
awaalce
A. Al-Amoudi, R.W. Lovitt / Journa
mprove processes and membrane by understanding the natureOM–membrane interaction.
.1.3. BiofoulingBiofouling is a term used to describe all instances of foul-
ng where biologically active organisms are involved [74]. Thiss distinct from NOM fouling caused by contaminated organic
atter that may be derived from biological systems. Membraneiofouling is caused by bacteria and to a lesser degree, fungi andther eukaryote microorganisms [75]. Biofouling is a dynamicrocess of microbial colonization and growth, which result in theormation of microbial biofilms. Biofilm formation invariablyrecedes biofouling, which becomes an issue only when biofilmseach thickness and surface coverage that may cause problemsuch as declined normalized flux and/or increase in normal-zed pressure drops during NF or RO operation [22,76]. Manyroducts from biofilms have been shown to enhance inorganicrecipitation through enhanced nucleation and crystallizationinetics, e.g. carbonate and silicates. Biofouling can be con-rolled by (1) removal of degradable components from the feedater, (2), ensuring the relative purity of the chemicals dosed
nd (3) performing effective cleaning procedures. Also, it haseen reported that cleaning procedures applied when fouling isot a problem might delay biofilm formation [77]. The surfacef the membrane offers good site for microbial colonization ast concentrates nutrients for growth.
.2. Operational aspect of NF and fouling
From the mechanisms of fouling process above, many oper-ting procedures have a direct impact on fouling of membranes.his section reviews the effect of membrane process design on
ouling. In most cases flux rate is considered as a key designarameters for membrane system and reflect membrane produc-ivity. The two factors that lead to deterioration the flux ratere fouling and concentration polarization. In order to over-ome these shortcomings the membrane array is to be introduced21,67,78–81]. An appropriate membrane array was consideredn designing membrane treatment system in order to reduce theffects of both concentration polarization and to minimize theembrane fouling. Typically, membrane systems use multiple
arallel modules so that the plant performance in terms of theroduct quality and recovery remain identical for a single mod-le (Straight brine stages; typically a single module containsix elements). In the tapered systems (Tappered brine stages;embrane array design 2:1, 3:2:1, 4:2:1), the feed stream is
assed through the first module (or parallel set of modules) ands divided two streams. These streams are the product and theeject stream, the reject stream from first module (or parallel setf modules) is passed through as feed to the second module (oret of modules). Here the velocities are boosted at each stage byecreasing the number of modules in parallel. Thus it is possibleo obtain a high recovery while still avoiding the worst effects
f fouling and concentration polarization (Fig. 7).
The membrane arrangements are designed with the aim ofinimizing fouling and reducing concentration polarization by
ncreasing number of stages and reducing the number of ele-
cteo
c) tapered brine staging in the ratio of 3:2:1 each presser vessel contained fourembrane elements) and (d) tapered brine staging in the ratio of 4:2:1 each
ressure vessel contained four elements).
ents per stage in order to maintain the same or high recoveryill involve the following constraints [10,82]:
. The flow rate should not exceed the maximum flow rate perelement, qmax, to avoid large axial pressure drops which couldcause membrane element damage such as telescoping.
. There is a lower limit on the flow rate per element, qmin, inorder to control concentration polarization and scaling.
. There is a maximum recovery for each stage as well as overallmaximum recovery in order to minimize the fouling.
.3. Primary location for specific types of fouling
When reviewing the major causes of NF membrane foulingnd associated mechanisms, it is very important to understandhere the fouling takes place in membrane system in order to
rrange the module and optimize fluid handling (see sectionbove). Typically the fouling typically takes place either in theead element (first element in the pressure vessel) where parti-les became entrapped on the surface or in the end element (lastlement in the same pressure vessel) where salts are highly con-
entrated). Usually organic and metal oxide fouling take place inhe first stage of lead element, metal oxide and colloids depositarly in the process as drag forces are relatively high. However,rganic fouling usually occurs heavily in the feed side of the
14 A. Al-Amoudi, R.W. Lovitt / Journal of M
Table 4where fouling occurs first, adapted from hydranautics technical service bulletintsp [82]
Type of foulant Most susceptible stage of NF/RO
Scaling/silica Last membrane in last stageMetal oxides First membranes of first stageColloids First membranes of first stageOrganic First membranes of first stageBB
mss
ssws
fii
3
uo
3
dfsdoCicftpwbwtUcwdpomta
paacfd
3
ouwTairtaa
3
tewsbo(
ottmmatcmsh
3
tTtmucts
iofouling (rapid) First membranes of first stageiofouling (slow) Throughout the whole installation
odule. While biofouling can be found throughout the filtrationtages, however, rapid biofouling was found mostly in the feedide as a result of particle and nutrient attachment [83].
In general, scaling and silica fouling take place in the brineide membrane elements when the concentration of inorganicalts exceeds the solubility limit. The types of the foulants andhere they usually cause fouling in typical NF/RO systems are
ummarized in Table 4 [83].There are two strategies in order to minimize the effect of
ouling, and these can be classified into two major groups min-mization and remediation. Both of the strategies are practicedn membrane process industries.
.4. Fouling minimization
It is possible to avoid or control fouling to certain extent bysing adequate pretreatment such as coagulation/precipitation,r slow sand filtration and membrane surface modification.
.4.1. Coagulation followed by filtration–sedimentationConventional coagulation filtration pretreatment was
esigned to remove most of the potential foulant materialsrom the pretreated feed by prefiltration and more rarely byedimentation. The degree of the pretreatment, however, isependent on the raw water quality, particularly its content ofrganic (including biological) and inorganic suspended matter.oagulant and coagulant aids can be added in a pretreatment to
ncrease separation efficiency. Several studies were have beenarried out on the pretreatment side in order to remove theoulant materials by optimizing the operational conditions ofhe pretreatment process such as flow rate, backwash frequency,H, etc. [84,85]. Howe and Clark [86], reported studies thatere focused on the effect of coagulation on the foulingy dissolved and particulate colloidal matter. Tests with andithout prefiltration were able to provide a comparison between
he effect of particulate versus dissolved and colloidal matter.sually, less than 20% of the fouling in their experiments
ould be attributed to particulate matter. They concluded thathen the water was treated with coagulant, the fouling usuallyecrease after prefiltration and suggested that the coagulatedarticulate matter was able to form a dynamic layer material
n the membrane surface. Thus, the fine particles could removeaterials that would otherwise foul the membrane. When
he dynamic layer was eliminated by prefiltration the foulingctually worsened [86]. Earlier work [87] on surface water
mAcw
embrane Science 303 (2007) 4–28
retreatment reducing Ca2+ and Mg2+ to very low level waschieved using a complex multi-stage process of coagulationnd flocculation using lime; mechanical bed filtration; weakation ion exchange and deep-cartridge filtration, were success-ul in obtaining pretreated water with Ca2+ and Mg2+ under theetection limit.
.4.2. Scale inhibitorsAnother approach is to avoid scale formation the addition
f scale inhibitors. It is obvious that scaling intensity dependspon the chemical composition of feed water; therefore waterith a high scaling potential requires treatment using scale [30].he chemical species, such as lime and soda or caustic soda aredded to hard water in order to remove or reduce the hardnessons. Alkaline chemical additives are added to hard water toaise the pH in order to convert bicarbonates to carbonates andhen calcium and magnesium are removed from water as CaCO3nd Mg(OH)2 prior to filtration. Zero hardness water can not bechieved due to the limited solubility of CaCO3 and Mg(OH)2.
.4.3. Membrane prefiltration and membrane modificationThe application of microfiltration (MF) as well as ultrafiltra-
ion (UF) as NF prefilters has emerged in the last decade as anfficient method in pretreating surface water [88]. Both UF asell as MF membranes offer good physical barrier to colloids,
uspended particles as well as microbes. Both MF and UF mem-rane can be used ahead of desalination units and have capabilityf filtering out particles in the ranges “between” 0.005 � to 0.1 �UF) whereas 0.1 � to 3 � (MF) [63].
Attempts have been made to modify membrane surfaces inrder to make them less vulnerable to fouling. In some cases,he surface roughness increases membrane fouling by increasinghe rate of attachment onto the membrane surface and hence the
embranes with a rough surface is more prone to fouling thanembrane with a smoother surfaces [50,51]. Colloidal inter-
ctions are also important in fouling and charged componentsend to cause fouling because of electrostatic attractions betweenharged components and the membrane (see above). Develop-ent of membranes with lower surface charge or surface charge
imilar to that of the foulant, with hydrophilic character mayelp solve these specific problems [89].
.4.4. SonicationThe effect of the particle concentration on the ultrasonic con-
rol of the membrane fouling was investigated by Chen et al. [90].he basic principle of operation is that ultrasound removes par-
icles from the surface by causing particle movement in or nearembrane. In this experimental work it was concluded that the
ltrasound reduced ceramic membrane fouling by silica parti-les during cross-flow filtration. At low particle concentrations,here was a little membrane fouling in the presence of ultra-ound. However, the permeate recovery of the ultrasound treated
embrane decreased with an increased in particle concentration.t low particle concentrations (lower than 0.8 g/L) the particle
oncentration effect was more apparent when the membraneas far away from the cavitation region. However, at higher
l of M
pts
spl
•
•
•
•
•
•
4
4
nfdpofcsPfaatrTic
actobon
mtNivitsvoticttbmads
4
cbti1pntwpdaimfcibN
cicua1aae
A. Al-Amoudi, R.W. Lovitt / Journa
article concentrations of greater than 0.8 g/L the effect of par-icle concentration was more pronounced when the membraneonifacation power was close to the cavitation region.
Standard water treatments, carried out in order to solvepecific pretreatment problems, could lead to further foulingroblems. Walton [91], outlined some of these problems as fol-ows:
The use of certain phosphate anti-scalants stimulates biolog-ical activity in both the internal and external environments.The use of organic biocides to control biological growth oftenresults in organic slime formation and subsequent after growthactivity and colloidal entrapment.The use of flocculants to control particulate matter results incolloidal iron or aluminium floc fouling, especially in associ-ation with organic slimes.The introduction of oxygen or oxidants into anaerobic sys-tems results in iron and sulphur precipitation and potentialstimulation of iron hydroxide slime-production.Addition of minerals acid anti-scalant can produce avail-able CO2 allowing biological growth, especially algae andautotrophic bacteria.The use of activated carbon for dechlorination and/or organicremoval results in an excellent substrate for bacterial growthproducing fouling byproduct; it can also absorb polyelec-trolyte and organic antiscalants.
. Membrane cleaning
.1. Remediation of the membrane
Remediation is usually conducted by chemical cleaning forearly all membrane processes and application. However, therequency of the chemical cleaning could range from a routineaily process such as in whey processing to long term annualrocesses such as in desalination plant according to occurrencef fouling [89]. In general, much of the decline in membrane per-ormance can be corrected by cleaning the membrane. Cleaningan be defined as “a process where material is relieved of aubstance, which is not an integral part of the material”, [92].hysical cleaning methods include for example: hydrodynamicorward or reverse flushing, permeate back pressure, air spurgend automatic sponge ball cleaning. These methods depend onmechanical treatment to dislodge and remove foulants from
he membrane surface. Application of these methods usuallyesults in a more complex control and design of equipment.he physio-chemical cleaning methods use mechanical clean-
ng methods with the addition of chemical agents to enhanceleaning effectiveness [93].
Adequate pretreatment and appropriate membrane selections mentioned above can slow the fouling rate, but the membraneleaning is an essential step in maintaining the performance ofhe membrane process. The ideal cleaning processes should not
nly be effective against several foulants, but gentle to the mem-ranes so as to maintain and restore their characteristics. Theptimal (the least membrane damage and maximal effective-ess of cleaning) choice of the cleaning agent is a function of
iacd
embrane Science 303 (2007) 4–28 15
embrane material as well as foulants. Fu et al. [94] noticedhat two NF membranes with different properties (TS 80 andT47450), fed by the same feed water, required different clean-
ng processes. The results of cleaning procedures are sometimesery difficult to determine using only flux recovery data. It is ofnterest to know in what way the cleaning agent interacts withhe membrane and whether it actually modifies the membraneurface structure and chemistry in such a way that fouling is pre-ented. It has been noticed that cleaning often increases the fluxf the virgin membrane [95]. The chemical reactions betweenhe chemical agents and the foulant takes place either by chang-ng the morphology of the foulant or by altering the surfacehemistry of fouling layer in order to remove the foulants fromhe membrane surfaces [96]. Kosutic and Kunst [97], concludedhat an irreversible change in the porous structure of NF mem-rane was observed as a result of the chemical cleaning. Cleaningay make the pore surfaces more hydrophilic and charged by the
dsorption of the chemical agent [98]. Chemical cleaning proce-ures and commercial membrane cleaning products are almostpecified by membrane manufacturers [96,99].
.2. General considerations and costs
In any membrane processes, the need for proper and periodi-al cleaning is essential regardless of the type feed be; seawater,rackish water, wastewater or industrial water. The objective ofhe cleaning processes is to restore membrane performance whent falls below the expected permeate yield typically by about0%, or feed pressure increase by about 10% and/or differentialressure increase by 15–50% [24]. Membrane replacement is aecessary part of the plant operation that is needed to main-ain the quality of the product water to the protocol agreedith membrane manufacturers as well as to meet the designroductivity when the cleaning processes fail to restore theeclined flux [100]. Usually about 10% of the membrane isnnually replaced in order to maintain the targeted product qual-ty as well as quantity. It has been reported that the cost of the
embrane replacement is about 2–3% of product water costrom Jeddah SWRO Plant at power cost $ 0.1 kWh−1 (waterost = 1.473 $/m3) [101]. Although, there are a number of clean-ng techniques such as physical or chemical or combination ofoth, only the chemical cleaning methods are widely used byF and RO industries for membrane cleaning and regeneration.The complexity and detailed understanding of cleaning pro-
esses has not yet been addressed by many researchers ands needed for a clear knowledge of these processes. Althoughleaning is intended to restore the flux, it often deteriorates prod-ct quality and increases the cleaning frequency affecting plantvailability. For example, cleaning processes sometimes takes–2 days to complete in large plants [24]. Desalination plantvailability is usually designed to be in the range of 90–97%nd varies according to the type of water being treated. How-ver, this percentage can be reduced if the cleaning frequency
s increased, but the costs routine of plant maintenance, thedditional manpower utilization and energy consumed duringleaning processes can increase the overall cost of water pro-uction. In general, the chemical consumption of the plant per
1 l of M
yliofic
5ttiet1d
4
4
alaaocetfetrosbhsaamtiftm
atoaFmgcatt
c(atconNawm
ifla(eniwbcsectahiSaefwtif(Iolbdatto
thmdb
6 A. Al-Amoudi, R.W. Lovitt / Journa
ear is about 0.3–1% of total water treatment cost, neverthe-ess, the chemical consumption of the cleaning process per years much higher than the annual chemical consumption for theverall RO process (conditioning etc.,) [102]. These general costgures exclude the additional facilities, manpower and energyonsumed for cleaning.
It is well recognized that the energy cost of the plant is about0–60% from the total water cost [101–103]. Moch [102] statedhat “power, itself, can be a half to three quarters of the opera-ional and maintenance costs”. In general the cleaning processncreases the overall system energy efficiency, regardless of thenergy consumed during the cleaning. For example by reducinghe net driving pressure will be reduced after cleaning by about0–30% which is quiet considerable energy saving, especiallyuring the plant operation [24].
.3. Assessment of cleaning agents
.3.1. Type of cleaningA large number of chemical cleaning agents are commercially
vailable, and commonly used ones fall into six categories: alka-is, acids, metal chelating agents, surfactants, oxidizing agentsnd enzymes [104,105]. Commercial cleaning products are usu-lly mixture of these chemicals but the actual composition isften not clearly specified. Table 5 [106] shows the chemicalleaning agent recommended by various membrane manufactur-rs. The table gives the details of chemicals and its concentrationo be used for different type foulants. The choice of the pre-erred cleaning product depends on feed characteristics. Forxample, acid cleaning is suitable for the removal of precipi-ated salts, such as CaCO3, while alkaline cleaning is used toemove adsorbed organics [89]. When surfactant is introducedn the membrane surface in order to restore the membrane flux,urfactant adsorption is possible from hydrophobic interactionsetween the hydrophobic portion of the membrane surface andydrophobic tails of the surfactant. In spite of increased electro-tatic repulsion between the negatively charged membrane andnionic surfactant, even at a low surfactant concentration maydsorb on to a negative-charged surface due to an ion exchangeechanism leading to a higher concentration of surfactant near
o membrane surface compared to bulk solution, which maynduce a micellization process at the membrane solution inter-ace [107]. On the other hand, cationic surfactant could leado a reduction in membrane permeability owing to membrane
odification with a cationic surfactant [108,92].As mentioned earlier, NF membranes are extremely vulner-
ble to natural organic matter (NOM) fouling, especially inhe presence of divalent cations [109,50,51]. Characterizationf NOM-fouled membranes by contact angle, zeta potential,nd attenuated total reflection-fourier transform infrared (ATR-TIR) spectroscopy as well as molecular weight distributioneasurements demonstrated that colloidal material with hetero-
eneous characteristics with variable area of hydrophobicity and
harge membrane [104]. These materials are typified by humiccids, fulvic acids, proteins and peptides. Typically, NOM tendo have higher hydrophobic fraction of about 75% comparedo about 20% of hydrophilic fraction in water such as Orange
kmeh
embrane Science 303 (2007) 4–28
ounty ground water. While Horsetooth reservoir surface waterHT-SW) found to have high fraction of hydrophilic NOM ofbout 65% compared to about 27% of hydrophobic NOM frac-ion. Lee reported that a caustic solution was more effective thanitric acid for fouled membrane with the hydrophobic fractionf NOM. On the other hand, chemical cleaning agents wereot able to clean fouled membrane by hydrophilic fraction ofOM, because of lack of electrostatic repulsion between NOM
cids and the negatively charged membrane surface [104]. Thisas due to high ionic strength of the feed solution masking theembrane surface charge.In general, alkaline cleaning recovers the flux, while the
ntroduction of alkaline chelating agent further increases theux. Liikanen et al. [109] reported that alkaline chelatant suchs EDTA increased the flux more than plain alkaline cleaningNaOH) due to membrane charge increase in EDTA alkalinenvironment, which makes the membrane more open. Liika-en et al. concluded that alkaline and chelating cleaning agentsncreased membrane flux, but they reduced the ion retention,hereas acidic cleaning could be used in order to recover mem-rane ion retention. In a recent study, Li et al. [110] noticed thatombined simultaneous process of NaOH with sodium dodecylulfate (SDS) demonstrated greater cleaning power and cleaningfficiency by about more than 100% compared to that of singleleaning with each of NaOH or SDS alone. This is also true whenwo step method in which SDS cleaning step was performedfter caustic treatment [111]. Jacques et al. [112] reported thatydrochloric acid cleaning showed better results than citric acidn removal of the iron deposition on the membrane surface [32].ong [51,113] reported that sequential use of both caustic andcid cleaning was more effective, in terms of high flux recov-ry, than caustic or acid alone in removing both acidic and basicractions of NOM. Also he reported that the caustic cleaningas found to more effective than acid cleaning in removal of
he NOM foulants. This is a result of the presence of hydroxylons in caustic solutions, which could promote disruption of theoulant layer by these mechanisms: (i) increasing ionic strength,ii) increasing solubility of NOM foulants, (iii) increasing pH.ncreasing the pH should result in an increased negative chargef NOM, because of deprotonation of the carboxyl and pheno-ic groups. Conversely, decreasing negative charge of NOM haseen observed as a result of adsorption of sodium ions to NOMuring cleaning with [81,113]. EDTA and SDS were also useds effective cleaning agents in order to remove virtually or all ofhe NOM foulant material [51,114]. The acid cleaning is effec-ive in removal of precipitated salts (scaling) from the surfacef the membrane and from the pore [10].
The polyamide thin film membrane (TFM) is very sensitiveo disruption by the oxidising agent. Powerful oxidation agentsave not been used in order to regenerate membrane perfor-ance because of oxidation agent typically causes irreversible
amage to these membranes. However, there is a procedureased on a patented chemical cleaning using NaOCl where a
nown concentration is prepared and recirculated through theembrane cells for 20 min at pH > 10, while chlorine oxidation
ffects were almost negligible [115]. This cleaning procedure atigh pH was effective to remove the organic foulant materials
A.A
l-Am
oudi,R.W
.Lovitt/JournalofM
embrane
Science303
(2007)4–28
17Table 5chemical cleaning agents recommend by different manufacturers
Type of foulant Type of membranes
DuPont B-10′ FilmTec FT-30 Fluid System Nitto Denko Toyobo Toray
Flow rate velocity as high as possible, pressure as lowest as possible, temperature does not exceed manufacturer recommendation (<45 ◦C).
18 A. Al-Amoudi, R.W. Lovitt / Journal of Membrane Science 303 (2007) 4–28
F ure bys
fobpfl
4
ismmciEhe
hcSbSrtsiidc(s
Aatpctttitfaaicambt
diedor
4
ig. 8. Schematic illustration of the change in the organic fouling layer structtructure of the fouling layer after EDTA addition [117].
rom membrane surface [78]. Hydrogen peroxide also used asxidizing cleaning agent at high pH in order to clean the mem-rane from NOM. A combination of both Cl2 and H2O2 at highH were noticed that had remarkable increased in the productux [78].
.3.2. Cleaning mechanismsIt is reported that the presence of Ca2+ with humic acid
ncreased the fouling rate of humic acid on the membraneurfaces. Li and Elimelech [116], reported that the proposedechanisms of chemical cleaning with EDTA in order to cleanembrane from NOM (humic acid). Since EDTA forms a strong
omplex with Ca2+, humic acid molecules associated with Ca2+
ons are replaced by EDTA via a ligand exchange reaction.DTA cleaning agent does reduce the intermolecular Ca2+-umic acid complexes and humic acid molecules can be moreasily rinsed off the membrane surface as illustrated in Fig. 8.
The proposed mechanisms of SDS solubilization of Ca2+-umic acid fouled surface at low, moderate and highoncentration are illustrated in Fig. 9. Low concentration ofDS is not sufficient to break the intermolecular bridging formedetween humic acid and Ca2+. When moderate concentration ofDS is used, more SDS molecules partition into the foulant layeresults in breakup of some Ca2+ binding. Once the SDS concen-ration exceeds the critical mycella concentration CMC, it is thentrong enough to break up all the Ca2+-induced bridges, result-ng in the dissociation of humic acid to the aqueous phase (asndicated by the zero adhesion with SDS shown in Fig. 10). Chil-
ress and Elimelech [117], explored the mechanisms of chemicalleaning with SDS and dodecyl trimethylammonium bromideDTAB, cationic surfactant) at high pH and low pH. Fig. 11hows the differences in SDS adsorption at low pH and high pH.
oyp
EDTA (a) compact fouling layer formed in the presence of Ca2+. (b) Loose
t low pH of 3, the membrane initially has a slight positive anddsorption occurs as a result of electrostatic attraction betweenhe positively charge membrane surface and the negative chargedolar head of surfactant ions. The surfactant ions start asso-iating with each other and form surfactant aggregates whenhe concentration of SDS increases causing dramatic change inhe surface charge potential. At pH 8 the membrane has nega-ively charge and the adsorption will be a result of hydrophobicnteraction between membrane surface charge and surfactantail. When the SDS concentration increases, the membrane sur-ace becomes slightly more negative due to a larger number ofdsorbed surfactant molecules. Schematics of adsorption mech-nisms of DTAB molecules onto membrane surface are shownn Fig. 12. As the concentration increases the membrane surfaceharge become more positive due to hydrophobic interactionst low pH. At high pH of 8, the adsorption occurs between theembrane surface and charge polar head of the surfactant will
e due to electrostatic attraction. Hemi-micelle formation mayake place at the very high concentrations [117].
In all cases the cleaning process depends on the type of foulanteposited on the membrane surface, and for a successful clean-ng of fouled membranes, identification of the type of foulant isssential which is done by extensive analysis of the foulants. Aestructive autopsy, which can provide a scientific foundationn which to optimize the cleaning procedure, is done as a lastesort, when cleaning fails to restore membrane performance.
.3.3. The impact of cleaning on NF permeate quality
An impact of cleaning on NF permeate quality has also been
bserved. According to Liikanen et al. who performed anal-sis for alkalinity, hardness and conductivity found that theermeate conductivity generally increased after cleaning [118].
A. Al-Amoudi, R.W. Lovitt / Journal of Membrane Science 303 (2007) 4–28 19
Fig. 9. Mechanism of humic acid solubilization by SDS (a) low SDS concen-tration allows association of humic acid (b) moderate SDS concentration allowpl[
Aahpptccn
4
uT
Fig. 10. Interaction forces between the CML colloid probe and the SRHA fouledmembrane surface in the presence of various chemical cleaning agents. Thetest solution contained 20 mg/l SRHA, cleaning chemical as indicated 1 mMNaHCO3, 1 mM CaCl2 and NaCl to adjust the total ionic strength to 10 mM. thesolution pH during the measurements was fixed at 8.1 [117].
Fi
of surface analysis such as atomic force microscopy (surfacecharacterization by visualization and measurement of the sur-face characteristics), FTIR and zeta potential. The three typesof measurement are complementary.
artial breaking, and (c) SDS concentration exceeding the CMC allowing solubi-ization of humic acid. The binding sits shows are solely for illustration purposes117].
l-Amoudi et al. [24] also recognized that the increase in perme-te conductivity after each chemical cleaning specifically afterigh pH cleaning when it was carried out in commercial NFlant at UmmLujj. However, the acid cleaning following highH cleaning assisted in partial restoration of the ions reten-ion property of membrane [24,118]. This suggests that acidicleaning had a role in preserving the membrane ion retentionapability, probably by making the membranes tighter by chargeeutralisation.
.4. Methods of assessing the cleaning effectiveness
There is several assessment methods of cleaning have beensed and well established in order to evaluate cleaning efficiency.he most common methods are flux measurements, or forms
Fm
ig. 11. Schematic of adsorption of sodium dodecyl sulfate (SDS) moleculesnto the membrane surface [118].
ig. 12. Schematic of adsorption of sodium dodecyl trimethyl ammonium bro-ide (DTAB) molecules into the membrane surface [118].
2 l of Membrane Science 303 (2007) 4–28
4
itdiTpta
ccw
W
wmc
tichl
R
R
waothrfpFa
E
imtmu
flcet
F[
cbufbriacmto
4
abtsitu[tAtflrpAvmn
0 A. Al-Amoudi, R.W. Lovitt / Journa
.4.1. Flux measurement (non-destructive)Flux measurement is a direct assessment of fouling and clean-
ng process and can be made in the applied situation. There isypically a linear relationship between the flux decline and theeposited mass indicating that the flux decline is due to NF foul-ng resulting from deposition heterogeneous crystallization [30].ypically the product water flux declines drastically at higherermeation rates in the presence of NOM refers and relates tohe transport processes driven by the hydrodynamics force thatcts perpendicular to the membrane surface [18,64].
It is important to establish effectiveness of a particularleaning protocol. The clean water flux can be measured andompared to the flux of the original steady state process. Theater flux recovery (WFR) can be calculated [118] as:
FR = Jc
J0(1)
here Jc is the flux after cleaning and J0 is the flux of the virginembrane. The measurement of initial flux and the flux after
leaning has to be carried out at the pressure and temperature.Several authors [119,4,17] have proposed the comparison of
he hydraulic resistance of the cleaned membrane, Rcw, and thentrinsic hydraulic resistance of the membrane to evaluate theleaning efficiency. Permeate flux data was used to evaluate theydraulic resistance of the membrane (R), according to Darcy’saw:
= �P
μJ(2)
and
uf = Rm + Rf = Rm + Rif + Rrf (3)
here �P is the transmembrane pressure; J the permeate flux;nd Ruf, Rm and Rf, respectively, Ruf is the total resistancef the intrinsic hydraulic resistance of the membrane plus theotal resistance of the total fouling membrane (Rf), the intrinsicydraulic resistance of the membrane (Rm), the fRres is residualesistance after cleaning, and the resistance due to membraneouling, which combines reversible (Rrf) and irreversible (Rif)henomena. The variation of membrane resistance is depicted inig. 13. Cleaning can be assumed to be complete when Rcw ≈ Rmllowing for experimental error (Fig. 13) [120].
Cleaning efficiency (ERW) can be determined as
RW =[Rif − Rres
Rif
]× 100 (4)
Both WFR and ERW have been used as a measure of clean-ng efficiency. There is no difference between the above twoethods. However, the hydraulic resistances give a more details
o understandings fundamental to the flux. By knowing theembrane hydraulic resistance and other fouling resistance, an
nderstanding of some fouling properties could be obtained.The efficiency of membrane cleaning is mostly evaluated by
ux measurements [121]. Song et al. reported that the chemicalleaning agents tested could not achieve complete flux recov-ry as a result of residual foulants were strongly embedded inhe concavities of membrane surface [113]. However, Zhu et al.
wwai
ig. 13. Graphical depiction of resistance in filtration, rinsing and cleaning121].
oncluded that most of cleaning agents used improved the mem-rane flux after fouling and some of them even restored the fluxp to about 95%. Recently, Al-Amoudi and Lovitt et al. [95]rom the results of the permeability of the fouled NF-DK mem-rane before and after cleaning showed that the cleaning processestored the declined flux close to its original value. Moreover,t was also found that the SDS cleaning agents triple the perme-bility of the virgin membrane. These results suggest that thehemical cleaning does have a major effect on the flux of NFembrane as well on its surface properties. It has been noticed
hat cleaning often increases the flux and even the permeabilityf the virgin membrane.
.4.2. Atomic force microscopy (AFM) (destructive method)There are now many new surface analysis techniques avail-
ble for assessing membrane fouling and cleaning processes thatased on the visualization of the surface of membrane down tohe nanometer scale [122]. These images allow the assessment ofurfaces and pore by direct measurement of surface morphologyn air and in liquid (process relevant) environment. Analysis ofhese images can be carried out in a number of ways, the mostseful being various measurement and/or dimension of pores122–124]. Atomic force microscopy can be used as good toolo evaluate chemical cleaning procedures performance. UsingFM it was showed that there was an accumulation of the par-
icles in the valleys of rough membranes causing more severeux decline than smooth membranes [125]. Song et al. [113]eported that significant difference between the surface mor-hologies of the virgin and fouled membrane is recognized byFM. Here the root mean square (RMS) surface roughness of airgin membrane was about 48 nm whereas; RMS of the fouledembrane was about 124 nm. This increase in surface rough-
ess was observed as a result of the presence of humic acid
ith calcium on the negatively charged membrane surface. Also,orkers reported that, RMS of cleaned fouled membrane was
bout 40 nm compared the virgin of about 48 nm. This decreasen surface roughness was possibly due to the presence of resid-
A. Al-Amoudi, R.W. Lovitt / Journal of M
F
ucbac
bpbec
amecb(wcwaotp
atmamtmlciscwfla
sw
4(
ptcatTciTrNawfbm
fbmiapw
4
ttefipttbrc
wemabgpdpotential measurements method can be used not only to evalu-
ig. 14. Scanning electron microscope image of a silicon collide probe [128].
al foulants within the concavities of the membrane surface afterleaning. Warczok et al. [111] recently reported that it is possi-le to determine from AFM images the mean pore distributionnd roughness so indicating whether the cleaning procedure wasorrectly designed or not.
The AFM colloid probe which is powerful technique, haseen used to measure the force of interaction between colloidarticles and the surface of the membrane. Using AFM it is possi-le to directly measure the force of interaction in process relevantnvironments where the cantilever tip of AFM is brought in aontact with membrane surface.
The most commonly used AFM tips for force measurementre the sharp silicon tips which provide high resolution wheneasuring surface topography and force in a process relevant
nvironment, However, attaching a sphere to a tipless AFMantilever has been used to quantify the surface interactionsetween a sphere and a flat surface as well as different materialFig. 14). These so called colloid probes give a known geometryhen approaching or leaving the surface. These probes typi-
ally are about 1–5 �m diameter whose surfaces can be treatedith many materials including foulants. With different foulants
s probe coatings in liquid medium of different salt solutionsr cleaning solution, this technique allows an assessment ofhe foulant membrane interactions and the chemical cleaningrocesses [126,127].
The study of the electrical double layer interaction betweenparticle and membrane by AFM also allows assessment of
he propensity of the surface to fouling when in use. Forceeasurement in conjunction with colloid probe technique also
llow a direct quantification of membrane fouling through theeasurement adhesive force when the probe is retracted from
he surface after contact has been made [128]. Adhesive forceeasurements were performed utilizing carboxylate modified
atex (CML) Colloid probe in the presence of various chemicalleaning agents in order to look into the effect of chemical clean-ng on foulant–foulant interactions in the fouling layer. Fig. 10hows that the adhesive forces were measured with and withouthemical cleaning agent addition. The eliminated adhesive force
as in the presence of EDTA and SDS gave rise to a completeux recovery. While the remaining adhesive force with NaOHddition indicates a poor cleaning efficiency, although, the adhe-
aii
embrane Science 303 (2007) 4–28 21
ive force was reduced significantly by NaOH compared to thatithout chemical cleaning addition.
FTIR technique is used to investigate the membrane surfaceroperties and the cleaning efficiency. Her et al. used FTIRechniques in combination with other techniques to study pre-ipitation scaling attributed to inorganic scales such as CaCO3nd CaSO4 [32]. Zhu and Nystrom [21] have used the FTIRechnique to characterize the chemical cleaning efficiency.hey concluded from the FTIR results that the fouling notablyhanged the FTIR spectrum. New peaks appeared and foul-ng obscured some of the peaks of the polysulfone membrane.he results clearly showed that not all of the fouling had been
emoved by cleaning. Song et al. [113] reported using FilmTecF-70 membrane that from the FTIR results of virgin, fouled
nd cleaned membrane that the peak intensity of the virginere eliminated or severely attenuated due to coating by NOM
oulant, whereas the peaks intensity of caustic cleaned mem-rane tend to be slightly close to the peak intensity of the virginembrane.The cleaning agent may not remove the NOM completely
rom the membrane surface by using EDTA. This is supportedy FTIR spectra measurements for virgin membranes, fouledembrane and cleaned membrane with and without preoxidiz-
ng water where fouled membrane, exposed to preoxidized waternd cleaned with caustic solution, had better peak recovery com-ared to the fouled membrane exposed to raw water and cleanedith caustic solution [113].
.4.4. Zeta potential measurements (non-destructive)The electrokinetic properties of a membrane reveal the elec-
rical characteristics of the membrane surface. Membrane elec-rokinetic properties are determined by streaming potential orlectro-osmosis that involves the relative motion of charged sur-ace and an electrolyte solution, with the results often expressedn term of membrane Zeta potential [129], which is defined as theotential at the surface of shear. By measuring streaming poten-ial with solutions of different pH, the membrane surface isoelec-ric point can be measured. Streaming potential is determinedy measuring the electrical potential difference when there iselative motion between a fluid containing charged species andharged surface caused by hydrostatic pressure gradient.
The interaction of organic and inorganic colloidal substancesith membrane surfaces in aqueous media is dependent on the
lectrostatic properties of both membrane surface and foulantaterial. Therefore, study of membrane surface characteristics
nd its interaction with fouling materials is critical area of mem-rane fouling research. The effect of surface characteristics hasenerally been overlooked in efforts to select optimal (the bestretreated quality) pretreatment schemes and operating con-itions for various membrane separation processes. The zeta
te the surface charge of the NF membrane but also to play anmportant role in the selection of the NF membrane to be usedn the treatment of water [51,130].
2 l of M
Npgpatmbhm
4
tcosc
4
flcsewasTataahsaIfaf
4
boiecttciHia
fbiHw
4
SaemcrhsccetooCittwtSST“a
4
prmhiflBwficncffwm
2 A. Al-Amoudi, R.W. Lovitt / Journa
Recently, workers [95] concluded that using different types ofF membranes (virgin and fouled) were characterized with zetaotential before and after chemical cleaning agents. Results sug-est that the cleaning does have a major effect on surface stateroperties. However, the mechanisms vary from one agent tonother; chemical reactions modify membrane surface proper-ies (surface charge) not only between cleaning agent and virgin
embrane but also between cleaning agents and fouled mem-rane. The study also revealed that SDS cleaning agent has theighest effect on surface charge for both virgin and fouled NFembranes.
.5. Factors affecting chemical cleaning efficiency
Cleaning mainly involves the dissolution of the material fromhe membrane surface and several factors could affect the chemi-al cleaning process. These are: temperature, pH, concentrationf the cleaning chemicals, contact time between the chemicalolution and the membrane and operation conditions such asross-flow velocity and pressure [131].
.5.1. Effect of cleaning solution pHThe pH of cleaning solution affects the recovered permeate
ux of fouled membrane with humic acid. Li et al. reported thatleaning efficiency of EDTA depend critically on the pH of theolution as a result of deprotonation of functional groups. Forxample, at high pH 11 all carboxylic groups are deprotonatedhile at low pH only two or four carboxylic groups molecule
re deprotonated. Ang et al. [132] reported that the influence ofolution pH on EDTA cleaning efficiency had remarkable effect.hey have shown that the cleaning efficiency increased notice-bly (from 25% to 44%) with increasing pH from 4.9 to 11.0 inhe case of EDTA and all carboxylic functional groups of EDTAre deprotonated. The gel layer was broken down more easilyt pH 11 compared to lower pH. On the other hand, solution pHas very little effect on SDS cleaning because of the pKa of theulfate functional group of SDS is at 2.12, implying that SDS islready in its ionic form at ambient and elevated pH values [132].t was concluded that the cleaning solution pH is a governingactor affecting chemical reaction between deposited foulantsnd EDTA, whereas the chemical reaction between depositedoulant and SDS is less influenced by cleaning solution pH.
.5.2. Effect of ionic strength of the cleaning solutionHigh ionic strength of the NaCl solution alone or in a com-
ination with chemical agent has been found to have an effectn the chemical cleaning system. Lee reported that the recover-ng flux of hydrophilic NOM fouled membrane was carried outffectively by high ionic strength of NaCl (0.1 M), whereas theitric acid, caustic, and SDS surfactant were not effective to cleanhe hydrophilic NOM. This could be due to reduced charges ofhe membrane surface and NOM acids leading to double layerompression and charge screening. Also, it is possible that Cl−
ons replaced the foulants of hydrophilic NOM associated withorsetooth surface water (HT-SW) [104]. A combination of high
onic strength and caustic solution were more effective than thecid and SDS solutions for removal hydrophobic of NOM on
[tt[
embrane Science 303 (2007) 4–28
ouled membranes [104]. Lee [81] concluded that additionalenefits from the higher cross-flow velocity and the longer clean-ng duration were negligible for high ionic strength cleaning.owever, Tran et al. [81] concluded that the cleaning efficiencyas found to be superior at higher ionic strengths.
.5.3. Effect of cleaning solution concentrationLi et al, reported that at 1 mM (millimole) concentration of
DS had minor effect on the recovered flux, and a similar observelso was made by Lee [104]. These results indicate poor cleaningfficiency by SDS at this concentration, when an ultrafiltrationembrane was fouled by surface or ground water NOM. A SDS
oncentrations of about 10 mM or higher, cleaning completelyecovered the initial cleaned membrane water flux. On the otherand, Bartlertt et al. [86] noticed that for UF ceramic and theintered stainless steel membrane systems, increasing the con-entration of NaOH above the optimum value do not improve theleaning process but rather reduced the cleaning efficiency. Lit al. [110] reported that increasing the concentration of surfac-ant such as CTAB from 0.1 to 0.5 wt.% had an adverse effectn cleaning, possibly due to adsorption of excess surfactantsnto membrane surface during the cleaning. In their recent work,hen et al. [133] noticed that a significant factor affecting chem-
cal cleaning of both UF and RO membranes is the high pH andhe concentration of cleaning solution. Ang et al. [132], reportedhat cleaning efficiency with EDTA and SDS cleaning increasedith increasing cleaning agents concentration. They concluded
hat cleaning with SDS above CMC is critical factor for efficientDS cleaning, allowing adequate chemical reaction betweenDS and the foulant to break down an alginate gel network.herefore, to better understand the cleaning mechanisms, thestoichiometry” between the cleaning agent concentration andmount of foulant on the membrane surface must be considered.
.5.4. Effect of cross-flow velocity (hydrodynamic shear)Hydraulic cleaning conditions such as cross-flow velocity
lay important role in membrane flux recovery. Lee [104]eported that in an experiment carried out using fouled UFembrane cleaned with caustic chemical cleaning at low and
igh cross-flow velocity, he found that the cleaning efficiencyncreased at high cross-flow velocity compared to low cross-ow velocity, for 1 h duration time [104]. On the other hand,artlett et al. [86] noticed that an increase in cross-flow velocityhile cleaning seems to have minimal effect on membrane flux
ouled with whey protein, for 30 min. The main cause of min-mal effect on flux recovery is attributed to the duration of theleaning and the effect of duration time will be explained in theext section. The cleaning efficiency increased with increasingross-flow velocity when only the chemical reaction between theoulant and cleaning agents has to be high enough to produce aavorable reaction. Otherwise, an increase in cross-flow velocityhich result an increase in the shear rate dose not enhance theass transfer of foulant in the fouling layer to the bulk solution
132]. It can be concluded that the chemical reaction between ofhe cleaning agent with deposited foulants and associated massransfer phenomena are quite important in membrane cleaning132].
l of M
4
mco[[ntpt(e
cccottarc
Foitc
A. Al-Amoudi, R.W. Lovitt / Journa
.5.5. Cleaning durationHydraulic cleaning conditions, such as cleaning duration,
ay play important role for flux recovery at actual plants. Longerleaning time at lower velocity was found more effective inrder to remove the NOM foulants from membrane surfaces104]. In some applications, a cleaning time for 15 min is enough134], while in other applications of membranes more time iseeded for cleaning about 1 h [135] or even longer to reachheir maximal cleaning effect in order to restore the membrane
erformance [24]. In a recent study, Li et al., [110] noticedhat increasing cleaning time from 10 to 20 min for surfactantSDS, CTAB) had greater power on cleaning efficiency. Angt al., [132], in the case of RO membrane reported that, the
dosb
ig. 15. Schematic representation for effective cleaning of organic-fouled RO membraf calcium ions, which bind to organic foulants and form bridges between adjacent fn the fouling layer yielding loosened foulants. These reaction products are removedransfer. Thus, Efficient cleaning can be achieved through the coupling between theonditions responsible for the favourable chemical reaction and mass transfer [133].
embrane Science 303 (2007) 4–28 23
leaning efficiency of EDTA increased dramatically when theleaning time increased from 15 to 60 min. the cleaning effi-iency of SDS at low concentration with cleaning time of 15r 60 min was not incorrigible. In other words, a longer contactime did not contribute to enhancing cleaning efficiency. Unlesshere was a favorable chemical reaction between the foulantnd cleaning agents in the fouling layer there will be little toeduce the foulant–foulant interaction [132]. The duration ofhemical cleaning at different operation conditions has not been
iscussed to any depth in the literature. However, the few papersn cleaning of NF membrane have been published up to dateuggest that shorter filtration cycles and hence more frequentut longer cleaning procedures are beneficial as fouling layers
nes. Across-linked fouling layer is formed on the membrane surface in presenceoulant molecules. During cleaning, the cleaning agent reacts with the foulants
from the fouling layer to the bulk solution through the hydrodynamics/masschemical reaction and mass transfer along with the optimization of cleaning
2 l of M
b[
4
tamfaacncaMip[
motcs
4
aeptuastmm[4cfCaceftds
4
titt
drdTip
cbTmtsmoccfbar
5
pachhorieTfttoTtoboap
cmbfoc
4 A. Al-Amoudi, R.W. Lovitt / Journa
ecome compact with time and are more difficult to remove24,78,133,134].
.5.6. Cleaning frequencyTypical cleaning frequencies for full-scale nanofiltration sys-
ems treating ground water are 3 months to 2 years, with typicaln average of 6 months [112,116]. For surface water the rangeay vary from once per week to once per 3 months. Cleaning
requencies for full-scale nanofiltration system treating seawaterre in the range of 4–6 months [24]. Cleaning frequency playsn important role in the lifetime of the membrane. Increasingleaning frequency could lead deterioration of the cross-linkingetwork of the membrane surface properties by making thehemical interaction between the cleaning solution moleculesnd surface functional groups of the membrane stronger [136].oreover, it has been noticed that cleaning processes often
ncreases the flux even of the virgin membrane by making theore more open or altering the membrane surface properties96,97,99].
The cleaning interval depends on the foulant amount on theembrane surface which is indicated by the decrease in flux
r increase in operating pressure. The amount of cleaning isherefore a function of cleaning duration and the frequency. Aombination of these factors can give widely varying method asuch need optimization.
.5.7. Effect of temperatureThe temperatures of the chemical cleaning solution may
lso play an important role in chemical cleaning system. Gen-rally increased temperature increases the cleaning efficiencyresumably by increasing transport processes and solubility ofhe material. However, the sensitivity of membrane materialssually prohibits the use of very high temperature. Gener-lly, membrane manufacturers recommend chemical cleaninghould be carried out at lower than 45 ◦C. Bartlett et al., noticedhat for the sintered stainless steel membrane and ceramic
embrane, further increases in temperature above the opti-um value reduced chemical cleaning efficiency [86]. Li et al.,
110] reported that preheating the cleaning solution up to about2 ◦C had a significant impact on increased water flux recoveryompared to 25 ◦C where increased cleaning temperature wasavorable for desorption of deposits from the membrane surface.hen et al., [133] noticed that one significant factor which canffect chemical cleaning of both UF and RO membranes is theleaning temperature. Ang et al., [132] shown that, the cleaningfficiency increased dramatically with increasing temperaturerom 20 to 40 ◦C in the case of RO membrane. Both the rate ofhe chemical reaction of EDTA with deposited foulants and theiffusive transport of foulant from the fouling layer to the bulkolution increased as temperature was increased.
.5.8. Effect of pressureOperating pressure is often related to the hydrodynamics of
he system and should be maintained very carefully. Cleanings to be carried out a minimum pressure in order not onto forcehe foulant layer onto the surface making it more adhesive. Onhe other hand, Bartlett et al., [86] reported that ‘these results
mift
embrane Science 303 (2007) 4–28
emonstrate that any applied pressure during cleaning will notesult in maximum cleaning efficiency, while there is surfaceeposits present. The same trend was observed by Sayed [134].his topic was not covered well in literature and further exper-
ments are needed to find out the relationship of the operatingressure on effectiveness of cleaning.
When reviewing the above major factors of NF membraneleaning efficiency, it is very important to understand that mem-rane cleaning involves both chemical and physical interactions.he relationship between the coupled effect of dissolution ofaterial from the membrane surface caused by chemical reac-
ions between the cleaning agents and the foulants and theubsequent mass transfer of the dissolved or loosened foulantaterials into the bulk solution (Fig. 15) [132]. The effectiveness
f cleaning in terms of chemical reactivity depends on the type ofleaning solution, cleaning solution pH, cleaning chemicals con-entration and ionic strength while mass transfer of the foulantrom the fouling layer to the bulk solution was mainly controlledy the cross-flow velocity and pressure, whereas cleaning timend temperature affects both the mass transfer and chemicaleaction.
. Discussion and conclusion
This review is focused on the types of membrane foulingrocesses that lead to deterioration of the plant performancend there subsequent recovery using membrane cleaning pro-esses. Different types of inorganic fouling and organic foulingave been addressed in this study. Fouling problems lead toigher operation costs, higher energy demand, reduce life timef membrane and increasing cleaning frequency. Our work alsoeveals that membrane chemical cleaning methods are widelymplemented in order to regenerate the membrane performance,ven though some cleaning methods have potential limitations.he success of chemical cleaning methods depends on many
actors such as nature of the foulant type of cleaning agents,emperature, pH, concentration of the cleaning chemicals, con-act time between the chemical solution and the membrane andperation conditions such as cross-flow velocity and pressure.hese factors affect the outcome of the cleaning procedure and
herefore need thorough investigation in order to establish theptimum cleaning system. Conventional assessment of cleaningy flux measurement has been used in the last decades in order toptimize and evaluate the cleaning procedures. At present therere several modern surface analysis techniques that can assistrecisely and rapidly in optimizing the cleaning processes.
Fouling is a complex processes largely governed by empiri-al rules due to poor understanding of processes involved. Theain drawback is the poor prediction of fouling rate in the mem-
rane system as a result of limited understanding of the organicouling and the lack of knowledge concerning the NF moduleperating conditions at which the crystallization or the scale pre-ipitation associated with inorganic fouling occur. The use of
odern surface analysis is required to improve our understand-
ng on mechanisms of fouling or to closely understand how theseoulant materials get deposited on membrane surfaces. Never-heless, it is fundamental to obtain the molecular basis of these
l of Membrane Science 303 (2007) 4–28 25
ptisb[bucoaii
tffpdmiHmi
dwiib[ordp
rcicatc
idptocapscsst
F
as
opaofomfmmscdf
acbrdfeapcssPgna
R
A. Al-Amoudi, R.W. Lovitt / Journa
rocesses. More to the point, the use of AFM and other modernechnique can assist in reaching the target of understanding foul-ng phenomena. The direct force measurement between micro-copic surfaces as function of distance in controlled environmentecame possible with development of the surface force apparatus137]. The fabrication of AFM colloidal probe will undoubtedlye used as one of the powerful technique for providing a deepernderstanding of membrane–fouling interaction process. It alsoan be used to directly measure the interaction between surfacesf different materials in various aqueous solutions and that canssist particularly in understanding and addressing the complex-ty of the fouling materials attachment, removal and movementn and around the membrane surfaces [122].
In general, chemical cleaning is conducted mainly to removehe fraction of NOM foulant or to remove the scale formationrom NF membrane surfaces or to clean the NF membrane sur-aces from both of them in order to regenerate the membraneerformance. There are two types of force that can be applieduring cleaning, the adhesive force that keep the foulant on theembrane surface and a hydrodynamic shearing force required
n removing the foulant from the membrane surface to the bulk.owever, in reality the dynamic process associated with move-ent of foulant material in and around the membrane surfaces
s critical during the cleaning processes.It is difficult to obtain clear strategies in both membrane
esign and avoidance of fouling. Nevertheless, there are severalays to avoid the fouling of membranes and can be classified
nto three groups: (i), changing operating conditions, (ii), mod-fication of the membrane and (iii), modification of the feedy adding antifoulants prior to filtration system (pretreatment)66]. Until now these avoidance strategies do not stop the foulingn surface of the membrane, however, they reduce the foulingate on membrane surfaces and so reducing the frequency anduration of cleaning, both have substantial effect on membraneroductivity and longevity.
There are several chemical cleaning agents used directly toemove foulant material and an understanding of the roles inhemical has been developed. The broad mechanism of clean-ng agents have been inferred from the coupling effect of thesehemical reaction between the cleaning agents and the foulantnd the mass transfer of the loosened foulant to the bulk andhis has lead to improve formulation. Indeed formulations ofleaning agents have been developed for specific foulants.
The adsorption–desorption phenomena are very importantn cleaning processes. The surface charge will not only beependent on the coverage of foulants but also on adsorptionhenomena associated the use of cleaning agents. The adsorp-ion phenomena of the cleaning agents are varying and dependn interaction between the membrane and the cleaning agentoncentration. The precise chemistry and morphology of thective membrane layer also significantly affect the adsorptionhenomena. The active layer of the membrane may consist ofeveral sub-layers to give a complex composite structure that
an significantly alter rejection and adsorption properties of theurface. Indeed, the cleaning agent may change the membraneurface functionally by allowing chemical changer or by adsorp-ion onto the membrane surface so cause permanent modification
ig. 16. Venn diagram of factors influencing operational membrane processes.
nd changed membrane surface properties as well as membraneurface functionality [95].
Generally, modern surface analysis techniques can assist notnly in selecting the membrane materials with correct surfaceroperties during the membrane casting and grafting process, theim being to avoid and/or reduce the foulant materials adhesionn the membrane surface. A better understanding membraneunctionality in relation to adsorption–desorption phenomenan the membrane surface will also be obtained. Modern instru-entation will lead to a systematic more predictable view of the
ouling and cleaning processes. This understanding is funda-ental to providing novel method and materials for membraneanufacture, feed water conditioning and optimal operational
ystems. Manipulating membrane surface characteristics withhemical and physical aspect of feed water and operation con-itions can directly lead to optimized systems with minimizedouling and (Fig. 16) effective cleaning systems.
Extensive research work is certainly needed to investigatend explore new ideas and techniques in the field of membraneleaning and restoration. It is in the interest of the NF mem-rane industry that the importance of membrane cleaning beecognized and be addressed with more time and effort beingevoted to understand fouling mechanisms and develop moreeasible cost-effective, cleaning and restoration procedures forach type of fouling. Apart from this, new membranes whichvoid fouling have to be developed in order to reduce cleaningrocesses and their costs. Fundamental parameters that affect theondition of feed water treatment and operation of the membraneystem are very important and have to be given more time sub-equently to prevent or reduce fouling and cleaning processes.hysical and physio-chemical cleaning methods have not beeniven much needed emphasis in order to evaluate the effective-ess of these methods. These methods could be economicallyttractive but need more investigation.
eferences
[1] A. Al-Rewiali, et al., Performance Evaluation of SWCC SWRO Plants,
Research centre and development, Jubail, 2000, pp. 1–30.
[2] T.G. Temperely, The Coming of Age of Desalination. in Proceeding of theIDA World Congress on Desalination and Water Sciences. 1995. UnitedArab Emirates, Abu Dhabi: Abu Dhabi Publishing Co.
2 l of M
6 A. Al-Amoudi, R.W. Lovitt / Journa
[3] T.A. Dabbagh, The Role of Desalination in Sustaining Economic Growthin the Gulf”, Proceeding of the IDA World Congress on Desalination andWater Sciences,. 1995. United Arab Emirates, Abu Dhabi: Abu DhabiPublishing Co.
[5] Manual, M.T., Manufacturers Technical Manual.[6] M. Barger, R.P. Carnahan, Fouling prediction in reverse osmosis pro-
cesses, Desalination 83 (1–3) (1991) 3–33.[7] D.E. Potts, R.C. Ahlert, S.S. Wang, A critical review of fouling of reverse
osmosis membranes, Desalination 36 (3) (1981) 235–264.[8] P. Dydo, et al., The nucleation kinetic aspects of gypsum nanofiltration
membrane scaling, Desalination 164 (1) (2004) 41–52.[9] W.R. Bowen, A.W. Mohammad, N. Hilal, Characterisation of nanofiltra-
tion membranes for predictive purposes—use of salts, uncharged solutesand atomic force microscopy, J. Membr. Sci. 126 (1) (1997) 91–105.
[10] A.I. Schafer, A.G. Fane, T.D. Waite, Nanofiltration—Principle and Appli-cations, Elsevier Advanced Technology, 2005, pp. 1–543.
[11] R.W. Field, et al., Critical flux concept for microfiltration fouling, J.Membr. Sci. 100 (1955) 259–272.
[12] P. Bacchin, P. Aimar, R.W. Field, Critical and sustainable fluxes: theory,experiments and applications, J. Membr. Sci. 281 (2006) 42–69.
[13] E. Van Houtte, et al., Treating different types of raw water with micro- andultrafiltration for further desalination using reverse osmosis, Desalination117 (1–3) (1998) 49–60.
[14] G. Tchobanoglous, et al., Ultrafiltration as an advanced tertiary treat-ment process for municipal wastewater, Desalination 119 (1–3) (1998)315–321.
[15] J.J. Porter, Recovery of polyvinyl alcohol and hot water from the textilewastewater using thermally stable membranes, J. Membr. Sci. 151 (1)(1998) 45–53.
[16] K. Hagen, Removal of particles, bacteria and parasites with ultrafiltrationfor drinking water treatment, Desalination 119 (1–3) (1998) 85–91.
[17] L. Vera, et al., Cross-flow microfiltration of biologically treated wastew-ater, Desalination 114 (1) (1997) 65–75.
[18] S. Hong, M. Elimelech, Chemical and physical aspects of natural organicmatter (NOM) fouling of nanofiltration membranes, J. Membr. Sci. 132(1997) 159–181.
[19] T.L. Champlin, Using circulation tests to model natural organic matteradsorption and particle deposition by spiral-wound nanofiltration mem-brane elements, Desalination 131 (1–3) (2000) 105–115.
[20] T.V. Knyazkova, A.A. Maynarovich, Recognition of membrane fouling:testing of theoretical approaches with data on NF of salt solutions con-taining a low molecular weight surfactant as a foulant, Desalination 126(1–3) (1999) 163–169.
[21] H. Zhu, M. Nystrom, Cleaning results characterized by flux, streamingpotential and FTIR measurements, Colloids Surf. A: Physicochem. Eng.Aspects 138 (2/3) (1998) 309–321.
[22] H. Vrouwenvelder, et al., Biofouling of membranes for drinking waterproduction, Desalination 118 (1998) 157–166.
[23] J. Vrouwenvelder, et al., Tools for fouling diagnosis of NF and RO mem-branes and assessment of the fouling potential of feed water, Desalination157 (2003) 361–365.
[24] A.S. Al-Amoudi, A.M. Farooque, Performance, restoration and autopsyof NF membranes used in seawater pretreatment, Desalination 178 (2005)261–271.
[25] B. Van der Bruggen, L. Braeken, C. Vandecasteele, Flux decline innanofiltration due to adsorption of organic compounds, Sep. Purif. Tech-nol. 29 (1) (2002) 23–31.
[26] M.R. Wiesner, et al., Committee Report: membrane processes in potablewater, J. AWWA (1992) 59–64.
[27] D. Hasson, A. Drak, R. Semiat, Inception of CaSO4 scaling on RO mem-branes at various water recovery levels, Desalination 139 (1–3) (2001)
73–81.
[28] K.A. Faller, Reverse osmosis and nanofiltration. in AWWA. 1999. Denver.[29] A.G. Pervov, Scale formation prognosis and cleaning procedure sched-
ules in reverse osmosis systems operation, Desalination 83 (1–3) (1991)77–118.
embrane Science 303 (2007) 4–28
[30] S. Lee, J. Kim, C.-H. Lee, Analysis of CaSO4 scale formation mechanismin various nanofiltration modules, J. Membr. Sci. 163 (1) (1999) 63–74.
[31] J. Gilron, D. Hasson, Calcium sulphate fouling of reverse osmosismembranes: flux decline mechanism, Chem. Eng. Sci. 42 (10) (1987)2351–2360.
[32] M. Alborzfar, G. Jonsson, C. GrOn, Removal of natural organic matterfrom two types of humic ground waters by nanofiltration, Water Res. 32(10) (1998) 2983–2994.
[33] S. Lee, C.-H. Lee, Effect of operating conditions on CaSO4 scale forma-tion mechanism in nanofiltration for water softening, Water Res. 34 (15)(2000) 3854–3866.
[34] Z. Amjad, J. Hooley, Influence of polyelectrolytes on the crystal growthof calcium sulfate dihydrate, J. Colloid Interface Sci. 111 (2) (1986)496–503.
[35] D.G. Troup, J.A. Richardson, Scale nucleation on a heat transfer surfaceand its prevention, Chem. Eng. Commun. 2 (1978) 167–180.
[36] P.G. Klepetsanis, P.G. Koutsoukos, Precipitation of calcium sulfate dihy-drate at constant calcium activity, J. Cryst. Growth 98 (3) (1989) 480–486.
[37] X.-L. Wang, C. Zhang, P. Ouyang, The possibility of separating saccha-rides from a NaCl solution by using nanofiltration in diafiltration mode,J. Membr. Sci. 204 (1/2) (2002) 271–281.
[38] D.R. Kasper, Pre-and posttreatment processes for membrane water treat-ment system membrane technology conference proceeding, Baltimor,1993.
[39] T.H. Chong, S. Yuen, R. Sheikholeslami, Composite Fouling in SeawaterDesalination Precipitation of Calcium Sulfate and Calcium Carbonate,School of chemical engineering and industrial chemistry, Sydney, 2004,pp. 1–10.
[40] R. Sheikholeslami, Mixed salts—scaling limits and propensity, Desali-nation 154 (2) (2003) 117–127.
[41] P. Dydo, M. Turek, J. Ciba, Scaling analysis of nanofiltration systems fedwith saturated calcium sulfate solutions in the presence of carbonate ions,Desalination 159 (3) (2003) 245–251.
[42] T.H. Chong, R. Sheikholeslami, Thermodynamics and kinetics for mixedcalcium carbonate and calcium sulfate precipitation, Chem. Eng. Sci. 56(18) (2001) 5391–5400.
[43] S.K. Hamdona, R.B. Nessim, S.M. Hamza, Spontaneous precipitation ofcalcium sulphate dihydrate in the presence of some metal ions, Desalina-tion 94 (1) (1993) 69–80.
[44] D.L. Kronmiller, What every reverse osmosis water system managershould know, Desalination 98 (1–3) (1994) 401–411.
[45] A. Al-Amoudi, R.W. Lovitt, Natural organic matter (NOM) and scalingfouling in NF membranes and its factors: a review, Desalination, in press.
[46] P. Fu, H. Ruize, Pilot plant study on ground water natural organicremovved by low pressure, Desalination 102 (1995) 47–56.
[47] A.R. Roudman, F.A. DiGiano, Surface energy of experimental and com-mercial nanofiltration membranes: effects of wetting and natural organicmatter fouling, J. Membr. Sci. 175 (1) (2000) 61–73.
[48] M. Manttari, et al., Fouling effects of polysaccharides and humic acid innanofiltration, J. Membr. Sci. 165 (1) (2000) 1–17.
[49] B. Van der Bruggen, et al., Influence of molecular size, polarity and chargeon the retention of organic molecules by nanofiltration, J. Membr. Sci.156 (1) (1999) 29–41.
[50] A.I. Schafer, A.G. Fane, T. Waite, Nanofiltration of natural organic matter:Removal, fouling and the influence of multivalent ions, Desalination 118(1998) 109–122.
[51] M. Elimelech, et al., Role of membrane surface morphology in colloidalfouling of cellulose acetate and composite aromatic polyamide reverseosmosis membranes, J. Membr. Sci. 127 (1997) 101–109.
[52] C.R. Bouchard, et al., Study of humic acid adsorption on nanofiltrationmembranes by contact angle measurements, Can. J. Chem. Eng. 75 (2)(1997) 339–345.
[53] K. Ghosh, M. Schnitzer, Macromolecular structures of humic substances,Soil Sci. 129 (5) (1980) 266–276.
[54] A.I. Schafer, et al., Natural organic matter removal by nanofiltration:effects of solution chemistry on retention of low molar mass acids versusbulk organic matter, J. Membr. Sci. 242 (1/2) (2004) 73–85.
l of M
A. Al-Amoudi, R.W. Lovitt / Journa
[55] A.E. Childress, S.S. Deshmukh, Effect of humic substances and anionicsurfactants on the surface charge and performance of reverse osmosismembranes, Desalination 118 (1–3) (1998) 167–174.
[56] A.E. Childress, M. Elimelech, Effect of solution chemistry on the surfacecharge of polymeric reverse osmosis and nanofiltration membranes, J.Membr. Sci. 119 (2) (1996) 253–268.
[57] M. Elimelech, W.H. Chen, J.J. Waypa, Measuring the zeta (electrokinetic)potential of reverse osmosis membranes by a streaming potential analyzer,Desalination 95 (3) (1994) 269–286.
[58] E. Suess, Interaction of organic compounds with calcium-carbonate. 2.Organo-carbonate association in recent sediments, Geochimica Et Cos-mochimica Acta 37 (11) (1973) 2435–2447.
[59] W. Yuan, A.L. Zydney, Humic acid fouling during microfiltration, J.Membr. Sci. 157 (1) (1999) 1–12.
[60] W. Agui, et al., Removal of dissolved humic substances from water witha reverse-osmosis membrane, Sci. Total Environ. 118 (1992) 543–550.
[61] C. Bellona, et al., Factors affecting the rejection of organic solutes duringNF/RO treatment—a literature review, Water Res. 38 (2004) 2795–2809.
[62] B. Van der Bruggen, et al., The use of nanofiltration for the removal ofpesticides from ground water: an evaluation, Water Sci. Technol. 1 (2001)99–106.
[63] M.R. Wiesner, S. Chellam, The promise of membrane technologies, Env-iron. Sci. Technol. 33 (17) (1999) 360A.
[64] L.F. Song, M. Elimelech, Particle deposition onto a permeable surface inlaminar-flow, J. Colloid Interface Sci. 173 (1) (1995) 165–180.
[65] AWWA membrane technology research committee, C.r., Membrane pro-cesses in potable water treatment. J. AWWA, 1992. 84 (1): p. 59–67.
[66] I.l. Roux, et al., Use of chitosan as an antifouling agent in a membranebioreactor, J. Membr. Sci. 248 (1/2) (2005) 127–136.
[67] P.H. Given, Humic Substances in Soil, Sediment and Water,Wiley–Interscience, New York, 1985, p. 692.
[68] J.A. Nilson, F.A. DiGiano, Influence of NOM composition on nanofiltra-tion, J. Am. Water Works Assoc. 88 (5) (1996) 53–66.
[69] C. Jucker, M.M. Clark, Adsorption of aquatic humic substances onhydrophobic ultrafiltration membranes, J. Membr. Sci. 97 (1994) 37–52.
[70] L. Braeken, et al., Influence of hydrophobicity on retention in nanofiltra-tion of aqueous solutions containing organic compounds, J. Membr. Sci.252 (1–2) (2005) 195–203.
[71] M.S. Caceci, A. Billon, Evidence for large organic scatterers (50–200 nmdiameter) in humic-acid samples, Organic Geochem. 15 (3) (1990)335.
[72] W. Richard Bowen, et al., Atomic force microscope studies of membranes:force measurement and imaging in electrolyte solutions, J. Membr. Sci.126 (1) (1997) 77–89.
[73] T. Thorsen, Concentration polarisation by natural organic matter (NOM)in NF and UF, J. Membr. Sci. 233 (1/2) (2004) 79–91.
[75] H.C. Flemming, et al., Biofouling—the Achilles heel of membrane pro-cesses, Desalination 113 (2/3) (1997) 215–225.
[76] H.F. Ridgway, H.C. Flemming, Membrane Biofouling in Water TreatmentMembrane Processes, McGraw Hill, New York, 1996.
[77] N. Hilal, et al., A comprehensive review of nanofiltration membranes:treatment, pretreatment, modelling, and atomic force microscopy, Desali-nation 170 (3) (2004) 281–308.
[78] A. Farooque, A. al-Amoudi, A.M. Hassan, Chemical cleaning experi-ments for performance restoration of NF membranes operated on seawaterfeed, in: IDA Conference, Bahrain, 2002.
[79] C. Shankararaman, et al., Effect of pretreatment on surface water nanofil-tration, J. AWWA 10 (1997) 77–89.
[80] S. Bertrand, I. Lemaitre, E. Wittman, Performance of a nanofiltrationplant on hard and highly sulphated water during two years of operation,Desalination 113 (1997) 277–281.
[81] M.H. Tran-Ha, D.E. Wiley, The relationship between membrane cleaningefficiency and water quality, J. Membr. Sci. 145 (1998) 99–110.
[83] H. Huiting, J. Kappelhof, T. Bosklopper, Operartion of NF/RO plantsfrom reactive to proactive, Desalination 139 (2001) 183–189.
[84] A. Maartens, P. Swart, E.P. Jacobs, Feed-water pretreatment: methods toreduce membrane fouling by natural organic matter, J. Membr. Sci. 163(1) (1999) 51–62.
[85] A.H. Hassan, et al., Optimization of SWRO pre-treatment—Part I-SDImeasurement. in IDA World congress, 1995, Abu Dhabi.
[86] M. Bartlett, M.R. Birdl, J.A. howell, An experimental study for the devel-opment of qualitative membrane cleaning model, J. Membr. Sci. 105(1995) 147–157.
[87] V. Mavrov, et al., Desalination of surface water to industrial water withlower impact on the environment. Part 2. Improved feed water pretreat-ment, Desalination 110 (1/2) (1997) 65–73.
[88] A.M. Hassan, et al., A new approach to membrane and thermal sea-water desalination processes using nanofiltration membranes (Part 1),Desalination 118 (1–3) (1998) 35–51.
[89] B. Van der Bruggen, et al., Direct nanofiltration of surface water usingcapillary membranes: comparison with flat sheet membranes, Sep. Purif.Technol. 31 (2) (2003) 193–201.
[90] D. Chen, L.K. Weavers, H.W. Walker, Ultrasonic control of ceramic mem-brane fouling: effect of particle characteristics, Water Res. 40 (4) (2006)840–850.
[91] N.R.G. Walton, Reverse osmosis pretreatment-injecting a little chemicalcontrol and management, Desalination 82 (1991) 281–300.
[93] S. Ebrahim, Cleaning and regeneration of membranes in desalination andwaste water applications, Desalination 96 (1994) 225–238.
[94] R.A. Bergman, Membrane softening versus lime softening in Florida: acost comparison update, Desalination 102 (1–3) (1995) 11–24.
[95] A. Al-Amoudi, et al., Cleaning results of new and fouled nanofiltrationmembrane characterized by zeta potential and permeability, Sep. Purif.Technol. 54 (2) (2007) 234–240.
[96] A. Wies, M.R. Bird, M. Nystrom, The chemical cleaning of polymericUF membranes fouled with spent sulphite liquor over multiple operationalcycles, J. Membr. Sci. 216 (2003) 67–79.
[97] K. KoSutic, B. Kunst, RO and NF membrane fouling and cleaning andpore size distribution variations, Desalination 150 (2002) 113–120.
[98] M. Nystrom, H. Zhu, Characterization of cleaning results using combinedflux and streaming potential methods, J. Membr. Sci. 131 (1/2) (1997)195–205.
[101] R. Osterberg, L. Szajdak, K. Mortensen, Temperature-dependent restruc-turing of fractal humic acids—a proton-dependent process, Environ. Int.20 (1) (1994) 77–80.
[102] I. Mooch, A 21st Century study of global seawater reverse osmosis oper-ating and capital costs, in: IDA Conference, Singapore, 2003.
[103] A.M. Hassan, et al., Performance Evaluation of SWCC-SWRO Plants,Research Center, Jubail, 2003, pp. 1–59.
[104] H. Lee, et al., Cleaning strategies for flux recovery of an ultrafiltra-tion membrane fouled by natural organic matter, Pergamon 35 (2001)3301–3308.
[105] G. Morel, et al., Surfactant modified ultrafiltration of nitrate ions removal,J. Membr. Sci. 134 (1997) 47–57.
[106] Du-Pont Manual Hand Book.[107] H. Seungkwan, M. Elimelech, Chemical and physical aspects of natural
organic matter (NOM) fouling of nanofiltration membranes, J. Membr.Sci. 132 (1997) 159–181.
[108] J. Cho, et al., Characterization of clean and natural organic matter (NOM)
fouled NF and UF membranes and foulants characterization, Desalination188 (1998) 101–108.
[109] R. Liikanan, J. Yli-Kuivila, R. Laukkanen, Efficiency of various chemicalcleanings for nanofiltration membrane fouled by conventionally-treatedsurface water, J. Membr. Sci. 195 (1995) 265–276.
2 l of M
8 A. Al-Amoudi, R.W. Lovitt / Journa
[110] L. Xiufen, et al., Chemical cleaning of PS ultrafilters fouled by the fer-mentation broth of glutamic acid, Sep. Purif. Technol. 42 (2005) 181–187.
[111] J. Warczok, et al., Concentaion of apple and paer juices by nanofiltrationat low pressures, J. Food Eng. 63 (2004) 63–70.
[112] A.M. Jacques, et al., Integrated multi-objective membrane systems forsurface water treatment: pre-treatment of nanofiltration by riverbank fil-tration and conventional ground water treatment, Desalination 118 (1998)239–248.
[113] W. Song, et al., Nanofiltration of natural organic matter with H2O2/UVpretreatment: fouling mitigation and membrane surface characterization,J. Membr. Sci. 241 (1) (2004) 143–160.
[114] G.S. Murthy, et al., Concentration of xylose reaction liquor by nanofiltra-tion for the production of xylitol sugar alcohol, Sep. Purif. Technol. 44(2005) 205–211.
[115] H.A. Fremont, et al., Membrane cleaning process and U.S.P., 1988.[116] Q. Li, M. Elimelech, Organic fouling chemical cleaning of nanofiltration
membranes: measurements and mechanisms, Environ. Sci. Technol. 38(17) (2004) 4683–4693.
[117] A.E. Childress, M. Elimelech, Relating nanofiltration membrane perfor-mance to membrane charge (electrokinetic) characteristics, Environ. Sci.Technol. 34 (17) (2000) 3710–3716.
[118] R. Liikanen, J. Yli-Kuivila, R. Laukkanen, Efficiency of various chemicalcleanings for nanofiltration membrane fouled by conventionally-treatedsurface water, J. Membr. Sci. 195 (2) (2002) 265–276.
[119] G. Daufin, et al., Efficiency of cleaning agents for an inorganic membraneafter milk ultrafiltration, J. Dairy Res. 59 (1) (1992) 29–38.
[120] M.A. Arguello, et al., Enzymatic cleaning of inorganic ultrafiltrationmembranes used for whey protein fractionation, J. Membr. Sci. 216 (1/2)(2003) 121–134.
[121] K.-J. Kim, A.G. Fane, Performance evaluation of surface hydrophilizednovel ultrafiltration membranes using aqueous proteins, J. Membr. Sci.99 (2) (1995) 149–162.
[122] W.R. Bowen, A. Teodora, G. Austin, The use of atomic force microscopyto quantify membrane surface electrical properties, Colloids Surf. 201
(2002) 73–83.
[123] N. Hilal, W.R. Bowen, Atomic force microscope study of the rejection ofcolloids by membrane pores, Desalination 150 (3) (2002) 289–295.
[124] W.R. Bowen, T.A. Doneva, Atomic Force Microscopy of Membrane,Madison Avenue, New York, 2002.
embrane Science 303 (2007) 4–28
[125] E.M. Vrijenhoek, S. Hong, M. Elimelech, Influence of membrane sur-face properties on initial rate of colloidal fouling of reverse osmosisand nanofiltration membranes, J. Membr. Sci. 188 (1) (2001) 115–128.
[126] I. Larson, et al., Direct force measurements between TiO2 Surfaces, J.Am. Chem. Soc. 115 (1993) 11885–11890.
[127] W.R. Bowen, et al., Atomic force microscope studies of membranes, in:T.S. Sorensen (Ed.), Surface Chemistry and Electochemistry of Mem-brane Surfaces, Surfactant Science Series, vol. Chapter 1, Marcel DekkerInc., 1999, pp. 1–37.
[128] W. Richard Bowen, T.A. Doneva, Atomic force microscopy studies ofnanofiltration membranes: surface morphology, pore size distribution andadhesion, Desalination 129 (2) (2000) 163–172.
[129] K. Kontturi, M. Vouristo, Adsorption of globular proteins on polymericmicrofiltration membranes, Desalination 104 (1996) 99–105.
[130] M.D. Afonso, G. Hagmeyer, R. Gimbel, Streaming potential measure-ments to assess the variation of nanofiltration membranes surface chargewith the concentration of salt solutions, Sep. Purif. Technol. 22/23 (2001)529–541.
[131] T. Mohammadi, S.S. Madaeni, M.K. Moghadam, Investigation of mem-brane fouling, Desalination 153–160 (2003) 155.
[132] W.S. Ang, S. Lee, M. Elimelech, Chemical hysical aspects of cleaningof organic-fouled reverse osmosis membranes, J. Membr. Sci. 272 (1/2)(2006) 198–210.
[133] J.P. Chen, S.L. Kim, Y.P. Ting, Optimization of membrane physical andchemical cleaning by a statistically designed approach, J. Membr. Sci.219 (1–2) (2003) 27–45.
[134] S.K. Sayed Razavi, J.L. Harries, F. Sherkate, Fouling and cleaning ofmembranes in the ultrafiltration of the aqueous extract of soy flour, J.Membr. Sci. 114 (1) (1996) 93–104.
[135] M.J. Munoz-Aguado, D.E. Wiley, A.G. Fane, Enzymatic and detergentcleaning of a polysulfone ultra-filtration membrane fouled with BSA andWhey, J. Membr. Sci. 117 (1996) 175–187.
[136] M. Chpman, Bench-scale testing of surfactant modified reverse osmo-
sis/nanofiltration membranes, J. Pellegrino A Zydney 115 (1998) 15–32.
[137] J.N. Israelachvili, R.K. Tandon, L.R. White, Measurement of forcesbetween two mica surfaces in aqueous polyethylene oxide solution, J.Colloid Interface Sci. 78 (2) (1980) 430–443.