Journal of Chromatography A, 975 (2002) 245–266 www.elsevier.com / locate / chroma Review Capillary electrophoresis–inductively coupled plasma-mass spectrometry: an attractive complementary technique for elemental speciation analysis 1 1 Sasi S. Kannamkumarath, Katarzyna Wrobel , Kazimierz Wrobel , Clayton B’Hymer, * Joseph A. Caruso Department of Chemistry, Mail location 0172, University of Cincinnati, Cincinnati, OH 45221-0172, USA Received 3 May 2002; received in revised form 9 August 2002; accepted 12 August 2002 Abstract Some basic and practical aspects of interfacing capillary electrophoresis to inductively coupled plasma-mass spectrometry (CE–ICP-MS) are reviewed in this article with emphasis on the use of this hyphenated technique for elemental speciation analysis. The principles behind the techniques of both CE and ICP-MS are introduced. The interfacing of CE to ICP-MS is discussed including several devices and nebulizers reported in literature. A brief account of their advantages and limitations is given. The various CE–ICP-MS applications for elemental speciation analysis are also reviewed. Some issues concerning the future of CE–ICP-MS for the elemental speciation analyses are discussed. 2002 Elsevier Science B.V. All rights reserved. Keywords: Reviews; Elemental speciation analysis; Capillary electrophoresis; Nebulizers; Interfaces; Inductively coupled plasma mass spectrometry Contents 1. Introduction ............................................................................................................................................................................ 246 2. Capillary electrophoresis .......................................................................................................................................................... 247 3. Inductively coupled plasma-mass spectrometry.......................................................................................................................... 248 4. Interfacing capillary electrophoresis to inductively coupled plasma-mass spectrometry ................................................................. 249 4.1. Practical considerations of interfacing............................................................................................................................... 249 4.2. Nebulizers ...................................................................................................................................................................... 252 4.3. Interfaces ....................................................................................................................................................................... 254 5. Applications in elemental speciation analysis ............................................................................................................................ 255 5.1. Arsenic and selenium ...................................................................................................................................................... 255 *Corresponding author. Tel.: 11-513-556-5858; fax: 11-513-556-0142. E-mail address: [email protected](J.A. Caruso). 1 At the University of Cincinnati while on the leave from Instituto de Investigaciones Cientificas, Universidad de Guanajuato, L. de Retana o N 5, 36000 Guanajuato, Mexico. 0021-9673 / 02 / $ – see front matter 2002 Elsevier Science B.V. All rights reserved. PII: S0021-9673(02)01218-9
Transcript
Journal of Chromatography A, 975 (2002) 245–266www.elsevier.com/ locate/chroma
Review
C apillary electrophoresis–inductively coupled plasma-massspectrometry: an attractive complementary technique for elemental
speciation analysis1 1Sasi S. Kannamkumarath, Katarzyna Wrobel , Kazimierz Wrobel , Clayton B’Hymer,
*Joseph A. CarusoDepartment of Chemistry, Mail location 0172,University of Cincinnati, Cincinnati, OH 45221-0172,USA
Received 3 May 2002; received in revised form 9 August 2002; accepted 12 August 2002
Abstract
Some basic and practical aspects of interfacing capillary electrophoresis to inductively coupled plasma-mass spectrometry(CE–ICP-MS) are reviewed in this article with emphasis on the use of this hyphenated technique for elemental speciationanalysis. The principles behind the techniques of both CE and ICP-MS are introduced. The interfacing of CE to ICP-MS isdiscussed including several devices and nebulizers reported in literature. A brief account of their advantages and limitationsis given. The various CE–ICP-MS applications for elemental speciation analysis are also reviewed. Some issues concerningthe future of CE–ICP-MS for the elemental speciation analyses are discussed. 2002 Elsevier Science B.V. All rights reserved.
5 . Applications in elemental speciation analysis ............................................................................................................................ 2555 .1. Arsenic and selenium ...................................................................................................................................................... 255
*Corresponding author. Tel.:11-513-556-5858; fax:11-513-556-0142.E-mail address: [email protected](J.A. Caruso).1At the University of Cincinnati while on the leave from Instituto de Investigaciones Cientificas, Universidad de Guanajuato, L. de Retana
oN 5, 36000 Guanajuato, Mexico.
0021-9673/02/$ – see front matter 2002 Elsevier Science B.V. All rights reserved.PI I : S0021-9673( 02 )01218-9
246 S.S. Kannamkumarath et al. / J. Chromatogr. A 975 (2002) 245–266
5 .2. Miscellaneous elements ................................................................................................................................................... 2625 .2.1. Studies of model solutions ................................................................................................................................... 2625 .2.2. Studies of complex samples ................................................................................................................................. 262
6 . Conclusions and future outlook ................................................................................................................................................ 263Acknowledgements...................................................................................................................................................................... 264References .................................................................................................................................................................................. 264
1 . Introduction during the procedure; and finally, (c) the selectivityand detection capability of the analytical technique
Environmental pollutants are a significant hazard for quantification. Since usually more than oneto human health; among them trace elements have elemental species exists in a sample, a separationboth beneficial and harmful effects depending on step is necessary. Separation is most often achievedtheir quantities and chemical species in living organ- by the use of modern chromatographic and electro-isms. In addition to the common elements (sodium, phoretic techniques, because they offer efficientcalcium, magnesium, etc.), a number of trace ele- separation of the analytes.ments (selenium, zinc, molybdenum, manganese, Once separation is accomplished, the concentra-etc.) are considered essential with specific biological tion of trace elemental species in the column effluentfunctions at relatively low levels. However, when or in the fractions collected is often too low forpresent in excess, these elements can be harmful. response sensitivity of common chromatographicThe elements present in biological and environmen- detectors. In the applications of liquid chromatog-tal materials are distributed among various chemical raphy (LC) with UV–Vis or fluorimetric detection,forms which include inorganic salts, organic and this problem can be overcome by pre- or post-bio-metallic or bio-metalloid compounds. Determi- column derivatization of the analytes to form highlynation of total elemental concentration is of limited absorbing or fluorescent analytes. Other sensitive andvalue, as this information cannot be directly related selective detectors, such as ion selective electrodesto the chemical, biological and toxicological activity or electrochemical detectors, are rarely used becauseof a particular element. Oxidation state and/or of their lack of ruggedness and changes in sensitivitychemical form of trace elements determine their over time. The most recent additions for elementaltoxicological effects or nutritional benefits. speciation analysis are element specific detectors,
Analytical elemental speciation has been defined specifically the inductively coupled plasma-massas the separation, identification and quantification of spectrometer (ICP-MS) and the electrospray (ES) orthe different chemical forms or species of a par- the ion spray (IS) mass spectrometer. The use ofticular element in a given sample. Information on atomic mass spectrometry with plasma ion sourceelemental speciation in environmental and clinical assures extremely low detection limits for the majori-material is vital in studies on possible mechanisms of ty of the elements, has the advantage of linearityelement transport and/or degradation in the environ- over a wide dynamic range, multi-elemental de-ment, element bioavailability and on possible meta- tection capability and the ability to perform isotopicbolic pathways within living organisms. The growing analysis [1,2] with minimum matrix effects wheninterest in elemental speciation is reflected in the compared to other detection systems. For the de-number of recent publications in the literature, and it tection, identification and/or confirmation of species,can be easily justified by a strong demand for molecular mass spectrometry techniques have beenanalytical tools adequate for determination of successfully applied. Many studies have been doneelemental speciation in various fields, including coupling high-performance liquid chromatographyenvironmental and life sciences. In the development (HPLC) [3–6], gas chromatography (GC) [7–9],of any analytical procedure for elemental speciation, supercritical fluid chromatography (SFC) [10–12] asit is necessary to consider: (a) the species/ form to be well as capillary electrophoresis (CE) with ICP-MSdetected; (b) the need to preserve the natural com- detection. Recently, a series of review articles onposition and distribution of species in the sample hyphenated ICP-MS techniques has been published
S.S. Kannamkumarath et al. / J. Chromatogr. A 975 (2002) 245–266 247
[13–18]. Among the separation techniques previous- that in many CE applications, the natural elementally mentioned, capillary electrophoresis (CE) offers a speciation in the sample can be altered due to the usenumber of important attributes including: low sam- of complexing electrolytes or pH conditions requiredple-volume requirements, high plate number (peak for efficient separation [26,27]. The possible effect ofefficiency), the ability to separate positive, neutral sample composition (mainly the sample conductiv-and negatively charged species in a single run, and, ity) is the second factor limiting CE capabilities forgenerally, short run times. This combination of the species separation [28].advantages of CE, coupled with the high sensitivity The separation mechanism in CE is based on theof ICP-MS detection, provides a valuable technique charge as well as the size of the analytes, whichfor elemental speciation. This review explains vari- move in electrical field applied across a capillaryous aspects of coupling capillary electrophoretic filled with a suitable electrolyte. The migration ofsystems to the ICP-MS detector. Emphasis in this ions in the capillary is controlled by two phenomena,review has been to give the reader a more practical the electrophoretic mobility and the electroosmoticview and points to focus on when interfacing CE to flow (EOF) [29]. The electrophoretic mobility is duethe MS detector. to the attraction between the ions and the oppositely
charged electrode and is directly related to the chargeto size ratio of the analyte. That is, highly charged
2 . Capillary electrophoresis smaller particles will migrate faster than less chargedbulky particles. The electroosmotic flow arises from
The advantage of conducting electrophoresis in interactions between electrolyte ions and the nega-capillaries was highlighted in the early 1980s by the tively charged capillary wall rich in the ionizablework of Jorgenson and Lukacs [19–22]. Performing silanol groups. To maintain electrical neutrality, anelectrophoretic separations in capillaries allowed the electrical double layer is formed on the surface of thepossibility of automated analytical equipment, fast capillary wall and, under the applied electric field,analysis times and on-line detection of the separated the hydrated cations in the Helmhotz layer movepeaks. Typically, a capillary column has an internal toward the more negative potential end of capillary.diameter of 20–100mm, an external diameter of This produces a bulk solution flow, which depends200–400mm and a length of 20–100 cm. The high on the voltage gradient applied across the capillary,surface-to-volume ratios of capillaries with these type of electrolyte, pH, and the properties of capil-dimensions allow for very efficient dissipation of lary wall (density of silanol groups, coating, etc.).joule heat generated by the applied field (typical The important difference between the two migrationvoltage gradients range from 10 to 30 kV). Over the forces is that the electroosmotic flow affects therecent period, capillary electrophoresis has been migration of each analyte in the same way, so it doesextensively used for the separation and analysis of not cause any separation. However, by controllinginorganic substances [23]. Furthermore, CE has the the EOF and the voltage gradient applied, thefeatures of analyzing different sample types, small combined effects of the two forces can improve thesample sizes, high resolution for cations, anions, resolution of analytes and often makes possible thesmall metal ions, metal–organic ligand complexes, separation of the cationic, anionic and neutral speciesorganometallic molecules and biomacromolecules. in a short time and in a single run. Moreover, the flatAlso, this makes CE particularly attractive for flow profile characteristic of electroosmotic flowelemental speciation [24]. Because the CE separation gives better resolution of peaks and higher plateis based on the mobility of analytes in an electric number (peak efficiency) unlike HPLC, which isfield, rather than a chemical interaction and partition- affected by the parabolic flow profile characteristicing between a stationary phase and a mobile phase, of laminar flow.the advantage of this technique is that the natural Although the high plate number and separationdistribution of the elemental species might be dis- versatility makes CE an attractive technique forturbed less severely when compared to the chromato- elemental speciation purposes, the small capillarygraphic methods [25]. It has to be stressed however, diameter seriously limits the possibility for the most
248 S.S. Kannamkumarath et al. / J. Chromatogr. A 975 (2002) 245–266
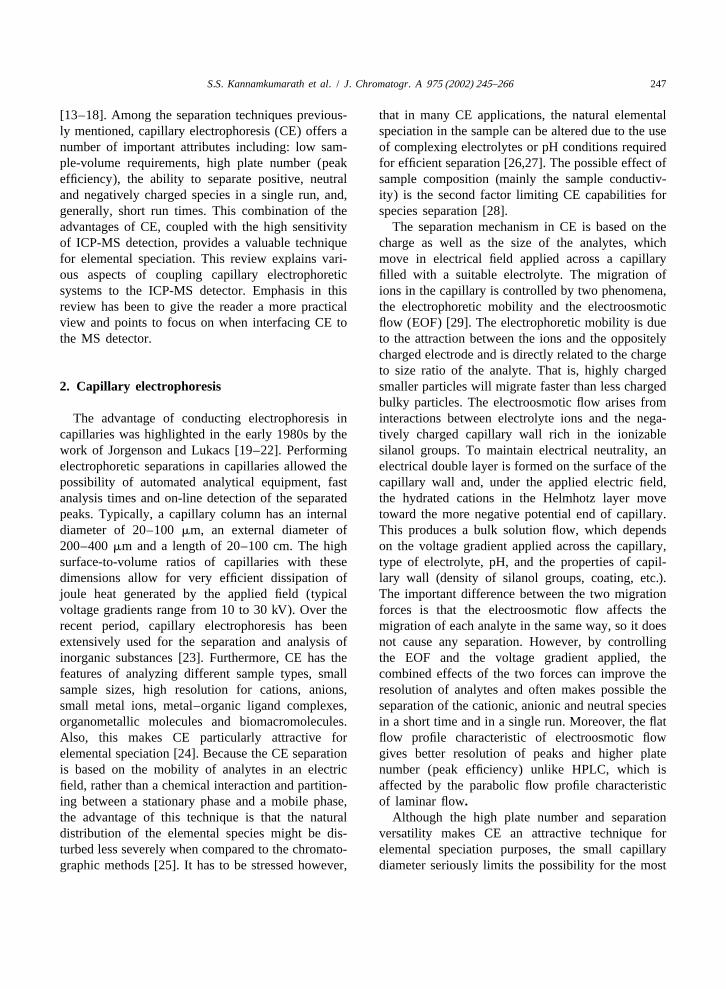
Fig. 1. Schematic of an ICP-MS.
sensitive detection when expressed as concentration. described the technique of coupling CE to ICP-MSOne approach for improving the detection limits is to for rapid elemental speciation and several otherincrease loading of the CE system. This can be research groups have since followed developingachieved by pre-separation clean-up or preconcen- different interface devices. Detection limits havetration procedures, by electrokinetic sample intro- been lowered to the lowmg/ l range. The hyphenatedduction, by applying electrostacking effect or iso- CE-ICP-MS technique, despite being considered intachophoresis [23,25]. The other, complementary an early stage of development, is an interestingapproach is the application of a sensitive and specific alternative for elemental speciation studies in realdetection system [30]. The great majority of the samples at trace and ultra trace levels.commercial instruments are equipped with UV detec-tors. Because most of the metal ions and metallic ormetalloid containing species do not absorb in UV 3 . Inductively coupled plasma-massregion, pre- or on-column derivatization is common- spectrometryly carried out to introduce a suitable chromophore.Another, widely used approach is indirect UV de- In this technique, the high efficiency of atomiza-tection. In this case, a highly absorbing species is tion and ion formation of the inductively coupledadded to the electrolyte and the analytical signal is plasma is complemented by the specific and sensitivemeasured as the absorbance decay due to the elution multi-element detection capability offered by atomicof non-absorbing species (analytes) [31,32]. As mass spectrometry. The scheme of a commercialreviewed recently, the two detection modes were ICP-MS instrument is shown in Fig. 1. The ICP is anused in variety of speciation studies at the con- ion source, which operates at high temperaturescentration levels in the range 0.1–100 mg/ l, but the (5000–10000 K) and at atmospheric pressure. Thelimited applicability in ‘‘real world’’ elemental argon plasma is generated in a quartz torch [37]speciation has been highlighted [33]. The fluores- under the conditions of a radio frequency electro-cence and electrochemical detectors were also ap- magnetic field (27–40 MHz, a power of 600–1800plied in metal speciation by CE, often offering W) [38]. The argon gas stream, which flows throughhigher detector sensitivity when compared to UV, but the inner tube of the torch, is initially seeded withalso presenting some interference problems [30,34]. free electrons from a discharge coil. An eddy currentThe Barnes [35]and Olesik [36] research groups first of cations and electrons is formed as the charged
S.S. Kannamkumarath et al. / J. Chromatogr. A 975 (2002) 245–266 249
particles are forced to flow in a closed annular path. efficiently the capillary effluent to the nebulizer.These fast moving ions and electrons collide with Furthermore, the nebulizer /spray chamber introducesother argon atoms to produce further ionization, dead volume (extra-capillary volume) to the detectorwhich leads to high thermal energy as they meet system which can lead to additional peak broaden-resistance to their flow. The second stream of argon ing.gas, which passes through the outer tubes of thetorch, helps not only in cooling the torch andpreventing it from melting, but also provides a 4 . Interfacing capillary electrophoresis totangential flow of gas, which serves to center and inductively coupled plasma-mass spectrometrystabilize the plasma [39].
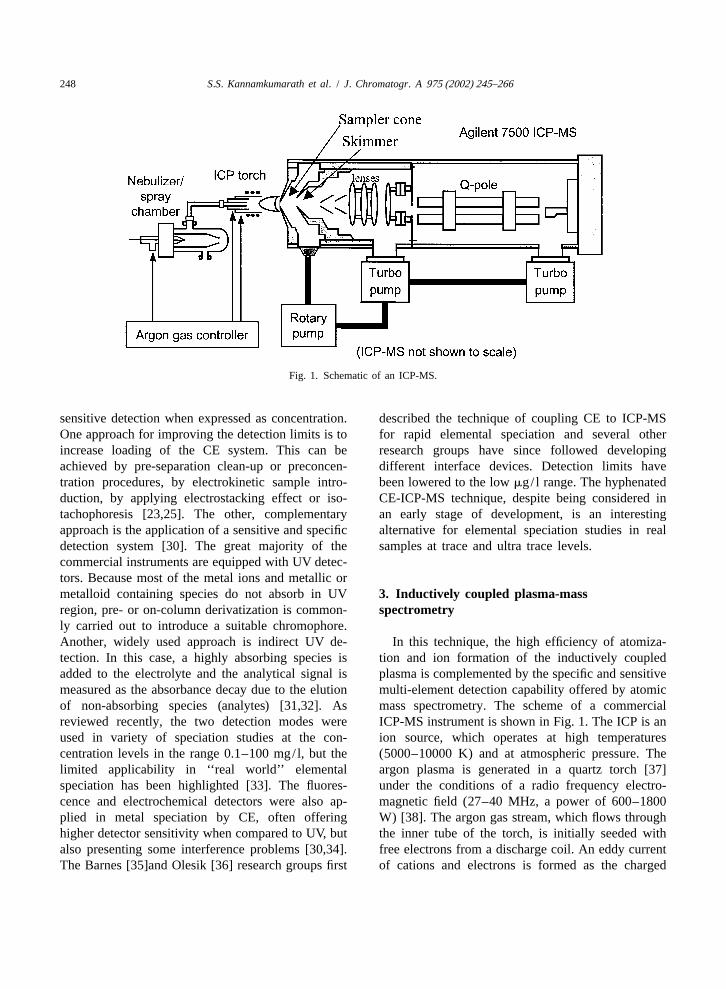
A liquid sample is introduced into the plasma. As previously mentioned, the challenge for theThis liquid sample, which in elemental speciation successful application of the hybrid CE–ICP-MSstudies usually is either an HPLC column or CE technique is the development of a suitable interface.capillary effluent, is introduced as an aerosol through The main factors that need to receive special atten-the center tube of the torch into plasma by means of tion in coupling these techniques are: (1) maintain-a nebulizer connected to a spray chamber. This spray ing effective electrical contact at the outlet end of thechamber separates and removes the larger droplets of CE capillary; (2) countering or minimizing laminarthe aerosol. The ions produced in the plasma enter flow generated from the suction-effect of the oper-the mass detector through the sampler and skimmer ating nebulizer [47]; (3) minimizing band broaden-cones and then they are focused (through a series of ing; and (4) obtaining high transport efficiency. Inlenses) into the mass analyzer, where they are typical instrumental design, the outlet end of theseparated based on their mass to charge ratio and capillary from CE is introduced into the central tubethen are detected [37,40]. With most ICP-MS com- of a nebulizer while maintaining an electrical con-mercial instruments, the response for the majority of nection to the end of the capillary. Many of theelements is linear over 4–11 [41] orders of mag- reported CE–ICP-MS interfaces have a tee union,nitude with excellent precision in count rates near the through which the buffer is introduced to make-upsignal baseline (0.2–3% RSD) [41]. Usually, the the capillary flow-rate (ml /min range) that is too lowchemical interferences in ICP-MS are less pro- for the normal uptake rate of the nebulizer. A typicalnounced than in other techniques such as ICP-AES tee union interface is shown in Fig. 2. The outlet of[41]. Moreover several approaches for overcoming the CE capillary is taken out of the system andthese interferences are found in the literature. These threaded through the collinear ends of the cross andinclude the use of high-resolution mass spectrome- it is tightly sealed with the ferrules. The other armsters [42–44], cryogenic desolvation [45], different of the tee are connected to a tube for the make-up/plasma sources or cooled plasmas (plasma generated sheath solution flow and to a platinum electrode. Anwith low power) and more recently a shield torch. alligator clip is used to connect the platinum elec-Recently, a new approach called collision/ reaction trode at the tee interface to the power supply, thuscell technology has been developed which reduces providing a complete electrical circuit by conductionthe problems associated with polyatomic species through the make-up buffer to the tip of the CEbefore they enter the mass analyzer [46]. capillary [48]. The other important parameter is the
Although the application of ICP-MS as a detection generation of an aerosol with high transport ef-system for CE seems to offer obvious advantages of ficiency so that a large quantity of the sample willlow detection limits and interference-free, element- reach the plasma. Low flow nebulization systems are,specific response, the instrumental design of such a therefore, essential for the CE–ICP-MS interface.technique is not straightforward. Several designissues need to be addressed including the small 4 .1. Practical considerations of interfacingsample volumes introduced by CE (typically in therange of nanoliters) with very low liquid flow-rates The CE–ICP-MS interface based on the sheath(around 1ml /ml) and the problems in transferring flow and concentric nebulizers described by Lu et al.
250 S.S. Kannamkumarath et al. / J. Chromatogr. A 975 (2002) 245–266
Fig. 2. CE interface to ICP-MS.
[35] is the most widely used interface at present for nebulizers either through self-aspiration or a peri-elemental mass spectrometry and has also been used staltic pump, the latter presenting the use of flowpreviously for the electrospray MS [49]. The sheath control. In self-aspiration, the uptake is automatic,flow makes an electrical connection to the outlet end and there will be a variation in the uptake rates basedof CE capillary, grounding being solved by placing a upon run or make-up buffer liquid viscosities. By themetal tube at the connector to the nebulizer (Fig. 2) use of a peristaltic pump to provide the sheath flow,or by coating the capillary with silver [36]. The the optimization of the flow-rate is necessary. A lowsecond function of sheath flow is the compensation flow-rate would not compensate for the suctionfor the suction effect, which is caused by the low effect, while an excessive flow would cause apressure created at the tip of the nebulizer due to the backpressure to the CE capillary and thus affect thegas flow. This suction induces a laminar flow inside separation of analytes. The use of controlled make-the capillary and can impair the separation profile of up/sheath flow-rates to give equivalent CE–MS andanalytes. However, the required sheath flow-rate can CE–UV eletropherograms has been reported by Daybe as high as 50ml /min or more, which in-turn can et al. [50]. Some studies have also shown that thedecrease the sample transport efficiency to the sheath flow should be kept as low as possible toplasma [25]. Sheath flow can be introduced into the minimize dead volume and to reduce band broaden-
S.S. Kannamkumarath et al. / J. Chromatogr. A 975 (2002) 245–266 251
ing as well as to minimize the loss of sensitivity A significant advantage of CE–ICP-MS over[47]. In addition to the sheath flow-rate, the geomet- HPLC–ICP-MS is that the chemical compositionric position of the CE capillary inside the nebulizer is used for the separation step is usually more compat-very important; one case in point being microconce- ible with the inductively coupled plasma. Sometimesntric nebulizers, where the center tube of the nebul- in the applications of HPLC, conditions are compro-izer is more narrow than standard nebulizers. If the mised for plasma/detector compatibility rather thanCE capillary is too far inside the nebulizer, greater optimized for separation. The concentration of saltslaminar flow can be created from suction at the tip of and/or organic modifiers must be kept relatively lowthe nebulizer. If the CE capillary is placed too far to maintain plasma stability and minimize signal driftback from the nebulizer’s tip, the resolution of of the mass spectrometer. However, owing to lowanalytes can be impaired from an increase in the solution loading with the CE effluent, its chemicaleffective liquid dead volume (the extra-capillary composition can minimally affect the nebulizationvolume). The position of the CE capillary within the process, plasma stability or MS signal drift. Thus,nebulizer is, thus, another important parameter for the optimal separation conditions usually can be usedadjustment which can affect band broadening and when coupling CE to ICP-MS unlike HPLC to ICP-control laminar flow within the CE capillary. The MS. The influence of CE experimental parameters onchoice of the make-up buffer also plays an important migration time, band dispersion and resolution wasrole. If the make-up buffer is different from the run recently reviewed by Olesik [25]. With the interfacesbuffer, then a change in the entire separation con- using sheath flow, the make-up solution becomes theditions can occur. Creation of a pH gradient across effective matrix for ICP-MS, which is constant overthe CE capillary or isoelectric focusing from the use time and from sample to sample. The composition ofof a dissimilar make-up buffer may cause undesir- the sheath flow solution should be selected carefullyable results. Another issue, to be considered, is run and with consideration of not disturbing the nebuli-buffer depletion; it is best to replace the buffer zation process or the plasma stability.solution after a few runs, which is normally a good There is a potential loss of sample in CE capil-general practice with CE. laries, by either chemical adsorption on the walls of
The elimination of a make-up or sheath flow has the capillary or the analyte’s capture in the electricalbeen reported by several research groups. Olesik et double layer near the walls of the capillary. This mayal. [36] described a sheathless interface, in which a reduce the sensitivity, as well as increase the back-negative pressure was introduced at the CE capillary ground signal due to continuous elution of theinlet and compensated against laminar flow through trapped ions over time. Proper washing of thethe capillary. The limiting feature of this design was capillary before an injection is necessary and canin the difficulty to keep the nebulizer end wet, thus easily be facilitated when interfaced to an ICP-MSassuring electrical connection to the CE capillary. by hand using a Luer lock syringe adapted to the CEThe important advantage of this system was that it capillary [48]. Also, care must be taken to see thateffectively counter-balanced the suction generated by the heights of both ends of the capillary are equalthe nebulizer’s operation without any apparent loss during the run to prevent siphoning effects in thein sensitivity of the CE system [51]. Recently, Deng capillary which would create induced laminar flow.and Chan [52] reported a modified concentric glass In ICP-MS, the detection is based on the mass ofnebulizer used as an interface of CE to ICP-MS, the analytes rather than on their concentration in thewhere the sheath flow also was eliminated. Finally, solution. Since CE injection volume is in the nanoli-the commercial CEI-100 capillary electrophoresis ter range and capillary flow is usually complementedinterface for ICP-MS from CETAC has to be noted by a sheath flow, high transport efficiency is required[53]. It was constructed to eliminate secondary to reduce the loss of analyte from the aerosollaminar flow within a capillary, to reduce dead introduced into the plasma. High transport efficiencyvolume and to minimize dilution factor. In this is an important characteristic of low liquid flow highinterface, the make-up buffer flow-rate operates efficiency nebulizers that will briefly be discussed inbelow 10ml /min. the next section.
252 S.S. Kannamkumarath et al. / J. Chromatogr. A 975 (2002) 245–266
4 .2. Nebulizers over the surface of a piezoelectric transducer and isconverted to the aerosol by the high frequency
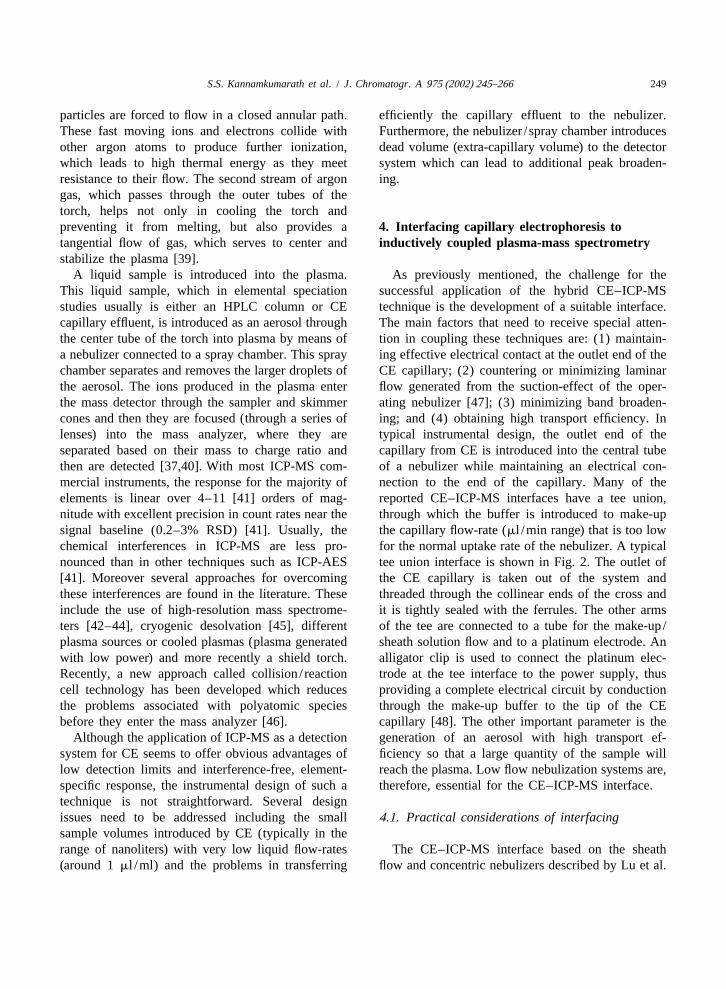
Nebulization is a process to form an aerosol, that vibrations from the transducer. The typical solutionis, to convert a liquid sample into a cloud of droplets. intake rates for a conventional concentric nebulizerA suspension of liquid in air or a gas, an aerosol, can are 1–2 ml /min with 1–2% transport efficiency [55],be introduced to flame or plasma with a lower risk of while in the ultrasonic nebulizers the transportdisturbing its stability. High plasma stability leads to efficiency is usually higher (10–30% range). Thisstable and constant vaporization, atomization, excita- important parameter depends on the mean droplettion and ionization processes. There are numerous size (known as Sauter mean droplet diameter) of thenebulizers available commercially for the intro- aerosol as well as on the droplet size distribution.duction of liquid sample to ICP-MS systems and Much of the sample in aerosol is lost by condensa-their detailed description can be found elsewhere tion in the spray chamber and only small droplets[54]. In brief, pneumatic (concentric and cross-flow) enter the plasma. On the other hand, the particle sizeand ultrasonic nebulizers have been used in different of the aerosol has a very high impact on thestudies and Fig. 3 shows some typical designs. In the ionization capabilities of the plasma and indirectlyconcentric pneumatic nebulizer, both the gas stream affects the signal detection. The ‘‘quality’’ of theand the liquid flow in the same direction as shown in aerosol thus depends on the nebulizer efficiency.the Fig. 3A, while in the cross flow nebulizer the two Montasar et al. [56] give a detailed picture on dropletstreams are at right angles to each other (Fig. 3B). size characterization, droplet size distribution,When the gas travels at a high flow-rate, it creates a aerosol droplet distribution, typical droplet sizes withdrop in pressure near the tip, which draws the liquid various nebulizers and gases and modeling of nebul-through the inner tube and the sample emerges as an izer systems. With the use of conventional nebuliz-aerosol. A general scheme of ultrasonic nebulizer is ers, the transport efficiency can be increased (up toshown in Fig. 3D; a thin film of the solution flows 20%) by lowering the sample flow-rate (below 0.1
Fig. 3. Different types of nebulizers.
S.S. Kannamkumarath et al. / J. Chromatogr. A 975 (2002) 245–266 253
ml /min) [57], but this involves poorer precision of fourth choice, and it has the design advantage ofthe instrumental response. This led to the develop- minimizing dead volume.ment of new nebulizers that operate at low flow-rates A number of laboratory-made microconcentricand provide increased transport efficiency as well as nebulizers have been developed and evaluated foran improvement in the limits of detection [55]. These possible applications in coupling HPLC or CE tolow flow devices are the nebulizers of choice when ICP-MS [58,61–66]. Houk et al. [67] described thecoupling CE or micro bore HPLC separations to direct injection nebulizer (DIN), in which the sprayICP-MS. In Table 1, different nebulizers are listed chamber was eliminated and, at the flow-rates 30–and compared in terms of flow-rate, approximate 120ml /min, the transport efficiency was close totransport efficiency and applicability. Three commer- 100% [68,69]. The oscillating capillary nebulizercially available, low flow microconcentric nebulizers (OCN), was used for HPLC coupling to ICP-MS byare the microconcentric nebulizer (MCN) from Browner et al. [70]. The OCN was also adapted by
CETAC (Fig. 3C), the Meinhard high efficiency B’Hymer et al. [71], but the detection limits were notnebulizer (HEN) [47,58] and the MicroMist nebul- as good when compared to the performance of theizer [59]. Also, the DIHEN [60] from Meinhard is a HEN or a standard concentric nebulizer in an
Table 1Comparison of nebulizers used in CE–ICP-MS applications
Nebulizer Gas flow-rate Sample uptake Transport Comments References(l /min) efficiency
Operating at conventional flow-ratesConventional normally 1 0.5–4 ml /min 1–2% Worst short term stability (%RSD) at low [35,36,101]concentric solution uptake (,100 ml /min)Cross flow 0.5–1.0 1–3 ml /min 1–4% Less prone to salt build up [112]Ultrasonic 0.5–1.5 0.5–2.5 ml /min 20% with 1 ml /min, Better transport efficiency when spray [73,77]
almost 100% with chamber is heated or if the solutionlow flow uptake is reduced
Operating at low sample flowHEN 1 10–1200ml /min 10–20% Not suitable for high solute concentrations [47,58]
(50–60% at 11ml /min)DIN 1 100 ml /min close to 100% No spray chamber, good efficiency for [68,69]
volatile analytes and organic solventsDIHEN 0.25 85ml /min close to 100% Good precision, risk of high oxide ratios [112]OCN 1 1–2000ml /min close to 100% at lowest Undisturbed by the composition of the [65,71,72]
flow-rates solvent, the use of sol–gel frits tominimize suction effects [65]
MCN 1 10–50ml /min close to 50% HF resistant, offers desolvation [50,51,75,79]Modified, 0.58 5.6ml /min The uncertainty in the position of the [61]laboratory capillary in nebulizer did not affectmade significantly the nebulization efficiencymicro 0.8 1–15ml /min I.D.5200 mm of the gas introduction [62]concentric capillary assured best sensitivity,
internal standard recommended forquantitative analysis
0.9–1.1 50 or 100ml /min A cyclone spray chamber (v 5 4 ml), [63]Critical parameter: relative positionof the concentric tubes
Coaxial sheath flow Possibility of an exact and optimized [66]4 ml /min positioning of the capillary end
254 S.S. Kannamkumarath et al. / J. Chromatogr. A 975 (2002) 245–266
interface experiment with small bore HPLC to ICP- with the commercial device and finally refined theirMS. Kirlew and Caruso [72] used a modified oscil- interface to improve the gas flow pattern within thelating capillary nebulizer (MOCN) for a CE–ICP- spray chamber. The importance of the interfaceMS interface. The ultrasonic nebulizer has also been dimensions (length, internal diameter of the transferused and was able to avoid the suction effect usually capillary) has also been described in detail [76].generated by a pneumatic nebulizer. Increased sen- The materials used to construct an interface alsositivity was observed using the USN, however, there play a part in the accurate determination of elementalwas also an effective increase in the noise levels, species. The material of CE–ICP-MS interfaces hashindering the improvement ofS /N ratio [73]. The to be chosen carefully, because the materials them-use of sol–gel frits to minimize the suction effect selves may affect the distribution of elementalthrough the CE capillary while using a pneumatic species in the capillary effluent [78]. Presently,nebulizer has also been studied [65] PEEK interfaces are widely used to counter this
problem [50,79]. The tip of the capillary also plays a4 .3. Interfaces major role in the peak shape. When cutting the CE
capillaries, the ends must be cleaned and all debrisSuccessful coupling of CE to ICP-MS requires removed; both ends of the CE capillary must be
both high transport efficiency and the establishment evenly cut and not have jagged edges.of electrical connection between the CE capillary Another interesting approach with the coupling ofoutlet and the nebulizer. To fulfill these two require- CE with MS detection is in the use of an electrosprayments, researchers usually construct the interfaces. ion source (ES). ES generally operates within theTangen et al. [62] observed problems with the same flow-rate range as CE and has high transportgrounding of the CE capillary at the tip of DIN when efficiency. ES can be described as an electrophoretic-coupling CE to ICP-MS, due to interference of the like process, in which charged droplets are formedhigh voltage applied across the capillary with the RF when a high voltage is applied between a capillarypower supply of the ICP-MS. An interesting design containing the sample and the front plate of the massfor the electrical contact was reported by Deng and spectrometer [28]. If a positive potential is applied toChen [52]; they used a platinum electrode (thin wire the capillary with respect to the entrance slit, theof 50 mm diameter) wrapped across the opening of positive ions are attracted towards the capillary tipthe outlet end of CE capillary instead of inserting it and the filament solution breaks off to form ainto the capillary [61]. In the interface described by charged droplets. Cao and Moini [80] reported anPrange and Schaumloffel [74], an MCN from ES-type interface in which a 25mm diameterCETAC was used in the self-aspiration mode with platinum wire was introduced into the CE capillarydilute nitric acid used as the make-up sheath solution to maintain the electrical contact. Schrammel et al.(flow-rate approximately 6ml /min). The suction [81–83] developed a device, which allowed infinitelyeffect was minimized by optimizing the fluid me- variable adjustment of the CE capillary inside the ESchanical properties of the interface. The interface tip. Other interfaces of CE and ES have beenproposed by Mei et al. [75] was a Y-shaped quartz reported using membrane or frit junctions [84]. Sinceconnector with tapered arms, which was compatible ES is a soft ionization source, the direct introductionwith various types of pneumatic concentric nebul- of electrospray to the mass spectrometer offersizer. In other studies, several modifications of the excellent possibilities for characterizing elementalnebulizer and spray chamber were designed in order species composition. One drawback of this hybridto minimize the dead volume as well as to remove technique is the limitation of CE using only volatilelarge droplets from the aerosol [36,51,52,63,76]. background electrolytes in relatively low concen-
24Most of the modified spray chambers were of conical trations (below 10M) [85]. On the other hand, ESor cyclonic shape with the volume varying from 20 can be considered an aerosol source in which smallto 120 ml. Kirlew et al. [77] evaluated the feasibility droplets are produced with a relatively uniform sizeof using an ultrasonic nebulizer as a CE–ICP-MS distribution in contrast to the larger droplet sizeinterface; they compared the laboratory built design distribution produced by pneumatic nebulization.
S.S. Kannamkumarath et al. / J. Chromatogr. A 975 (2002) 245–266 255
Electrospray MS is more common in interfaces with focused on the evaluation of laboratory-made cou-HPLC; Gotz et al. [86] reported the technique in use pling devices and used elemental species standardwith a micro-bore HPLC separation. solutions at mg/ l concentration levels. The applica-
Other techniques are available to side step the low tions of CE in elemental speciation analysis to real-transport efficiency generally encountered with problem studies are still limited. The outstandingnebulizers. A CE–ICP-MS interface, which used potential advantage of CE is the possibility topost-column hydride generation, has been shown to separate a variety of species that possess differentcircumvent the transport efficiency nebulization charge and/or size within a single run. Thus, theproblem [87,88]. In these two cited works, both interest in analyzing the biological and environmen-arsenic and selenium compounds were separated by tal materials, containing an abundance of metallic orCE, and gaseous hydride species of the analytes were metalloid compounds is high. A number of studiesformed and introduced into the ICP-MS by means of have focused on arsenic and selenium speciation,a membrane gas–liquid separator. Also, a movable while much less work was done on chromium,reduction bed hydride generation system has been cobalt, iron, iodine and other elements. These studiesdesigned and studied [89,90]. This system enabled will be briefly discussed further in this review.the generation of hydride at micro-level samplevolumes without the use of a gas–liquid separator. 5 .1. Arsenic and seleniumOnly preliminary results were reported with thismicro-level system, and a number of questions still Arsenic and selenium speciation analysis are thehave to be addressed. All hydride generation de- two most prominent elements used in conjunctiontection approaches are limited to the analysis of with CE separation. The growing interest in seleniumelements or compounds which will readily form speciation is due to both its toxic and essentialvolatile hydrides. Therefore, this approach is some- properties that depend on total element quantity and,what limited in applicability. more importantly, its actual chemical form. In order
to elucidate the specific biological function(s) ofselenium, studies have been carried out in different
5 . Applications in elemental speciation analysis experimental systems and several selenoamino acidshave been identified and characterized [91].
The interfacing of CE to ICP-MS requires con- Selenium incorporation into proteins was demon-tinued development. There is a need for sensitive and strated by a specific pathway, as well as, followingselective detection for CE separations and the known sulfur analog pathways. Selenium can be found inadvantages of ICP-MS seem to meet these require- the active site of antioxidant enzymes which protectments. CE to ICP-MS interfacing is difficult due to cells against the effects of free radicals that arethe small sample volume introduced by CE. Low produced during normal oxygen metabolism [92].flow-rates within the capillary combined with the Thus, elemental speciation analysis of selenium innecessity to maintain electrical contact with the environmental and biological samples has beenoutlet of the CE capillary only adds to the level of focused on selenium in different oxidation statesdifficulty in interface design and construction. (selenite is potentially more toxic than selenate), onAnother limitation is the possible effect of sample identification and quantitation of selenoamino acids,matrix and/or chemical conditions used in CE and other species that can be generally classified asseparation on the elemental speciation results [27]. selenium metabolites. The toxicity of arsenic is alsoThe CE conditions may change the composition or species and compound dependent. As (III) is moreaffect the stability of the analytes during the run. toxic than As (V), and the inorganic forms areThus, there are fewer publications in the literature on several fold more toxic than the organic compoundsCE–ICP-MS applications in contrast to other specia- [93]. In studies of arsenic pathways in the environ-tion applications which used either gas or high- ment and in the living organisms, both the inorganicperformance liquid chromatography. The majority of forms and a variety of methylated forms, such asstudies using CE for elemental speciation have been monomethylarsonic acid (MMA), dimethylarsenic
256 S.S. Kannamkumarath et al. / J. Chromatogr. A 975 (2002) 245–266
acid (DMA), arsenocholine (AsC) or arsenobetaine tection system (53–280mg/ l vs. 440–1900mg/ l for(AsB) are of primary importance [94–96]. For the UV).needed analytical task of elemental speciation, CE In other work by Day et al. [48], results of acan be the technique of choice. Due to the large CE–ICP-MS application to chiral speciation of sel-possible number of species present in a sample, and enomethionine obtained from selenized yeast afterbecause these chemical species possess different enzymatic digestion were reported. Marfey’s reagentcharge and size, CE often can offer the perfect (1-fluoro-2,4-dinitrophenyl-5-L-alanine amide) wasseparation mechanism. In addition, minimum dis- used for the derivatization of the free selenoaminoturbance in species composition can be expected acids and the separation of the derivatives waswith these arsenic and selenium compounds. Table 2 achieved (Fig. 4A and B) using a phosphate buffercontains much in the literature available on arsenic (pH 3.3). A self-aspiration interface with a mi-and selenium speciation by CE–ICP-MS and pro- croconcentric nebulizer was applied for coupling CEvides an excellent summary. to ICP-MS. The migration time reproducibility was
In the early work of Liu et al. [68], the proposed comparable between ICP-MS and UV on-columnCE–ICP-MS interface based on the direct injection detection, while the detection limit was lower usingnebulizer was evaluated using various test solutions, ICP-MS detection (50 vs. 250mg/ l).including a solution of four arsenic compounds (As A good example of the high resolution provided(III), As (V), MMA and DMA, 500 mg/ l each) and a by CE as applied to speciation studies with masssolution containing inorganic forms of selenium and spectrometry detection was presented by Prange andarsenic (2 mg/ l each). Baseline separation was Schaumloffel [74]. By using a laboratory-constructedachieved using an electrophoretic buffer containing a CE–ICP-MS interface, they obtained baseline sepa-cationic surface modifier (pH 7.7) within 24 and 15 ration of 12 compounds, including seven arsenicmin, respectively. In another study, the experimental species (As (III), As (V), MMA, DMA, AsC, AsBconditions for CE–ICP-MS analysis of Se (IV), Se and phenylarsonic acid), two inorganic selenium(VI), As (III), As (V) and DMA were performed by forms (Se (IV), Se (VI)), one antimony species (SbKirlew et al. [77]. Different interface designs were (V)) and two inorganic forms of tellurium (Te (IV),used, based on ultrasonic nebulization. Using opti- Te (VI)) within a 10 min run time along withmized conditions, a separation was accomplished excellent peak shapes (Fig. 5). Differences in migra-within 10 min; the best sensitivities were obtained tion times was less than 3% and the detection limitsusing electrokinetic injection and pH 8 electropho- were around 1mg/ l (somewhat poorer detectionretic buffer. In the Kirlew study, the As (III) peak limits were obtained for AsB, Se (IV) and Se (VI)).did not appear (pK 59.4) and the migration times of Two other active researchers in selenium specia-a
As (V) and Se (IV) were very similar (around tion analysis by CE–ICP-MS are Michalke and4 min), the latter two analytes being easily resolved Schramel [97]. Their chief interests are in analysis ofby the ICP-MS multielement capability. In the work inorganic selenium forms, selenoamino acids, as wellby Day et al. [50], a self-aspiration microconcentric as selenium carrying glutathione (GSSeSG) in bio-nebulizer interface for CE–ICP-MS was constructed logical samples. Using a capillary zone electropho-and tested for four anionic arsenic species (As (III), retic method (CZE) with alkaline background elec-As (V), MMA, DMA) and one neutral species trolyte (pH 11.5), six selenium species (seleno-(AsB). In order to compare the analytical perform- cystamine, Se (VI), selenocystine, Se (IV), seleno-ance of the hyphenated technique with the procedure methionine and GSSeSG) were separated in 10 minbased on the common UV detection under the same (Fig. 6). The evaluated detection limit for inorganicexperimental conditions, an electrophoretic buffer and organic species were 10–20 and 35–50mg/ l,containing strong UV chromophore was selected (4.4 respectively [97]. Shifts in migration times occurredmM sodium chromate, pH 8.2 with sodium hy- with increasing the number of compounds loaded ondroxide). A baseline separation of the five arsenic the CE system relative to the single standard runs.species was achieved in 15 min with significantly The cross interferences were attributed to changes inlower detection limits obtained using ICP-MS de- sample conductivity and ion concentration. In a
S.S.K
annamkum
arathet
al./
J.C
hromatogr.
A975 (2002) 245–266
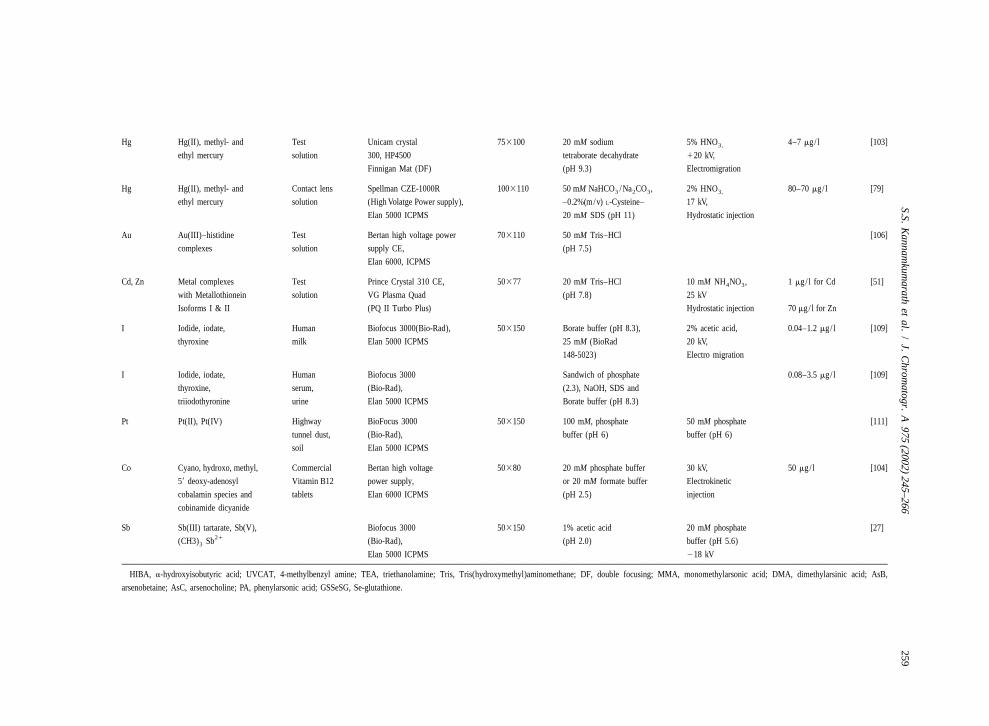
257Table 2Applications of CE–ICP-MS in elemental speciation analysis
Element Species analyzed Sample Instrumentation Capillary Electrolyte /buffer Sheath solution L.O.D. Ref.
matrix dimensions applied voltage,
(Fused silica) injection type
I.D., mm
3length, cm
As As(III), As(V), Test ISCO 3850 CE 50375 2.3 mM pyromellitic 2% HNO , 50mg/ l 20–100 ng/ l [68]3
260 S.S. Kannamkumarath et al. / J. Chromatogr. A 975 (2002) 245–266
further development of this work, the method wasapplied to the analysis of human milk and serum[98]. The pretreatment procedure for milk consistedof defatting and deproteinization, followed bylyophylization and re-dissolution in the electropho-retic buffer. After a 10-fold preconcentration,GSSeSG, selenocystamine and selenocystine werefound at levels close to the detection limit. Theserum samples were diluted with electrophoreticbuffer and several selenium species were observed.However, the results of a standard addition pro-cedure were misleading (several peaks were in-creased in height after single standard addition) andthe identification of species was postponed to futurestudies. In the same work, the feasibility of capillaryisoelectric focusing (cIEF, pH range 2–10) wasexplored for organic selenium species. Slightly lowerdetection limits (10–30mg/ l) as compared to CZEwere shown.
Recently, some of the advantages and improve-ments in selenium speciation using CE–ICP-MSwere presented by Michalke [99]. Biological samples
Fig. 4. CE–ICP-MS electropherograms of standards (A) Marfey’s(urine and sewage sludge supernatant) were analyzedderivatized DL-selenomethionine; and (B) 1 ppm mixture ofby these same authors for arsenic speciation [100].selenate and selenite. Conditions: 30 mM (NH ) HPO , pH 3.3,4 2 4
218 kV [48]. The six species (As (III), As (V), MA, DMA, AsBand AsC) were separated in less than 2 min with adetection limit of about 15mg/ l (65 mg/ l for AsC
40 35 1and AsB). The Ar Cl interference in ICP-MSdetection was not observed, but a broad signal
35appeared using the Cl channel that was explainedby the high sample conductivity. The sensitivity ofthe procedure was too low when compared withurine selenium levels, hindering speciation analysisin this material. In the liquid phase of a sewagesludge, MMA and As(V) were partially identified. Inanother study, Van Holderbeke et al. [101] investi-gated arsenic speciation in three different chemicalmatrices, namely, drinking water, human urine andsoil leachate. All were run under basic conditions byCE (20 mM borate buffer, pH 9.4) and in thepresence of cationic surfactant as the osmotic flowmodifier. The separation of AsC, AsB, As (III),DMA, MMA and As (III) was obtained; excellentdetection limits for all species (around 2mg/ l) wereobserved in this study (Fig. 7).
In a few studies of arsenic and selenium specia-Fig. 5. Simultaneous separation of 12 species of four elements.
tion, the hydride generation technique was used forConcentration of elements: As, Sb, Te 100mg/ l each, Se 1000interfacing CE to ICP-MS [87,88] or ICP-OESmg/ l [74].
S.S. Kannamkumarath et al. / J. Chromatogr. A 975 (2002) 245–266 261
Fig. 7. (a) Electropherogram showing the separation of As (V),MMA, DMA, As (III), AsB and AsC, obtained with CE–ICP-MSbefore optimization, (b) Electropherogram of about 20mg/ lAs(V), MMA, DMA and As (III) obtained after optimization ofthe CE–ICP-MS system. Conditions: 20 mM borate (pH 9.4), 2%OFM, 75mm I.D. capillary, total length 88 cm, 5 kPa for 40 s plus5 s post-injection,225 kV [101].
speciation of the two elements was used in a similarexperimental design, with reduction of Se (VI) priorto hydride generation [88]. A movable reduction bedhydride generation system was applied in couplingCE to an ICP ion source in arsenic speciation (As(III), As (V), MMA, DMA). A CZE separationFig. 6. Separation of inorganic (upper) and organic (lower) Se
77 method was used (pH 6.5), and the hydride gene-species, each 150mg Se/ l. Only the Se isotope is shown, as the78Se isotope is interfered by polyatomic interferences more ration device enabled hydride formation at micro-frequently. This results in ‘‘pseudo-Se-signals’’ and decreases the level sample volumes without the use of a gas–liquidsignal-to-noise ratio. The species are monitored at (1) 6 s (SeCM),
separator.(2) 13 s (Se (VI)), (3) 20 s (SeC), (4) 26 s (Se (IV)), (5) 33 sThe on-line coupling of CE to electrospray ioniza-(SeM) and (6) 45 s (GSSeSG) [97].
tion mass spectrometry (ES-MS) for seleniumspeciation has been studied. Various problems relatedwith both technical and methodological aspects, have
(optical emission spectroscopy) [89]. Magnuson et been described [85]. A similar approach was used foral. [87] investigated As(V), DMA, MMA and As(III) the analysis of six arsenic species (As (III), As (V),speciation under the conditions of electrokinetic MMA, DMA, AsC and AsB) [87]. An acetate bufferinjection (pH 9.03), hydrodynamically modified EOF for pH stacking was used, and baseline resolutionand microporous membrane gas–liquid separator. In was achieved for As (V), DMA, AsC and AsB. Thea further development of this work, the simultaneous detection limits for these arsenic compounds ranged
262 S.S. Kannamkumarath et al. / J. Chromatogr. A 975 (2002) 245–266
from 60 to 480 mg/ l in this study [82]. Both on species stability, their inter-conversion or newhyphenated techniques, CE to ES-MS and CE to species formation, appearance of ‘‘ghost’’ peaks andICP-MS, were used to maximize analytical infor- adherence to the capillary walls were addressedmation in the speciation of selenium [83]. Because of while analyzing compounds of antimony, Sb (III),
1the limitation of the electrospray process, acetic acid Sb (V) and (CH ) Sb . Three chemical species of3 3
(2-5%) was used as the electrophoretic buffer and mercury (inorganic, methyl- and ethyl-mercury)the separation of three selenoamino acids were separated as cysteine complexes at alkaline pH(selenocystamine, selenocystine and selenomethion- and introduced on-line to ICP-MS [79,103]. Twoine) was achieved by both CE–ESI-MS and CE– isoforms of rabbit liver metalloproteins which con-ICP-MS with total analysis time of 28 and 8 min, tain cadmium and zinc were used to evaluate therespectively. instrumental design for CE–ICP-MS coupling by
Taylor et al. [51]. Cuadrado et al. [105] presented aninteresting application of CE–ICP-MS to investigate
5 .2. Miscellaneous elements the kinetics of gold (III)–L-histidine complex forma-tion.
Table 2 shows summarizes a variety of species of In another study, off-line ES-MS species charac-elements that have been studied using CE–ICP-MS, terization in the CE effluents was studied byin addition to arsenic and selenium speciation previ- Schramel et al. [81]. This was done in order to assessously discussed in this review. The investigated the suitability of this ES-MS technique; three typesspecies listed within Table 2 and the literature noted of compounds were selected for the Schramel study.cover a wide range of compounds of different A free metal ion (Cu (II)), metal–ion containingphysicochemical properties; from the element oxida- complexes (CuEDTA, (CH ) SbCl ) and covalent3 3 2
tion states through methylated element compounds, organometallic compounds (selenocystamine, seleno-and from inorganic and organic complexes to ele- methionine) were evaluated.ments contained within biomolecules [74,97,102–104]. The separation conditions, as well as the detailsof instrumental design are summarized, and hopeful- 5 .2.2. Studies of complex samplesly, will enable a further understanding of the po- Complex sample matrices have also been studiedtential advantages and limitations of elemental and reported in the literature using CE elementalspeciation using capillary electorphoresis. speciation. The analysis of different iodine chemical
forms in biological fluids was addressed in differentspeciation schemes [106,107] because such infor-
5 .2.1. Studies of model solutions mation is useful in evaluation of the thyroid glandModel solution studies of elements have often function [93]. Michalke [27] developed a CE–ICP-
been noted in the literature. Two chemical systems, MS procedure for three iodine species (iodide, iodateCr (III) /Cr (VI) and Cu (II) /Cu [EDTA], have been and thyroxine), in which low detection limits (0.04,often used [52,61,62,75] in studies using either CE– 0.05 and 10mg/ l, respectively) were achieved byICP-OES or CE–ICP-MS. The speciation of Cr (III) sample stacking. This procedure was then applied tohydrolytic polymerization products was undertaken analysis of human milk, serum and urine samples.by Stewart and Olesik [102]. In spite of chemical The iodide and thyroxine were the two species foundlability of the species, it was possible to separate and in pooled milk and the quantitative results (14 anddetect monomeric and polymeric species in solutions 27mg/ l) showed good species recovery relative toat different pH’s and after aging. Electrospray mass total iodine concentration [27]. In human serum, thespectrometry was applied to confirm the presence of three species (iodide, thyroxine and triiodothyronine)the species expected in the solutions. In work by were identified by the method of standard additionMichalke [27], the problems in speciation analysis and the iodine distribution among these speciesrelated to the possible effect of separation conditions correlated with the health status of the individuals.
S.S. Kannamkumarath et al. / J. Chromatogr. A 975 (2002) 245–266 263
The predominant iodine species found in urine was compounds, including small metal ions to largeiodide [108], in agreement with earlier literature data neutral or electrically charged biomolecules, within a[106]. This same research group used the CE–ICP- single run. Moreover, the technique has been suc-MS technique for platinum speciation in soils cessfully used for the separation of relatively labile[66,109,110], where fast transformations of the solu- complexes and to study the kinetics of complexble platinum species occur [111]. They demonstrated formation. An important limitation of this techniquethat neither the CE conditions nor the pressure is the influence of electrophoretic buffer composi-during the detection step significantly affected tion. The conditions that assure optimum separationspecies stability [66]. They then applied an orthogon- often involve low or high pH values, or the presenceal speciation scheme involving reversed-phase of a ‘‘complexing’’ reagent. These conditions couldHPLC–IC-MS and CE–ICP-MS to maximize in- affect the natural elemental speciation of the sampleformation on platinum speciation and on the pro- analyzed. Therefore, care is needed while selectingcesses of species transformation in tunnel dust /soil the experimental conditions for the CE separation.samples [109]. On the other hand, there is little limitation regarding
Other applications of CE–ICP-MS to ‘‘real the CE effluent for ICP-MS detection, which often isworld’’ samples was in the speciation of cobalamins the case when interfacing other chromatographicand the potentially harmful corrinoid analog techniques to the ICP-MS. A second limitation of CE(cobinamide dicyanide) in vitamin B12 supplements with interferences occurs when the sample conduc-by Baker et al. [104]. The cobalamines studied were tivity is different from that of electrophoretic buffer.cyanocobalamin, hydroxocobalamin, methyl- In many cases, sample pretreatment will be neededcobalamin and 59-deoxyadenosylcobalamin. In this to simplify the sample’s chemical composition. ICP-study, the separation was carried out by a CZE MS detection seems to be a technique of choice formethod using phosphate and formate buffers (pH CE, since it offers high detection power, element2.5) and by micellar electrokinetic chromatography specificity, multielement capabilities and enables(Tris–HCl buffer with sodium dodecyl sulfate isotope analysis. It should be stressed, that ICP-MS(SDS), pH 8). All separation run times were under detection response is based on the quantity of analyte30 min. The excellent selectivity of these CE–ICP- (mass) rather than the concentration of the solution.MS procedures was demonstrated with detection Because of the small sample load in CE analysis, thelimits ranging from 30 to 70mg/ l. This easily advantage of ppt or lower detection levels is lost inenabled compound quantification in pharmaceutical CE–ICP-MS. Studies have shown only a few foldformulations. However, the authors stressed that the decrease in the detection limits (on the single ele-possible applicability to food or clinical samples ment basis) as compared to UV detection. An areawould depend on the success of clean-up and still undergoing improvement is interface design.preconcentration procedures because of the low The construction of the laboratory built interfacesconcentrations of analytes within these complicated must be done carefully to assure high transportsample matrices. efficiency without affecting the separation process.
Hopefully, more commercially built units will be-come available in the near future to minimize thesedifficulties.
6 . Conclusions and future outlook In summary, the actual use of CE–ICP-MS inelemental speciation analysis has had somewhat
There is no doubt that CE and ICP-MS are limited applicability. Most of the applications couldtechniques of separation and detection that are well have been done with HPLC methods, which oftensuited for elemental speciation analysis. The out- provide lower detection levels. Currently, casesstanding advantages of CE are the high peak plate where CE can be very useful is when only nanoliternumber (peak efficiency) and its separation ef- sample volumes can be used. Limited sample quan-ficiency which allow for resolving a variety of tities or radioactive samples are ideal examples and
264 S.S. Kannamkumarath et al. / J. Chromatogr. A 975 (2002) 245–266
[8] A. Kim, S. Hill, L. Ebdon, S. Rowland, Hrc-J. High Resolut.certainly should be analyzed by CE elemental specia-Chromatogr. 15 (1992) 665.tion procedures. Future analytical developments for
[9] T. DeSmaele, L. Moens, R. Dams, P. Sandra, Fresenius J.CE elemental speciation analysis need to include: (a) Anal. Chem. 355 (1996) 778.improvement in sample pretreatment procedures [10] N.P. Vela, J.A. Caruso, J. Chromatogr. 641 (1993) 337.(clean-up, preconcentration and the preservation of [11] J.M. Carey, N.P. Vela, J.A. Caruso, J. Anal. Atomic Spec-
trom. 7 (1992) 1173.the natural elemental species distribution); (b) explo-[12] E. Blake, M.W. Raynor, D. Cornell, Am. Lab. 26 (1994) 46.ration of different operating modes of capillary[13] K.L. Sutton, J.A. Caruso, J. Chromatogr. A 856 (1999) 243.
electrophoresis (CZE, MECC, isoelectric focusing [14] C. B’Hymer, J.A. Brisbin, K.L. Sutton, J.A. Caruso, Am.and isotachophoresis); (c) enhancement of sample Lab. 32 (2000) 17.loading to CE (stacking); (d) the use of ICP-MS [15] G.K. Zoorob, J.W. McKiernan, J.A. Caruso, Mikrochim. Acta
128 (1998) 145.detectors with the lowest possible detection levels[16] L.A. Ellis, D.J. Roberts, J. Chromatogr. A 774 (1997) 3.(the use of sector-field ICP-MS has already been[17] F.A. Byrdy, J.A. Caruso, Environ. Health Perspect. 103
reported [103]); and (e) improvements of the trans- (1995) 21.port efficiency of the interface. The use of com- [18] F.A. Byrdy, J.A. Caruso, Environ. Sci. Technol. 28 (1994)plementary detectors enabling the identification/con- A528.
[19] J.W. Jorgenson, K.D. Lukacs, Anal. Chem. 53 (1981) 1298.firmation of species is also desirable. Electrospray[20] J.W. Jorgenson, K.D. Lukacs, Clin. Chem. 27 (1981) 1551.mass spectrometry is one such detector and has[21] J.W. Jorgenson, K.D. Lukacs, J. Chromatogr. 218 (1981)
already been applied to selenium and arsenic specia- 209.tion by CE. Low sensitivity of ES has been an [22] J.W. Jorgenson, K.D. Lukacs, Science 222 (1983) 266.important limiting factor in its use. Finally, the future [23] A.R. Timerbaev, E. Dabek-Zlotorzynska, M. van den Hoop,
Analyst 124 (1999) 811.looks very promising for CE in its continued use for[24] A.R. Timerbaev, Talanta 52 (2000) 573.elemental speciation analysis.[25] J. Olesik, in: J.A. Caruso, K.L. Ackley (Eds.), Elemental
Speciation. New Approaches for Trace Element Analysis,Comprehensive Analytical Chemistry, Vol. XXXIII, Elsevier,Amsterdam, 2000.
[26] V. Majidi, N.J. Miller-Ihli, Analyst 123 (1998) 809.A cknowledgements[27] B. Michalke, J. Anal. Atomic Spectrom. 14 (1999) 1297.[28] J.W. Olesik, J.A. Kinzer, E.J. Grunwald, K.K. Thaxton, S.V.
Olesik, Spectrochim. Acta Part B-Atomic Spectrosc. 53K. Wrobel and K. Wrobel gratefully acknowledge(1998) 239.the University of Guanajuato, CONACyT (Mexico)
[29] P. Jandik, G. Bonn, Fundamentals of Capillary Electro-and the University of Cincinnati for the financialphoresis, VCH, Weinheim, 1993.
support of their sabbatical research stays. [30] C. Vogt, G.L. Klunder, Fresenius J. Anal. Chem. 370 (2001)316.
[31] E.S. Yeung, Acc. Chem. Res. 22 (1989) 125.[32] A. Weston, P.R. Brown, P. Jandik, A.L. Heckenberg, W.R.
Jones, J. Chromatogr. 608 (1992) 395.R eferences [33] E. Dabek-Zlotorzynska, E.P.C. Lai, A.R. Timerbaev, Anal.
2949.[3] H. Klinkenberg, S. Vanderwal, J. Frusch, L. Terwint, T.[36] J.W. Olesik, J.A. Kinzer, S.V. Olesik, Anal. Chem. 67 (1995)Beeren, Atomic Spectrosc. 11 (1990) 198.
1.[4] S.C.K. Shum, R. Neddersen, R.S. Houk, Analyst 117 (1992)[37] G. O’Connor, E.H. Evans, in: S.J. Hill (Ed.), Inductively577.
Coupled Plasma Spectrometry and its Applications, Sheffield[5] N.P. Vela, J.A. Caruso, J. Anal. Atomic Spectrom. 11 (1996)Academic Press, Sheffield, UK, 1999.1129.
[38] A. Fisher, S.J. Hill, in: S.J. Hill (Ed.), Inductively Coupled[6] J.S. Becker, W. Kerl, H.J. Dietze, Anal. Chim. Acta 387Plasma Spectrometry and its Applications, Sheffield Aca-(1999) 145.demic Press, Sheffield, UK, 1999.[7] A. Prange, E. Jantzen, J. Anal. Atomic Spectrom. 10 (1995)
[39] G.J. Shugar, J.A. Dean, The Chemist’s Ready Reference105.Handbook, McGraw-Hill, New York, 1990.
S.S. Kannamkumarath et al. / J. Chromatogr. A 975 (2002) 245–266 265
[40] R.S. Houk, Anal. Chem. 58 (1986) 97A. [69] L. Bendahl, B. Gammelgaard, O. Jons, O. Farver, S.H.[41] A. Montaser, J.A. McLean, H. Liu, J.-M. Mermet, in: A. Hansen, J. Anal. Atomic Spectrom. 16 (2001) 38.
Montaser (Ed.), Inductively Coupled Plasma Mass Spec- [70] L.Q. Wang, S.W. May, R.F. Browner, S.H. Pollock, J. Anal.trometry, Wiley–VCH, New York, 1998. Atomic Spectrom. 11 (1996) 1137.
[42] U. Giessmann, U. Greb, Fresenius J. Anal. Chem. 350 [71] C. B’Hymer, K.L. Sutton, J.A. Caruso, J. Anal. Atomic(1994) 186. Spectrom. 13 (1998) 855.
[43] L. Moens, P.Verrept, R. Dams, U. Greb, G. Jung, B. Laser, J. [72] P.W. Kirlew, J.A. Caruso, Appl. Spectrosc. 52 (1998) 770.Anal. Atomic Spectrom. 9 (1994) 1075. [73] Q.H. Lu, R.M. Barnes, Microchem. J. 54 (1996) 129.
[44] S. Yamasaki, A. Tsumura, Y. Takaku, Microchem. J. 49 [74] A. Prange, D. Schaumloffel, J. Anal. Atomic Spectrom. 14(1994) 305. (1999) 1329.
[46] R. Thomas, Spectroscopy 17 (2002) 42. [76] A. Tangen, W. Lund, J. Chromatogr. A 891 (2000) 129.[47] J.A. Kinzer, J.W. Olesik, S.V. Olesik, Anal. Chem. 68 (1996) [77] P.W. Kirlew, M.T.M. Castillano, J.A. Caruso, Spectrochim.
3250. Acta Part B-Atomic Spectrosc. 53 (1998) 221.´[48] J.A. Day, S.S. Kannamkumarath, E.G. Yanes, M.M. Bayon, [78] V. Majidi, Microchem. J. 66 (2000) 3.
J.A. Caruso, J. Anal. Atomic Spectrom. 17 (2002) 27. [79] T.H. Lee, S.J. Jiang, Anal. Chim. Acta 413 (2000) 197.[49] R.D. Smith, C.J. Barinaga, H.R. Udseth, Anal. Chem. 60 [80] P. Cao, M. Moini, J. Am. Soc. Mass Spectrom. 8 (1997) 561.
(1988) 1948. [81] O. Schramel, B. Michalke, A. Kettrup, J. Chromatogr. A 819[50] J.A. Day, K.L. Sutton, R.S. Soman, J.A. Caruso, Analyst 125 (1998) 231.
(2000) 819. [82] O. Schramel, B. Michalke, A. Kettrup, J. Anal. Atomic[51] K.A. Taylor, B.L. Sharp, D.J. Lewis, H.M. Crews, J. Anal. Spectrom. 14 (1999) 1339.
Atomic Spectrom. 13 (1998) 1095. [83] B. Michalke, O. Schramel, A. Kettrup, Fresenius J. Anal.[52] B.Y. Deng, W.T. Chan, J. Chromatogr. A 891 (2000) 139. Chem. 363 (1999) 456.[53] Product literature for CETAC CEI-100 interface system, [84] J.C. Severs, R.D. Smith, Anal. Chem. 69 (1997) 2154.
CETA C, 2002. [85] O. Schramel, B. Michalke, A. Kettrup, Fresenius J. Anal.[54] A. Montaser, M.G. Minnich, J.A. McLean, H. Liu, J.A. Chem. 363 (1999) 452.
Caruso, C.W. McLeod, in: A. Montaser (Ed.), Inductively [86] R. Gotz, J.W. Elgersma, J.C. Kraak, H. Poppe, Spectrochim.Coupled Plasma Mass Spectrometry, Wiley–VCH, New Acta Part B-Atomic Spectrosc. 49 (1994) 761.York, 1998. [87] M.L. Magnuson, J.T. Creed, C.A. Brockhoff, J. Anal.
[55] C. B’Hymer, J.A. Caruso, in: J.A. Caruso, K.L. Ackley Atomic Spectrom. 12 (1997) 689.(Eds.), Elemental Speciation: New Approaches for Trace [88] M.L. Magnuson, J.T. Creed, C.A. Brockhoff, Analyst 122Element Analysis, Elsevier, New York, 2000. (1997) 1057.
[56] A. Montaser, M.G. Minnich, H. Liu, A.G.T. Gustavsson, [89] X.D. Tian, Z.X. Zhuang, B. Chen, X.R. Wang, Analyst 123R.F. Browner, in: A. Montaser (Ed.), Inductively Coupled (1998) 899.Plasma Mass Spectrometry, Wiley–VCH, New York, 1998. [90] X.D. Tian, Z.X. Zhuang, B. Chen, X.R. Wang, Analyst 123
[57] J.W. Olesik, I. Stewart, J. Hartshone, J.A. Kinzer, 1998 (1998) 627.Winter Conference on Plasma Spectrochemistry, Scottsdale, [91] R. Lobinski, J.S. Edmonds, K.T. Suzuki, P.C. Uden, PureArizona, USA, 1998. Appl. Chem. 72 (2000) 447.
[58] K.L. Sutton, C. B’Hymer, J.A. Caruso, J. Anal. Atomic [92] G. Trepanier, D. Furling, J. Puymirat, M.E. Mirault, Neuro-Spectrom. 13 (1998) 885. science 75 (1996) 231.
[59] G.E.P.L. Product literature for the MicroMist nebulizer, P.O. [93] C.A. Burtis, E.R. Ashwood, Tietz Textbook of ClinicalBox 411, Victoria, 3124 Australia. Chemistry, W.B. Saunders Company, Philadelphia, 1999.[60] Product literature for DIHEN nebulizer, Meinhard , 2002.
[94] K.L. Ackley, C. B’Hymer, K.L. Sutton, J.A. Caruso, J. Anal.[61] Y.Y. Chan, W.T. Chan, J. Chromatogr. A 853 (1999) 141.
Atomic Spectrom. 14 (1999) 845.[62] A. Tangen, W. Lund, B. Josefsson, H. Borg, J. Chromatogr.
[95] A. Chatterjee, Y. Shibata, J. Yoshinaga, M. Morita, Anal.A 826 (1998) 87.
[96] Z. Mester, J. Pawliszyn, J. Chromatogr. A 873 (2000) 129.[64] D. Schaumloffel, A. Prange, Fresenius J. Anal. Chem. 364
[97] B. Michalke, P. Schramel, Electrophoresis 19 (1998) 270.(1999) 452.
[98] B. Michalke, P. Schramel, J. Chromatogr. A 807 (1998) 71.[65] C. B’Hymer, R.M.C. Sutton, K.L. Sutton, J.A. Caruso, Anal.
[99] B. Michalke, Spectroscopy 15 (2000) 30.Commun. 36 (1999) 349.
[100] B. Michalke, P. Schramel, Electrophoresis 19 (1998) 2220.[66] B. Michalke, P. Schramel, Fresenius J. Anal. Chem. 357
[101] M. Van Holderbeke, Y.N. Zhao, F. Vanhaecke, L. Moens, R.(1997) 594.Dams, P. Sandra, J. Anal. Atomic Spectrom. 14 (1999) 229.[67] D.R. Wiederin, R.E. Smyczek, R.S. Houk, Anal. Chem. 63
[102] I.I. Stewart, J.W. Olesik, J. Chromatogr. A 872 (2000) 227.(1991) 1626.[103] M.S. da Rocha, A.B. Soldado, E. Blanco-Gonzalez, A.[68] Y. Liu, V. Lopezavila, J.J. Zhu, D.R. Wiederin, W.F. Beckert,
266 S.S. Kannamkumarath et al. / J. Chromatogr. A 975 (2002) 245–266
[104] S.A. Baker, N.J. Miller-Ihli, Spectrochim. Acta Part B- [109] S. Lustig, B. Michalke, W. Beck, P. Schramel, Fresenius J.Atomic Spectrosc. 55 (2000) 1823. Anal. Chem. 360 (1998) 18.
[105] J.A. Cuadrado, W.X. Zhang, W. Hang, V. Majidi, J. Environ. [110] B. Michalke, S. Lustig, P. Schramel, Electrophoresis 18Monit. 2 (2000) 355. (1997) 196.
[106] W. Buchberger, J. Chromatogr. 439 (1988) 129. [111] F. Foret, O. Muller, J. Thorne, W. Gotzinger, B.L. Karger, J.[107] G. Knapp, B. Maichin, P. Fecher, S. Hasse, P. Schramel, Chromatogr. A 716 (1995) 157.
Fresenius J. Anal. Chem. 362 (1998) 508. [112] V. Majidi, J. Qvarnstrom, Q. Tu, W. Frech, Y. Thomassen, J.[108] B. Michalke, P. Schramel, Electrophoresis 20 (1999) 2547. Anal. Atomic Spectrom. 14 (1999) 1933.


![Review Analytical-scale supercritical fluid extraction: a ...quimica.udea.edu.co/~carlopez/cromatogc/sfe polluntants... · Analytical-scale supercritical fluid extraction ... [lo],](https://static.documents.pub/doc/80x56/5ab139fa7f8b9a6b468c4025/review-analytical-scale-supercritical-fluid-extraction-a-carlopezcromatogcsfe.jpg)


