Proc. Nati. Acad. Sci. USA Vol. 91, pp. 5748-5755, June 1994 Review A role for molecular genetics in biological conservation Stephen J. O'Brien Laboratoy of Viral Carcinogenesis, National Cancer Institute, Fredeorick Cancer Research and Development Center, Frederick, MD 21702-1201 ABSTRACT The recognition of recent accelerated depletion of species as a con- sequence of human industrial development has spawned a wide interest in identifying threats to endangered species. In addition to ecological and demographic perils, it has become clear that small populations that narrowly survive demographic con- traction may undergo close inbreeding, genetic drift, and loss of overall genomic variation due to allelic loss or reduction to homozygosity. I review here the conse- quences of such genetic depletion revealed by applying molecular population genetic analysis to four endangered mammals: African cheetah, lion, Florida panther, and humpback whale. The accumulated genetic results, combined with physiolog- ical, ecological, and ethological data, pro- vide a multifaceted perspective of the pro- cess of species diminution. An emerging role of population genetics, phylogenetics, and phylogeography as indicators of a population's natural history and its future prognosis provides valuable data of use in the development of conservation manage- ment plans for endangered species. Biological conservation did not start out as a science or even a wide-spread public concern until we read authors like Osa Johnson [I Married Adventure (1)], Joy Adamson [Born Free (2)], and Karen Blixen [Out of Africa (3)], who chroni- cled the depletion of African wildlife, or heard Rachel Carson's prophetic warning in The Silent Spring (4). The eerie pros- pect that our descendants might be de- nied the benefits of wildlife diversity and be destined to a world with but a handful of domestic plants and animals drew at- tention to the gradual but deliberate con- sequences of unrestricted human growth. The sad truth emerged that we are in the midst of the most rapid extinction event since the demise of the dinosaurs, and the primary cause is human development. Today conservation is a broadly sup- ported goal of all peoples and the initia- tive to reverse the erosion of biodiversity involves many disciplines: politics, sci- ence, diplomacy, and economics, to name a few (5, 6). There is a role for each of these in conservation and the newest area involves biomedical and genetic technologies. In full understanding of the complicity of technology in facilitating the "taming of the wild," it may offer some small comfort that applications of biomedical and genetic technologies could have a role in reversing extinction processes or at least in developing man- agement plans to curtail the rate of spe- cies extinction. In the past two decades, the methods of molecular biology, clinical medicine, and reproductive physiology have been used to describe in precise detail the prospective status of several endangered species (7-9). The results obtained have provided important insight that critically affected management decisions and pro- duced tangible benefits to the studied species. In addition, conservation appli- cations have transformed population ge- netics from an academic discipline con- cerned with how flies, rodents, and plants handle natural selection to the forefront of global management decisions of critically endangered species. After a half century of exquisite theoretical and empirical development, the paradigms of population genetics are providing critical guidance for interpreting the history, pre- sent status, and future prognosis for threatened species. Further, evolution- ary strategies encoded in the genomic architecture of natural populations are being revealed in ways that have direct bearing on human biology and offer pro- vocative solutions to medical disease questions as well. To understand the influence that mo- lecular genetic analyses have exerted on conservation, it is necessary to under- stand what genetic surveys involve and measure. Molecular descriptions of the quality and quantity of genetic diversity in populations really began when Lew- ontin and Hubby (10) estimated the av- erage genomic heterozygosity in popula- tions of Drosophila pseudoobscura by using 18 protein and allelic isozyme (al- lozyme) loci. Their study stimulated sim- ilar estimates in hundreds of species, each looking at up to 50 allozyme loci for genetically controlled variation (11, 12). Most natural populations displayed 15- 50%o of their allozyme loci as polymor- phic and the average heterozygosity was between 2 and 15%. Much of the early discussion of the variation dealt with how much random mutational variation a pop- ulation could tolerate (Muller's genetic load concept), and later on, whether the patterns of variation supported an adap- tive or a selectively neutral explanation (12-14). The conservation community took no- tice of such studies when Bonnell and Selander (15) discovered that the endan- gered northern elephant seal displayed no variation in a survey of 24 allozyme loci. These authors interpreted their re- sults as a consequence of a previously documented 18th century population bot- tleneck (due to hunting exploitation) fol- lowed by inbreeding (15-17). Their con- clusions have been confirmed more re- cently with an allozyme study plus a mitochondrial DNA (mtDNA) sequence analysis that revealed that northern ele- phant seals had <5% of the genomic variation that occurs in the southern el- ephant seals (17). The significance of genetic uniformity to the future potential of elephant seals, however, was not ob- vious because the species had recovered to some 120,000 seals since it was af- forded protection in 1922 by the govern- ments of the United States and Mexico (17). Ralls et al. (18, 19) demonstrated the severe cost of close inbreeding to wildlife biologists. Their analysis of breeding rec- ords of 24 captive wildlife species re- vealed that in every case but 1, infant mortality was greater when the parents were related. Their findings, which were reminiscent of the well-known examples of inbreeding depression in livestock and plants, alerted the wildlife conservation community to the dangers of close in- breeding in all species. Since these pioneering reports, molec- ular genetics has been combined with ecological, clinical, reproductive, behav- ioral, and microbial data to describe the natural history of other threatened spe- cies. Equipped with multi-disciplinary approaches, species conservation plans have been constructed with better knowl- edge of actual threats to survival. To illustrate the power of integrated biomed- ical and genetic technology, I will briefly summarize case studies of four "charis- matic" endangered species in which our group has been involved. They were cho- sen because their aesthetic popularity Abbreviations: MHC, major histocompatibil- ity complex; mtDNA, mitochondrial DNA; RFLP, restriction fragment length polymor- phism. 5748
Transcript
Proc. Nati. Acad. Sci. USAVol. 91, pp. 5748-5755, June 1994
Review
A role for molecular genetics in biological conservationStephen J. O'BrienLaboratoy of Viral Carcinogenesis, National Cancer Institute, Fredeorick Cancer Research and Development Center, Frederick, MD 21702-1201
ABSTRACT The recognition ofrecentaccelerated depletion of species as a con-sequence ofhuman industrial developmenthas spawned a wide interest in identifyingthreats to endangered species. In additionto ecological and demographic perils, ithas become clear that small populationsthat narrowly survive demographic con-traction may undergo close inbreeding,genetic drift, and loss of overall genomicvariation due to allelic loss or reduction tohomozygosity. I review here the conse-quences of such genetic depletion revealedby applying molecular population geneticanalysis to four endangered mammals:African cheetah, lion, Florida panther,and humpback whale. The accumulatedgenetic results, combined with physiolog-ical, ecological, and ethological data, pro-vide a multifaceted perspective of the pro-cess of species diminution. An emergingrole of population genetics, phylogenetics,and phylogeography as indicators of apopulation's natural history and its futureprognosis provides valuable data of use inthe development of conservation manage-ment plans for endangered species.
Biological conservation did not start outas a science or even a wide-spread publicconcern until we read authors like OsaJohnson [I Married Adventure (1)], JoyAdamson [Born Free (2)], and KarenBlixen [Out of Africa (3)], who chroni-cled the depletion of African wildlife, orheard Rachel Carson's prophetic warningin The Silent Spring (4). The eerie pros-pect that our descendants might be de-nied the benefits of wildlife diversity andbe destined to a world with but a handfulof domestic plants and animals drew at-tention to the gradual but deliberate con-sequences ofunrestricted human growth.The sad truth emerged that we are in themidst of the most rapid extinction eventsince the demise ofthe dinosaurs, and theprimary cause is human development.Today conservation is a broadly sup-ported goal of all peoples and the initia-tive to reverse the erosion ofbiodiversityinvolves many disciplines: politics, sci-ence, diplomacy, and economics, toname a few (5, 6). There is a role for eachof these in conservation and the newestarea involves biomedical and genetictechnologies. In full understanding of thecomplicity of technology in facilitatingthe "taming of the wild," it may offer
some small comfort that applications ofbiomedical and genetic technologiescould have a role in reversing extinctionprocesses or at least in developing man-agement plans to curtail the rate of spe-cies extinction.
In the past two decades, the methodsof molecular biology, clinical medicine,and reproductive physiology have beenused to describe in precise detail theprospective status of several endangeredspecies (7-9). The results obtained haveprovided important insight that criticallyaffected management decisions and pro-duced tangible benefits to the studiedspecies. In addition, conservation appli-cations have transformed population ge-netics from an academic discipline con-cerned with how flies, rodents, andplants handle natural selection to theforefront ofglobal management decisionsof critically endangered species. After ahalf century of exquisite theoretical andempirical development, the paradigms ofpopulation genetics are providing criticalguidance for interpreting the history, pre-sent status, and future prognosis forthreatened species. Further, evolution-ary strategies encoded in the genomicarchitecture of natural populations arebeing revealed in ways that have directbearing on human biology and offer pro-vocative solutions to medical diseasequestions as well.To understand the influence that mo-
lecular genetic analyses have exerted onconservation, it is necessary to under-stand what genetic surveys involve andmeasure. Molecular descriptions of thequality and quantity of genetic diversityin populations really began when Lew-ontin and Hubby (10) estimated the av-erage genomic heterozygosity in popula-tions of Drosophila pseudoobscura byusing 18 protein and allelic isozyme (al-lozyme) loci. Their study stimulated sim-ilar estimates in hundreds of species,each looking at up to 50 allozyme loci forgenetically controlled variation (11, 12).Most natural populations displayed 15-50%o of their allozyme loci as polymor-phic and the average heterozygosity wasbetween 2 and 15%. Much of the earlydiscussion ofthe variation dealt with howmuch random mutational variation a pop-ulation could tolerate (Muller's geneticload concept), and later on, whether thepatterns of variation supported an adap-
tive or a selectively neutral explanation(12-14).The conservation community took no-
tice of such studies when Bonnell andSelander (15) discovered that the endan-gered northern elephant seal displayedno variation in a survey of 24 allozymeloci. These authors interpreted their re-sults as a consequence of a previouslydocumented 18th century population bot-tleneck (due to hunting exploitation) fol-lowed by inbreeding (15-17). Their con-clusions have been confirmed more re-cently with an allozyme study plus amitochondrial DNA (mtDNA) sequenceanalysis that revealed that northern ele-phant seals had <5% of the genomicvariation that occurs in the southern el-ephant seals (17). The significance ofgenetic uniformity to the future potentialof elephant seals, however, was not ob-vious because the species had recoveredto some 120,000 seals since it was af-forded protection in 1922 by the govern-ments of the United States and Mexico(17).
Ralls et al. (18, 19) demonstrated thesevere cost of close inbreeding to wildlifebiologists. Their analysis ofbreeding rec-ords of 24 captive wildlife species re-vealed that in every case but 1, infantmortality was greater when the parentswere related. Their findings, which werereminiscent of the well-known examplesof inbreeding depression in livestock andplants, alerted the wildlife conservationcommunity to the dangers of close in-breeding in all species.
Since these pioneering reports, molec-ular genetics has been combined withecological, clinical, reproductive, behav-ioral, and microbial data to describe thenatural history of other threatened spe-cies. Equipped with multi-disciplinaryapproaches, species conservation planshave been constructed with better knowl-edge of actual threats to survival. Toillustrate the power of integrated biomed-ical and genetic technology, I will brieflysummarize case studies of four "charis-matic" endangered species in which ourgroup has been involved. They were cho-sen because their aesthetic popularity
Abbreviations: MHC, major histocompatibil-ity complex; mtDNA, mitochondrial DNA;RFLP, restriction fragment length polymor-phism.
5748
Proc. Natl. Acad. Sci. USA 91 (1994) 5749
prompted extensive life history studiesand thereby the potential to assimilateinformation across bioconservation dis-ciplines. As every biological species hasa different adaptive and evolutionary his-tory, each example provides a differentperspective with important lessons forconservation, for biotechnology, and forgenomic adaptation. Finally, the role ofmolecular genetic data in taxonomic is-sues related to endangered species pro-tection is discussed briefly.
The Cost of Inbreeding:African Cheetahs
Cheetahs are well known as the world'sfastest land animal, exquisitely adaptedfor high-speed chase on the Africanplains with elongated legs, semi-retractileclaws, an aerodynamic skull, and en-larged heart muscles and adrenals. Thespecies has fascinated mankind for thou-sands of years with numerous regal po-tentates (Egyptian pharaohs, the Moghulemperor Akbar, and Kubla Khan) train-ing the species for sport hunting. But aspopular as cheetahs became, they poseda special problem to their keepers. Theywould seldom procreate in captivity.
In 30 years of breeding attempts inNorth American and European zoos,only 415% of the matings were success-ful (20, 21). Further, the extent of infantmortality in cheetahs was rather high(>30%o) compared to other species wherecaptive zoo breeding was attempted (18-22). Despite modest improvements incheetah husbandry and behavioral man-agement, low fecundity and highjuvenilemortality (combined with a ban on chee-tah imports by the U.S. Endangered Spe-cies Act of 1972) resulted in a captivepopulation that was not self-sustaining asmortality outpaced birth increases amongcaptive animals (20-23).
In the early 1980s, the difficulties incaptive breeding of cheetahs prompted abiomedical approach to discover the rea-sons. Both captive and free-ranging Af-rican cheetahs were found to have rela-tively low sperm counts and an elevatedlevel of sperm developmental abnormal-ities in their ejaculates (""70%o comparedto "'30% in lions or domestic cats) (24,25). The spermatazoal defects providedour first hint that there was a physiolog-ical explanation for reproductive difficul-ties.
In addition, several measures of ge-nomic diversity (listed in Table 1) indi-cated that the two major subspecies ofcheetah (Acinonyx jubatus jubatus fromsouthern Africa and Acinonyx jubatusraineyi from eastern Africa) displayedmarkedly reduced levels of genetic vari-ation relative to other feline and mammalspecies (22, 26-30). The results ofeach ofthese approaches showed that the chee-tah had levels of variation comparable to
Table 1. Indexes of genomic variation that were reduced in cheetahsIndex Ref.
that of deliberately inbred strains of lab-oratory mice or livestock. These studieslent support to the hypothesis that thecheetah's ancestors had survived a his-toric period of extensive inbreeding (apopulation bottleneck), the modern con-sequences of which are 90-99% reduc-tion in measurable allelic variation and aremarkable collection ofcorrelative phys-iologic impairments (Table 2).The cheetah's difficulties did not stop
there. We knew from experience with in-bred mice and livestock that inbreedingcan contribute to an increased susceptibil-ity of a population to infectious viruses,bacteria, and other pathogens. The inter-pretation for this phenomenon involves anunderstanding of the evolution of immuneresponse. Several of the loci that mediateimmune defenses seem to depend on ex-tensive allelic variation within outbredpopulations as a "moving target" for rap-idly evolving pathogens. The idea is thatwhen a virus genetically changes (e.g., asdo influenza or human immunodeficiencyvirus 1) to overcome the immune defensesof a single individual, the adaptations will
not necessarily be as effective in anothergenetically distinct individual (32-36). Thisexplanation seems to be the driving forceforenormous genetic diversity at the mam-malian major histocompatibility complex(MHC), whose role is to recognize andpresent foreign virus peptides on infectedcellular surfaces to helper T lymphocytesas a prelude to cell-mediated immune de-struction of infected cells (36, 37). Thecheetah provided a vivid natural exampleof this scenario because the species wasgenetically monomorphic at theMHC (22).When a devastating outbreak of feline in-fectious peritonitis occurred at an Oregoncheetah breeding facility in the mid-1980s,it resulted in 100% morbidity (symptoms)and 60% mortality (22, 31), the worst re-corded for this incurable disease in any
feline species. In domestic cats, the mor-tality incidence of this virus is seldom>5%. The possibility that the cheetah pop-ulation's nearly homogeneous response tothe lethal peritonitis virus was related to itsgenetic homogeneity, particularly at theMHC (Table 1), was compelling.Although the evidence for a severe
population bottleneck (or series of bot-tlenecks) in the cheetah's recent historywas strong, the estimation of the time ofthe event was difficult. Population theorypredicts that reconstitution of genetic di-versity is slow, on the order of the recip-rocal of mutation rate (10-6-10-7 muta-tions per locus per gamete for allozymes,fibroblast proteins, orMHC loci) (38, 39);thus the near extinction could have oc-curred anytime from a few decades to amillion years ago. To address this ques-tion, we took advantage of two DNAclasses that evolve more rapidly, mtDNAand DNA fingerprints (28). These vari-ants accumulate mutations at a rate ofthree to four orders of magnitude morerapidly than nuclear coding genes. Mod-ern cheetahs display a modest amount ofvariation in both of these genomic fami-lies and the monophyletic similarity ofmodern DNA diversity led us to concludethat most of it was reconstituted by pointmutations after the proposed bottleneck.By back-calculation from the quantity ofdiversity in these gene families, we esti-mated that the most recent demographicreduction was on the order of 10,000years ago (lower Pleistocene), around the
time of the last Northern Hemisphereglaciation. This date coincides with themost dramatic extinction events of largemammals in the fossil record (40-42).Before this event the cheetah's ancestorshad a range that covered North America,Europe, Asia, and Africa and includedseveral different species (43, 44). Butwhen the large Pleistocene mammals
Table 2. Physiological measurements where cheetahs are limited compared toother felids
Measurement Ref(s).Diminished sperm count 24, 25Elevated frequency of morphological abnormalities
in sperm development ("70%o) 25Low fecundity in captive breeding attempts throughout history 20, 22Captive population is not self-sustaining 20, 21Relatively high incidence ofjuvenile mortality even among unrelated parents 22Increased population vulnerability to infectious
such as the giant ground sloth, mastodon,sabertoothed cats, and American lion,became extinct, the cheetah's rangechanged abruptly. It is likely the cheetahbarely escaped extinction, but not with-out a genomic vestige of its ancestry.The messages from the studies ofchee-
tah genetics were clear. (i) There werecertainly undiscovered perils that canthreaten populations that were not soapparent as traditional ecological param-eters (Tables 1 and 2). (ii) When popula-tions drop to very low numbers, as mostendangered species do, if they do notbecome extinct, they still could suffergenetic depletion when inbreeding isclose and persistent. (iii) Although everypopulation bottleneck is different, theyall carry the risk ofinbreeding depressionand the expression of congenital abnor-malities resulting from homozygosity ofdeleterious genes. (iv) In addition tothese heritable defects, inbreeding ho-mogenizes variation at abundantly poly-morphic genes that mediate immune re-sponse, increasing the population's riskof debilitating disease from pathogensthat overcome the immune defenses of asingle individual.
The Controlled Case of African andAsiatic Lions
The results from the cheetah caught theattention of the conservation communitythat did not have to look very far todiscover genetic secrets in other species.Craig Packer and Ann Pusey (53) havestudied behavioral ecology in a group oflion prides in the Serengeti ecosystem inTanzania since 1980, and the populationhad been under continuous field obser-vation since Schaller's seminal study inthe late 1960s (45). When Packer andPusey invited us to compare the geneticstructure of a lion population in theSerengeti to the adjacent population iso-lated in the Ngorongoro Crater, we won-dered if there might be genetic differ-ences that reflected their unique naturalhistories. The Serengeti Plains are thehome of a large outbred population of3000 lions in a territory the size of Con-necticut. Adjacent to the Serengeti is anextinct volcanic caldera, the NgorongoroCrater with mountainous barriers sur-rounding a rich assemblage of East Afri-can wildlife (46-49). The -100 lions inthe Crater are descended from a popula-tion bottleneck that occurred in 1962 dueto an epizootic of biting fly (Stomoxyscalcitrans) (46, 50). Only 10 lions sur-vived (1 male and 9 females) and theselions plus 7 immigrant males from theSerengeti led to the founding of the pres-
ent population (46). The Ngorongoro li-ons are an effective "island population"isolated from immigration (but not fromemigration) since 1968 by steep walls andbehavioral reinforcement. We also ob-
tained samples from a group of lionsoriginating from the Gir Forest Sanctuarylocated in the Gujarat Province of west-ern India. These Asian lions, which showseveral morphological distinctions fromtheir African counterparts, are a relictgroup of 250 individuals that also expe-rienced a severe population contraction(to <20 animals) in the first quarter of thiscentury due to hunting exploitation (47).
Genetic analysis of the three lion pop-ulations provided the natural equivalentofa case-controlled study for the effect ofgenetic depletion on reproductive param-eters (27, 47-49). The Serengeti lionslooked outbred with abundant moleculargenetic variation estimated with allo-zymes, MHC restriction fragment lengthpolymorphisms (RFLPs), and DNA fin-gerprinting (Table 3). The Gir lions wereas bad as or worse than cheetahs with<5% of the variation found in Serengetilions using all three genetic methods. Thelions in the Ngorongoro Crater fell inbetween the two other populations with-30%o ofthe variation seen in the outbredSerengeti population. Sperm abnormali-ties were remarkably correlated with ge-nomic variation as the Asiatic lions had ahigh frequency of pleiomorphic spermwhile the Serengeti lions did not (Table3). Further, relative to Serengeti malesthere was a 20-fold reduction in circulat-ing testosterone in Gir lion males and a 3-to 4-fold depletion in Ngorongoro males(51). Testosterone is known to play a keyrole in normal spermatogenesis in mam-mals and is a likely physiological expla-nation for the sperm development abnor-mality (as well as a reduced lion mane)seen in the Asiatic lions (47). The dra-matic correlation between overall geneticvariation, documented demographic his-tory, and indices of reproductive func-tion in free-ranging animals providedrather strong evidence for the cost ofinbreeding in lion populations.A surprising twist emerged when we
looked at the breeding success of theinbred Asian lions in captivity. An Asi-atic lion pedigree from the SakkarbaugZoo in India showed reproductive diffi-
culties particularly in male representa-tion (very few successfully bred), while aNorth American pedigree of Asiatic lions(Species Survival Plan of the AmericanZoo Association) actually was breedingvery prolifically even though it was de-rived from only five founder lions (47).The explanation came when it was dis-covered that two of the original NorthAmerican founders were genetically fromAfrican lion stock. The relative repro-ductive success of the North Americanpedigree was likely due to between-subspecies hybridization (hybrid vigor)discovered retrospectively with genetictechniques three generations later (47).Molecular genetic analysis of the
Serengeti lions also provided an oppor-tunity to test various hypotheses aboutthe adaptive value of pride behavior (52).Lions are the only cat that has a cooper-ative social organization based on thetemporally stable pride unit (45, 53). Lionprides consist of 1 to 18 adult females andsubadults plus a coalition of 1 to 7 adultmales that live in definable territories.Females raise young communally andresident male coalitions are replaced ev-ery few years by unattached male coali-tions that "take over" an existing pridegroup by social intimidation. Packer andPusey (53, 54) had noticed that the majordeterminant for pride "takeover" suc-cess was the size ofthe coalition (numberof males). Since male coalitions differwith respect to relatedness (some arebrothers and some are unrelated), theadaptive value of wandering males join-ing up with unrelated males who might becompetitors for mating with pride fe-males was puzzling (52).By developing feline-specific minisat-
ellite (DNA fingerprint) probes, DennisGilbert and his collaborators (49, 52)were able to identify parentage (bothmother and father) of 78 cubs born in 11prides over a 10-year period. The preciseidentification of familial relationshipamong 200 lions permitted us not only toassess mating success of males from dif-ferent coalitions but also to draw a cali-bration curve between DNA fingerprint
Table 3. Correlation of genetic variation and reproductive parameters in three lionpopulations
(x10-6) per ejaculate 228.5 ± 65.5 236.0 ± 93.0 45.3 ± 9.9Testosterone, ng/ml 1.3-1.7 0.5-0.6 0.1-0.3Refs. 27, 47-49, and 51 are sources. When indicated, data are the mean ± SEM.
5750 Review: O'Brien
Proc. Natl. Acad. Sci. USA 91 (1994) 5751
band-sharing and actual genetic related-ness. These results showed that largecoalitions (4-9 males) were always com-posed of first-order relatives (brother,father, and son), whereas smaller coali-tions (2 or 3 individuals) were unrelated"=50% of the time. In nearly all cases,however, paternity was restricted to twomales regardless of coalition size.Thus, the explanation now made sense
(52). Singleton or doubleton male groupswould join with an unrelated partner toincrease the chance of takeover butwould not reduce their chance of repro-duction appreciably since at least one ofthe brothers would likely father cubs.Larger brother coalitions would avoidaddition of nonrelatives because therewas no benefit in takeover success and alarge fraction of a nonbreeder's geneswere transmitted since their siblingswould father the cubs. The conclusionsderived from the DNA fingerprint studyin lions (49, 52) had important implica-tions for the evolution of cooperativebehavior and also demonstrated thepower of high-resolution DNA polymor-phism in approaching ecological ques-tions in natural populations. Our successin combining ethological and DNA-fingerprint technology in the Serengetilion study lent confidence to this appli-cation for assessing paternity and kinshipin natural settings despite persuasive the-oretical arguments questioning the feasi-bility of such an approach (55, 56).
The Florida Panther: An Extreme Case
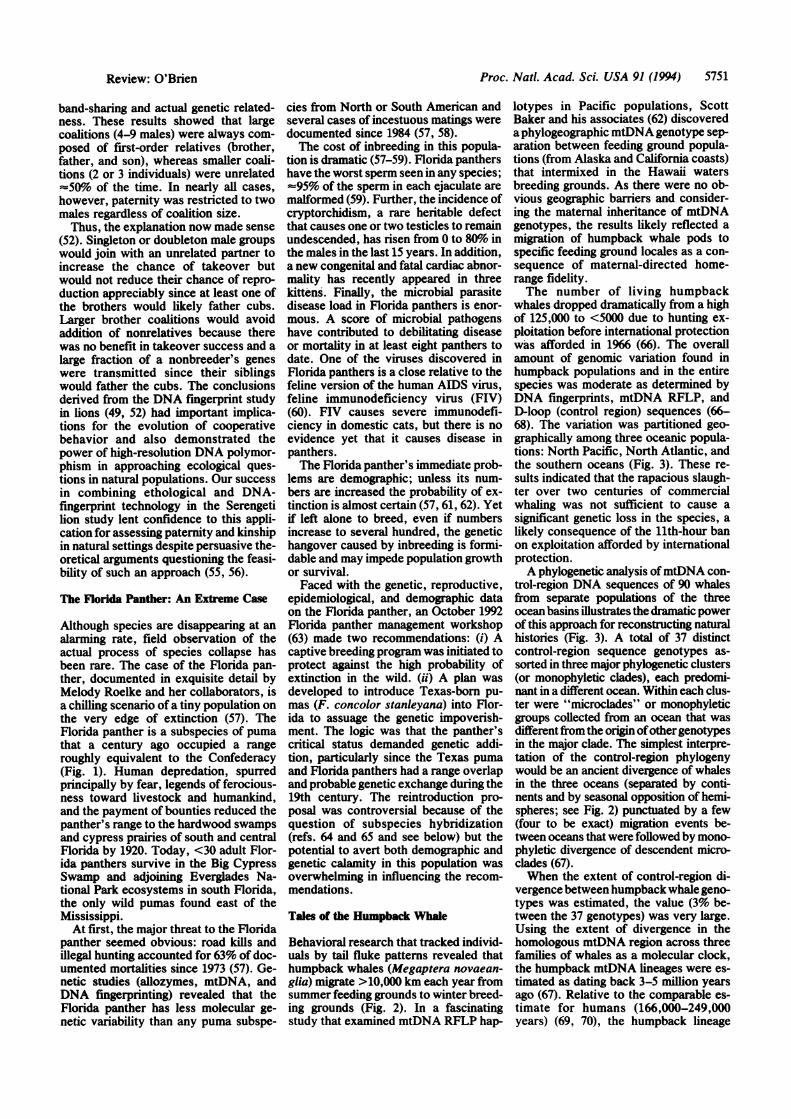
Although species are disappearing at analarming rate, field observation of theactual process of species collapse hasbeen rare. The case of the Florida pan-ther, documented in exquisite detail byMelody Roelke and her collaborators, isa chilling scenario ofa tiny population onthe very edge of extinction (57). TheFlorida panther is a subspecies of pumathat a century ago occupied a rangeroughly equivalent to the Confederacy(Fig. 1). Human depredation, spurredprincipally by fear, legends of ferocious-ness toward livestock and humankind,and the payment of bounties reduced thepanther's range to the hardwood swampsand cypress prairies of south and centralFlorida by 1920. Today, <30 adult Flor-ida panthers survive in the Big CypressSwamp and adjoining Everglades Na-tional Park ecosystems in south Florida,the only wild pumas found east of theMississippi.At first, the major threat to the Florida
panther seemed obvious: road kills andillegal hunting accounted for 63% of doc-umented mortalities since 1973 (57). Ge-netic studies (allozymes, mtDNA, andDNA fingerprinting) revealed that theFlorida panther has less molecular ge-netic variability than any puma subspe-
cies from North or South American andseveral cases of incestuous matings weredocumented since 1984 (57, 58).The cost of inbreeding in this popula-
tion is dramatic (57-59). Florida panthershave the worst sperm seen in any species;-95% of the sperm in each ejaculate aremalformed (59). Further, the incidence ofcryptorchidism, a rare heritable defectthat causes one or two testicles to remainundescended, has risen from 0 to 80o inthe males in the last 15 years. In addition,a new congenital and fatal cardiac abnor-mality has recently appeared in threekittens. Finally, the microbial parasitedisease load in Florida panthers is enor-mous. A score of microbial pathogenshave contributed to debilitating diseaseor mortality in at least eight panthers todate. One of the viruses discovered inFlorida panthers is a close relative to thefeline version of the human AIDS virus,feline immunodeficiency virus (FIV)(60). FIV causes severe immunodefi-ciency in domestic cats, but there is noevidence yet that it causes disease inpanthers.The Florida panther's immediate prob-
lems are demographic; unless its num-bers are increased the probability of ex-tinction is almost certain (57, 61, 62). Yetif left alone to breed, even if numbersincrease to several hundred, the genetichangover caused by inbreeding is formi-dable and may impede population growthor survival.Faced with the genetic, reproductive,
epidemiological, and demographic dataon the Florida panther, an October 1992Florida panther management workshop(63) made two recommendations: (i) Acaptive breeding program was initiated toprotect against the high probability ofextinction in the wild. (ii) A plan wasdeveloped to introduce Texas-born pu-mas (F. concolor stanleyana) into Flor-ida to assuage the genetic impoverish-ment. The logic was that the panther'scritical status demanded genetic addi-tion, particularly since the Texas pumaand Florida panthers had a range overlapand probable genetic exchange during the19th century. The reintroduction pro-posal was controversial because of thequestion of subspecies hybridization(refs. 64 and 65 and see below) but thepotential to avert both demographic andgenetic calamity in this population wasoverwhelming in influencing the recom-mendations.
Tales of the Humpback Whale
Behavioral research that tracked individ-uals by tail fluke patterns revealed thathumpback whales (Megaptera novaean-glia) migrate >10,000 km each year fromsummer feeding grounds to winter breed-ing grounds (Fig. 2). In a fascinatingstudy that examined mtDNA RFLP hap-
lotypes in Pacific populations, ScottBaker and his associates (62) discovereda phylogeographic mtDNA genotype sep-aration between feeding ground popula-tions (from Alaska and California coasts)that intermixed in the Hawaii watersbreeding grounds. As there were no ob-vious geographic barriers and consider-ing the maternal inheritance of mtDNAgenotypes, the results likely reflected amigration of humpback whale pods tospecific feeding ground locales as a con-sequence of maternal-directed home-range fidelity.The number of living humpback
whales dropped dramatically from a highof 125,000 to <5000 due to hunting ex-ploitation before international protectionwas afforded in 1966 (66). The overallamount of genomic variation found inhumpback populations and in the entirespecies was moderate as determined byDNA fingerprints, mtDNA RFLP, andD-loop (control region) sequences (66-68). The variation was partitioned geo-graphically among three oceanic popula-tions: North Pacific, North Atlantic, andthe southern oceans (Fig. 3). These re-sults indicated that the rapacious slaugh-ter over two centuries of commercialwhaling was not sufficient to cause asignificant genetic loss in the species, alikely consequence of the 11th-hour banon exploitation afforded by internationalprotection.A phylogenetic analysis ofmtDNA con-
trol-region DNA sequences of 90 whalesfrom separate populations of the threeocean basins illustrates the dramatic powerof this approach for reconstructing naturalhistories (Fig. 3). A total of 37 distinctcontrol-region sequence genotypes as-sorted in three major phylogenetic clusters(or monophyletic clades), each predomi-nant in a different ocean. Within each clus-ter were "microclades" or monophyleticgroups collected from an ocean that wasdifferent from the origin ofothergenotypesin the major lade. The simplest interpre-tation of the control-region phylogenywould be an ancient divergence of whalesin the three oceans (separated by conti-nents and by seasonal opposition of hemi-spheres; see Fig. 2) punctuated by a few(four to be exact) migration events be-tween oceans that were followed by mono-phyletic divergence of descendent micro-clades (67).When the extent of control-region di-
vergence between humpback whale geno-types was estimated, the value (3% be-tween the 37 genotypes) was very large.Using the extent of divergence in thehomologous mtDNA region across threefamilies of whales as a molecular clock,the humpback mtDNA lineages were es-timated as dating back 3-5 million yearsago (67). Relative to the comparable es-timate for humans (166,000-249,000years) (69, 70), the humpback lineage
FIG. 1. Distribution ofFelis concolor subspecies, including the historic and present (Inset) ranges ofFelis concolor coryi (43, 57). Solid circlesindicate the locales of specimens collected for genetic analysis; letters inside the circles represent the mtDNA RFLP haplotypes defined byrestriction enzyme typing of 109 restriction sites (58). Haplotypes A, C, and D differ from each other by one or two restriction sites.
seems very ancient. Thus the humpbackwhale data offer some encouragement tothe conservation managers of this spe-cies. If protection continues, recoveryshould occur, although the slow rate ofincrease for this species would requireprotection for hundreds of years. Fur-ther, the extremely ancient origin ofmtDNA diversity is a signal that the
species has not undergone a populationbottleneck (with founder effect, inbreed-ing, and genetic depletion) for severalmillion years. If we presume that accu-mulation of lethal equivalents in themammalian genome is a time-dependentprocess (71, 72), then the humpbacksprobably have a large dose of such agenetic load simply as a consequence of
so long a period since the last genetichomogenization.
Taonay d En ed Spees
Taxonomy, the systematic classificationofplants and animals, had little relevanceoutside ofacademic institutions in the mid-1970s. Before then species and subspecies
South Florida
5752 Review: O'Brien
Proc. Natl. Acad. Sci. USA 91 (1994) 5753
FIG. 2. Migratory destinations and population structure ofhumpback whales in the North Pacific and western North Atlantic oceans, basedon observations ofmarked individuals (66-68). Regions encircled by a broken line are defined by historical patterns ofdistribution during periodsof commercial whaling. Arrows connect seasonal habitats visited by individually identified whales but do not necessarily indicate migratoryroutes.
were identified, described, and named onthe basis of a few specimens collected onexpeditions that celebrated the tradition ofDarwin's voyage on the Beagle. Specieswere grouped according to morphologicaltype specimens into genera, genera intofamilies, families into orders, and so on.Systematic uncertainties had little rele-vance to everyday life and the methods oftaxonomic resolution were limited. Whenthe taxonomic distinctions became the ba-sis for legal protection afforded by theEndangered Species Act of 1973 (73), thisinnocence was lost forever. Disagreementsover taxonomic status fueled legal assaultson the Act and misclassifications led toinappropriate conservation resulting inlosses of some species (9, 74-78). Eventoday with vastly improved molecularmethods for discriminating between taxo-nomic groups, there remains considerableconfusion about units of conservation thatthe Endangered Species Act was designedto protect (75, 79, 80).
Formalized taxonomy is critical toconservation because it provides the ba-sis for recognition (and therefore protec-tion) of endangered species. The U.S.Endangered Species Act (73) extends le-gal protection to three categories of taxa:species, subspecies, and certain verte-brate populations. To date there are 681U.S. plant and animal species and 528foreign species listed as endangered;some 3500 candidates await classifica-tion. Unfortunately, many of the classi-fication schemes are based on inadequatetype descriptions of a few morphologicalspecimens (skins or skeletons) collectedby 19th century naturalists (e.g., Fig. 1 orsubspecies in ref. 43). Although mostobservers agree that there exists a sys-tematic hierarchy based on evolutionary
time and adaptive radiation in taxonemergence, there is little agreement onthe specifics.Taxonomic imprecision has contrib-
uted to errors both over "splitting" ofgenetically indistinguishable groups(e.g., Dusky seaside sparrow, leopards,and pumas) and over "lumping" of sig-nificantly divergent taxa (e.g., the threespecies of tauratora) (9, 77, 78, 81, 82).Because phylogenetic distinction is oftenconsidered in ranking species recoveryplans and in allocating resources, precisetaxonomic hierarchies become critical(83).Another area that has led to confusion
and to legal assaults on protection in-volves the question of in situ hybridiza-tion ofendangered species or subspecies.Historically, the U.S. Fish and WildlifeService had interpreted that "hybrids"between taxa listed by the EndangeredSpecies Act would not be eligible forprotection, largely to concentrate re-sponses on "pure" endangered species.So when molecular genetics revealed anatural hybridization involving the Flor-ida panther (58), or geographically re-stricted hybrids between wolves and coy-otes (84, 85), litigious challenges to theirprotection were based on the precedentof the so-called "hybrid policy" to pre-clude protection (64). Fortunately, thehybrid policy was suspended when ErnstMayr and I argued that these sorts ofhybrid events were natural outcomes ofevolution and that the species should notbe penalized due to bureaucratic prece-dent that did not consider the resolvingpower of molecular genetics (see ref. 64).The new molecular technologies offerconsiderable precision to identify andcategorize species, subspecies, and pop-
ulation level differentiation. As they areapplied to threatened populations, com-bining genetics, phylogeny, and geogra-phy, the data required to classify thesegroups based on their own genetic andevolutionary history will be collected.
Conclusions
The last decade has seen the beginning ofa field that applies the principles andmethods of population genetics to speciesconservation. As for other areas of mo-lecular biotechnology, conservation ge-netics is an applied science with the im-portant goal of describing explicitly thecomposite genomes of small endangeredpopulations. By comparison to betterstudied examples such as those reviewedhere, one can make realistic approxima-tions ofthe recent natural history, presentstatus, and future prognosis of endan-gered populations. When combined withdata from other disciplines (e.g., repro-duction, infectious disease, and field ecol-ogy), the synthesis offers some valuableinsight that can be applied directly tospecies management plans.On the surface genetic surveys of nat-
ural populations appear to offer a limitedview: namely, (i) the quantity of overallgenomic variation, (ii) evidence for ge-netic differentiation between taxa, and(iii) phylogenetic relationships betweengeographically isolated populations.However, I have attempted to illustratethat the interpretation of these resultswith other disciplinary data can advanceour understanding appreciably andthereby limit the guesswork associatedwith conservation management deci-sions. Finally, the methods of genetictechnology are being improved continu-
ReDV-view: O'Brien
Proc. Natl. Acad. Sci. USA 91 (1994)
OceansNP SO NA
--6 3
431111111112
12
1
1151
too late to put the experience of each ofthe disciplines, including molecular ge-netics, to task in many conservation ini-tiatives.
I am grateful to the graduate students, post-doctoral fellow, colleagues, and collaboratorswho have contributed to the studies reviewedhere. In addition, I thank J. S. Martenson, M.Culver, M. Menotti-Raymond, T. Laughlin,W. Johnson, and M. Clegg for critical reviewof early versions of this paper.
1121111
1113
3
1451122
31 25 34-1I I I I
Sequence difference, %0
FIG. 3. Phylogenetic relationship between 37 unique mtDNA control-region sequencesfrom 90 humpback whales from the North Pacific (NP), North Atlantic (NA), and southernoceans (SO) (modified from ref. 67). The tree was constructed by the neighbor-joining method(67) and rooted with the homologous sequence of the fin whale. To the right of thephylogenetic tree is the number of each humpback whale mtDNA genotype collected in thethree oceans. Percentages represent the fraction of bootstrap iterations (out of 200) thatsupport the inclusion ofthe descendent mtDNA genotypes commented by the node. Labeledarrows (NP, NA, and SO) indicate the common ancestors of the mtDNA genotypes foundin the three oceans. Other arrows represent hypothesized points of migrations; boxed"microclades" represent monophyletic descendants of the ancestral migrant within theocean region that received the migrating ancestor (67) (see text).
ally. DNA sequence analysis is now rou-tine. DNA polymorphisms are detectedas easily as allozymes were 20 years ago,and powerful computer algorithms foranalysis of complex phylogenetic andpopulation data sets make analyses more
statistically robust. The potential to ap-proach conservation questions rigor-ously can now be realized and applica-tions offindings are now agenda items forspecies conservation plans world-wide. Ipersonally hope (and believe) that it is not
1. Johnson, 0. (1940) I MarriedAdventure:The Lives and Adventures ofMartin andOsa Johnson (Lippincott, New York).
2. Adamson, J. (1987) Born Free:A Lionessof Two Worlds (Pantheon, New York).
3. Blixen, K. (1937) Out ofAfrica (Century,London).
4. Carson, R. L. (1987) Silent Spring(Houghton Mifflin, Boston).
5. Wilson, E. 0. & Peter, F. M., eds.(1988) Biodiversity (Natl. Acad. Press,Washington, DC).
6. Soul6, M. (1986) Conservation Biology(Sinauer, Sunderland, MA).
7. Schonewald-Cox, C. M., Chambers,S. M., Mac Bryde, B. & Thomas, L.(1993) Genetics and Conservation: AReference for Managing Wild Animaland Plant Populations (Benjamin/Cum-mings, Menlo Park, CA).
8. Avise, J. (1993) Molecular Markers(Chapman & Hall, New York).
9. Avise, J. (1989) Trends Ecol. Evol. 4,279-281.
10. Lewontin, R. C. & Hubby, J. L. (1966)Genetics 54, 595-609.
11. Nevo, E., Beiles, A. & Ben-Shlomo, R.(1984) in Evolutionary Dynamics of Ge-netic Diversity, ed. Mani, G. S. (Spring-er, New York), pp. 13-213.
12. Lewontin, R. C. (1974) The Genetic Ba-sis of Evolutionary Change (ColumbiaUniv. Press, New York).
13. Gillespie, J. H. (1991) The Causes ofMolecular Evolution (Oxford Univ.Press, New York).
14. Kimura, M. (1983) The Neutral Theory ofMolecular Evolution (Cambridge Univ.Press, Cambridge, U.K.).
15. Bonnell, M. L. & Selander, R. K. (1974)Science 134, 908-909.
16. Le Boeuf, B. J. (1974) Am. Zool. 14,163-176.
17. Hoelzel, A. R., Halley, J., O'Brien,S. J., Campagna, C., Arnbom, T., LeBoeuf, B., Rails, K. & Dover, G. A.(1994) J. Hered. 84, 443-449.
18. Rails, K., Brugger, K. & Ballou, J. (1979)Science 206, 1101-1103.
19. Rails, K. & Ballou, J. (1983) in Geneticsand Conservation, eds. Schonewald-Cox, C. M., Chambers, S. M., Mac-Bryde, B. & Thomas L. (Benjamin/Cummings, Menlo Park, CA), pp. 164-184.
20. Marker, L. & O'Brien, S. J. (1989) Zoo.Biol. 8, 3-16.
21. Marker-Kraus, L. & Grisham, J. (1993)Zoo. Biol. 12, 5-18.
22. O'Brien, S. J., Roelke, M. E., Marker,L., Newman, A., Winkler, C. A., Melt-zer, D., Colly, L., Evermann, J. F.,Bush, M. & Wildt, D. E. (1985) Science227, 1428-1434.
NP
I_69..
5754 Review: O'Brien
Proc. NatL. Acad. Sci. USA 91 (1994) 5755
23. Lindburg, D. G., Durrant, B. S., Mill-ard, S. E. & Oosterhuis, J. E. (1993)Zoo. Biol. 12, 97-104.
24. Wildt, D. E., Bush, M., Howard, J. G.,O'Brien, S. J., Meltzer, D., van Dyk, A.,Ebedes, H. & Brand, D. J. (1983) Biol.Reprod. 29, 1019-1025.
25. Wildt, D. E., O'Brien, S. J., Howard,J. G., Caro, T. M., Roelke, M. E.,Brown, J. L. & Bush, M. (1987) Biol.Reprod. 36, 351-360.
26. O'Brien, S. J., Wildt, D. E., Goldman,D., Merril, C. R. & Bush, M. (1983)Science 221, 459-462.
27. Yuhki, N. & O'Brien, S. J. (1990) Proc.Natl. Acad. Sci. USA 87, 836-840.
28. Menotti-Raymond, M. & O'Brien, S. J.(1993) Proc. Nadl. Acad. Sci. USA 90,3172-3176.
29. Wayne, R. K., Modi, W. S. & O'Brien,S. J. (1986) Evolution 40, 78-85.
30. Newman, A., Bush, M., Wildt, D. E.,van Dam, D., Frankehuis, M., Simmons,L., Phillips, L. & O'Brien, S. J. (1985) J.Mammal. 66, 256-267.
31. Heeney, J. L., Evermann, J. F., McKeir-nan, A. J., Marker-Kraus, L., Roelke,M. E., Bush, M., Wildt, D. E., Meltzer,D. G., Colly, L., Lucas, J., Manton,V. J., Caro, T. & O'Brien, S. J. (1990) J.Virol. 64, 194-1972.
32. Sorensen, T. I. A., Nielsen, G. G., An-dersen, K. & Teasdale, T. W. (1988) N.Engl. J. Med. 318, 727-732.
33. Black, F. (1992) Science 258, 1739-1740.34. O'Brien, S. J. & Evermann, J. F. (1988)
Trends Ecol. Evol. 3, 254-259.35. Schrier, P. I., Bernards, R., Vaessen,
R. T. M. J., Houweling, A. & van derEb, A. J. (1983) Nature (London) 305,771-775.
36. Klein, J. (1986) Natural History of theMajor Histocompatibility Complex (Wi-ley, New York).
37. Mak, T. W., ed. (1988) The T-Cell Re-ceptors (Plenum, New York).
38. Nei, M. (1987) Molecular EvolutionaryGenetics (Columbia Univ. Press, NewYork).
39. Nei, M. & Chakraborty, R. (1973) J.Mol. Evol. 2, 323-328.
40. Marshall, L. G., Webb, S.D., Sep-kowski, J. J., Jr., & Raup, D. M. (1982)Science 215, 1351-1357.
41. Martin, P. S. & Wright, H. E. (1967)Pleistocene Extinctions: The Search fora Cause (Yale Univ. Press, New Haven,CT).
42. Martin, L. D. (1989) in Carnivore Behav-ior, Ecology and Evolution, ed. Gittle-man, J. L. (Cornell Univ. Press, Ithaca,NY), pp. 536-568.
43. Neff, N. (1983) The Big Cats: The PaintsofGuy Coheleach (Abrams, New York).
44. Savage, D. E. & Russell, D. E. (1983)Mammalian Paleofaunas of the World(Addison-Wesley, London).
45. Schafler, G. B. (1972) The SerengetiLion (Univ. Chicago Press, Chicago).
46. Packer, C., Pusey, A. E., Rowley, H.,Gilbert, D. A., Martenson, J. S. &O'Brien, S. J. (1991) Conserv. Biol. 5,219-230.
47. O'Brien, S. J., Joslin, P., Smith, G. L.,III, Wolfe, R., Schaffer, N., Heath, E.,Ott-Joslin, J., Rawal, P. P., Bhattacher-jee, K. K. & Martenson, J. S. (1987)Zoo. Biol. 6, 99-116.
48. O'Brien, S. J., Martenson, J. S., Packer,C., Herbst, L., de Vos, V., Joslin, P.,Ott-Joslin, J., Wildt, D. E. & Bush, M.(1987) Natl. Geogr. Res. 3, 114-124.
49. Gilbert, D. A., Packer, C., Pusey, A. E.,Stephens,J. C. & O'Brien, S. J. (1991)J.Hered. 82, 378-386.
50. Fosbrooke, H. (1972) East Afr. Wildl. J.1, 124-126.
51. Wildt, D. E., Bush, M., Goodrowe,K. L., Packer, C., Pusey, A. E., Brown,J. L., Joslin, P. & O'Brien, S. J. (1987)Nature (London) 329, 328-331.
52. Packer, C., Gilbert, D. A., Pusey, A. E.& O'Brien, S. J. (1991) Nature (London)351, 562-565.
53. Packer, C., Herbst, L. & Pusey, A. E.(1988) in Reproductive Success, ed. Clut-ton-Brock, T. H. (Univ. Chicago Press,Chicago), pp. 363-383.
54. Bygott, J. D., Bertram, B. C. R. &Hanby, J. P. (1979) Nature (London)282, 839-841.
55. Lynch, M. (1988) Mol. Biol. Evol. 5,584-599.
56. Lewin, R. (1989) Science 243, 1549-1551.
57. Roelke, M. E., Martenson, J. S. &O'Brien, S. J. (1993) Curr. Biol. 3, 340-350.
58. O'Brien, S. J., Roelke, M. E., Yuhki,N., Richards, K. W., Johnson, W. E.,Franklin, W. L., Anderson, A. E., Bass,0. L., Jr., Belden, R. C. & Martenson,J. S. (1990) Natl. Geogr. Res. 6, 485-494.
59. Barone, M. A., Roelke, M. E., Howard,J. G., Brown, J. L., Anderson, A. E. &Wildt, D. E. (1994) J. Mammal. 75, 150-162.
60. Oldmsted, R. A., Langley, R., Roelke,M. E., Goeken, R. M., Adger-Johnson,D., Goff, J. P., Albert, J. P., Packer, C.,Laurenson, M. K., Caro, T. M.,Scheepers, L., Wildt, D. E., Bush, M.,Martenson, J. S. & O'Brien, S. J. (1992)J. Virol. 66, 6008-6018.
61. Lande, R. (1988) Science 241, 1455-1460.
62. Seal, U. S. & Lacy, R. (1989) FloridaPanther Population Viability Analysis,Report to the U.S. Fish and WildlifeService (Captive Breeding SpecialistGroup, Species Survival Commission,Int. Union for the Conservation of Na-ture, Apple Valley, MN).
63. Seal, U. S., ed. (1992) Genetic Manage-ment for the Florida Panther (CaptiveBreeding Specialist Group, Species Sur-vival Commission/Int. Union for theConservation of Nature, Minneapolis).
64. O'Brien, S. J. & Mayr, E. (1991) Science251, 1187-1188.
65. Avise, J. C. & Ball, R. M. (1990) Oxf.Surv. Evol. Biol. 7, 45-67.
66. Baker, C. S., Palumbi, S. R., Lambert-sen, R. H., Weinrich, M. T., Calambok-idis, J. & O'Brien, S. J. (1990) Nature(London) 344, 238-240.
67. Baker, C. S., Perry, A., Bannister, J. L.,Weinrich, M. T., Abernethy, R. B., Ca-lambokidis, J., Lien, J., Lambertsen,R. H., Urban Ramirez, J., Vasquez, O.,Clapham, P. J., Alling, A., O'Brien,S. J. & Palumbi, S. R. (1993) Proc. Natd.Acad. Sci. USA 90, 8239-8243.
68. Baker, C. S., Gilbert, D. A., Weinrich,M. T., Lambertsen, R., Calmabokidis,J., McArdle, B., Chambers, G. K. &O'Brien, S. J. (1993) J. Hered. 84, 281-290.
69. Cann, R. L., Stoneking, M. & Wilson,A. C. (1987) Nature (London) 325, 31-36.
70. Vigilant, L., Pennington, R., Harpend-ing, H., Kocher, T. D. & Wilson, A. C.(1989) Proc. Natl. Acad. Sci. USA 86,9350-9354.
71. Ralls, K., Ballou, J. D. & Templeton, A.(1988) Conserv. Biol. 2, 185-193.
72. Wallace, B. (1991) Fofty Years ofGeneticLoad (Cornell Univ. Press, Ithaca, NY).
73. U.S. Fish and Wildlife Service (1973)U.S. Endangered Species Act, FWS-F-037 (GPO, Washington, DC).
74. Geist, V. (1992) Nature (London) 28,274-276.
75. O'Brien, S. J. & Mayr, E. (1991) Science251, 1187-1188.
76. Losos, E. (1993) Trends Ecol. Evol. 8,332-336.
77. Daugherty, C. H., Cree, A., Hay, J. M.& Thompson, M. B. (1990) Nature (Lon-don) 347, 177-179.
78. May, R. M. (1990) Nature (London) 347,129-130.
79. Pimm, S. L. & Gittleman, J. L. (1992)Science 255, 940.
80. Gibbons, A. (1992) Science 256, 1386.81. Avise, J. C. & Neslon, W. S. (1989) Sci-
ence 243, 646-648.82. Miththapala, S. (1992) Dissertation
(Univ. of Florida, Gainesville).83. May, R. M. (1990) Philos. Trans. R. Soc.
London B 3M, 293-304.84. Lehman, N., Eisenhawer, A., Hansen,
K., Mech, L. D., Peterson, R. O.,Gogan, P. J. P. & Wayne, R. K. (1991)Evolution 45, 104-119.
85. Wayne, R. K. & Jenks, S. M. (1991)Nature (London) 351, 565-568.