Australian Competition and Consumer Commission Review of ARTC Operations and Maintenance Costs and Cost Allocation Method April 2008 Liability limited by a scheme approved under Professional Standards Legislation
Transcript
Australian Competition and Consumer Commission
Review of ARTC Operations and Maintenance Costs and Cost Allocation Method April 2008
Liability limited by a scheme approved under Professional Standards Legislation
Disclaimer
This discussion paper has been prepared by PricewaterhouseCoopers (PwC) for the sole use of the Australian Competition and Consumer Commission (ACCC). Its aim is to assist in the drafting of ACCC’s determination regarding Australian Rail Track Corporation’s (ARTC) Access Undertaking. It is prepared for no other purpose. This paper represents indicative advice only, and is not an audit. This document is not intended to be utilised or relied upon by any persons other than ACCC, nor to be used for any purpose other than that articulated above. Accordingly, PwC accept no responsibility in any way whatsoever for the use of this report by any other persons or for any other purpose. This report has been prepared based upon data obtained from and discussions with personnel from ACCC and ARTC, and from other publicly available data from sources external to ACCC and ARTC. PwC have not sought any independent confirmation of the reliability, accuracy or completeness of this information. It should not be construed that PwC has carried out any form of audit of the financial and other information which has been relied upon, nor that the suggested method would be necessarily acceptable to external bodies or robust to legal challenge. Accordingly, whilst the statements made and the method in this report are given in good faith, PwC accept no responsibility for any errors in the information provided by ARTC or other parties in submissions to the ACCC nor the effect of any such errors on our analysis, suggestions or report. Contact Details: For further information on this report contact: Scott Lennon Partner – PricewaterhouseCoopers Ph: 02 8266 2765 Email: scott.lennon@au pwc.com
Appendix B ARTC response to avoidability factors 48
Appendix C Summary of Terms of Reference 54 Some sections of the report contain information that may be commercially sensitive to ARTC. These sections have been ‘blacked-out’ by the ACCC.
Executive Summary
Scope
PricewaterhouseCoopers (PwC) has been engaged by the Australian Competition and Consumer Commission (ACCC) to independently assess the Australian Rail Track Corporation’s (ARTC) operating and maintenance expenditure program and the cost allocation method used by the ARTC. The 2007 Undertaking comprises of the interstate mainline standard gauge track linking Kalgoorlie (WA); Adelaide, Wolseley and Crystal Brook (SA); Melbourne and Wodonga (Victoria); and Broken Hill, Cootamundra, Albury, Macarthur, Moss Vale, Unanderra, Newcastle (to the Queensland border).
The ARTC has provided ACCC with a financial model which includes its operating and maintenance costs for 2006/07 and the 10 years of the proposed Access Undertaking (the Undertaking) to 2011/12. PwC has analysed this model to assess the allocation of costs, the value and escalation of the operating and maintenance costs over the period of the Undertaking.
Table 1.1 Agreed scope of works
Category Task
Cost allocation method
Identify the key differences between the cost allocation method used in 2002 and the method used in the proposed 2007 Undertaking.
Describe the approach to cost allocation for the 2007 Undertaking, including a description on how these costs are allocated between the interstate and Hunter Valley/NSW rail networks.
Assess the reasonableness of this approach.
Operating and Maintenance Costs
Analyse operating and maintenance costs against the 2002 Undertaking and applicable reference points.
Assess the reasonableness of the operating and maintenance expenditure.
Revenue limits and indicative charges.
Explain ARTC’s approach to revenue limits and indicative charges.
Cost allocations
The ARTC has developed a cost allocation process which is consistent with the characteristics of reasonable cost allocation methodologies, given:
− The cost drivers commonly evident in rail networks, namely GTK and Train km;
− The use of location drivers, for example the use of the LOREN drivers; and
− The separation of rail segments on the basis of their physical location.
Executive Summary 3
In terms of other cost allocation processes seen in other network business through Australia, including the telecommunications and energy industries, the cost allocation process exhibits similar features. In our experience, the cost allocation process employed by the ARTC is more sophisticated than other rail networks within Australia. This reflects the increased complexity of the ARTC’s rail network compared with other networks, which is driven primarily by the sheer size of its operations in conjunction with the complexity of leasing arrangements in NSW versus the remainder of the network. In addition, the cost allocation employed is more sophisticated than the relatively high level approach adopted in the 2002 decision.
In considering the reasonableness of the cost allocation process we have considered the following:
− The cost allocation process employed by the ARTC is consistent with the principles of good allocation processes;
− The sophistication of the cost allocation is consistent with the complexity of the business; and
− The cost allocation process does not over allocate the total number of costs across the various rail segments.
These factors provide comfort that the cost allocation process is not unreasonable. However, this is not to say that there are not other allocation processes which could provide a better or more appropriate answer to the question of allocating costs between rail segments and ultimately customers. Given the existence of no universal truth regarding cost allocations, we note that the current approach provides a degree of robustness which we consider is not unreasonable.
Maintenance costs PwC has analysed a number of reference points in considering the reasonableness of the maintenance costs provided by the ARTC. Overall, the consideration of the reasonableness of costs is dependent on a number of subjective judgements, however, we are comfortable that the costs brought forward by the ARTC are not unreasonable due to the following data points:
− ARTC have forecast total maintenance costs to increase over the period of the undertaking by as much as 36.5 per cent;
− This is expected to translate to an average reduction of approximately 25.9 per cent;
− In terms of reference points against various regulatory decisions ARTC’s costs are expected to fall approximately in the middle of the reference point range allowed in other jurisdictions for similar rail segments;
− The competitive tendering of contracts throughout the network outside of NSW provides a degree of market testing which helps to ensure not unreasonable outcomes; and
Executive Summary 4
− ARTC’s independent consultant has established a set of benchmarks which when compared to the ARTC’s costs are favourable.
Operating costs
The cost increases between the initial access period and this second regulatory period suggests that the integration of the NSW network has lead to diseconomies of scale. However, this ignores the growing maturity of the ARTC business both in terms of increased complexity of the business and the changes in the ARTC management systems which provide better information than what was available for the first regulatory period. PwC considers that the average costs of the ARTC’s are not unreasonable in the context of external reference points. However, at the same time the NSW costs are still considerable higher than what would otherwise be if the ARTC had been able to extract the full extent of cost savings from the NSW network. Forecast costs Our analysis of the reasonableness of ARTC’s costs and its subsequent forecasts has been based on a number of external reference points and a consideration of the escalation factors used. Table E.1 sets out the average costs across the two distinct segments of the network and the reference points considered.
Table E.1 Benchmark of maintenance and operating costs (track km basis)
On a track basis Non NSW network NSW network Total Maintenance costs $14,500 $17,956 $16,340 Reference point range $8,000 to $19,000 Operating costs $6,828 $21,120 $14,440 Reference point range $13,932
Note: Maintenance and operating costs are average over the period, all figures are in 2006/07 dollars
The maintenance costs for the network is approximately $16,340 on a track basis, which is at the high end of the regulatory reference point range established above. Further, while the operating costs are above the reference point established by the Forrestfield Kalgoorlie line by approximately 3.6 per cent, the NSW network operating costs are actually lower than this reference point. Ideally a multitude of operating cost reference points would have been available, however, given the relative lack of availability in terms of operating costs we have only been able to use one comparator. The concerning feature of table E.1 continues to be the relatively higher cost of operating costs across the NSW network compared to the Non NSW network and indeed the reference points.
The ARTC is expecting a real increase in the operating and maintenance costs over the first five years of the regulatory period. This would suggest that the ARTC has recognised the relative inefficiency of the NSW network and is attempting to ensure that this is addressed. Table E.1 demonstrates that in terms of the overall operating expenditure in the NSW network there are significant cost efficiencies available to the ARTC. As such the ARTC should be able to achieve these efficiencies by extending its management practices across the network.
Executive Summary 5
Avoidability factors
The ARTC approach to considering the avoidability of individual segments of the network is not unreasonable. This is primarily driven by the considerations of the various factors which the ARTC has outlined, including:
− the type of cost involved (e.g. internal/external, dedicated/shared);
− these ease and timing in which these costs might be shed in the circumstances;
− organisational structure; and
− the significance of the segment theoretically removed from the network.
The consideration of the importance of a particular segment in a theoretical network generally explains any departures from the reliance of size as the key determinate of avoidability was not considered to be unreasonable
Executive Summary 6
1 Introduction
1.1 Scope
PricewaterhouseCoopers (PwC) has been engaged by the Australian Competition and Consumer Commission (ACCC) to independently assess the Australian Rail Track Corporation’s (ARTC) operating and maintenance expenditure program and the cost allocation method used by the ARTC. The agreed scope of works is shown in table 1.
The ARTC has provided ACCC with a financial model which includes its operating and maintenance costs for 2006/07 and the 10 years of the proposed Access Undertaking (the Undertaking) to 2011/12. PwC has analysed this model to assess the allocation of costs, the value and escalation of the operating and maintenance costs over the period of the Undertaking.
Table 1.1 Agreed scope of works
Category Task
Cost allocation method
Identify the key differences between the cost allocation method used in 2002 and the method used in the proposed 2007 Undertaking.
Describe the approach to cost allocation for the 2007 Undertaking, including a description on how these costs are allocated between the interstate and Hunter Valley/NSW rail networks.
Assess the reasonableness of this approach.
Operating and Maintenance Costs
Analyse operating and maintenance costs against the 2002 Undertaking and applicable reference points.
Assess the reasonableness of the operating and maintenance expenditure.
Revenue limits and indicative charges.
Explain ARTC’s approach to revenue limits and indicative charges.
The 2007 Undertaking comprises of the interstate mainline standard gauge track linking Kalgoorlie (WA); Adelaide, Wolseley and Crystal Brook (SA); Melbourne and Wodonga (Victoria); and Broken Hill, Cootamundra, Albury, Macarthur, Moss Vale, Unanderra, Newcastle (to the Queensland border).
While the Undertaking is limited to these segments the ARTC has provided the ACCC with a model which allocates its total operating and maintenance costs across all segments of its network, regardless of coverage under this Undertaking. PwC notes that while the ARTC has a lease over additional segments of track in NSW (including the Hunter Valley Coal Network) this review is limited to the segments described above.
While not subject to this Undertaking, the Hunter Valley Coal Network forms an important component to this review. As the Hunter Valley Coal Network is one of the few pieces of
Introduction 7
rail infrastructure in Australia to recover its full economic costs, including a return of and on the underlying infrastructure investment, the allocation of costs between it and other segments of the network which do not recover their total economic costs is important to determine. There is an incentive for ARTC to under allocate costs to the various segments which do not recover costs in an effort to overestimate the cost of the Hunter Valley Coal Network. Given this incentive, the Commission needs to be satisfied that this is not the case. As part of this review PwC has tested the reasonableness of the allocation of costs between all aspects of ARTC’s network. As such our review is limited to the cost allocation process, rather than the quantum of costs on the Hunter Valley Coal Network.
Figure 1.2 ARTC Network Map
1.2 Background
In 1997 ARTC was established by an Inter-Governmental Agreement between the Commonwealth, New South Wales, Victoria, Queensland, Western Australia and South Australia.
Introduction 8
ARTC is regulated by the ACCC under Part IIIA of the Trade Practices Act 1974. Part IIIA establishes the legal regime to facilitate access to the services of certain facilities of national significance including railways. ARTC has voluntarily submitted an Access Undertaking to the ACCC for assessment under Part IIIA. The Access Undertaking outlines the terms and conditions on which ARTC is prepared to offer access to its rail network. If accepted by the ACCC the Undertaking is legally enforceable.
In 2002, ACCC approved an Undertaking relating to the Interstate Rail Network between Kalgoorlie (WA), Tarcoola (SA), Broken Hill (NSW), Melbourne (Vic) and Wodonga (Vic). Since 2002, the ARTC has entered into a leasing arrangement with the NSW Government for parts of the NSW intra-state network.
Earlier this year, the ARTC submitted a new Undertaking for approval by the ACCC. This Undertaking will extend the 2002 network to include leased tracks on the interstate network in NSW, as well as tracks on the interstate network in Victoria, SA and WA.
1.3 Summary of PwC Method
PwC has undertaken practical analysis to gain an understanding of the operating and maintenance expenditure program as well as ARTC method of cost allocation. A description of this process is provided below.
Step 1
PwC has reviewed the 2007 cost allocation method and the refinements from 2002. The approach to allocation operating and maintenance costs to particular rail segments is outlined. Based on our review and further information provided by ATRC we have assessed the reasonableness of the approach both in terms of how costs have been allocated between the segments covered by this Undertaking and segments not included in this Undertaking; and how costs have been allocated to various individual segments covered by the proposed Undertaking.
Step 2
PwC has undertaken a detailed review of ARTC’s economic model and its approach to operating and maintenance expenditure forecasts. A number of reference points have been used to assess the maintenance and expenditure forecasts. An assessment of the reasonableness of these forecasts has been undertaken.
Step 3
PwC has reviewed the price escalation assumptions used by ARTC and across a number of cost escalation indices. Where appropriate these indices have been used to assess the reasonableness of the ARTC cost escalation over the 10 years of the Undertaking.
Introduction 9
Step 4
PwC has assessed the principles and methodology underlying the proposed revenue requirements in terms of their consistency with economic principles and expected outcomes. PwC has also assessed the proposals against the ARTC’s stated method for estimating such requirements.
1.4 Limitations of Review
This review has been provided to the ACCC for the sole purpose of assisting the ACCC in drafting its determination concerning ARTC’s Rail Access Undertaking.
PwC is limited by the information provided by the ACCC, ARTC and publicly available sources. We cannot confirm the reliability, accuracy or completeness of this information. PwC has not conducted any form of audit of the financial and other information which has been relied upon, nor that the suggested method would be necessarily acceptable to external bodies or robust to legal challenge. PwC accept no responsibility for any errors in the information provided by the ARTC or other parties in submissions to the ACCC nor the effect of any such errors on out analysis, suggestions or report.
1.5 Report Structure
The remainder of this report is structured in the following order: − Section 2 analyses the cost allocation method; − Section 3 evaluates the issues around operating and maintenance expenditure;
and − Section 4 discusses the revenue limits and avoidability factors employed.
Introduction 10
2 Cost Allocation
2.1 Cost allocation process
As a commercial entity the ARTC has an incentive to allocate costs to segments of the network where the costs are most likely to be recovered. The cost allocation process should ensure that these costs are allocated to the segments where they are incurred, thus, preventing cross-subsidisation.
In submissions to the ACCC Issue Paper, stakeholders expressed concern regarding the allocation of costs not covered by the Undertaking, in particular, the allocation of costs to the Hunter Valley network.1 The Freight Rail Operators’ Group (FROG) and Pacific National (PN) are concerned that the allocation of costs between two different Undertakings may lead to inappropriate outcomes. In particular, if Gross Tonne Kilometres are used to allocate costs the Hunter Valley network will be over allocated its proportion of costs.
Costs which are directly associated with a network segment are relatively simple to allocate in that they can be allocated to the particular segment in which they are incurred. On the other hand the allocation of common costs can be more complicated. A suitable driver of the costs must be used to ensure that the correct share is allocated to each segment. In terms of rail track operators’ common costs are typically allocated to a segment on the basis of:
− train kilometres (train km): the number of trains multiplied by the kilometres that the train travels in the segment;
− gross tonne kilometres (GTKs): the weight of train in tonnes multiplied by the kilometres that the train travels in the segment;
− track kilometres (track km): the number of kilometres in the segment; − train movements: the number of trains operating in a segment; or − other causal basis: for example percentage of staff time dedicated to a particular
segment. ARTC typically incurs two types of costs, operating and maintenance costs. Maintenance costs are normally tied to a specific project or program of works physically undertaken on the various track segments of the network can be directly allocated to a segment. Operating costs, as defined by ARTC, normally relate to common costs such as finance, human resources and train control and are therefore more difficult to allocate as they are not easily attributable to a specific segment on the network. Between the 2002 and 2007 Access Undertaking ARTC approach for allocating costs has increased in complexity.
1 Pacific National, Submission to ACCC Re: Approval of ARTC Interstate Access Undertaking, July 2007, page 26 Freight Rail Operators Group, ARTC Interstate Access Undertaking: Freight Rail Operators Group Submission to ACCC, July 2007, page 5
Cost Allocation 11
2.2 Cost Allocation for 2002 Undertaking
In 2002, ACCC approved an Access Undertaking relating to the Interstate Rail Network between Kalgoorlie (WA), Tarcoola (SA), Broken Hill (NSW), Melbourne (Vic) and Wodonga (Vic). In this Undertaking the ARTC allocated non-segment specific costs in proportion to:
− GTK with respect to 60 per cent of the track maintenance cost; − track km with respect to 40 per cent of the track maintenance cost; − train km with respect to all other costs; and − where possible, costs were directly allocated to a Segment.2
The straightforward cost allocation process reflects the simplicity of the network at the time of the 2002 Undertaking. The network comprised only the interstate component where traffic was relatively homogeneous and thus the requirements for operating and maintaining the network did not vary significantly across the network.
In 2002, other costs (assumed to comprise operating costs) were allocated by train km. Operating costs include the staff responsible for communications, signalling, safety and risk management, with a homogenous network it is not unreasonable to assume that costs associated with operating the network are proportionate to the number of trains on the network, and thus it is not unreasonable to allocate these operating costs on the basis on train km.
Similarly, the allocation of maintenance costs via GTKs and track km is also not unreasonable given that they represent an appropriate driver of costs in a homogenous network, maintenance costs are driven by time and usage. Maintenance costs were allocated on the basis of 60 per cent GTK and 40 per cent track km in the 2002 Undertaking. The total pool of maintenance costs were allocated by GTK as this represented the usage of the track, while the allocation of costs by track km is reflective of that proportion of the maintenance dependent on time as by the length of track.
Subsequent to the 2002 Undertaking there has been a fundamental change in the composition of the network with the inclusion of the NSW assets. The extension has necessitated the requirement for a more complex and sophisticated cost allocation process. As such the 2007 Undertaking recognises ARTC’s obligations arising from the NSW lease and, the changes in the commercial, competitive and operating characteristics of the markets served by the interstate network over the past five years. 2.3 Cost Allocation for 2007 Undertaking
In its explanatory guide submitted as part of its 2007 Undertaking, the ARTC noted that it has sought to:
− essentially keep the formula from the 2002 Access Undertaking and extend it to the recently acquired North-South interstate network; and
− continue the level of regulation that is appropriate for the network.3
2 Australian Rail Track Corporation Ltd, Access Undertaking Explanatory Guide, February 2001, page 39
Cost Allocation 12
The proposed 2007 Undertaking allocated operating and maintenance expenditure using what appears to be a more detailed approach. The approach to the allocation of costs has been split into two, the direct costs and the indirect costs. Direct costs are allocated directly to the network segment in which they are incurred. Indirect costs are allocated through a more complex process which recognises the type of cost, the driver of the cost and the location of the segment. The LOREN approach is described in detail below.
Figure 2.1 Operating and Maintenance Cost Allocation
Operating Costs(indirect) Maintenance Costs
(direct)
Division
Allocated to Different Network Segment
All Operating and Maintenance Expenditure
LOREN
Split according to divisional allocation rules (GTK/Train km)
and by LOREN allocation
2.3.1 Direct Costs
Direct costs are those that can be directly attributable to a network segment. ARTC has allocated all of its maintenance costs in this way. Maintenance expenditure is divided into two categories:
− routine maintenance; and − major period maintenance.
Routine maintenance relates to activities usually completed more often than once a year. This includes track inspection cycles, track patrolling, fettling, corridor maintenance, fence maintenance and signal testing.
Major periodic maintenance (MPM) refers to the renovation of infrastructure facilities, at a more than one year interval, to retain their functional condition. There are two types of MPM:
3 Australian Rail Track Corporation Ltd, 2007 ARTC Interstate Access Undertaking Explanatory Guide, June 2007, page 22
Cost Allocation 13
− variable MPM − fixed MPM
Variable MPM is mainly driven by volume usage such a rail grinding and re-surfacing, and thus GTK forms an appropriate allocation method if costs cannot be directly allocated to a segment. Fixed MPM is mainly driven by time, these maintenance schedules are usually set for a fixed period for example communications upgrades, ballast cleaning and re-sleepering. While the fixed MPM could be allocated to segments by track km, direct allocation is preferable.
The proposed 2007 Undertaking allocates MPM expenditure directly to line segments.
Maintenance costs are driven directly by the condition of the network segment, thus the allocation of the fixed and variable costs directly to the network segment in which there are incurred represents the most appropriate and reasonable allocation method.
2.3.2 Indirect Costs
Indirect costs are those that can not be directly attributable to a segment. In 2002 the ARTC allocated these costs to segments on the basis of train km. To reflect the more complex operations of the expanded network, ARTC has chosen to allocate indirect costs via a three-step process.
1. Costs are defined by their division; 2. Costs are tagged with either a GTK or a train km allocation method depending on
the division in which they are allocated; and 3. Costs are allocated by a process called LOREN to the leased NSW segments, the
regional NSW segments or the non-NSW network. These steps are outlined below.
Divisions
ARTC divides their operating costs into 8 separate divisions. These divisions and their allocation methodology are outlined in table 2.2.
Cost Allocation 14
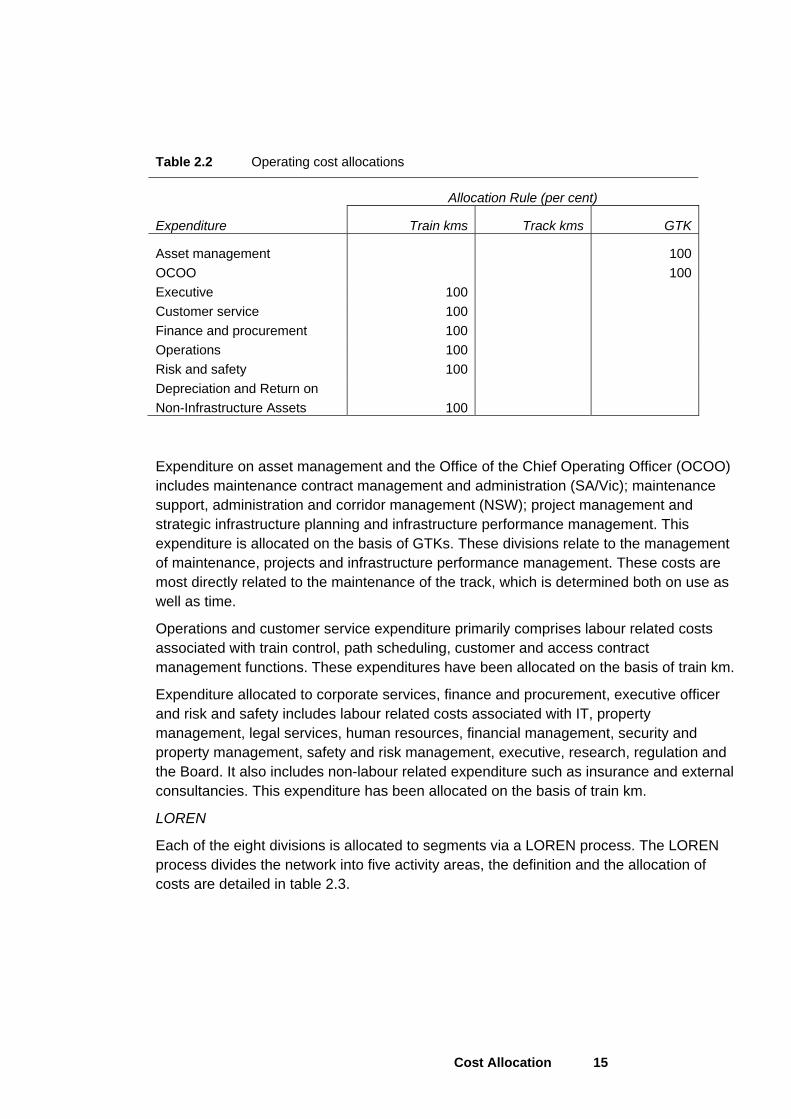
Table 2.2 Operating cost allocations
Allocation Rule (per cent)
Expenditure Train kms Track kms GTK
Asset management 100OCOO 100Executive 100 Customer service 100 Finance and procurement 100 Operations 100 Risk and safety 100 Depreciation and Return on Non-Infrastructure Assets 100
Expenditure on asset management and the Office of the Chief Operating Officer (OCOO) includes maintenance contract management and administration (SA/Vic); maintenance support, administration and corridor management (NSW); project management and strategic infrastructure planning and infrastructure performance management. This expenditure is allocated on the basis of GTKs. These divisions relate to the management of maintenance, projects and infrastructure performance management. These costs are most directly related to the maintenance of the track, which is determined both on use as well as time.
Operations and customer service expenditure primarily comprises labour related costs associated with train control, path scheduling, customer and access contract management functions. These expenditures have been allocated on the basis of train km.
Expenditure allocated to corporate services, finance and procurement, executive officer and risk and safety includes labour related costs associated with IT, property management, legal services, human resources, financial management, security and property management, safety and risk management, executive, research, regulation and the Board. It also includes non-labour related expenditure such as insurance and external consultancies. This expenditure has been allocated on the basis of train km.
LOREN
Each of the eight divisions is allocated to segments via a LOREN process. The LOREN process divides the network into five activity areas, the definition and the allocation of costs are detailed in table 2.3.
Cost Allocation 15
Table 2.3 LOREN
Activity Definition Location
L Work associated with the Leased network in NSW
Costs are allocated only to the leased segments of the NSW networks, these segments are the interstate rail track that are included in the ACCC Undertaking
O Network wide Overheads Costs are allocated to all segments over the entire ARTC network, these costs cannot be allocated to a certain segment
R Work associated with the Regional network in NSW
Costs are allocated only to the regional network in NSW (i.e. the country rail network)
E Work associated with the previous non-NSW network
Costs are those which lie outside the NSW network, thus comprise of the operating costs related to the interstate rail track including in the Access Undertaking in Western Australia, South Australia and Victoria
N Work associated with NSW but non identifiable with the leased or regional network
Costs make up the remnant costs from “L” and “R” which cannot be allocated to a certain part of the NSW network.
This cost allocation method reflects the more geographically and functionally complex nature of the expanded NSW network. The LOREN classification aims to separate costs which are associated with the lease of the NSW network. The introduction of the more complex network means that the magnitude of costs have increased significantly. By using the LOREN to allocate costs the ARTC aims to ensure that costs associated with the NSW lease are not allocated to the segments in WA, SA and Victoria.
2.4 Use of 2007 Cost Allocation Process
As discussed at the start of this section, in 2002, the allocation of maintenance costs was based on a simple allocation of 60 per cent GTKs and 40 per cent track km, and operating costs were allocated on train km. While this allocation methodology is reasonable for a relatively homogeneous network the increase in complexity resulting from the NSW lease renders the approach inappropriate for the proposed Undertaking.
The 2004 agreement to takeover the NSW lease changed the make-up of the ARTC rail network. The ARTC network now includes high productivity lines such as those in the Hunter Valley and more densely located lines close to metropolitan Sydney and built up regional areas. The change in the make-up of the network means that the 2002 cost allocation process would not be suitable for the 2007 Undertaking. Use of the 2002 methodology would result in the higher costs involved in running the NSW lease being spread across the entire ARTC network, leading to an over allocation of costs to WA, SA and Victoria and an under allocation to NSW segments.
The proposed 2007 Undertaking allocates operating costs via a three step process, first by the division, then by GTK or train km and lastly by the LOREN. This process allocates 38 per cent of the operating expenditure based on GTKs and 62 per cent based on train km. No operating costs are allocated by track km.
Cost Allocation 16
The overall movement away from track km results in a redistribution of costs away from longer segments. The reasonableness of this redistribution depends on the extent to which distance is a driver of costs.
Figure 2.4 Operating Cost Allocation
The three step process proposed for the 2007 Undertaking aims to ensure that the common costs are allocated appropriately. Common costs are allocated to particular functions in regulated business based on a causal basis. In terms of rail infrastructure common costs are usually allocated on the basis of train km, track km, GTK or train movements. The Queensland Rail (QR) and WestNet Rail methods are outlined in table 2.5.
Table 2.5 Common Cost Allocation
Rail organisation Common Costs Allocation
ARTC Allocates labour related costs of operating the network by train km, and costs associated with asset management and Office of the Chief Operating Office by GTK. Costs are allocated to particular segments based on the LOREN.
This approach allocates 37% of expenses by GTK and the remaining 63% by train km
WestNet Rail4 Train control – allocated to route based on the number of train controllers required to manage each route
Operating Costs – 100% GTK
Overhead Costs – 50% train movement, 50% GTKs
Queensland Rail5 Allocated first between above rail, below rail and other activities. Below rail costs are then allocated to regions: line segment specific, regional and network wide.
40% of network wide costs are allocated to the Central Queensland Coal Region.
ARTC uses GTKs to allocate asset management and OCOO costs. As these divisions relate to the physical infrastructure and GTKs represents an appropriate causal method for the use of the track contributing to it’s wear and tear, the allocation of these divisions by GTK appears to be not unreasonable. 4 Economic Regulation Authority, WestNet Rail’s Floor and Ceiling Costs Review, Final Determination on the Proposed Floor and Ceiling Costs, 31 July 2007 5 Queensland Rail, Costing Manual, May 2007 Draft.
Cost Allocation 17
WestNet Rail’s use of train movements instead of train km means that the length of the trip is not taken into consideration when allocating costs. This is substantiated by the Economic Regulation Authority (WA) as some overhead costs do not depend on how far the train travels, rather, the quantity of train numbers.
ARTC have allocated expenditure in the operations, customer service, finance and procurement, executive, and risk and safety division on the basis of train km as these divisions represent the labour costs associated with train passage. This leads to a higher allocation to the longer segments. It is not unreasonable to expect that longer segments will require more resources. The cost allocation method is tested in the table below.
In order to assess the common cost allocation process used in 2007, the total operating expenditure allocated to each segment is compared to alternative allocation using train km, track km and GTK. The total pool of operating costs of $154,934,000 is divided by the proportion of train km, track km and GTK for each segment (see table 2.6). In this analysis if the actual cost allocation (shown in the last column) is consistent with the train km, track km and GTK allocations, then the allocation to the segment is said to be not unreasonable. If the cost allocation exceeds the train km, track km and GTK allocations then this suggests that the segment has been over allocated costs. And vice versa, if the actual cost allocation is below the other allocations, the network segment may have been under allocated costs.
Some segments are allocated costs as would be expected, where the actual cost allocated lies within the range set by the train km, track km and GTK tests.
Cost Allocation 18
Costs allocated to the following segments are lower than their allocation based on train km, track km and GTK:
− Appleton Dock Jct – Footscray; − Tarcoola - Asia Pacific Interface; − Dry Creek - Outer Harbour; − Pt Augusta – Whyalla; − Dry Creek - Spencer Street; and − Dry Creek – Parkeston.
All of these segments are included in the ACCC Undertaking outside of NSW. The lower allocation of costs to these segments is consistent with the LOREN approach. LOREN attempts to recognise the higher costs required to operate the NSW segments and it follows that those segments outside of the NSW network would be allocated a lower proportion of the pool of costs.
The segments of Tottenham - Macarthur and Islington to the Queensland Border are both in the north of NSW. These segments have been allocated a higher share of costs than what would be expected under train km, track km and GTK assumptions. ARTC has not provided an explanation for this.
2.4.1 Assessment of Allocation Process
The ARTC allocation process appears to rightly allocate operating and maintenance costs according to the driver of these cost. In assessing the cost allocation process proposed by the ARTC it is important to consider that no single approach to cost allocation could be considered the correct answer the question of allocating costs to particular business units. That is cost allocation by definition requires a number of subjective steps as costs are difficult or impossible to allocate on direct basis. However, reasonable cost allocation approaches generally exhibit a number of common characteristics, including:
− The cost allocation process is as transparent and equitable as possible to ensure that only those costs relating to the specific business units, products, or the case of ARTC rail segments, are allocated to these segments;
− Wherever possible direct attribution is preferred to pooling costs in a common area before allocating costs out to various business units, products etc;
− Contrary to this point is that where business units, products etc do not consume the services arising from a particular cost they are not allocated to that business unit, product etc;
− Where costs cannot be directly allocated common costs are pooled into specific cost centres with common cost characteristics before being allocated out to the specific business units, products etc on the basis of an appropriate allocation driver that is consistent with the attributes of the costs and the demand of the end users (i.e. the business units, products, or rail segments);
Cost Allocation 19
− The overall allocation process does not over allocate costs across the various business, units, products etc of the business, that is the sum total of cost allocated should equal the costs incurred by the business.
This final point is extremely important in the consideration of regulatory settings, be that economic regulation, taxation or statutory reporting requirements. In our analysis of the ARTC economic model our first approach was to ensure that the allocation process only allocated those costs related to the rail network as reported. Our analysis confirmed that 100 per cent of these costs were allocated across the various rail segments and no more. We found no evidence that there was an over allocation of these costs. Further, our assessment of the of the cost allocation process outlined in figure 2.4 demonstrates an allocation of common costs based on a multi driver approach which first attempts to pool costs on the basis of common attributes before allocating these costs on the basis of a consistent and defendable set of costs drivers to various rail segments. We have confidence that the ARTC has developed a cost allocation process which is consistent with the characteristics of reasonable cost allocation methodologies discussed above, given:
− The cost drivers commonly evident in rail networks, namely GTK and Train km;
− The use of location drivers, for example the use of the LOREN drivers; and
− The separation of rail segments on the basis of their physical location.
In terms of other cost allocation processes seen in other network business through Australia, including the telecommunications and energy industries, the cost allocation process exhibits similar features. As noted in Table 2.5, in our experience the cost allocation process employed by the ARTC is more sophisticated than other rail networks within Australia. This reflects the increased complexity of the ARTC’s rail network compared with other networks, which is driven primarily by the sheer size of its operations in conjunction with the complexity of leasing arrangements in NSW versus the remainder of the network. In addition, the cost allocation employed is more sophisticated than the relatively high level approach adopted in the 2002 decision.
In considering the reasonableness of the cost allocation process we have considered the following:
− The cost allocation process employed by the ARTC is consistent with the principles of good allocation processes;
− The sophistication of the cost allocation is consistent with the complexity of the business; and
− The cost allocation process does not over allocate the total number of costs across the various rail segments.
These factors provide comfort that the cost allocation process is not unreasonable. However, this is not to say that there are not other allocation processes which could provide a better or more appropriate answer to the question of allocating costs between rail segments and ultimately customers. Given the existence of no universal truth
Cost Allocation 20
regarding cost allocations, we note that the current approach provides a degree of robustness which we consider is not an unreasonable approach given the factors highlighted throughout this review.
Cost Allocation 21
3 Operating and Maintenance Expenditure
3.1 Proposed operating and maintenance expenditure
Over the ten years of the Undertaking ARTC have proposed $986,886 of maintenance expenditure and $1,074,511 of operating expenditure [to be rounded]. Table 3.1 reports proposed expenditure in real terms on the basis of train kms, track kms and GTK (000) for 2006/07 and each year of the Undertaking.
There does not appear to be a consistent trend in expenditure over each of the indicators. In terms of train km maintenance expenditure initially decreases and then increases over the next four years and then decreases over the remaining years of the Undertaking. The operating expenditure decreases in the first five years and then remains fairly constant over the remainder of the Undertaking in terms of track km. The relative stability of the underlying kms of track in the system indicates that the decrease in the two other indicators is driven by growth in the train km and GTK (000) over the period of the Access Undertaking — train kms increase by an average 3.5 per cent per annum and GTK (000) increases by an average 4.2 per cent per annum in the first five years of the undertaking.
Overall the indicators for the second five years of the Undertaking show a steady decrease in operating and maintenance expenditure per train, track and GTK (000), this is because of the cost escalation formula used by the ARTC in calculating the second five years of the Undertaking. Discussion regarding the calculation of expenditure in the second five years of the Undertaking is held in Section 3.4 – Operating and Maintenance Cost escalation.
Operating and Maintenance Expenditure 22
Table 3.1 Proposed expenditure by train km, track km and GTK/1000
Note Expenditure is reported in real terms based on 2006/07 dollars.
Operating and Maintenance Expenditure 23
3.2 Maintenance Cost Tests
Track maintenance is completed via competitively tendered alliance maintenance contracts with the private sector. In Victoria and South Australia there are separate track maintenance contracts. The key suppliers are Transfield (South Australia) and EDI (Victoria). Outside of NSW, signals and communication maintenance is carried out by ARTC Services Company, a subsidiary of ARTC.
Routine maintenance in NSW was carried out by secondments to the ARTC at the time of the lease commencement. Advice from the ARTC notes that it has determined the size and composition of this workforce in accordance with efficient industry practice.
ARTC has forecasted an increase in MPM expenditure in 2007/08 and 2008/09 due to a backlog of maintenance on the north-south corridor. Table 3.2 sets out a series of reference points for maintenance expenditure against the average maintenance costs assumed in the ARTC undertaking.
Queensland Competition Authority QR Network6 8,920.00 — 12,870.00
Note reference points are reported in 2006/07 dollars based on the ABS, All Groups, Australian CPI index.
Economic Regulation Authority Figures exclude major periodic maintenance
6 Economic Regulation Authority, Final Determination on Westnet Rail’s Proposed Floor and Ceiling Costs, 2007; based on average maintenance cost on 19/21tal lines where annual tonnages are in the range of 3 to 6mgt
Operating and Maintenance Expenditure 24
3.2.1 Regulatory reference points for maintenance costs
While we have not performed a detailed analysis of maintenance costs, we have used reference point comparisons to establish the reasonable range of the ARTC’s forecast maintenance expenditure. Each of the figures represented in Table 3.2, with the exception of the ARTC figures, have been costs adopted by the following economic regulators:
− The Essential Services Commission (Victoria);
− The Economic Regulation Authority (WA); and
− The Queensland Competition Authority.
As shown in table 3.1 ARTC maintenance costs range from $11,966 per track km in 2017/18 to $16,340.49 per track km in 2006/07 with an average of $12,360 over the period of the new Undertaking. External and historical maintenance expenditure reported in table 3.2 demonstrates that this average is toward the lower end of the reference point range. The reference points are between $8,900 and almost $29,000, which suggests a relatively wide reference point range. However, the upper end of the reference point is skewed by the inclusion of some passenger networks through Victoria. Once these reference points are excluded from the analysis the top end of the range falls to under $19,000. Within this range the average maintenance cost forecast by the ARTC over the upcoming regulatory period is approximately in the middle of the range. This outcome would suggest that the maintenance costs of the ARTC are within a reasonable range given the comparison of Victorian, Western Australian, and Queensland rail operators.
In its 2006 Access arrangements for Pacific National, the Essential Services Commission (ESC) commissioned WorleyParsons to undertake a study of maintenance cost benchmarks.7 WorleyParsons used two methods to derive maintenance costs applicable to the Victorian Rail freight Network for the ESC. The first is zero base costs, where the costs are estimated by determining the individual activities necessary, the frequency of performing those activities and then applying a unit rate to those activities. The second method uses published comparable costs per km. Cost were derived with regard to the expected structure of the Victorian Access Regime with five regional classifications. WorleyParsons made a number of assumptions when compiling the benchmarks, these assumptions were:
− The approach to maintenance was for long term sustainability of the asset; − Maintenance is regarded as like for like replacement or repair; − The approach to maintenance in the past has been for long term sustainability of
the asset; and − The traffic characteristic for a line is that which has been definitively committed for
the next five years. The suggested maintenance cost was calculated as 85% of the zero base benchmark, plus the highest benchmark from published data and the lowest benchmark from 7 WorleyParsons, Essential Services Commission: Maintenance Cost Benchmarking for the Victorian Freight Network, 27th January 2006
Operating and Maintenance Expenditure 25
published data, this number is then divided by three. WorleyParsons have noted in their report that the “…suggested maintenance costs are lower that the zero base generated costs because there is a tendency for this method to fail to take into account the economies of scale of workforces and equipment working at similar locations or undertaking similar work.”8 Therefore, WorleyParsons have assumed a 15 per cent efficiency factor is appropriate to the estimates calculated using the zero base method, and so 85 per cent of the calculated cost is used to derive the ‘suggested’ maintenance cost benchmark.
On the basis of this study and feedback from stakeholders the Essential Services Commission of Victoria stated a preference for $15,081 per track km (in 2006/07 dollars) for Victorian Access Regime Freight Lines. The maintenance expenditure proposed by ARTC, while initially slightly higher than the ESC reference point at the start of the Undertaking period is on average below the ESC reference point. As noted above, the exclusion of the reference points generated by passenger rail operators is entirely consistent with good benchmarking approaches, these comparators did not represent like for like companies. However, the Victorian freight network is a relatively good comparator in that it has similar operating conditions as the ATRC network thereby requiring similar maintenance programs. The average cost of maintenance for the ARTC over the upcoming regulation period is expected to be $12,360 or approximately 18 per cent lower than the allowance made by the ESC.
As part of a study conducted by PwC for the Economic Regulation Authority, we have reviewed WestNet Rail’s Floor and Ceiling Costs earlier in 2007. Of all the segments which we reviewed the most appropriate reference point in terms of a reference point for the ARTC network was the Forrestfield to Kalgoorlie line, which is an extension of the ARTC line from Kalgoorlie into Perth. Further, given the relative length of the line we have selected it as the most appropriate reference point to compare the costs of the ARTC’s maintenance costs. The per track kilometre maintenance cost of this line was $18,784, or approximately 52 per cent higher than the average maintenance costs expected by the ARTC. In addition to this, the WestNet Rail maintenance costs do not include major periodic maintenance, which would create an even higher maintenance cost.
ARTC’s forecast maintenance costs over the upcoming regulatory period would appear to be reasonable in comparison to the various reference points used in other regulation decisions. It also represents a decline against the average costs incurred over the current regulation period, of approximately $3,360 per track kilometre. This represents a reduction in the average cost of approximately 25.8 per cent. Given the various reference points outlined in table 3.2 we have considered that the ARTC average maintenance expenditure is not unreasonable due to:
− The average maintenance cost over the upcoming regulatory period of $12,360, is toward the low end of the reference point range of $8,900 to $18,784 as allowed by regulatory authorities across other similar rail network operators;
8 ibid
Operating and Maintenance Expenditure 26
− The average maintenance cost over the upcoming regulatory period is 18 per cent lower than the freight cost accepted by the Essential Services Commission in Victoria for the Pacific National rail network;
− The average maintenance costs represents a 52 per cent reduction against the costs allowed by the Economic Regulation Authority in Western Australia for the WestNet extension of the ARTC line in Western Australia from Forrestfield to Kalgoorlie; and
− The average costs assumed by ARTC represent a 25.9 per cent reduction over the average costs incurred over the current regulatory period.
However, the Queensland Competition Authority’s reference points for the QR are considerably lower than the average cost assumed by ARTC over the upcoming regulatory period. ARTC’s average cost of $12,360 over the regulatory period is in the middle of the QR reference points suggesting that there is still considerable scope for ARTC to achieve efficiency savings. However, the QR reference points are exclusive of MPM. Once a similar adjustment has been made to the ARTC maintenance figures the average maintenance costs is relatively similar. The average maintenance cost expected by the ARTC of the coming regulatory period is approximately $12,360 per annum, which is closer to the QR benchmark range. At the same time there is a relatively lower cost base in Queensland which is the result of a number of operating conditions which the ARTC is unable to take advantage of including the narrower gauge of the Queensland rail network. As the reference points were approximately similar to the ARTC’s assumed costs we consider that these costs are not unreasonable.
3.2.2 NSW versus Non-NSW Network Maintenance Costs
A comparison of ARTC’s forecast maintenance expenditure between the NSW and non-NSW segments is made in table 3.3. The 2006/07 NSW segment maintenance expenditure is $17,956 per track km almost 24 per cent more that that of the non-NSW segments, $14,499 per track km. The maintenance expenditure in the first years of the regulatory period is higher than the range provided by the external references above. ARTC has endeavoured to provide an explanation for this high maintenance expenditure.
Average (weighted for relative size of the network) 16,340.49 1.80 3.91
2011/129
NSW 12,205.54 1.17 2.11Non-NSW 11,711.98 0.91 2.65Average (weighted for relative size of the network) 11,974.85 1.04 2.33
2017/18 NSW 12,594.56 0.93 1.82Non-NSW 11,249.91 0.75 2.19Average (weighted for relative size of the network) 11,966.06 0.84 1.97
Note Figures are 2006/07 dollars.
ARTC has undergone significant change since the take-up of the NSW lease in 2004. The ARTC has stated that the NSW lease has effectively doubled the geographical coverage and tripled the length of the network under management. Further, the ARTC has a complicated structure in terms of the ownership and operation of particular line segments which includes:
− Outright ownership;
− Leased ownership; or
− Management contract.
The ARTC has noted that the NSW network is more complex both geographically and functionally than that originally owned and leased. It is noted that some parts of the network are much more highly utilised and hosts different types of traffic than ARTC’s network in South Australia and Victoria. ARTC also noted that it must meet more onerous safety, heritage and environmental legislative requirements in NSW. As such, ARTC suggests that the reason why there has been an increase in maintenance expenditure since the 2002 Undertaking is due to the prevalence of outsourced contracts across the network outside NSW.
The ARTC has argued that the prevalence of external contracts outside of NSW has enabled it to drive considerable cost savings through the introduction of competitive pressures and market economies which would not have been available from an internal workforce. ARTC has argued that the ownership restrictions in place throughout the
9 The relatively low maintenance expenditure is mainly attributable to a significant drop in expenditure on the Islington to Queensland Border segment in NSW, and a significant drop in the expenditure on the Dry Creek to Parkeston and the Tottenham to Macarthur line in the Non-NSW segments.
Operating and Maintenance Expenditure 28
majority of the NSW network have limited its ability to achieve similar economies across this part of the network. In addition, the increased workforce required in NSW which is included in the ARTC books has required considerable additional effort in terms of the internal resources required.
While the lack of opportunities to outsource maintenance in NSW does represent a considerable diseconomy to ARTC, it would be expected that there are some transitional arrangements whereby the ARTC could potentially relax this requirement. The ARTC should be able to provide some evidence of market testing to suggest that internal service provision is either too expensive or cheaper than external service provision. In any event it is the role of the ARTC, as the manager of the assets, to take these decisions irrespective of the end ownership of the network.
3.2.3 ARTC’s independent analysis of maintenance costs
ARTC has provided the findings of an independent report by WorleyParsons which has been commissioned to determine efficient industry benchmarks for maintaining the network. The WorleyParsons report provided efficient benchmarks for the East-West ARTC Interstate network and the North-South Interstate network.
The method used by WorleyParsons to calculate ARTC’s efficient maintenance costs was equivalent to the first method used by WorleyParsons in their role to calculate maintenance costs for the Essential Services Commission in Victoria, the zero base costs method.
As outlined in 3.2.1, WorleyParsons included a 15 per cent when using the zero based method for the Essential Services Commission. As WorleyParsons was given access to ARTC’s asset databases, and in some areas, cost data, they are more confident in their assessment of efficient maintenance costs on the ARTC network, and therefore did not apply an efficiency factor.
WorleyParsons has recognised the difference in maintenance costs for the East-West and North-South corridors, the efficient benchmark for the North-South network is around 80 per cent higher than that for the East-West network. ARTC has suggested that this
10 Australian Rail Track Corporation Ltd, An assessment of ARTC Maintenance Cost Relative to Efficient Industry Practice, 2007
Operating and Maintenance Expenditure 29
acknowledges the more difficult terrain, climate, higher curvature and the predominance of timber sleepers in the North-South corridor.
While the methodology and data used by WorleyParsons to assess ARTC maintenance costs does not directly compare to the unit costs derived by PwC, the independent report finds that ARTC’s costs compare favourably to efficient costs.
WorleyParsons found that on the East-West network ARTC maintenance costs lie around 25 per cent below the WorleyParsons efficient benchmark. On the North-South network, ARTC maintenance costs lie 20-25 per cent below the WorleyParsons efficient benchmark, and the costs are expected to fall substantially with the replacement of timber sleepers.
As an approximate comparison, the non-NSW network maintenance expenditure was calculated at $1,289 per GTK compared to the WorleyParsons efficient cost benchmark of $1,720 per GTK. ARTC has explained this favourable comparison is due to the good track condition, steady maintenance requirements, concrete sleepers, and simple terrain on the East-West corridor. However, if the efficiency factor of 85 per cent used by WorleyParsons in their assessment for the ESC is taken into account, the benchmark would be $1,462 per GTK for the East-West corridor.
3.2.4 Conclusion on the reasonableness of ARTC’s maintenance costs
We have analysed a number of reference points in considering the reasonableness of the maintenance costs provided by the ARTC. Overall, the consideration of the reasonableness of costs is dependent on a number of subjective judgements, however, we are comfortable that the costs brought forward by the ARTC are not unreasonable due to the following data points:
− ARTC have forecast maintenance costs to increase over the period of the undertaking by as much as 36.5 per cent;
− This is expected to translate to an average reduction of approximately 25.9 per cent;
− In terms of reference points against various regulatory decisions ARTC’s costs are expected to fall approximately in the middle of the reference point range allowed in other jurisdictions for similar rail segments;
− The competitive tendering of contracts throughout the network outside of NSW provides a degree of market testing which helps to ensure not unreasonable outcomes; and
− ARTC’s independent consultant has established a set of benchmarks which when compared to the ARTC’s costs are favourable.
However, we continue to be concerned with the relatively high costs throughout the NSW network. This concern is driven by the absence of market testing which suggests that there are still considerable efficiencies available to ARTC which would help to reduce the shortfall between overall operating costs and revenues.
Operating and Maintenance Expenditure 30
3.3 Operating Cost Tests
ARTC are proposing an annual average operating expenditure of approximately $91 million over the period of the Undertaking. These expenditures have been referenced against historical indicators as outlined in table 3.5. Such a comparison shows a significant increase in both spend per train km and spend per track km at the commencement of the Undertaking. These indicators are more than double those forecasted in the prior Undertaking.
As outlined in table 3.1 operating costs ranged from $13,585 to $14,587, with an average over the period of the Undertaking period of $14,133. Table 3.5 provides ARTC’s historical operating expenditure and an external reference points from the review of Westnet Rail’s costs completed earlier this year.
Note Benchmarks are reported in real terms based on 2006/07 dollars.
At the commencement of the 2002 Undertaking, ARTC’s forecasted costs ranged from $5,500 to $6,074 per train km, with an average of $5,795 over the 5 year period. In the review of WestNet Rail’s floor and ceiling costs, the Forrestfield-Kalgoorlie line showed an operating cost per train km of $13,932. The WestNet Rail operating cost figure contains the operations and overhead costs which include labour costs related to signal maintenance, accounting, corporate services, human resources, IT, infrastructure management, standards and compliance, projects, signals and communication, network access management, train control, regional perway management, and head office infrastructure management. These divisions appear to be equivalent to the divisions related to operating costs for the ARTC.
However, it is difficult to account for the fact that WestNet’s costs are some 2.4 times the operating costs of the ARTC over the initial 2002 access undertaking until we consider the relative scale of the WestNet network versus the original ARTC network. The increased scale and scope of the ARTC’s network compared to the WestNet network results in a considerable average cost saving.
At the same time comparing ARTC’s proposed operating expenditure with external reference points is problematic. Network operations costs are generally a combination of train control, signalling and safety costs. To a large extent, these costs are a function of the technology and infrastructure currently in place. In addition to the density of train
Operating and Maintenance Expenditure 31
operations, it is difficult to make meaningful comparisons across track owners/managers given the diverse nature of the individual operations, the technologies employed and the differing cost bases of individual operators. As such any reference points must be carefully considered and if necessary adjusted to made to ensure parity. As an example the resultant change in the ARTC network from the introduction of the NSW network means that a degree of segmentation is required before meaningful comparison can be made across the ARTC network.
Table 3.6 sets out the costs across NSW and non NSW segments of the network. In comparing this data to the data set out in table 3.5 a number of features are immediately obvious:
− This higher average cost is more in line with the reference point of considered in table 3.5;
− The average costs have increased significantly across the network between the two access periods; and
− The NSW operating costs are substantially higher than the remaining part of the regulated network.
Average (weighted on relative size of the network)
14,439.88 1.59 3.46
2011/12
NSW 20,315.72 1.95 3.51 Non-NSW 8,060.17 0.63 1.82 Average (weighted on relative size of the network)
14,587.39 1.26 2.83
2017/18 NSW 18,934.62 1.40 2.74 Non-NSW 7,489.67 0.50 1.46 Average (weighted on relative size of the network)
13,585.16 0.95 2.23
Note Figures are 2006/07 dollars.
When the operating expenditure of the non-NSW network is compared to the NSW network, a considerable difference between the two is exposed. Operating expenditure on the NSW segments is 170 per cent higher that of the non-NSW segments on a per train km basis. The average operating expenditure for the non-NSW segments over the Undertaking is $7,773 per track km is approximately 44 per cent lower than the WestNet Rail reference point. Meanwhile, the operating expenditure on the NSW segments is $19,697 per track km over the ten year period of the Undertaking, which is approximately 41 per cent higher than the WestNet Rail reference point.
Operating and Maintenance Expenditure 32
The average cost of the ARTC network has increased 133 per cent from the allowances made in the previous access period ($6,073.59) to the forecast cost in this period ($14,133.51). The ARTC has provided information to explain the step change in operating costs and the difference between NSW and non-NSW segments. The 2001/02 ARTC Annual Report states average employee numbers at 89.11 ARTC have stated that the current workforce includes around 720 infrastructure workers seconded by the ARTC to carry out the maintenance work in NSW as well as 620 direct employees.
ARTC noted that of the direct employees, 180 carry out the network control function from centres in Newcastle, Junee and Adelaide, the remaining 440 essentially take on executive roles associated with managing the infrastructure maintenance contracts and workforce, the network control workforce in NSW, the infrastructure investment program, the NSW Country Regional Network, and other support and management functions. The ARTC notes that the type of resources and corporate support needed to service the substantial increase in the size and spread of the organisation explain to some extent the rise in the operating costs.
The cost increases between the initial access period and this second regulatory period suggests that the integration of the NSW network has lead to considerable diseconomies of scale. However, this ignores the growing maturity of the ARTC business both in terms of increased complexity of the business and the changes in the ARTC management systems which provide better information than what was available for the first regulatory period. While the operating costs reference point used in this particular example was actually within the upper limit, as set by the NSW segment of the ARTC’s network, and the lower limit, as set by the Non NSW segments of the ARTC’s network. This suggests that the average costs of the ARTC’s are not unreasonable in the context of external reference points. However, at the same time the NSW costs are still considerable higher than what would otherwise be if the ARTC had been able to extract the full extent of cost savings from the NSW network.
3.4 Operating and Maintenance Cost Escalation
We have already assessed the reasonableness of the operating and maintenance expenditure in terms of point estimates, we now turn our attention to the escalation factors used by the ARTC to forecast its costs over the regulatory period. In conducting this process we have looked to see evidence of cost saving measures being factored into the ARTC’s forecast costs. Further, we have looked to understand the basis for the initial cost estimates provided by the ARTC.
The real year on year change in proposed operating costs is reported in table 3.8. Overall operating and maintenance expenditure decrease in the first year of the Undertaking from 2008/09 to 2009/10 operating and maintenance costs decrease, in the remaining years of the Undertaking there is an overall increase.
From 2011/12 ARTC uses a different cost escalation method. Cost escalation in the second five years has been calculated using the formulae outlined in table 3.7. 11 Australian Rail Track Corporation, Annual Report 2002, page 10
represents the increase in the variable component of maintenance with the increase in GTK task. 30% has been assumed as the extent of variability of maintenance with volume change for a concrete track with 10MGT pa (this is roughly the case for the interstate network). [See QCA Draft Decision on QR’s Draft Undertaking Volume 4 – Working Papers (December 2000) p47 and 55 for some evidence in this regard]. Maintenance assumed variable with GTK in line with cost allocation principles in the undertaking.
represents the application of CPI and a Maintenance Productivity Improvement assumption to both the variable and fixed elements of maintenance. The Maintenance Productivity Improvement assumption is in line with ARTC experience to date. No improvement is assumed on the NS corridors following substantial improvements noted during years 1-5 resulting from ARTC’s investment program.
represents the increase in the variable component of Opex with the increase in Train km task. 10% has been assumed as the extent of variability of Opex with Train km change. Opex, by and large, includes those elements of expenditure that are considered under normal consting conventions as being relatively fixed with incremental changes in task, such as Asset Management and Corporate Overheads. Nevertheless there are some areas where such costs may incrementally increase with task (eg train management, billing). As such, ARTC has recognised 10% variability across all Opex. A lower variability could be argued. Opex is assumed variable with Train km in line with cost allocation principles in the undertaking.
Opex (yr t-1) * (1 - Opex Variability (90%))
represents the remaining 90% of Opex assumed to be fixed with respect to Train km and thus held at 2011-12 level.
represents the application of CPI and an Opex Productivity Improvement assumption. The Opex Productivity Improvement assumption is in line with ARTC experience to date.
Operating and Maintenance Expenditure 34
Table 3.8 Changes in proposed costs (Access Undertaking) — 2006-18
Operating and Maintenance Costs -0.62 -0.61 -0.60 -0.58 -0.83 -1.66
Note: Total network includes all track segments currently operated by ARTC. Percentage changes are based on real expenditures expressed in 2006/07 dollars.
The initial decrease in operating expenditure and the sustained increase in maintenance expenditure are attributed by ARTC to the renovation and improvement of the North-South interstate corridor. These improvements are expected to deliver considerable improvements in practices and network condition. Decreasing maintenance expenditure also reflects an overall decrease in major periodic maintenance over the period, which ARTC have forecast to decrease by 1.07 per cent over the Undertaking.
Importantly, we have compared the ARTC’s costs to the other labour and construction costs indices to establish the reasonableness of the ARTC’s forecast costs. We have compared the ARTC’s escalation factors to the ABS Producer Price Index for Non-building construction as no rail cost specific index is available). The ABS index indicates that labour costs and construction costs increased steadily over the preceding five years — 2002 to 2007. Based on the indices non-building construction costs increased by five per cent per annum and labour costs by four per cent per annum. The trend overtime in the proposed operating and expenditure costs appear to be contrary to what would reasonably be expected based on the indices.
Figure 3.8 shows the trend in labour and construction costs from June 2002 to June 2007. The proposed operating and maintenance costs are also charted from June 2007 to June 2018. The ARTC proposed operating and maintenance costs defy the upward trend in labour and construction costs. ARTC have forecasted costs through an examination of scope and activity needed to deliver the require outcome and input (labour/materials) costs specific to an activity and location.
Operating and Maintenance Expenditure 35
Figure 3.9 Changes in labour and construction costs — 2002–2007; Changes in proposed ARTC Undertaking Operating and Maintenance Costs — 2006-18
75.0
80.0
85.0
90.0
95.0
100.0
105.0Ju
n-02
Dec
-02
Jun-
03
Dec
-03
Jun-
04
Dec
-04
Jun-
05
Dec
-05
Jun-
06
Dec
-06
Jun-
07
Dec
-07
Jun-
08
Dec
-08
Jun-
09
Dec
-09
Jun-
10
Dec
-10
Jun-
11
Dec
-11
Jun-
12
Dec
-12
Jun-
13
Dec
-13
Jun-
14
Dec
-14
Jun-
15
Dec
-15
Jun-
16
Dec
-16
Jun-
17
Dec
-17
Jun-
18
Inde
x (J
une
2007
= 1
00)
Non-Building Construction WPI All Occupations WPI Transport and Storage Undertaking Operating and Maintenance Costs Source: ABS 6427.0 Producer Price Indexes, Australia.ABS 6345.0 Labour Price Index, Australia.WPI, wage price index.,
ARTC Financial Model for 2007 Undertaking ($2006/07), Index Numbers June 2007=100
Figure 3.9 demonstrates that when compared to the ABS’s index the ARTC has forecast a considerable decrease in the costs of its network. This suggests that the ARTC is expecting a considerable efficiency saving from its forward looking expenditure program. The forecasts assumed by the ARTC will deliver real cost reductions, which would suggest that they are assuming a considerable level of efficiency to be generated. While we have concerns that this may not necessarily be achievable we consider that this is not unreasonable in the context of this review. The ARTC has suggested that maintenance costs are expected to decline because of efficiency gains following the current $2.6 billion investment program. As detailed information on how costs have been escalated over the Undertaking period has not been provided it is unclear whether the calculated efficiency gains have taken into account trends in labour and construction costs.
3.5 Consideration of the Reasonableness of the ARTC forecast costs
Our analysis of the reasonableness of ARTC’s costs and its subsequent forecasts has been based on a number of external reference points and a consideration of the escalation factors used. Table 3.10 sets out the average costs across the two distinct segments of the network and the reference points considered.
Operating and Maintenance Expenditure 36
Table 3.10 Benchmark of maintenance and operating costs (track km basis)
On a track basis Non NSW network NSW network Total Maintenance costs $14,500 $17,956 $16,340 Reference point range $8,000 to $19,000 Operating costs $6,828 $21,120 $14,440 Reference point range $13,932
Note: Maintenance and operating costs are average over the period, all figures are in 2006/07 dollars
In table 3.9 it is demonstrated that the maintenance costs for the network is approximately $16,340 on a track basis, which is at the high end of the regulatory reference point range established above. Further, while the operating costs are above the reference point established by the Forrestfield Kalgoorlie line by approximately 3.6 per cent, the NSW network operating costs are actually lower than this reference point. Ideally a multitude of operating cost reference points would have been available, however, given the relative lack of availability in terms of operating costs we have only been able to use one comparator. The concerning feature of table 3.10 continues to be the relatively higher cost of operating costs across the NSW network compared to the Non NSW network and indeed the reference points.
The cost escalation outlined in table 3.7 suggests that the ARTC is expecting a real increase in the operating and maintenance costs over the first five years of the regulatory period. This would suggest that the ARTC has recognised the relative inefficiency of the NSW network and is attempting to ensure that this is addressed. Table 3.10 demonstrates that in terms of the overall operating expenditure in the NSW network there are significant cost efficiencies available to the ARTC. As such the ARTC should be able to achieve these efficiencies by extending its management practices across the network. While we continue to be concerned by the relatively higher cost base in NSW, we consider that the ARTC’s operating and maintenance costs are not unreasonable in the context of the external reference points used.
Operating and Maintenance Expenditure 37
4 Revenue Limits and Indicative Charges
4.1 Revenue limits and indicative charges
ARTC is proposing to set access charges based on an indicative access charge. ARTC will publish indicative charges for services in specific segments with the following characteristics:
− maximum axle load of 21 tonnes − maximum speed of 110km per hour and − length not exceeding
o 1,800 metres west of Adelaide and Parkes o 1,500 metres east of Adelaide and Parkes o 1,800 metres on the segments Melbourne-Macarthur and
Parkes-Cootamundra
The indicative charge is escalated annually on the basis of CPI and the cumulative impact of variations to indicative charge. The proposed indicative charges are listed in tables 4.1 and 4.2.
Revenue Limits and Indicative Charges 38
Table 4.1 Proposed variable charges — $ per 000 GTK Based on operating segment
Indicative access charges have been revised by ARTC for the network. Indicative access charges have been determined on a corridor rather than jurisdictional basis. ARTC has proposed a further 10 per cent rebate of the indicative access charges with regard to related usage on the Melbourne-MacArthur and Newcastle–Queensland Border segments of the network for the two year period commencing with the introduction of indicative access charges.
In its Explanatory Guide12 ARTC notes that the proposed charges reflect competition from road. ARTC’s proposal is based on research in the current long haul intermodal markets that are normally associated with the East-West corridor.
12 Australian Rail Track Corporation Ltd, 2007 ARTC Interstate Access Undertaking Explanatory Guide, June 2007, page 57-59
Revenue Limits and Indicative Charges 39
Table 4.2 Maximum flag fall charges — by operating segment
Note: Maximum flag fall charges are calculated on the basis of distance of track in segment multiplied by the proposed
$ per train km flag fall.
Individual access charges negotiated under the Undertaking will differ from the indicative charge where they reflect the characteristics of individual services; including technical aspects, segment specific characteristics, opportunity cost, impact on other traffic and the market value of the particular time path being sought.
Where a price is negotiated it will be bound by the floor and ceiling revenue requirements. The revenue requirements for 2006/07 are outlined in table 4.3. In general, the ceiling revenue requirements proposed by ARTC are increasing by an approximately similar rate over the period of the Undertaking. Proposed floor revenue requirements are much more variable than the ceiling. For six of the eleven track segments the floor requirement is decreasing over the first five years of the Access Undertaking.
Revenue Limits and Indicative Charges 40
For five of the eleven track segments the floor requirement is decreasing while the ceiling requirement is increasing.
Table 4.3 Proposed floor and ceiling revenue requirements
Note The average annual change is calculated as the compound annual rate of change for the five year period over which
the Access Undertaking will apply
4.2 Undertaking requirements to calculate floor costs
The floor revenue limit for a segment (or group of segments) is defined as the level of revenue sufficient to cover the incremental costs associated with that segment. Incremental costs are defined as those costs that would be avoided if the segment is removed from the rail network. Incremental costs relate exclusively to maintenance and operating expenditure and exclude depreciation and return on assets relating to segment specific assets and non-segment specific assets.
ARTC estimate such cost as the direct costs associated with the segment and a proportion of the common costs allocated to the segment.
Incremental costs include segment specific costs (direct costs) and non-segment specific costs (common costs). Common cost relate to the following activities:
− Track and signalling and communications maintenance − Maintenance contract management and project management − Train control and communications − Train planning and operations administrations − Systems management and administration
In considering the avoidability factors ARTC took into account: − the type of costs involved (internal/external, dedicated/shared); − the ease and timing in which these costs might be shed in the circumstances;
Revenue Limits and Indicative Charges 41
Revenue Limits and Indicative Charges 42
− organisational structure; and − the significance of the segment theoretically removed from the network.
In determining the avoidability of costs on specific segment the underlying principle was that larger segments have a greater potential for avoiding costs in the event that the specific segment was to close. One of the factors behind this reasoning is because a significant part of maintenance activity is undertaken by heavy equipment and machinery, and thus, when these assets are used (or forecast to be used) on a particular part of the network, it is possible to identify the cost of operating and maintaining that equipment with that part of the network. However, sometimes, a piece of equipment is used on several parts of the network. Where a segment is longer, it is likely that some of the machinery is dedicated to that segment and so avoidable with the removal of that segment.
ARTC has proposed a range of avoidability factors for both maintenance and operating expenditure. These factors are applied to the allocated costs to determine the incremental costs associated with a segment. The proposed avoidability factors for track segments along with the proportion of the total network GTKs/Train km/Track km (based on how they are allocated to segments) are reported in table 4.4. The table compares the avoidability factor of a particular cost against the costs allocated to the line segment. The percentage of costs allocated to the segment represents its significance. For example, in the Appleton Dock segment, ARTC are proposing a 20 per cent avoidability factor for Train Control and Communications, where as this section of track only represents 0.02% of the network.
It is not unreasonable to expect that maintenance expenditure is track specific and therefore more avoidable. The use of shared machinery goes some way to explaining the use of a 50 per cent avoidability factor. However, 100 per cent avoidability is more likely given the need to not maintain tracks which are no longer in service.
Operating expenditure is by its nature more likely to be common across a number of segments and therefore less avoidable as the costs are likely to be incurred irrespective of whether the segment is in use. This is reflected in generally lower levels of ARTC’s proposed avoidability factors for operating expenditure. ARTC has proposed avoidability factors based on the significance of a segment and the type of operating cost. For example, an avoidability factor of 80 per cent is proposed for train control and communication services in relation to the Dry Creek (Parkeston) segment as it comprises a significant percentage of the network.
The proposed avoidability factors for each expenditure type were based on the following:
Note: Both Signalling & Communications and Track & Right of Way are provided via contract, all figures are percentages
− Signalling and communications — predominately direct, otherwise on train kms
− Track and right of way — predominately direct, otherwise 40 per cent on track kms and 60 per cent on train GTK
− Train control and communications — train kms
In assessing avoidability we have found it difficult to completely understand the decisions to account for avoidability factors which are not based on the following assessment of avoidability:
− Completely avoided – therefore assessed as being 100 per cent avoidable
− Potentially avoidable depending on the circumstances – therefore being assessed as having a fixed percentage of likely avoidability, usually 50 per cent
− Completely unavoidable – therefore assessed as being 0 per cent avoidable.
In theory each line item should be assessed against this criteria and the final avoidability factors used should reflect the weighted average of the various avoidability factors. Avoidable cost allocations are generally a subjective exercise in that a considerable degree of judgement to arrive at these final factors. Usually, a full consideration of such a study would be required before an informed assessment of the reasonableness of the various avoidability factors could be made. In the case of the ARTC, this study was not conducted. Instead the ARTC management has considered the issue of avoidability at a much higher level than the detailed approach specified above. In the absence of a detailed study we have reviewed the consistency of the approach employed by the ARTC.
ARTC has made an allowance for a degree of stickiness regarding the manner in which maintenance is sourced. Specifically the avoidability factor is assumed to be greater where expenditure relates to external contracts. ARTC has proposed avoidability factors of 100 per cent for trunk mains deemed to be significant (in terms of both length and capacity utilisation) due to the prevalence of outsourced contract which are considered more easy to remove from the cost base. However, non significant segments or segments where a higher proportion of track maintenance is sourced internally have been assessed as having lower avoidability factors. As highlighted in table 4.4 these segments of the track have been assessed as having an avoidability of between 50 and 80 per cent. It is difficult to understand why the ARTC has treated the Islington segment differently by assigning it a 75 per cent avoidability factor while other segments of similar length (around 20% of the network) at 80 per cent avoidability. Unless compelling argument from the ARTC we would expect that these avoidability factors would be made consistent. This continues across the various operating units where Islington continues to have different avoidability factor, including Asset Management, train control and communication, Signals and Communication, and track and right of way.
In assessing the reasonableness of the avoidability factors consideration should be given to the consistency of the methodology employed by the ARTC. For example we note that despite communicating its basic rationale for avoidability was based on the size of an individual line segment there are some examples where the ARTC has assessed a line
Revenue Limits and Indicative Charges 44
segment which is either smaller or bigger than another as having counter intuitive avoidability factors. One example of this is the treatment of asset management costs which is outlined in table 4.5.
Table 4.5 Asset management avoidability factors
Line segments Range of percentage of network Avoidability factor assigned Appleton Dock, Dry Creek (Outer Harbour), Moss Vale, Tarcoola
Less than 0.59% 0%
Dry Creek (Parkeston and Spencer Street), Pt Augusta, Parkes
0.26% to 39.5% 20%
Crystal Brook, Tottenham 9.4% to 18.97% 30% Islington 11.85% 40%
As can be seen in table 4.5 there is a considerable degree of inconsistency of avoidability factors assigned to segments irrespective of the size of the various line segments. Again the Islington segment of the network is an interesting case study as it has been assessed having 40 per cent avoidability despite being within percentage size range of the other line segments which have been assessed as having 20 per cent avoidability. This inconsistency in the application of the avoidability factors suggests a degree of subjectivity which is difficult to assess as reasonable without a detailed rationale of why the various avoidability factors were chosen for specific segments and not others.
However, we note that the ARTC has stated that it has been through an assessment process on each line segment to consider the relative merit of the avoidability factors chosen. In relation to the cost avoidability of all segments on the ARTC network, a degree of judgement and ARTC’s experience in the area of below rail costing was exercised. Within this judgement the ARTC indicated that a number of factors were considered, including:
− the type of cost involved (eg internal/external, dedicated/shared)
− these ease and timing in which these costs might be shed in the circumstances
− organisational structure
− the significance of the segment theoretically removed from the network.
The ARTC has also indicated that the significance of the segment being theoretically removed from the network was often the most important consideration in terms of assessing avoidability. ARTC has stated that the relative importance of size and other factors in the decision depends on the nature of the cost area. As such the ARTC has stated that it did not intent that size was the exclusive consideration in terms of avoidability. As part of the assessment of the reasonableness of these avoidability factors the ATRC has provided a further break down of the considerations for the avoidability for each segment of the network which can be found in appendix B. It is our consideration that these explanations do not provide an unreasonable basis for the avoidability factors used in the model.
Revenue Limits and Indicative Charges 45
The ERA requires WestNet Rail to determine the floor by the incremental costs resulting from the operations on the section of a route and use of the infrastructure. Incremental costs are defined as the operating costs, and, where applicable, capital costs and overheads that WestNet would be able to avoid in respect of the 12 months following the proposed access.13 In order to calculate the floor, WestNet Rail has applied the following factors14:
− The percentage that the incremental traffic represents of the total traffic; − the existing overall level of traffic (i.e. high or low density traffic use); − the requirements of the service (e.g. high speed passenger versus low speed
freight); − the nature of the infrastructure (which will influence the operating costs) and the
specific requirements of the user; and − the nature of the train operations and its impact on overhead costs.
WestNet Rail has developed a computerised costing model, the access pricing model (APM) to calculate the floor and ceiling costs. The APM applies individual activity unit costs to estimated activity levels to derive floor and ceiling costs for individual route sections. The APM stores population data, including all costs and physical parameter assumptions, in a Microsoft Access database. The database has an interface that allows the user to select routes and vary assumptions prior to running the model. Overhead costs are allocated on the basis of 50 per cent GTK and 50 per cent train numbers, operating costs are allocated 100 per cent GTK, Train control costs are directly allocated, network management overheads are allocated by train numbers and maintenance costs are directly allocated. WestNet Rail’s Floor costs for the Forrestfield – Kalgoorlie line are $7,425,287 compared to a ceiling cost of $121,900,516. The floor costs represent only 5.7 per cent of the ceiling costs.
In contrast the ARTC’s floor costs represent 18.1 per cent of their ceiling costs. This suggests that the ARTC’s approach yield a better outcome in that a great proportion of costs are recovered by the prices sets.
4.3 Reasonableness of avoidability factors
The ARTC approach to considering the avoidability of individual segments of the network is not unreasonable. This is primarily driven by the considerations of the various factors which the ARTC has outlined in Appendix B. Importantly the consideration of the importance of a particular segment in a theoretical network generally explains any departures from the reliance of size as the key determinate of avoidability.
13 Economic Regulation Authority, Final Determination on Westnet Rail’s Proposed Floor and Ceiling Costs, 2007 14 Ibid, page 9
Revenue Limits and Indicative Charges 46
Reference List 47
Appendix A Reference List
Australian Bureau of Statistics, Catalogue Number 6345.0 Labour Price Index, Australia
Australian Bureau of Statistics, Catalogue Number 6427.0, Producer Price Indexes, Australia.
Australian Rail Track Corporation Ltd, 2007 ARTC Interstate Access Undertaking Explanatory Guide, June 2007
Australian Rail Track Corporation Ltd, Access Undertaking Explanatory Guide, February 2001
Australian Rail Track Corporation Ltd, An assessment of ARTC Maintenance Cost Relative to Efficient Industry Practice, 2007
Australian Rail Track Corporation, Annual Report 2002
Booz Allen Hamilton, ARTC Standard Gauge Rail Network DORC, January 2007
Economic Regulation Authority, Final Determination on Westnet Rail’s Proposed Floor and Ceiling Costs, 2007
Freight Rail Operators Group, ARTC Interstate Access Undertaking: Freight Rail Operators Group Submission to ACCC, July 2007
Pacific National, Submission to ACCC Re: Approval of ARTC Interstate Access Undertaking, July 2007
Queensland Rail, Costing Manual, May 2007 Draft.
WorleyParsons, Essential Services Commission: Maintenance Cost Benchmarking for the Victorian Freight Network, 27th January 2006
Appendix B ARTC response to avoidability factors
Asset Management Line Segments Avoidability factor
assigned Range of percentage of network
ARTC Comment
Appleton Dock Jct - Appleton Dock, Dry Creek - Outer Harbour, Moss Vale - Unanderra, Tarcoola – APT Interface
0% Less than 0.59% Very small segments, removal has negligible influence on asset management cost.
Pt Augusta - Whyalla, Parkes - Cootamundra, Dry Creek - Spencer Street, Dry Creek – Parkeston
20% 0.26% to 39.5% Dry Creek – Parkeston, Dry Creek Spencer Street are major segments but outside NSW, so only contract management and high level division management are involved and are less avoidable. Parkes – Cootamundra is a less significant segment, but in NSW where asset management expenditure is internal and lower level as well as higher level, and so more avoidable. Pt Augusta – Whyalla is a smaller segment, and outside NSW. A case could be made to reduce avoidability back to around 10% here.
Crystal Brook - Parkes, Tottenham - Macarthur
30% 9.4% and 18.97% Major segments, half outside NSW, half in NSW so greater avoidability than if entirely outside NSW.
Islington 40% 11.85% Major segment entirely within NSW so highest level of avoidability.
Here similar length segments have 20% avoidability while others have 30% or 40% why?
Asset Management expenditure generally includes maintenance support, supervision and management. Factors considered are size of segment and ability to avoid cost. In NSW, Asset Management expenditure is internal and more closely related to particular regions in NSW (eg North Coast, South, West, etc). Outside NSW, a large part of asset management activity (maintenance support and supervision) is conducted externally (by ARTC suppliers) and incurred externally through the maintenance contract. These contracts cover larger parts of the network than NSW (eg SA or Victoria). Such expenditure is identified directly with segments through the contract and included in track/right of way below. Only higher level contract management and divisional management expenditure is incurred as Asset Management expenditure outside of NSW. These costs relate to
ARTC response to avoidability factors 48
the management of a contract that can cover several segments. As such, outside of NSW, it is more difficult to avoid this type of expenditure (being higher level) than in NSW where such expenditure is internal, covers both maintenance support and supervision as well as higher level management, and covers smaller geographic regions in NSW rather than larger contracts.
Corporate Line Segments Avoidability factor
assigned Range of percentage of network
ARTC Comment
Appleton Dock Jct - Appleton Dock, Dry Creek - Outer Harbour, Moss Vale - Unanderra, Tarcoola – APT Interface, Pt Augusta - Whyalla, Parkes – Cootamundra
0% Less than 0.48% Smaller segments. Non-trunk. Removal unlikely to affect Corporate expenditure significantly.
Parkes [Updated to 0% as per the model]
17.6% 1.42% Our model shows Parkes – Cootamundra allocation as 0% . There are no segments showing 17.6%?
Dry Creek – Spencer Street, Dry Creek – Parkeston Crystal Brook – Parkes, Tottenham – Macarthur, Islington – Queensland Border
20% 7.9% to 29.25% Major trunk segments. Removal would impact on Corporate expenditure, but still marginally due to fixed nature of these costs.
No comment required
ARTC response to avoidability factors 49
Train Control and Communications Line Segments Avoidability factor
assigned Range of percentage of network
ARTC Comment
Parkes [Updated to 0% as per the model]
17.6% 1.42% Our model shows Parkes – Cootamundra allocation as 50%. There are no segments showing 17.6%?
Appleton Dock Jct - Appleton Dock, Dry Creek - Outer Harbour, Moss Vale - Unanderra, Tarcoola – APT Interface, Pt Augusta - Whyalla,
20% 0.02% to 0.48% See comment below. Small segments on shared board. Very little short term avoidability, may offer some rationalisation opportunity in the long run.
Parkes – Cootamundra 50% Medium segment (shared board), but all in NSW so only moderate avoidable. A lesser amount could be argued.
Islington – Queensland Border 60% 17.60% Major segment (one or more boards)but in NSW so lower avoidability assumed than non-NSW major segments.
Tottenham – Macarthur 70% 29.25% Major segment (more than one board), part in NSW. Part non-NSW so higher avoidability assumed.
Crystal Brook – Parkes, Dry Creek - Spencer Street, Dry Creek - Parkeston
80% 7.9% to 26.45% Major segments (more than one board) and non-NSW so highest avoidability assumed.
How can you so precise (17.6%)? Why are similar lengths 60%,70% and 80% avoidable?
Our model shows Parkes – Cootamundra allocation as 50%. There are no segments showing 17.6%? Factors to be considered are both the size of the segment and the extent to which train control is conducted specifically with a segment. For example smaller and medium segments can be combined and controlled on a single train control board. Removing a smaller segment will not avoid the board in the short run, but may lead to rationalisation opportunities in the long run. For the larger segments, one or more boards can control these and can be closed down more easily with removal of the segment. Another consideration is the location and scope of train control centres. ARTC has centres in Adelaide (covering a substantial part of the network (non-NSW) but where network is simpler and offering more opportunities for rationalisation on closure of segments, Junee (covering the smaller but more complex southern part of NSW), and Newcastle (covering Islington – Queensland Border and more complex Newcastle area). As such costs could be considered slightly more difficult to avoid in NSW compared to non-NSW.
ARTC response to avoidability factors 50
Finance, Procurement, Risk and Safety Line Segments Avoidability factor
assigned Range of percentage of network
ARTC Comment
Appleton Dock Jct - Appleton Dock, Dry Creek - Outer Harbour, Moss Vale - Unanderra, Tarcoola – APT Interface, Pt Augusta - Whyalla, Parkes – Cootamundra
0% 0.02% to 0.48% Smaller segments. Non-trunk. Removal unlikely to affect this cost area expenditure significantly. Treated same as Corporate above.
Parkes [Updated to 0% as per the model]
17.6% 1.42% Our model shows Parkes – Cootamundra allocation as 0% . There are no segments showing 17.6%?
Dry Creek – Spencer Street, Dry Creek – Parkeston Crystal Brook – Parkes, Tottenham – Macarthur, Islington – Queensland Border
20% 7.9% to 29.25% Major trunk segments. Removal would impact on this cost area expenditure, but still marginally due to fixed nature of these costs.
No comment other than precision of estimate (17.6% again)?
Office of the Chief Operating Officer Line Segments Avoidability factor
assigned Range of percentage of network
ARTC Comment
Appleton Dock Jct - Appleton Dock, Dry Creek - Outer Harbour, Moss Vale - Unanderra, Tarcoola – APT Interface, Pt Augusta - Whyalla, Parkes – Cootamundra
0.0% 0.02% to 1.58% High level management of asset management and operations and related to whole of network. Could be considered as corporate in nature and same allocation factors applied as Corporate above.
Dry Creek – Spencer Street, Dry Creek – Parkeston Crystal Brook – Parkes, Tottenham – Macarthur,
20% 9.4% to 39.5% High level management of asset management and operations and related to whole of network. Could be considered as corporate in nature and same allocation factors applied as Corporate above.
ARTC response to avoidability factors 51
Islington – Queensland Border
No comment Signalling and Communication Line Segments Avoidability factor
50% 0.02% to 0.48% Small segments in NSW and very small segments outside NSW. Assumed to offer least opportunity for avoidability. See below. An argument for greater avoidability of expenditure for non-NSW segments could be made.
Islington – Queensland Border 75% 17.60% Major segment, but in NSW, so moderate avoidability assumed. See below.
Crystal Brook - Parkes, Tottenham – Macarthur
80% 7.9% to 29.25% Major segment, but in NSW and non-NSW, so higher avoidability assumed. See below.
Tarcoola – APT Interface, Pt Augusta - Whyalla, Dry Creek - Spencer Street, Dry Creek - Parkeston
100% 0.02% to 26.45% Major and minor segments entirely outside NSW where extent of resource sharing is not a significant issue under external contracting. See below.
Why is there considerable variation in the avoidability factors across similar lines?
Most S&C maintenance expenditure would be directly identifiable with a segment, particularly if the segment is large. There is however, shared maintenance equipment and resources that would not be avoidable in the short run, and maybe offers opportunity for rationalisation in the long run. A greater proportion of expenditure is likely arise from shared resources for smaller segments and occurs primarily in NSW where this activity is internal, more complex and over a smaller area. Outside of NSW, expenditure is external contract, so inability to avoid shared resources in not a significant issue for ARTC. As such smaller segments offer less opportunity for avoidability of expenditure, and the NSW offer less opportunity for avoidability than non-NSW.
Small segments in NSW and very small segments outside NSW. Assumed to offer least opportunity for avoidability. See below. An argument for greater avoidability of expenditure for non-NSW segments could be made.
Islington – Queensland Border 75% 1.15% & 11.69%
0.26% & 11.85%
Major segment, but in NSW, so moderate avoidability assumed. See below.
Crystal Brook - Parkes, Tottenham – Macarthur
80% 16.65% & 20.93%
9.39% & 18.97%
Major segment, but in NSW and non-NSW, so higher avoidability assumed. See below.
Tarcoola – APT Interface, Pt Augusta - Whyalla, Dry Creek - Spencer Street, Dry Creek - Parkeston
100% 13.39% to 31.77%
17.63% to 39.50%
Major and minor segments entirely outside NSW where extent of resource sharing is not a significant issue under external contracting. See below.
Why is there considerable variation in the avoidability factors across similar lines?
Most track and right of way maintenance expenditure would be directly identifiable with a segment, particularly if the segment is large. There is however, shared maintenance equipment and resources that would not be avoidable in the short run, and maybe offers opportunity for rationalisation in the long run. A greater proportion of expenditure is likely arise from shared resources for smaller segments and occurs primarily in NSW where this activity is internal, more complex and over a smaller area. Outside of NSW, expenditure is external contract, so inability to avoid shared resources in not a significant issue for ARTC. Further, outside of NSW, the contract structure means that external maintenance support supervisory activity is charged through the contract and identified with a segment. As such smaller segments offer less opportunity for avoidability of expenditure, and NSW offers less opportunity for avoidability than non-NSW.
Appendix C Summary of Terms of Reference (ToR)
ARTC’s Operations and Maintenance (O & M) Expenditure and Cost Allocation Assessment The consultant is to prepare a draft and a final report to the ACCC detailing its approach and findings of its assessment and a detailed discussion which must include the following: 1. Operations and Maintenance (O & M) Expenditure
a) identify the key differences in O&M costs between the ACCC’s 2001 assessment by Currie & Brown compared to ARTC’s current proposed O&M expenditure in particular with respect to the Interstate versus Hunter Valley assets;
b) explain how ARTC developed its 2007 O&M costs. In particular, compare ARTC’s O&M costs and rates to relevant efficiency benchmarks; and
c) make comment on the reasonableness of ARTC’s 2007 O&M costs.
2. Cost and Asset Allocation
Explain ARTC’s approach to cost and asset allocation to the various “segments”. In particular, the report must: a) review ARTC’s methodology for allocating costs and assets to individual network segments as
set out in ARTC’s access undertaking and supporting documentation; b) identify the allocation of assets between Interstate and Hunter Valley systems and comment on
their reasonableness; c) comment on the reasonableness of the cost and asset allocation approach and any
assumptions underlying the estimation (for example see 4.4 (g) of the ARTC undertaking).
Deliverables and Timing
An electronic copy (in Word format) and a hard copy of the reports must be sent to the e-mail/mail address detailed under ACCC contacts (see below). Two final reports must be prepared, one with any confidential information excised out so that it may be placed on the ACCC’s website and another version with confidential information for the ACCC’s purposes.
The ACCC requires a draft report and brief presentation.
Communication and Interim Reports
The consultant should:
a) liaise with the ACCC on the progress of work and major issues as they arise;
b) present the findings of the draft report to the ACCC project team; and
c) address ACCC comments/questions in preparing the final reports.
Resources
Upon commencement of the consultancy, a copy of ARTC’s financial model is available.
54
ACCC Contacts
Mr Dominic L’Huillier Director of Transport Regulatory Australian Competition and Consumer Commission GPO Box 520J MELBOURNE VIC 3001