Murat Yilmaz Philip T. Krein Murat Yilmaz Philip T. Krein Review of Charging Power Levels and Infrastructure for Plug-In Electric and Hybrid Vehicles and Commentary on Unidirectional Charging University of Illinois at Urbana-Champaign Department of Electrical and Computer Engineering 07 March, 2012, Greenville South Carolina, USA 2012 IEEE International Electrical Vehicle Conference (IEVC’12) 2012 IEEE International Electrical Vehicle Conference (IEVC’12)
Transcript
Murat Yilmaz Philip T. KreinMurat Yilmaz Philip T. Krein
Review of Charging Power Levels and Infrastructure
for Plug-In Electric and Hybrid Vehicles and
Commentary on Unidirectional ChargingUniversity of Illinois at Urbana-Champaign
Department of Electrical and Computer Engineering
07 March, 2012, Greenville South Carolina, USA
2012 IEEE International Electrical Vehicle Conference (IEVC’12)
2012 IEEE International Electrical Vehicle Conference (IEVC’12)
Introduction Charger Power Levels Unidirectional and Bidirectional Chargers Integrated Chargers Conductive and Inductive Charging Conclusion
OverviewOverview
• Official U.S. domestic goal one million PHEVs by 2015• IEEE, SAE and the Infrastructure Working Council
(IWC) preparing standards for utility/customer interface.• EVSE: electric vehicle supply equipment• Barriers
high cost and limited cycle life of batteriescomplications of chargerslack of charging infrastructure.
Chevrolet Volt PHEVhttp://gm-volt.com
Toyota Prius PHEVhttp://en.wikipedia.org
Tesla Roadster EVhttp://www.stefanoparis.com
Nissan Leaf EVhttp://www.nytimes.com
4
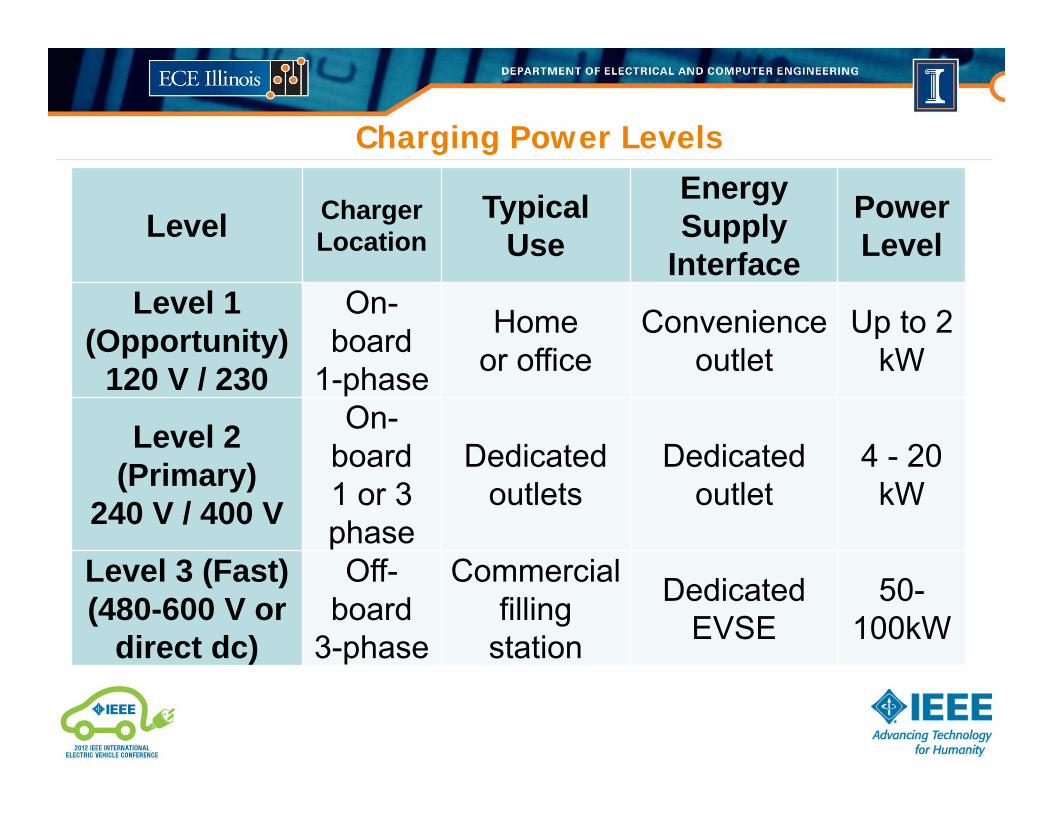
Level ChargerLocation
Typical Use
Energy Supply
Interface
Power Level
Level 1 (Opportunity)
120 V / 230
On-board
1-phase
Homeor office
Convenience outlet
Up to 2 kW
Level 2 (Primary)
240 V / 400 V
On-board1 or 3 phase
Dedicated outlets
Dedicated outlet
4 - 20 kW
Level 3 (Fast)(480-600 V or
direct dc)
Off-board
3-phase
Commercialfilling
station
Dedicated EVSE
50-100kW
Charging Power Levels
Charging Power Levels and Infrastructure
• Overnight or at-work charging: Level 1. • Typical charging: Level 2. Usually single phase • Level 3 and DC fast charging for commercial
and public filling stations. • Public infrastructure discussion
emphasizes Level 2.• Wide availability of chargers can
address range anxiety.
news.medill.northwestern.edu
Charger cost, location
• Level 1 charging: cost reported as $500 - $900 but usually integrated into vehicle.
• Level 2 charging: cost reported as $1000 - $3000.• Level 3 charging: cost reported as $30,000 - $160,000.
J1772 “combo connector” for ac or dc Level 1 and Level 2 chargingSAE International, “SAE’s J1772 ’combo connector’ for ac and dc charging advances with IEEE’s help,” retrieved Sept 8, 2011 [Online]. Available: http://ev.sae.org/article/10128
7
Basic Requirements• An EV charger must minimize power quality impact• Draw current at high power factor to maximize power
from an outlet.• Boost active PFC topology is a typical solution.• Interleaving can reduce ripple and inductor size.• Multilevel converters: suitable for Level 3 chargers.
Battery Chargers for Plug-in Vehicles
Interleaved unidirectional charger topology F. Musavi, M. Edington, W. Eberle, and W. G. Dunford, “Evaluation and Efficiency Comparison of Front End AC-DC Plug-in Hybrid ChargerTopologies,” IEEE Trans. Smart Grid, vol. 3, no. 1, pp. 413-421, March 2012.
Single-phase unidirectional multilevel chargerB. Singh, B. N. Singh, A. Chandra, K. Al-Haddad, A. Pandey and D. P. Kothari, “A Review of Single-Phase Improved Power Quality AC–DCConverters,” IEEE Trans. Ind. Electron., vol. 50, no. 5, pp. 962-981, 2003.
9
Battery Chargers for Plug-in Vehicles• Half-bridge circuits have fewer
components and lower cost, but high component stresses.
• Full-bridge circuits cost more inexchange for lower component stresses.
On/off-board charging Traction drive: 30 kW and up
On-board chargers: size and weight constraints limit power. Off-board disadvantages: cost of redundant power electronics, risk of vandalism, and added clutter in an urban environment.
11
Power Flow
Unidirectional charging:Simplifies interconnection issues Avoids extra battery degradationSimple control – may make feeder management easyReactive power supportWith high penetration of EVs: meets most utility objectives
Level 1 unidirectional full-bridge series resonant chargerG. Y. Choe, J.S. Kim, B. K. Lee, C. Y. Won, and T.W. Lee, “A Bi-directional Battery Charger for ElectricVehicles Using Photovoltaic PCS Systems,” in Proc. IEEE VPPC, 2010.
The “energy load” conceptA load whose energy needs have no flexibility n quantity– Energy needs must be met– Utility: obliged to meet demand
EVs are energy loads– No flexibility in energy demand (or time of
delivery) from utility’s stand point– Energy guarantee must be assured
Role of dynamic pricing
4 6 8 10 12 14 16 18 20 22 2424-hour period
• It should be more expensive to charge an EV during high cost periods
• Dynamic pricing offers incentives to use electricity effectively− Reflects wholesale
market conditions− EV charging should
reflect prevailing market conditions
Implementing unidirectional V2GCoordinated charging of EVs is necessary– Power-draw management– Avoid local feeder overloads
Charging-time flexibility is crucial– Inherently tied into the charging rate level of the
respective EV– But still enforce energy load concept
Charging strategiesPrice-based with the objective of minimizing charging costCharging based on price-sensitive energy bidding.
il real-time, oneth,ng 2007
Price-based charging
max
0
( ) ( )
( )
min
des
k
Hk k
k hH
kh
k k k k
E
P P
C P P t
P t
C P C P
• Cost function weight γk penalizes hourly power draw− It should be more
expensive to charge at a higher rate (encourages slackness)
− Limited to retail price• When αk =0, an EV can charge
at its maximum without cost penalty
• V2G benefits are obtained with the resulting power-draw schedule
00 0( ), 0k k kC P P P P
oblem formulation
ith retail rate function
he utility sets the rate ructure but decisions are
made by the EV owner
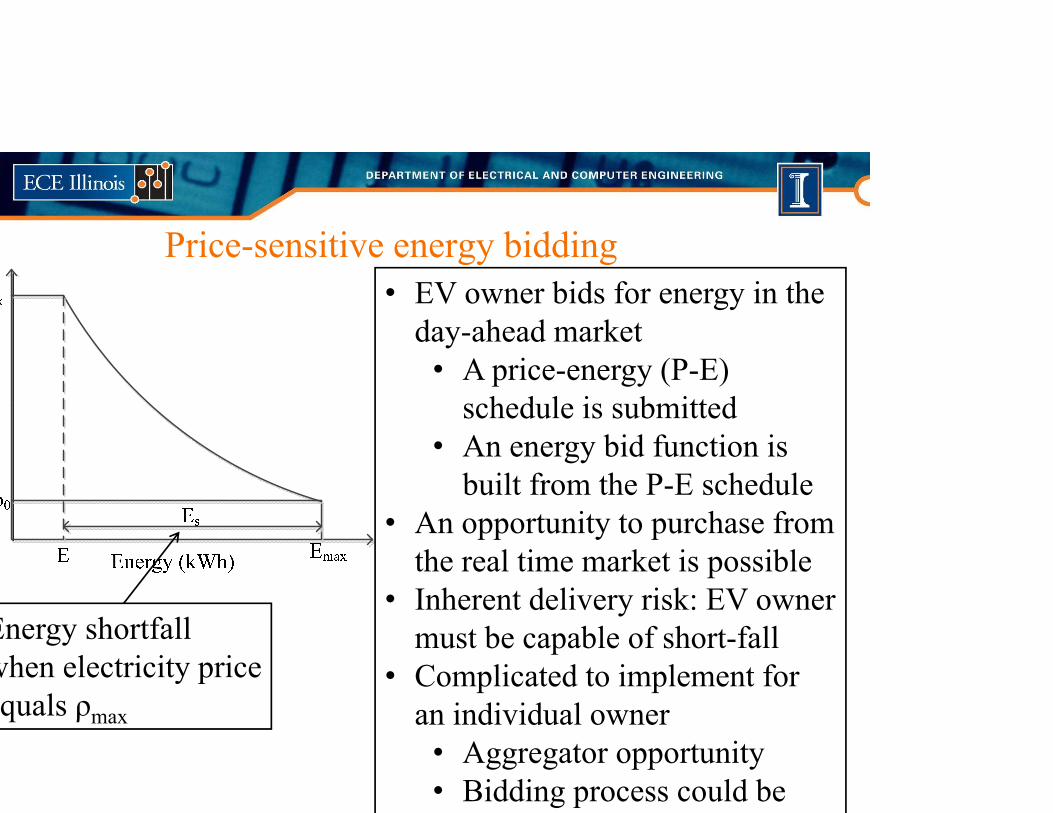
Price-sensitive energy bidding• EV owner bids for energy in the
day-ahead market• A price-energy (P-E)
schedule is submitted• An energy bid function is
built from the P-E schedule• An opportunity to purchase from
the real time market is possible• Inherent delivery risk: EV owner
must be capable of short-fall• Complicated to implement for
an individual owner• Aggregator opportunity• Bidding process could be
Energy shortfall when electricity price quals ρmax
V2G benefit: active power regulation• Dynamic charging control• Regulation services:
modulate charging rate about scheduled levels
• The actual EV charge must integrate to the scheduled energy Energy guarantee
must be enforced• Deviations from the POP
provide regulation capacity Extra revenue based
on this capacity
Results: cost benefits to EV owners for flexibility
9am 10am 11am 12pm 1pm 2pm 3pm 4pm 5pm0
0.5
1
1.5
2
2.5
3
3.5
Charging period
Char
ging
pow
er [k
W]
=0=0.1=0.5=0.9=1
=1
=0mulation parameters:0 kWh requested daily.6 kW max charge ratex 10 h charging periods
Charge above 3.3 kW enalized up to full retail
500
600
700
800
900
Ann
ual c
harg
ing
cost
($)
Hourly pricingRetail rate
$428
$868implements the desired arging time flexibility nnual cost savings of $440 courages power-draw flex
Results: cost benefits to utilities due to flexibility
Simulation setup:• IEEE 118-bus system test
bed• 2009 historical data from
New England ISO• EV penetration levels of
20% relative to the load energy at each node
• Each EV requests 20 kWh in two intervals
• The OPF problem is solved to determine the MCP
1 2 3 40
1
2
3
4
5
6
7
Time period (Quarterly)%
Cos
t Red
uctio
n
=0.5=2
With higher power-draw slackness (α=2), and 20% EV penetration, 7% cost reduction is observed in the third quarter
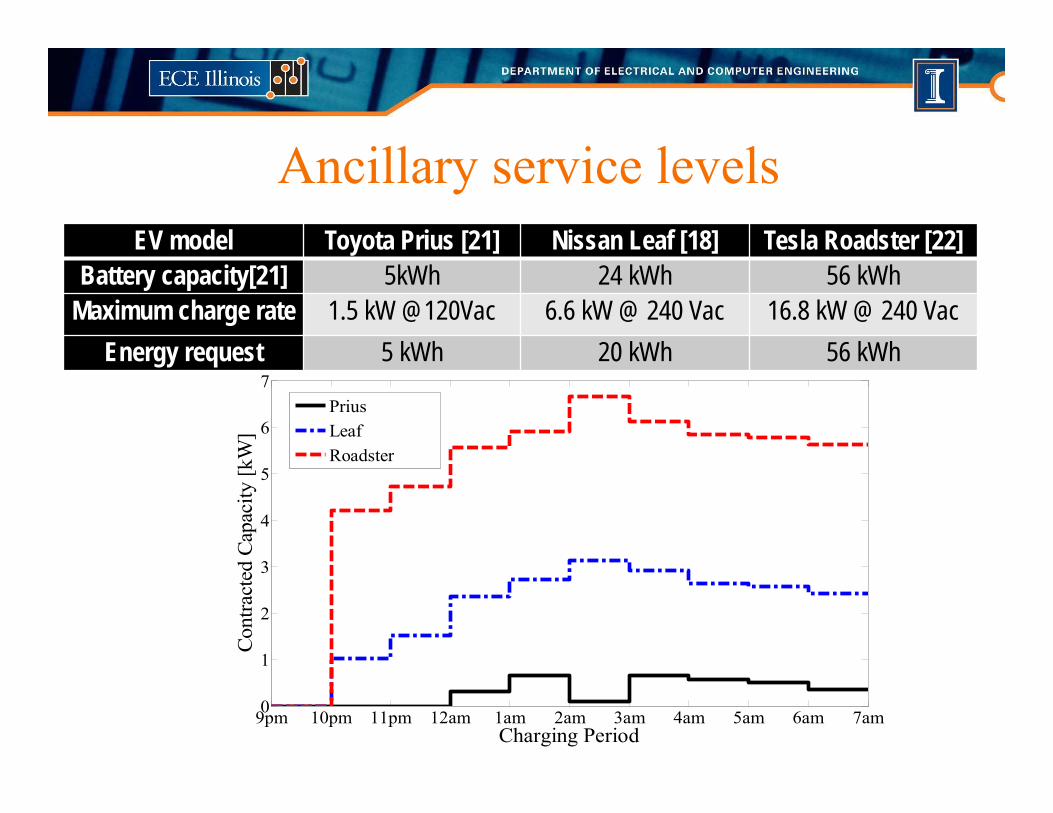
Ancillary service levels• Ancillary service levels (regulation capacity) of 3 EVs with
different battery capacities are investigated• The EVs are connected from 9 pm to 7 am• Power draw is scheduled hour by hour throughout the interval• Timing flexibility is crucial for an EV to
perform regulation services• The capacity of a unidirectional charging
EV to perform regulation servicesdepends on the magnitude of the energyrequest and power limits
Ancillary service levelsEV model Toyota Prius [21] Nissan Leaf [18] Tesla Roadster [22]
• A suitable charge profile ensures regulation capacity is available over the charging interval
• Notice that the profile needs no negative values -- reverse current not required
• A unidirectional charger can reap the full benefits of regulation
Revenue from regulation services
5 kWh 10 kWh 15 kWh 20 kWh0
50
100
150
Energy Request [kWh]
Ann
ual r
even
ue ($
)
5kWh 10kWh 15kWh 20kWh0
200
400
600
800
1000
Daily energy demand[kWh]
Ann
ual c
harg
ing
cost
($)
(a)
=0=2
$360
$868
5kWh 10kWh 15kWh 20kWh0
200
400
600
800
Daily energy request[kWh]
Ann
ual c
harg
ing
cost
($)
(b)
=0=2
$229
• Revenue from regulation services yields 21% in cost reduction
• A higher energy request will reap more revenue: more capacity
• Slackness has a more profound cost impact on an EV owner with higher energy demand
Unidirectional vs. bidirectional: battery degradation cost
• Assuming a 10 h interval and 20 kWh demand, a max charge and discharge rate of 6.6 kW, and an RMCP of $0.02/kWh, annual regulation revenue is $480.
• For bidirectional, a conservative battery cost estimate leads to battery degradation cost of about $0.014/kWh/year.
– This yields $335/year in degradation cost• A bidirectional charger might provide up to
12% higher revenue than a unidirectionalcharger ($130 annual revenue).
Bidirectional chargers support full vehicle-to-grid (V2G) operation, and power stabilization.• How to pay for extra
battery degradation, the charger, metering, etc.?
• Communications, anti-islanding. • Not expected for Level 1 or Level 3.
Power Flow
Integrated Chargers
• Integration of the charging function with the electric drive and motor was developed by 1985 and patented by Rippel and Cocconi.
• Use motor windings for inductors. The motor drive inverter serves as a bidirectional ac-dc converter.
• The main disadvantage is control complexity.
Integrated Chargers
Integrated battery charger: the traction drive is transformed into a boost PFC battery charger
G. Pellegrino, E. Armando, and P. Guglielmi, “An Integral Battery Charger with Power Factor Correction for Electriccooter,” IEEE Trans. Power Electron., vol. 25, no. 3, pp. 751-759, 2010.
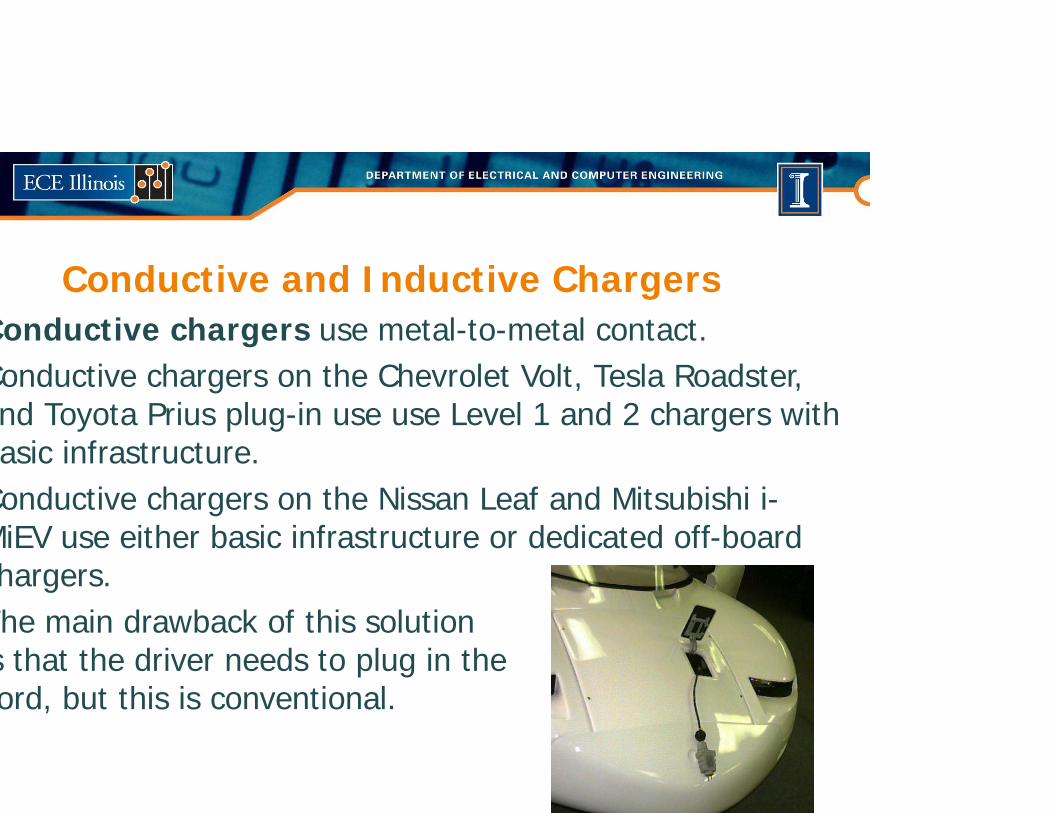
Conductive and Inductive ChargersConductive chargers use metal-to-metal contact.Conductive chargers on the Chevrolet Volt, Tesla Roadster, nd Toyota Prius plug-in use use Level 1 and 2 chargers with asic infrastructure.
Conductive chargers on the Nissan Leaf and Mitsubishi i-MiEV use either basic infrastructure or dedicated off-board hargers.
The main drawback of this solutions that the driver needs to plug in theord, but this is conventional.
Conductive and Inductive Chargersnductive power transfer (IPT) of EVs is based on
magnetic contactless power transfer. as been tested for Level 1 and 2, stationary or moving. ords are eliminated. A recommended practice for EV ductive charging was published by the SAE in 1995. isadvantages include relatively low efficiency and power, gh complexity and cost.
PT principles follow transformers,though most have low magneticoupling and high leakage flux.
engadget.com
Stationary Inductive Chargers
Inductively coupled stationary charger and GM EV1 systemtionary inductive charging:
Primary and secondary transducers1 version: Primary transducer is a paddleSecondary transducer is vehicle charge port.
IPT in roadbed is an old concept. Maximum power with perfect alignment and resonant tuning. Challenges of contactless roadbed charging include:
• low coupling • loop losses• high reactive current• misalignment effects• large air gap• stray field coupling