REVIEW OF COLIPHAGES AS POSSIBLE INDICATORS OF FECAL CONTAMINATION FOR AMBIENT WATER QUALITY 820-R-15-098 EPA Office of Water Office of Science and Technology Health and Ecological Criteria Division April 17, 2015
Transcript
REVIEW OF COLIPHAGES AS POSSIBLE
INDICATORS OF FECAL CONTAMINATION
FOR AMBIENT WATER QUALITY
820-R-15-098
EPA Office of Water
Office of Science and Technology
Health and Ecological Criteria Division
April 17, 2015
i
NOTICES
This document has been drafted and approved for publication by the Health and Ecological
Criteria Division, Office of Science and Technology, United States (U.S.) Environmental
Protection Agency (EPA), and is approved for publication. Mention of trade names or
commercial products does not constitute endorsement or recommendation for use.
ii
ACKNOWLEDGMENTS
The development of this criteria document was made possible through an effort led by Sharon
Nappier, EPA Project Manager, EPA, Office of Science and Technology, Office of Water. EPA
acknowledges the valuable contributions of EPA Internal Technical Reviewers who reviewed
this document: Jamie Strong and Elizabeth Doyle.
The project described here was managed by the Office of Science and Technology, Office of
Water, EPA under EPA Contract EP-C-11-005 to ICF International. EPA also wishes to thank
The External Peer Review was managed by the Office of Science and Technology, Office of
Water, EPA under EPA Contract No. EP-C-13-010 to Versar, Inc. The following professionals
were part of the External Peer Review Workgroup that provided excellent technical and
scientific review on the Draft regarding the content and technical approach in response to EPA
Charge to the Peer Reviewers:
Valerie J. Harwood
University of South Florida
Tampa, Florida 33620
Sunny Jiang
University of California, Irvine
Irvine, California 92697
Mark D. Sobsey
University of North Carolina, Chapel Hill
Chapel Hill, NC 27599
EPA reviewed and incorporated their comments, where appropriate, to develop this literature
review.
Potential areas for conflict of interest were investigated with the Peer Reviewers, including a
review of their current affiliations. No conflicts of interest were identified.
iv
TABLE OF CONTENTS
Notices ............................................................................................................................................. i
Acknowledgments........................................................................................................................... ii
External Peer Review Workgroup ................................................................................................. iii
Table of Contents ........................................................................................................................... iv
Tables ............................................................................................................................................. vi
Figures........................................................................................................................................... vii
APPENDIX A: Literature Search Strategy and Summary of Literature Search Results ............ 110
APPENDIX B: Coliphage and NoV Densities during Wastewater Treatment .......................... 114
vi
Tables
Table 1. Morphology of a subsection of bacteriophages. ............................................................... 8 Table 2. Morphology of human enteric viruses that may be transmitted in aquatic
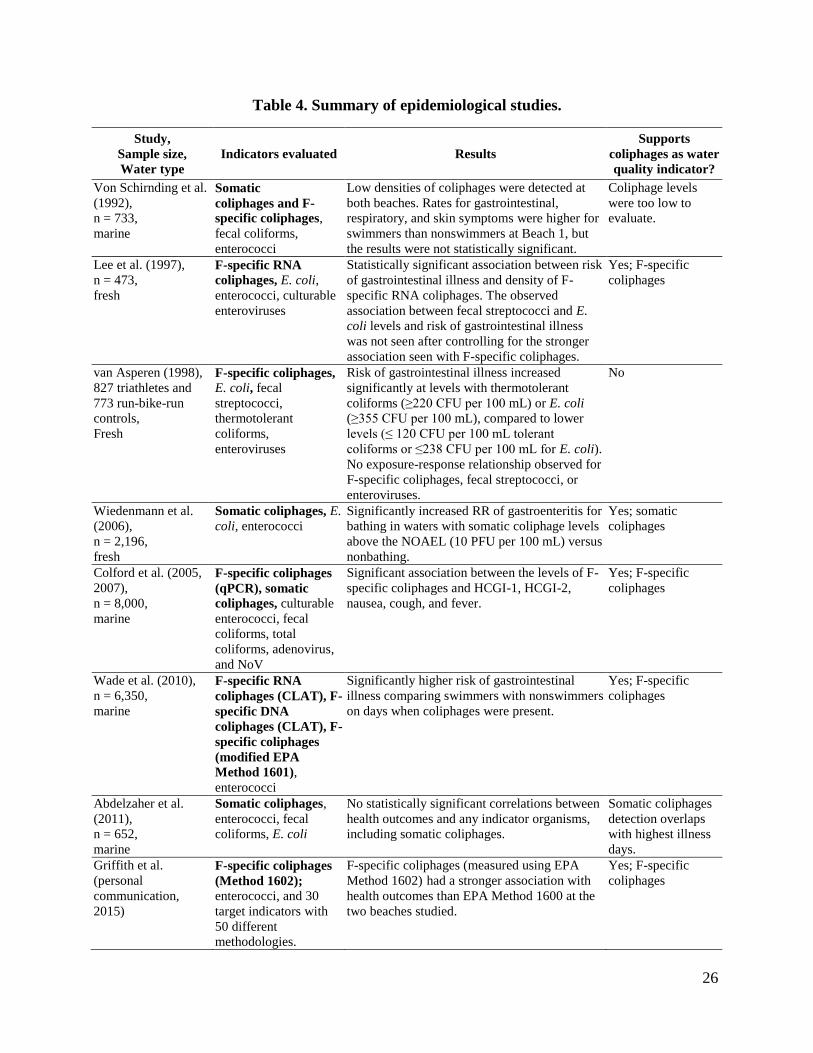
environments. ................................................................................................................... 9 Table 3. Advantages and disadvantages of methods to detect coliphages. ................................... 14 Table 4. Summary of epidemiological studies. ............................................................................. 26 Table 5. Number of cases and outcome of the logistical regression analysis of the
association between coliphages and pathogens in water. ............................................... 28 Table 6. Logistic regression of the association between indicators and different pathogens
in water. .......................................................................................................................... 29 Table 7. Comparison of common methods for the detection of pathogenic human enteric
viruses from environmental sources. .............................................................................. 30
Table 8. Summary table of coliphages – virus correlations in ambient water. ............................. 33 Table 9. Comparison of mean exponential decay rates of coliphages, fecal indicators and
human viruses in different media at different temperatures. .......................................... 40 Table 10. Mean exponential decay rates of coliphages and fecal indicators in fresh river
water contaminated with raw sewage or effluent under different light conditions. ....... 42 Table 11. Comparison of mean exponential decay rates of coliphages and human viruses
under different light conditions. ..................................................................................... 43 Table 12. Comparison of mean exponential decay rates of coliphages and MNV at
different concentrations of salt and at different temperatures. ....................................... 47 Table 13. Summary of environmental factors influencing viral inactivation in aquatic
environments. ................................................................................................................. 52 Table 14. Log10 removals of enteric viruses and indicator organisms. ......................................... 60 Table 15. Virus densities in secondary treated wastewater samples from five Australian
WWTPs. ......................................................................................................................... 62 Table 16. Average (and percent positive) microorganism effluent densities in a WWTP
with free chlorine treatment of nitrified and filtered secondary wastewater. ................. 67 Table 17. Log10 reduction of FIB, enteric virus, and F-specific coliphages in sewage
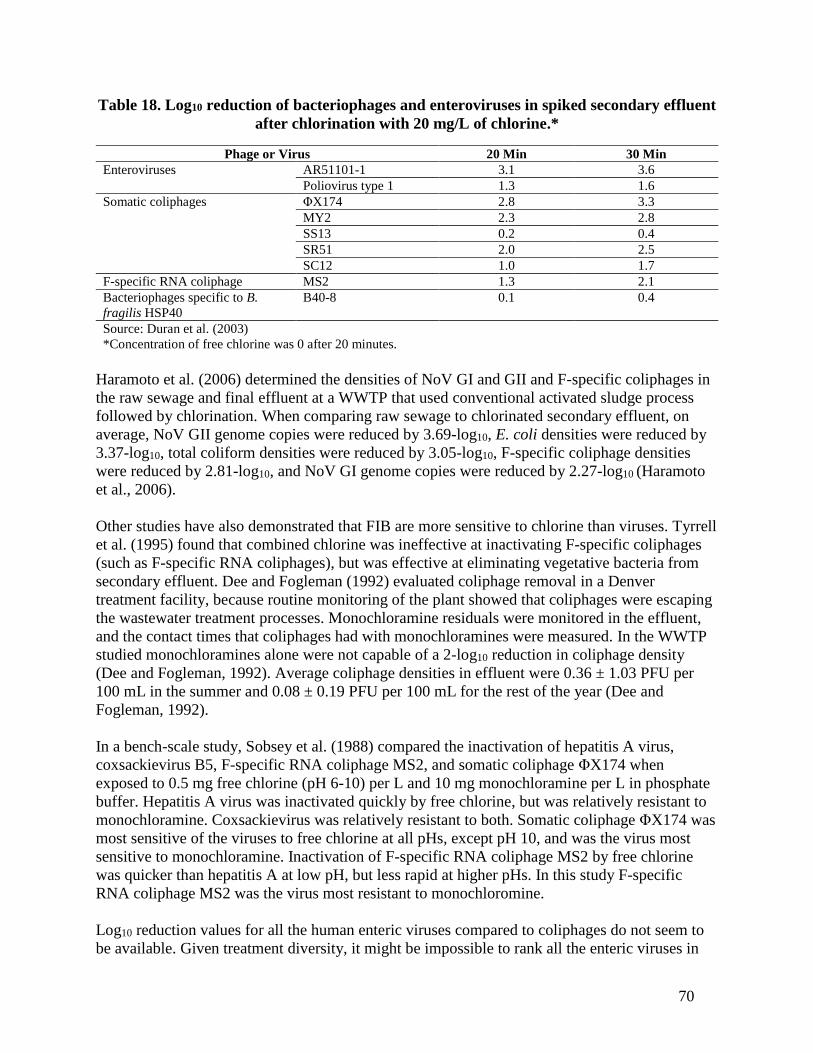
matrix due to chlorine (adapted from Tree et al., 2003). ................................................ 69 Table 18. Log10 reduction of bacteriophages and enteroviruses in spiked secondary
effluent after chlorination with 20 mg/L of chlorine.* ................................................... 70 Table 19. Inactivation of FIB and F-specific RNA coliphage in ozone disinfected water.* ........ 72 Table 20. Average (and percent positive) microorganism densities in a WWTP with UV
treatment of filtered secondary effluent (n=5). ............................................................... 73 Table 21. UVC inactivation of F-specific RNA coliphage MS2. ................................................. 74 Table 22. Log10 reduction in coliphages and enteric viruses in secondary effluent after
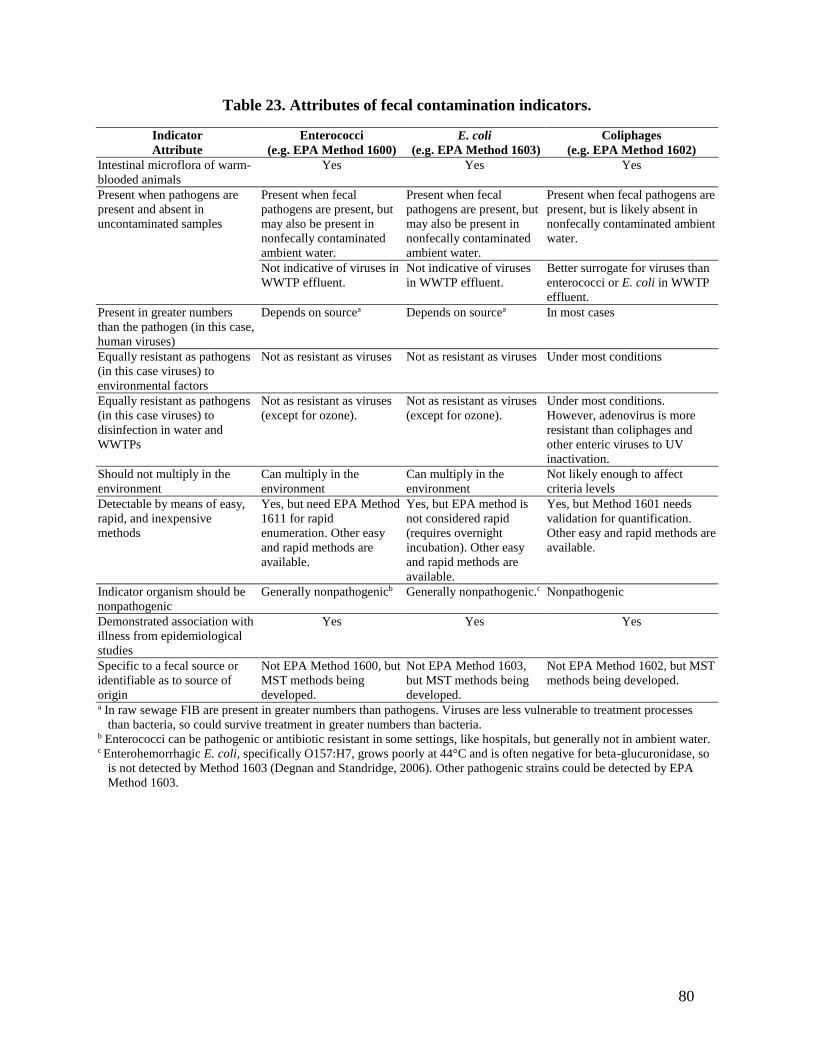
lagooning in sunlight or UVC treatment. ....................................................................... 76 Table 23. Attributes of fecal contamination indicators. ................................................................ 80 Table A. Coliphage and NoV densities during wastewater treatment. ....................................... 114
vii
Figures
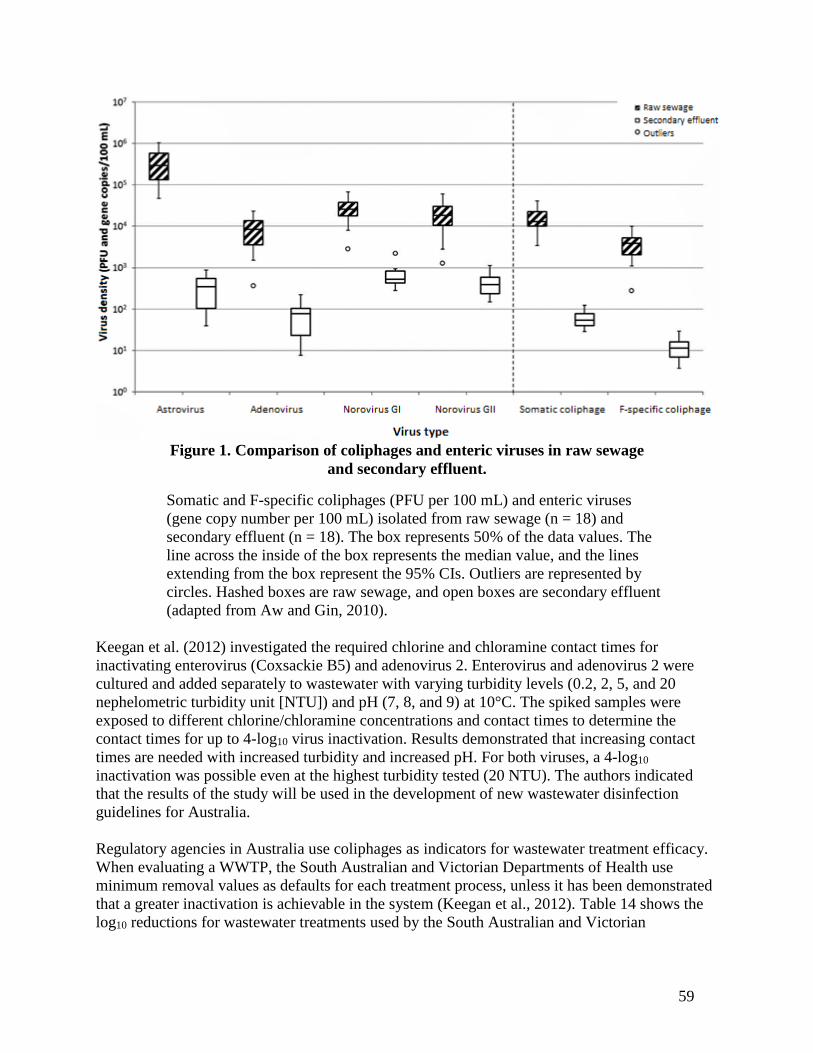
Figure 1. Comparison of coliphage and enteric viruses in raw sewage and secondary
sand (Zaiss 1981; Sogaard, 1983; Payment et al., 1988; Araujo et al., 1997; Paul et al., 1997;
Gantzer et al., 1998; Davies et al., 2003; Bonilla et al., 2007; Charles et al., 2009; Haramoto et
al., 2009, 2011; Payment and Locas, 2011; Wu et al., 2011).
Studies investigating the presence of coliphages and viruses in different types of environmental
waters are described below (Section 4.1). A review of the literature shows that generalizations
across studies are difficult because the detection of microorganisms from fecal contamination,
including viruses and coliphages are inconsistent and dependent on a number of important
factors (WHO, 2001). Generally, when any two studies on coliphages and viruses are compared,
there are differences between the type of detection method used – both for the coliphages and the
pathogen. In addition to different detection methods, the differences between studies might
include the following: type of coliphage tested (i.e., somatic, F-specific DNA, F-specific RNA);
specific pathogens tested; number of samples taken; volume of sample taken; level of
contamination; type of environment from which samples were taken; location of the
environment; resistance of the coliphages and pathogens to environmental stressors and growth;
transport characteristics of the coliphages and pathogens; carriage rates and shedding patterns of
the coliphages and pathogens among host populations; presence of host populations; waste
management practices; rainfall; time of year; and statistical analyses used (WHO, 2001; Bonilla
et al., 2007; Wu et al., 2011). Given these differences along with the variable occurrence of
viruses in fecal sources, it is not surprising that the presence of fecal indicators including
coliphages and the presence of enteric viruses varies between studies.
4.1. Associations between Coliphages and Viruses
Some studies have reported an association between the presence of coliphages and human
viruses (Havelaar et al., 1993; Jiang et al., 2001; Ballester et al., 2005), while other studies have
found no association between their presence (Ibarluzea et al., 2007; Jiang et al., 2007; Boehm et
al., 2009; Viau et al., 2011b). Meta-analyses of peer-reviewed studies looking at the occurrence
of microbial indicators and pathogens, including coliphages and viruses, can give an overview of
the field.
In one recent study, Wu et al. (2011) analyzed a broad range of 540 indicator-pathogen pairs
from studies conducted between 1970 and 2009 in a variety of water environments including:
rivers, lakes, reservoirs, ponds, estuaries, costal and marine waters, and wastewater (Wu et al.,
2011). Groundwaters, treated drinking waters, and sand/sediments were not included in the
study. The data were analyzed using a logistic regression model adjusted for indicator classes,
pathogen classes, water types, pathogen sources, sample size, the number of samples with
pathogens, the detection method, year of publication, and statistical method. The association is
presented as an OR, where an OR greater than one signifies that the presence of the indicator is
associated with the presence of the pathogen. Not surprisingly, no single indicator was
28
significantly correlated with all the pathogens evaluated.6 Coliphages (F-specific and somatic
together) and F-specific coliphage densities were more likely to be correlated with pathogens
than the other traditional indicators (E. coli, enterococci, and fecal coliforms) (Wu et al., 2011).
The associations between coliphages and pathogens were not statistically significant (OR = 1.29,
p-value = 0.186 and OR = 1.27, p-value = 0.625, respectively). See Table 5 below for specific
OR and p-values between different categories of coliphages or indicators and pathogens in water.
Silva et al. (2010) also found that in water samples collected from 16 beaches along the
Portuguese coast there was no relationship between viral detection (hepatitis A and NoV) and the
European regulatory-based bacterial indicators total coliform, fecal coliform, E. coli, and fecal
enterococci.
Table 5. Number of cases and outcome of the logistical regression analysis of the
association between coliphages and pathogens in water.
Fecal indicator Number of casesa
OR Value p-Value 95% Confidence limits Uncorrelated Correlated
Coliphagesb 45 40 1.29 0.186 0.82 2.05
F-specific
coliphages
24 16 1.27 0.625 0.48 3.35
F-specific RNA
coliphages
15 8 0.75 0.518 0.31 1.80
Somatic coliphages 20 10 0.70 0.364 0.32 1.52
E. coli 29 11 0.52 0.070 0.25 1.06
Enterococci 34 12 0.47 0.032 0.24 0.94
Fecal coliforms 78 48 0.84 0.405 0.56 1.27
Source: Based on Table 2 in Wu et al. (2011). a An individual case of an indicator-pathogen pair represents a statistical analysis of a published dataset of one
indicator type with one pathogen type where the methods of statistical analysis, correlation coefficients, and p-
values were reported. b Includes F-specific and somatic coliphages.
OR values above 1 are in bold.
Studies have evaluated the association between pathogens and different subsets of coliphages
(i.e., somatic, F-specific DNA and RNA) and report variable results which are influenced by the
environments in which the studies are conducted (Ballester et al., 2005; Savichtcheva and Okabe,
2006; Payment and Locas, 2011). For example, Wu et al. (2011) report that no indicator-
pathogen pairs were significantly associated, except for F-specific coliphage-adenovirus pairs
(OR = 25.5, p-value = 0.019) (see Table 6 below). Wu et al. (2011) also found that the
association between indicators and pathogens is significantly stronger in brackish and saline
water than in freshwater. Therefore, the papers in this chapter are separated into those studies
conducted in freshwater and those conducted in saline or brackish water. Because Wu et al.
(2011) conducted a meta-analysis, which is summarized above, that includes most of the studies
comparing coliphages to human viruses, only a few of the illustrative studies that compare
coliphages to human viruses in ambient water are summarized in Sections 4.1.1 and 4.1.2 below.
6 Individual articles evaluated different pathogens. Pathogens (and pathogen genes) paired with indicators included
sapoviruses, enteroviruses, human enteric viruses, filamentous fungi, yeasts, and Candida albicans.
29
Table 6. Logistic regression of the association between indicators and different pathogens
in water.
Pathogens
Indicators
F-specific coliphages
OR value (p-value);
[95% Confidence
Limits]
Somatic coliphages
OR value (p-value);
[95% Confidence
Limits]
E. coli;
[95% Confidence
Limits]
Enterococci;
[95% Confidence
Limits]
Adenoviruses 25.5 (p = 0.019);
[1.72, 377.92]
1.25 (p = 0.862);
[0.10, 15.50] NR NR
Cryptosporidium
spp. NR
0.74 (p = 0.791);
[0.08, 6.97] NR
0.73 (0.700);
[0.14, 3.70]
Enteroviruses 1.2 (p = 0.810);
[0.27, 5.29] NR
1.19 (0.869);
[0.16, 8.99]
0.87 (0.858);
[0.18, 4.23]
Giardia spp. NR 1.06 (p = 0.965);
[0.09, 12.42] NR
1.06 (0.950);
[0.18, 6.36]
Note: Data are from Wu et al. (2011).
Numbers in the table are the OR values followed by the p-values in parentheses. OR values above 1 are in bold.
NR (not reported) indicates that the data were not included in the paper.
Pathogens and indicators are listed in alphabetical order.
Effects of human virus detection methods on associations between fecal indicators and
pathogens
As briefly described above in Section 2.3, there are currently numerous methods to detect human
viruses. These include culture methods, molecular methods, and a combination of the two (Fong
and Lipp, 2005). Similar to coliphage detection methods, each method has advantages and
disadvantages, which in turn affect the type of data collected, including both quantity and the
type(s) of virus(es) detected. An overview of the strengths and weaknesses of each enteric virus
detection method is shown below in Table 7. For example, according to Mocé-Llivina et al.
(2005), genomic techniques used to detect human enteroviruses and other human viruses have
detection rates from 7 to 70% and are not always consistent with the values of other methods for
enumerating the same organisms. Reasons for the variability between PCR and culture-based
techniques are due in part to: (1) PCR does not distinguish between infectious and noninfectious
viruses (i.e., live and dead viruses); (2) the high sensitivity of PCR may contribute to artifacts,
which could result in false positives; and (3) natural inhibitors in the environment may reduce or
block PCR amplification resulting in false negatives or under-representation of infectious viruses
(Fong and Lipp, 2005; Mocé-Llivina et al., 2005). It is important to keep in mind that differences
in enteric virus detection methods (see Table 7) combined with differences in coliphage
detection methods (see Table 3) may greatly affect the presence, absence and/or strength of
correlations found between coliphages and enteric viruses.
30
Table 7. Comparison of common methods for the detection of pathogenic human enteric
viruses from environmental sources.
Method Advantages Disadvantages
Cell culture Provides quantitative data; and
Infectivity can be determined.
Lengthy processing time (takes days to
weeks);
Relatively more expensive than PCR;
and
Not all viruses from environmental
samples can grow in cell culture (e.g.,
NoV).
PCR (RT-PCR) Rapid;
Can be quantitative (e.g., end point
analysis); and
Increased sensitivity and specificity
compared to cell culture.
Usually qualitative;
Inhibitors may be present in the
environmental matrix; and
Infectivity cannot be determineda.
Nested PCR
(semi-/heminested) Increased sensitivity compared to
conventional PCR; and
Can replace PCR confirmation
steps, such as hybridization.
Qualitative only;
Inhibitors may be present in the
environmental matrix;
Potential risk of carryover
contamination when transferring PCR
products; and
Infectivity cannot be determineda.
Multiplex PCR and Multiplex
RT-PCR Several types, groups, or species of
viruses can be detected in a single
reaction; and
Saves time and cost compared to
PCR.
Difficult to achieve equal sensitivity
for all targeted virus species, groups, or
types;
May produce nonspecific amplification
in environmental samples);
Inhibitors may be present in the
environmental matrix; and
Infectivity cannot be determineda.
qPCR/RT-qPCR Provides quantitative data;
Confirmation of PCR products is
not required (saves time); and
Can be done in a closed system,
which reduces risk of
contamination compared to nested
PCR.
The lower limit of quantification is
higher than the lower limit of detection,
so qPCR can be considered less
sensitive than presence/absence PCR;
Can be more affected by inhibitors
present in the environmental matrix
than culture methods; and
Infectivity cannot be determineda.
ICC-PCR and ICC-RT-PCR Improves detection of infectious
viral pathogens compared to
conventional cell culture;
Detects viruses that do not produce
cytoplasmic effects in cell culture;
and
Provides results in half the time
required for conventional cell
culture.
Less time-efficient and more costly
than direct PCR detection;
Carryover detection of DNA of
inactivated viruses inoculated onto
cultured cells is possible; and
Cannot be used for viruses that cannot
be cultured.
Note: Table modified from Table 2 in Fong and Lipp (2005). a Can determine infectivity if conducted in combination with ICC. See row on ICC-PCR and ICC-RT-PCR in table
for more details.
31
4.1.1 Coliphage – Virus Associations in Freshwater
In studies that evaluated the association between the occurrence of coliphages and viruses in
freshwater, results have varied. For example, Espinosa et al. (2009) found a strong association
between F-specific coliphages and enterovirus (p-value = 0.0182), but a weak relationship with
coliphages and rotavirus (p-value = 0.1502) and astrovirus (p-value = 0.4587) in high-altitude
surface water.
In a four-year study of surface source waters using 10 testing locations in the Netherlands,
Lodder et al. (2010) found a significant association between densities of coliphages (F-specific
and somatic) and enteroviruses, but not between coliphages and other viruses (NoV, rotavirus,
and reovirus) or between the other viruses (NoV, rotavirus, and reovirus). NoV and rotavirus
were detected in 45% and 48% of the samples, respectively. Infectious enterovirus and reovirus
were detected in approximately 80% of the tested samples. Somatic and F-specific coliphages
were detected in 100% and 97% of the samples, respectively. In the two samples where no F-
specific coliphages could be detected, enteroviruses were present, and in one sample and
rotavirus and NoV was also detected. Lodder et al. (2010) concluded that their results do not
support a role for coliphages as indicators of source water quality, however, they also conclude
that coliphages may be useful for determining treatment efficiencies.
Payment and Locas (2011) used 20 years of sampling data from their laboratory to examine the
association between pathogens and multiple microbial indicators, including coliphages, in
sewage, surface water, and groundwater. Although the authors review data for several water
types, coliphage associations with pathogens were investigated in groundwater. Their analysis of
242 samples from 25 municipal groundwater well sites indicated that somatic and F-specific
RNA coliphages were not predictive of virus presence or absence. This was due in part to the
low numbers of coliphages present in the samples and their infrequent detection (Payment and
Locas, 2011).
Viau et al. (2011b) found no significant association between the presence of F-specific
coliphages and adenovirus, enterovirus, NoV GI, and NoV GII in tropical coastal streams.
Additionally, Hot et al. (2003) found no significant association between the density of somatic
coliphages and the presence of viral pathogens (RT-PCR detection of the genome of hepatitis A
virus, NoV GI and GII, astrovirus, rotavirus, and infectious enteroviruses) in concentrated
surface river water samples. In the 68 samples taken over 12 months, genomic detection of
human pathogenic viruses was not statistically associated with the levels of somatic coliphages
in surface water (Hot et al., 2003). For more information on the detection methods used, see
Table 8 below.
4.1.2 Coliphage-Virus Associations in Saline or Brackish Water
The associations between coliphages and viruses in saline or brackish waters are also varied.
Jiang et al. (2001) found that in urban runoff- impacted coastal waters, the presence of human
adenovirus was significantly associated with the presence of F-specific coliphages (Jiang et al.,
2001). Mocé-Llivina et al. (2005) found that in seawater samples at public beaches, somatic
coliphages were the best indicators of enteroviruses out of all of the indicators tested (F-specific
coliphages, total coliforms, fecal coliforms, and enterococci) as they were found in higher
32
numbers than other fecal indicators, including F-specific coliphages, and their amounts were
indicative of enterovirus levels (Mocé-Llivina et al., 2005). Similarly, Ballester et al. (2005)
found that in samples of marine water, both F-specific and somatic coliphages were significantly
associated with adenoviruses, and F-specific coliphages were also significantly associated with
rotavirus and enterovirus. Neither type of coliphage was significantly associated with the
presence of astroviruses (Ballester et al., 2005). The amounts of coliphages and viruses varied by
season. From seasonal and proximity data, it appeared that coliphages were more associated with
viral presence than E. coli and that F-specific coliphages had the highest association with viral
presence (Ballester et al., 2005).
In contrast, in a study of the occurrence and distribution of FIB (total coliform, fecal coliform,
and Enterococcus), F-specific coliphages, human adenovirus, and enterovirus in freshwater
streams and an estuary, Jiang et al. (2007) found a strong association between the occurrence of
FIB and F-specific coliphages, but no association between the presence of F-specific coliphages
and human adenovirus or enterovirus. Jiang et al. (2007) found that the detection of human
viruses depends on a seasonal and freshwater-to-saltwater distribution pattern that was the
opposite of that of FIB and coliphages. For more information on the detection methods used, see
Table 8 below. Similarly, Boehm et al. (2009) did not find an association between the presence
of coliphages, including somatic and F-specific DNA and F-specific RNA coliphages, and
human enterovirus or adenovirus in marine waters in Avalon Beach, California (Boehm et al.,
2009).
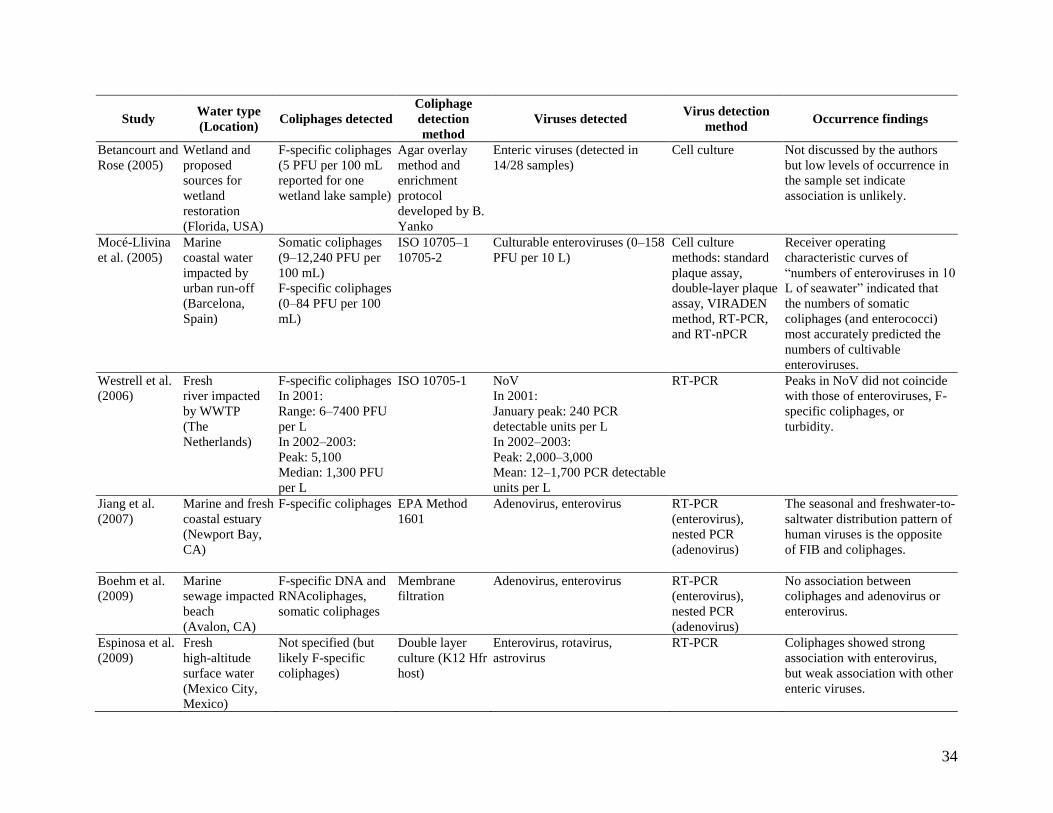
A summary of the above papers, detection methods, and quantitative data (when available) are
presented below in Table 8. A systematic literature review was not conducted, so the studies
shown in Table 8 are only a subset of the studies that likely exist.
33
Table 8. Summary table of coliphages – virus correlations in ambient water.
Study Water type
(Location) Coliphages detected
Coliphage
detection
method
Viruses detected Virus detection
method Occurrence findings
Baggi et al.
(2001)
Fresh
(Switzerland)
(upstream of
WWTP)
Somatic coliphages
(means: 1.9 and 3-
log10 PFU per mL)
F-specific coliphages
(range of means:
1.5–3-log10 PFU per
mL)
ISO 10705-1 Enteroviruses, rotaviruses, and
hepatitis A (41–44% of samples
positive)
RT-PCR plus
nested PCR
Coliphages associated with
viruses. FIB not associated with
viruses.
Jiang et al.
(2001)
Marine
Coastal waters
impacted by
urban run-off
(Southern CA)
Somatic coliphages
(5.3–3,332 PFU per
L)
F-specific
(5.5–300 PFU per L)
EPA Method
1601
Adenovirus
(880–7,500 genomes per L)
Nested PCR The presence of human
adenovirus was significantly
associated with F-specific
coliphages.
Hot et al.
(2003)
Fresh river
(France)
Somatic coliphages
(range of densities:
4×10²–1.6×10⁵ PFU
per L)
ISO 10705-2 Cell culture: total culturable
enteroviruses (later determined
to be poliovirus type3)
Molecular methods: hepatitis A
virus (1 positive /68 total),
astrovirus (2/68), NoV GI (0
detects), NoV GII (1/68),
rotavirus (0 detects), and
enterovirus (2/68).
Cell culture and
RT-PCR followed
by Southern Blot
No significant association was
observed between the density
of somatic coliphages and the
presence of infectious
enteroviruses, or enterovirus
genomes.
Skraber et al.
(2004b)
Fresh river
(France)
Somatic coliphages
(Mean: 3.06-log10
PFU/100 mL)
ISO 10705-2 Enterovirus spp. and NoV GII
(34 samples out of 90 (38%)
were positive for enterovirus
(13%) and/or NoV GII (27%)
genome)
Enterovirus spp.:
cell culture, ICC-
RT-PCR, and RT-
PCR
NoV GII: RT-PCR
The number of samples positive
for pathogenic viral genome
increased with increasing
densities of somatic coliphages.
Ballester et al.
(2005)
Marine
Coastal water
impacted by
WWTP
discharge
(Boston, MA)
Somatic and F-
specific coliphages
EPA Method
1602
Human astrovirus,
enteroviruses, rotavirus, and
adenovirus types 40 and 41
ICC-nPCR, ICC-
RT-nPCR
The presence of enteric viruses
and adenovirus was
significantly associated with
the presence of F-specific
coliphages and somatic
coliphages. Only F-specific
coliphages were significantly
associated with the presence of
rotavirus and enterovirus.
34
Study Water type
(Location) Coliphages detected
Coliphage
detection
method
Viruses detected Virus detection
method Occurrence findings
Betancourt and
Rose (2005)
Wetland and
proposed
sources for
wetland
restoration
(Florida, USA)
F-specific coliphages
(5 PFU per 100 mL
reported for one
wetland lake sample)
Agar overlay
method and
enrichment
protocol
developed by B.
Yanko
Enteric viruses (detected in
14/28 samples)
Cell culture Not discussed by the authors
but low levels of occurrence in
the sample set indicate
association is unlikely.
Mocé-Llivina
et al. (2005)
Marine
coastal water
impacted by
urban run-off
(Barcelona,
Spain)
Somatic coliphages
(9–12,240 PFU per
100 mL)
F-specific coliphages
(0–84 PFU per 100
mL)
ISO 10705–1
10705-2
Culturable enteroviruses (0–158
PFU per 10 L)
Cell culture
methods: standard
plaque assay,
double-layer plaque
assay, VIRADEN
method, RT-PCR,
and RT-nPCR
Receiver operating
characteristic curves of
“numbers of enteroviruses in 10
L of seawater” indicated that
the numbers of somatic
coliphages (and enterococci)
most accurately predicted the
numbers of cultivable
enteroviruses. Westrell et al.
(2006)
Fresh
river impacted
by WWTP
(The
Netherlands)
F-specific coliphages
In 2001:
Range: 6–7400 PFU
per L
In 2002–2003:
Peak: 5,100
Median: 1,300 PFU
per L
ISO 10705-1 NoV
In 2001:
January peak: 240 PCR
detectable units per L
In 2002–2003:
Peak: 2,000–3,000
Mean: 12–1,700 PCR detectable
units per L
RT-PCR Peaks in NoV did not coincide
with those of enteroviruses, F-
specific coliphages, or
turbidity.
Jiang et al.
(2007)
Marine and fresh
coastal estuary
(Newport Bay,
CA)
F-specific coliphages EPA Method
1601
Adenovirus, enterovirus RT-PCR
(enterovirus),
nested PCR
(adenovirus)
The seasonal and freshwater-to-
saltwater distribution pattern of
human viruses is the opposite
of FIB and coliphages.
Boehm et al.
(2009)
Marine
sewage impacted
beach
(Avalon, CA)
F-specific DNA and
RNAcoliphages,
somatic coliphages
Membrane
filtration
Adenovirus, enterovirus RT-PCR
(enterovirus),
nested PCR
(adenovirus)
No association between
coliphages and adenovirus or
enterovirus.
Espinosa et al.
(2009)
Fresh
high-altitude
surface water
(Mexico City,
Mexico)
Not specified (but
likely F-specific
coliphages)
Double layer
culture (K12 Hfr
host)
Enterovirus, rotavirus,
astrovirus
RT-PCR Coliphages showed strong
association with enterovirus,
but weak association with other
enteric viruses.
35
Study Water type
(Location) Coliphages detected
Coliphage
detection
method
Viruses detected Virus detection
method Occurrence findings
Lodder et al.
(2010)
Fresh
rivers
(The
Netherlands)
Somatic coliphages
(1.1 to 114,156 PFU
per L),
F-specific coliphages
(0.12 to 14,403 PFU
per L)
ISO 10705–1
ISO 10705–2
Enterovirus (present in 75% of
samples (range, 0.0033 to 5.2
PFU per L)
Reovirus (83% of samples
(0.0030 to 5.9 PFU per L),
Cell culture using
RT-PCR and ICC-
RT-PCR
A significant association was
observed between the densities
of the two coliphages and
enteroviruses.
Payment and
Locas (2011),
using data
taken from
Locas et al.
(2007, 2008)
Fresh
groundwater
(Canada)
Somatic and F-
specific RNA
coliphages
EPA Methods
1601 and 1602
Cell culture and
immunoperoxidase: total
culturable human enteric viruses
Molecular methods: NoV,
adenovirus types 40 and 41,
enteroviruses, and reoviruses
types 1, 2, and 3
Cell culture,
immunoperoxidase,
ICC-PCR, ICC-RT-
PCR, and RT-PCR
Somatic and F-specific RNA
coliphages were not predictive
of virus presence or absence.
Coliphages were present only
in low numbers and less
frequently than bacterial
indicators.
Viau et al.
(2011b), using
data presented
in Viau et al.
(2011a)
Fresh,brackish
and marine
tropical coastal
streams and
estuaries
(Hawaii)
F-specific coliphages
(present in 85/88
samples, log10 mean
1.2 ± 0.8 per 100
mL)
Membrane
filtration and
double agar
layer
Adenovirus (present in 13/88
samples, 0.8 to 4.2 gene copies
per 100 mL)
Enterovirus (5/88 samples, 0.4
to 4.8 gene copies per 100 mL)
NoV GI (19/88 samples, 1.2 to
1,441 gene copies per 100 mL)
NoV GII (11/88 samples, 0.9 to
62.4 gene copies per 100 mL)
qPCR,
RT-qPCR
There were no associations
between occurrence of viruses
and fecal indicator densities
(including coliphages).
Love et al.
(2014)
Marine
recreational
beaches
F-specific coliphages
(median
concentrations at
both beaches 0.3
MPN per 100 mL)
Somatic coliphages
(median
concentrations were
4.9 and 3.1 MPN per
100 mL)
Modified
version of
modified version
of EPA Method
1601
Adenovirus (25.5% of water
samples at Doheny Beach
and in 9.3% at Avalon Beach
NoV (22.3% of water samples at
Doheny Beach and 0.7% at
Avalon Beach
Adenovirus: nested
PCR
NoV: nested RT-
PCR
The presence of F-specific
coliphages was positively
associated with the probability
of detecting adenovirus. NoV
was not significantly associated
with either type of coliphages.
36
Study Water type
(Location) Coliphages detected
Coliphage
detection
method
Viruses detected Virus detection
method Occurrence findings
Rezaeinejad et
al. (2014)
Urbanized
catchment
waters
(freshwater) in
tropical
Singapore
F-specific coliphages
(mean concentration
= 1.1 x 10² PFU per
100 mL)
Somatic coliphages
(mean concentration
= 2.2 x 10² PFU per
100 mL)
EPA Method
1602
Adenovirus (mean = 9.4 x 101
gene copies/L)
Astrovirus (mean = 2.9 x 10²
gene copies/L)
NoV GII (mean = 3.7 x 10² gene
copies/L)
Rotavirus (mean = 2.5 x 10²
gene copies/L)
Adenovirus: real
time PCR
Astrovirus,
rotavirus, NoV G I
and GII: real time
RT-PCR
F-specific coliphages were
positively associated with NoV
densities.
VIRADEN method = “virus adsorption enumeration” based on the direct enumeration of viruses adsorbed into nitrate-acetate cellulose membranes.
Note: Bacterial hosts for somatic coliphages include: WG5, CN13, E. coli 036; bacterial hosts for F-specific coliphages include: Stm WG49, E. coli Famp, K12
Hfr.
37
5. Environmental Factors and Fate
The ability of coliphages (including different coliphage genogroups) and other enteric viruses to
survive in environmental media varies widely (Callahan et al., 1995; Reyes and Jiang, 2010;
Jończyk et al., 2011; Bertrand et al., 2012). As described previously, the effect of environmental
factors on coliphage survival is associated with morphology, where some specific structural
characteristics, such as tails, large capsids, and lack of an envelope have been shown to be
associated with greater resistance to external factors (Ackermann et al., 2004; Jończyk et al.,
2011). Researchers have investigated the survival of coliphages and enteric viruses under a
variety of environmental conditions. Studies have examined the effects of physical stress (e.g.,
temperatures and sunlight), biological antagonists (e.g., microbial predation and enzymatic
degradation), and chemical antagonists (e.g., disinfection). This section focuses on physical and
biological antagonists in natural aquatic environments, mechanisms of inactivation, and where
data are available, compares inactivation rates of somatic, F-specific and Bacteroides
bacteriophages to inactivation of human enteric viruses. Chemical treatment and other
disinfection methods are discussed in Section 6 (Wastewater Treatment).
5.1. Temperature
Temperature is an important factor in viral ecology as it plays a fundamental role in attachment,
penetration, multiplication, occurrence, and viability (Sobsey and Meschke, 2003; Pradeep Ram
et al., 2005; Jończyk et al., 2011). Many studies have examined the effect of temperature on the
survival of different viruses in aquatic environments. Both enteric viruses and coliphages have
been reported to survive longer and occur more frequently at lower temperatures in natural
environments and decay more rapidly at higher temperatures (i.e., seawater, river, and
groundwater) (Long and Sobsey, 2004; Fong and Lipp, 2005). Below is a brief summary of the
evidence of the effects of temperature on human enteric virus and coliphage inactivation in
aquatic systems.
Bertrand et al. (2012) conducted a meta-analysis of the effects of temperature on the inactivation
of enteric viruses and bacteriophages in food and water. The study collected 658 data points from
76 published studies and analyzed the effects of virus type, matrix (simple or complex), and
temperature (<50 and ≥50°C) on virus survival. A simple matrix included: (1) synthetic media;
(2) drinking water; and (3) groundwater. A complex matrix included: (1) freshwater; (2) natural
seawater; (4) sewage; (4) soil; (5) dairy products; (6) food; and (7) urine (Bertrand et al., 2012).
The study determined that, overall, virus inactivation was faster at temperatures ≥50°C than at
temperatures <50°C and that virus inactivation was less sensitive to temperature change in
complex matrices than in simple matrices (Bertrand et al., 2012). The somatic coliphage ΦX174
was highly persistent under all temperatures and matrices tested.
Studies reported differences in survival among different F-specific coliphage groups across
temperature gradients. For example, Long and Sobsey (2004) reported that at 4°C, GI and GII
F-specific RNA coliphages were detectable for over 100 days, GIII F-specific RNA coliphages
were detectable for 3 weeks, and GIV F-specific RNA coliphages were reduced to the limit of
detection after 10 days (Long and Sobsey, 2004). Of the F-specific DNA coliphages, all strains
were detectable after 110 days at 4°C (Long and Sobsey, 2004). The authors also noted that the
GI F-specific RNA coliphage MS2 and F-specific DNA coliphage M13 demonstrated a longer
38
survival in environmental waters than other F-specific coliphage species (Long and Sobsey,
2004).
Temperature can also affect survival of somatic and Bacteroides bacteriophages in aquatic
systems. Lee and Sobsey (2011) estimated the temperature inactivation of four types of somatic
coliphages in laboratory tests using both reagent grade water and surface water. The authors
found that T4 (Myoviridae family), ΦX174 (Microviridae family), and λ (Siphoviridae family),
survived better than T1 (Siphoviridae family), and T7 (Podoviridae family), at low temperatures
(4°C) and high temperatures (25°C). Chung and Sobsey (1993) found that B. fragilis coliphages
survived comparable to or better than hepatitis A, poliovirus, and rotavirus (measured using cell
culture) in seawater exposed to low (5°C) and high (25°C) temperatures.
Reported comparisons between decay rates of F-specific RNA coliphages and human enteric
viruses, or proxies to human enteric viruses, indicate that decay rates of both vary by temperature
and water conditions. For example, in their two studies, Allwood et al. (2003, 2005) compared
the survival of GI F-specific RNA coliphage MS2, feline calicivirus (FCV), and E. coli at 4°C,
25°C, and 37°C in chlorinated and dechlorinated water. In dechlorinated water at 4°C and 25°C,
MS2 survived three times longer than both E. coli and FCV, whereas they had similar survival
rates at 37°C (Allwood et al., 2003).
Similarly, Romero et al. (2011) found that porcine rotavirus and GI F-specific RNA coliphage
MS2 had relatively low inactivation rate constants in the dark from 14 to 42°C, 10-fold increases
in inactivation rates at 50°C and between 10- and 60-fold increases in inactivation rates at 60°C.
In a similar experiment, Seo et al. (2012) compared the decay rates of murine NoV (MNV) and
GI F-specific RNA coliphage MS2 over a temperature range of 24 to 85°C. They found that
decay rate of MS2 was lower than MNV between 24°C and 60°C and that both were rapidly
inactivated by temperatures >60°C (Seo et al., 2012). For more details on the decay rates at
different temperatures, see Table 9 below.
Synergistic effects between temperature and other environmental factors
The importance of temperature as a determinant of coliphage survival has been found to vary
between freshwater and saltwater environments. For example, Reyes and Jiang (2010) noted that
temperature is more important in influencing coliphage occurrence in freshwater environments
than in saltwater environments (See Section 5.3 for more information on salinity). The
importance of temperature as a determinant of virus survival is also dependent on the presence of
sunlight. Romero et al. (2011) found that temperature played an important role in sunlight-
mediated inactivation. For example, degradation rates of both GI F-specific coliphage MS2 and
porcine rotavirus were higher for the same temperatures under different light conditions (full
solar spectrum and only UVA and visible light) as compared to in the dark (Romero et al., 2011)
(See Section 5.2 for more information on sunlight). Hurst et al. (1989) showed that temperature
effects on inactivation of enterovirus was dependent on the water sources used as the aqueous
phase in experiments.
Summary
39
In summary, conclusions drawn in multiple studies indicate that the coliphages are equally
persistent to, or more persistent than enteric viruses. Bertrand et al. (2012) found that somatic
coliphage ΦX174 was highly persistent under all matrices and temperatures tested, and at higher
temperatures, somatic and F-specific coliphages were classified as the most persistent as
compared to enteric viruses. These data are consistent with the results of Allwood et al. (2003,
2005) and Seo et al. (2012). Combined, these data indicate that coliphages may be conservative
surrogates for the behavior of enteric viruses under a range of temperatures (meaning they
persist as long or longer than human viruses). Table 9 presents the decay rates of different types
of coliphages, other fecal indicators, and human viruses.
5.2. Sunlight
Sunlight is also an important factor leading to virus inactivation (Sobsey and Meschke, 2003;
Fong and Lipp, 2005; Jończyk et al., 2011). Sunlight that reaches Earth’s surface is composed of
medium and long wavelength UV light [UVB (280 to 320 nm); UVA (320 to 400 nm)], visible
light (400 to 700 nm), and longer wavelengths (Love et al., 2010). There are three proposed
types of virus inactivation caused by the UV wavelengths in light: endogenous direct,
endogenous indirect, and exogenous indirect (Silverman et al., 2013). While UV radiation is
utilized in wastewater treatment processes, this application uses primarily UVC wavelengths
(which do not reach Earth’s surface due to the ozone layer) and will be discussed in Section 6 on
wastewater treatment. This section will focus on inactivation of viruses due to natural or
simulated sunlight. Below is a brief summary of the evidence of the effects of sunlight on human
enteric viruses and coliphage inactivation in aquatic systems.
40
Table 9. Comparison of mean exponential decay rates of coliphages, fecal indicators and human viruses in different media at
N/0 = die off was not observed, empty cells = not reported; aThe mean exponential decay rate k may be used in the exponential decay equation: Nt = N0e-kt
.Alternatively, k may be used in the base 10 exponential decay equation as Nt = N010-kt/ln(10).
41
Effects of sunlight on coliphage decay rates and decay rates of other fecal indicators
Love et al. (2010) found a correlation between the size of the genome and the inactivation rate of
environmental isolates of somatic coliphages in sunlight: Larger genomes were correlated with
higher inactivation rates. They also found that F-specific RNA coliphages were significantly
more resistant to sunlight inactivation than the F-specific DNA coliphages over an 8-hour period
(Love et al., 2010). Overall, they found that under full-spectrum-simulated sunlight, inactivation
rates varied more widely for ssDNA and dsDNA viruses than for ssRNA viruses, and that
differences in virus inactivation rate were not just a function of nucleic acid type, but also
genome length and morphology (Love et al., 2010).
Sinton et al. (1999) studied the inactivation rates of sewage-isolated somatic coliphages,
F-specific coliphages, B. fragilis bacteriophages, and fecal coliforms by solar radiation in
sewage-seawater mixtures. Overall, their data showed that sunlight conditions resulted in faster
decay rates of all indicators as compared to dark conditions and that, under all conditions,
somatic and F-specific coliphages had lower decay rates than B. fragilis bacteriophages and fecal
coliforms (Sinton et al., 1999). The authors also found that colder water resulted in slower decay
rates than warmer water under all light and dark conditions tested (Sinton et al., 1999).
In their follow-up study, Sinton et al. (2002) investigated the inactivation rates of waste
stabilization pond effluent isolated fecal coliforms, enterococci, E. coli, somatic coliphages, and
F-specific RNA coliphages by solar radiation in freshwater (Table 10 below). Overall, their data
showed that, for all indicators, sunlight conditions resulted in faster decay rates than dark
conditions and that under both light and dark conditions, somatic and F-specific RNA coliphages
had smaller decay rates than E. coli, enterococci, and fecal coliforms (Sinton et al., 2002). Sinton
et al. (2002) also found that F-specific RNA coliphages were inactivated by a wide range of
wavelengths, whereas somatic coliphages were mainly inactivated by UVB wavelengths (318
nm).
42
Table 10. Mean exponential decay rates of coliphages and fecal indicators in fresh river
water contaminated with raw sewage or effluent under different light conditions.
Organism Source of contamination Dark Summer Winter Summer Winter
Source: Sinton et al. (2002) a The mean exponential decay rate, kD and kL, may be used in the exponential decay equation: Nt = N0e-kt.
Alternatively, kD (decay in the dark) and kL (decay in the light) may be used in the base 10 exponential decay
equation as Nt = N010-kt/ln(10). Note that kL may be used only in equivalent solar insolation conditions as the study. b The mean solar inactivation rate ks may be used in the exponential decay equation: Nt = N0es
-ksIt, where I is the
solar irradiance.
Effects of sunlight on decay rates of enteric viruses and coliphages
Individual enteric viruses and coliphages also have different levels of resistance to sunlight. For
example, Love et al. (2010) observed that in seawater under sunlit conditions, the decay rates of
adenovirus 2 and GI, GII, GIII and GIV F-specific RNA coliphages were similar and slower than
the decay rates of F-specific DNA coliphages, somatic coliphages, and poliovirus type 3 (Love et
al., 2010). These results are consistent with field experiments under conditions of similar
sunlight intensity (Love, et al., 2010).
Romero et al. (2011) used both full spectrum sunlight and a combination of UVA and visible
light to determine the decay rates of GI F-specific RNA coliphage MS2 and porcine rotavirus at
temperatures ranging from 14 to 50°C (see Table 11 below). Under dark conditions, decay rates
were not detected for either virus between 14 and 42°C whereas at 50°C, low decay rates were
detected for both (Romero et al., 2011). Under full spectrum sunlight, the decay rates (Kobs) of
both viruses increased and those for GI F-specific RNA coliphage MS2 were below those of
porcine rotavirus (Romero et al., 2011). Under a combination of UVA and visible light, both
viruses had low, approximately constant degradation rates between 14 and 42°C, whereas at
50°C the rates increased slightly (Romero et al., 2011). The very low levels of degradation of
both MS2 and porcine rotavirus in the absence of UVB were consistent with previous studies
indicating that the majority of sunlight degradation of viruses in water is due to UVB light
(Sinton et al., 2002; Romero et al., 2011). These results are consistent with the findings of Fisher
et al. (2011) who found that in phosphate buffered saline, GI F-specific RNA coliphage MS2
was resistant to UVA but highly sensitive to UVB wavelengths.
43
Silverman et al. (2013) compared the inactivation rates of poliovirus type 3, adenovirus type 2,
and GI F-specific RNA coliphages (MS2 and PRD1) under dark and full simulated sunlight
conditions in four different types of environmental water (seawater from two marine beaches,
river estuary water, coastal wetland, and coastal wetland collected near cattail plants) and in
phosphate-buffered saline (see Table 11). They found that all dark control inactivation rates were
less than those obtained from experiments conducted under full-spectrum simulated sunlight for
all three viruses in all five types of water (Silverman et al., 2013). Additionally, they found that
decay rates of GI F-specific RNA coliphages under full-spectrum simulated sunlight were
significantly below those of poliovirus type 3 in all five types of water and less than or equal to
those of adenovirus type 2. The authors conclude that GI F-specific RNA coliphages are a
conservative surrogate for predicting poliovirus type 3 and adenovirus type 2 decay in all five
types of water tested (Silverman et al., 2013).
Table 11. Comparison of mean exponential decay rates of coliphages and human viruses
under different light conditions.
Medium/
Conditions
Romero et al. (2011) Silverman
et al. (2013)b
20 mg C/L of riverine natural organic material (full-spectrum sunlight)a
Full-
spectrum
sunlight
Microorganism 14°C 23–26°C 34°C 42°C 50°C Temperature
a The mean exponential decay rate kD and kL may be used in the exponential decay equation: Nt = N0e-kt.
Alternatively, kD (decay in the dark) and kL (decay in the light) may be used in the base 10 exponential decay
equation as Nt = N010-kt/ln(10). Note that kL may be used only in equivalent solar insolation conditions as the study. b The decay rates reported in Silverman et al. (2013) are from water collected from Tijuana River estuary (Imperial
Beach, California) at the end of the ebb tide.
Synergistic effects between sunlight and other environmental factors
Several studies have found synergy between sunlight and other environmental factors in the
inactivation rates of viruses, such as the presence of organic matter or particulate matter,
sunlight, and salinity. For example, inactivation of viruses may be greater in waters with organic
matter that produces reactive oxygen species (Kohn et al., 2007; Love et al., 2010; Romero et al.,
2011). However, the presence of flora, fauna, and dissolved and particulate matter may also
increase viral survival by blocking or absorbing photons from passing through water (Bitton et
al., 1979; Romero et al., 2011). Please refer to Sections 5.4 and 5.5 for more information on
microbial activity and organics, respectively. The synergy between sunlight and temperature
appears to play a role in the inactivation of viruses. For example, Romero et al. (2011) concluded
that temperature is a critical factor in the sunlight-mediated inactivation of GI F-specific
44
coliphage MS2. Please refer to Section 5.1 for more information on temperature. Differential
inactivation of coliphages by sunlight can also occur in saltwater versus freshwater. For example,
Sinton et al. (1999, 2002) found that salinity had a synergistic effect with sunlight. Specifically,
sunlight inactivation increased with increasing salinity. For more information on salinity please
see Section 5.3.
Summary
In summary, data indicated that human enteric viruses and coliphages have faster decay rates
under conditions of full sunlight as compared to in the dark (Sinton et al., 1999, 2002; Romero et
al., 2011). Reported decay rates varied by virus, amount and wavelengths of light (UVA, UVB),
temperature, and aquatic conditions (salt or freshwater), however, several studies indicated that
coliphage decay rate is generally lower than enteric virus or FIB decay rate in various sunlight
conditions (Sinton et al., 2002; Love et al., 2010; Romero et al., 2011; Silverman et al., 2013).
Thus, coliphages may be a conservative surrogate for predicting virus decay due to sunlight.
5.3. Salinity
The types and concentrations of salts found in natural waters differ depending on the type of
water. Generally, seawater is considered to be 35 parts per thousand salt. Chloride (Na) and
sodium (Cl) are the most prevalent ions and account for more than 85% of the salt content by
mass (Murray, 2004). Concentrations of these ions (Na and Cl) are significantly lower in
freshwaters, and vary depending on type and source of water (Murray, 2004).
Salts, or salinity, can influence viral survival in aquatic environments. Salinity can either
increase or decrease degradation rates of viruses depending on the type and concentration of salt,
the temperature, and the specific virus (Hurst and Gerba, 1980; Gutierrez et al., 2010; Mylon et
al., 2010; da Silva et al., 2011; Nguyen et al., 2011; Seo et al., 2012). It has been hypothesized
that monovalent salts provide strong steric and electrosteric stabilization of GI F-specific
coliphage MS2, whereas divalent salts have been found to cause MS2 aggregation (Mylon et al.,
2010; Nguyen et al., 2011). Similar results have been shown for rotavirus and NoV G1.1
(Gutierrez et al., 2010; da Silva et al., 2011). Aggregation of viruses can make it difficult to
measure their infectivity, as plaque assays result in underestimates (e.g., a single PFU may be
comprised of clumps of virus particles). Additionally, osmotic shock through rapid changes in
osmotic pressure can trigger inactivation of coliphages via direct oxidization, which can cause
capsid degradation and dispersion, tail fragmentation, and release of viral nucleic acids into the
aquatic environment (Jończyk et al., 2011). This section will describe the effects of salinity on
viral degradation. Below is a brief summary of the evidence of the effects of salinity on human
enteric viruses and coliphage inactivation in aquatic environments.
Effects of salinity on decay rates of coliphages
Sinton et al. (1999, 2002) found that salt water affected the decay rates of F-specific and somatic
coliphages under both dark and sunlight exposed conditions. Sinton et al. (1999) studied the
inactivation rates of sewage-isolated somatic coliphages and F-specific DNA and RNA
coliphages in sewage-seawater mixtures. Sinton et al. (2002) studied the inactivation rates of
somatic and F-specific RNA coliphages isolated from waste-stabilization pond effluent under
45
both dark and sunlight exposed conditions in river water, simulated estuarine water (50% river
water, 50% seawater), and seawater. Under dark conditions, both somatic and F-specific
coliphages had lower decay rates in river water (somatic coliphages (kD = 0.008 h-1), F-specific
RNA coliphages (kD = 0.014 h-1)) than in sea water (somatic coliphages (kD = 0.044 h-1), F-
specific RNA coliphages (kD = 0.044 h-1) (Sinton et al., 1999, 2002). Degradation rates of
somatic coliphages increased 5.5 fold in salt water compared to river water under dark conditions
whereas F-specific RNA coliphages rates increased 3.1 fold under the same conditions. These
data indicate that somatic coliphages are less stable in seawater than F-specific RNA coliphages
under the tested conditions.
Somatic coliphages were more sensitive to salt water under sunlight conditions as well. For
example, Sinton et al. (2002) determined the degradation rates of somatic coliphages and F-
specific RNA coliphages isolated from waste-stabilization pond effluent under full sunlight
conditions in freshwater and 50:50 water and seawater. For somatic coliphages degradation rates
were kS = 0.079 m2 megajoules (MJ)-1 in river water, kS = 0.129 m2 MJ-1 in 50:50 water and kS =
Sources: Australian Guidelines for Water Recycling (2008) and Keegan et al. (2012) a Reductions depend on specific features of the process, including detention times, pore size, filter depths, and
disinfectant. The default values are accumulated across the treatment train processes. Each row shows only the
reduction for that treatment step.
6.1. Primary Treatment
Primary treatment of wastewater involves settling of solids in settling tanks and results in
different reduction rates of different microbe groups. Viruses are too small to settle and are only
removed during primary treatment if they are attached to larger particles. The settling velocities
of individual bacteria and protozoan cysts are low compared to the retention time of
sedimentation tanks; thus, their removal is also enhanced by attachment to larger particles. As a
result, the removal efficiencies of microorganisms is a function of their association with
wastewater particles. Asano et al. (2007) report that typical removal is <0.1- to 0.3-log10 for fecal
coliforms, 0.1- to 1.0-log10 for Cryptosporidium, <1-log10 for Giardia, and <0.1-log10 for enteric
viruses. Additionally, Lucena et al. (2004) determined the density of bacterial indicators (e.g.,
fecal coliforms, enterococci, and sulfate-reducing bacteria) and bacteriophages (e.g., somatic
coliphages, F-specific coliphages, and B. fragilis-specific bacteriophages) that are present in
incoming wastewater and effluent after primary treatment (for secondary treatment see below)
from treatment plants in Argentina, Columbia, France, and Spain. The average reductions for the
various indicators during primary settling ranged from 0.3- to 0.5-log10 units. Irrespective of the
geographical location, no significant difference in the reduction of any of the indicator
microorganisms was observed (Lucena et al., 2004). In the same study, the addition of lime had a
significant effect on F-specific RNA coliphage removal, which approached 2-log10 units, but not
on somatic coliphage removal (Lucena et al., 2004). At another WWTP in Ireland, after primary
treatment the mean reduction of F-specific RNA coliphages was 0.32-log10 (SD ± 0.55-log10)
(Flannery et al., 2012). Finally, Ottoson (2005) investigated the reduction of microorganisms and
indicators at multiple WWTPs in Sweden, and found that during primary treatment, somatic
61
coliphages were reduced by 0.8-log10 (SD = 0.4) and F-specific coliphages were reduced by 1.3-
log10 (SD = 0.7) (Ottoson, 2005).
6.2. Secondary Treatment
Secondary treatment of wastewater involves the use of a natural population of bacteria, such as
the mixed liquor flocs in activated sludge treatment or the biofilm on trickling filters, to decrease
biochemical oxygen demand (BOD), organic material, and in some cases nutrients (depending on
the design). In activated sludge treatment, aeration is necessary to support the growth of the
aerobic heterotrophic bacteria that consume the soluble organic material in the wastewater.
Although secondary treatment is not designed to remove pathogens, removal of indicator
organisms and pathogens often occurs.
Secondary treatment results in different log10 reduction values for different microorganisms and
depends on the specifics of the secondary treatment. In a widely used general resource book
(Water Reuse), Asano et al. (2007) report that the typical range of removal is 0 to 2-log10 for
fecal coliforms, 1-log10 for Cryptosporidium, 2-log10 for Giardia, and 0- to 2-log10 for enteric
viruses. In addition, Asano et al. (2007) report that secondary treatment using activated sludge
results in a mean reduction of 1.83-log10 for GI F-specific RNA coliphage MS2. The Australian
Guidelines for Water Recycling report log10 reduction ranges of 1- to 3-log10 for E. coli, 0.5- to
2.5-log10 for coliphages, and 0.5- to 2-log10 for enteric viruses (NRMMC-EPHC-NHMRC,
2008). A study of WWTPs in Argentina, Colombia, France, and Spain found that secondary
treatment reduced somatic coliphages, Bacteroides fragilis bacteriophages, and F-specific
coliphages between 1.0- to 1.6-log10 units (Lucena et al., 2004). In a study of WWTPs in
Switzerland, Baggi et al. (2001) found that three WWTPs with mechanical, biological, and
chemical processes provided 0.6- to 0.8-log10 reductions for F-specific and somatic coliphages.
A fourth WWTP with mechanical, biological, and chemical processes, plus sand filtration
provided 1- to 4.4-log10 reductions for F-specific and somatic coliphages (Baggi et al., 2001).
While some coliphages and human virus removal occurs during secondary treatment, they are
still typically detectable in non-disinfected secondary effluent. Aw and Gin (2010) detected
somatic coliphages and F-specific coliphages along with adenoviruses, astroviruses, and NoVs in
100% of the secondary effluent samples tested (Figure 1). Somatic coliphages and F-specific
coliphages were present in secondary effluent at 100 PFU per 100 mL (Aw and Gin, 2010). In
six WWTPs secondary effluents, Rose et al. (2004) found that somatic and F-specific coliphages
ranged from 10 to 105 PFU per 100 mL, enterococci from 103 to 105 CFU per 100 mL, and
enteroviruses from 10 to 102 MPN per 100 mL. However, in 27% of the secondary effluent
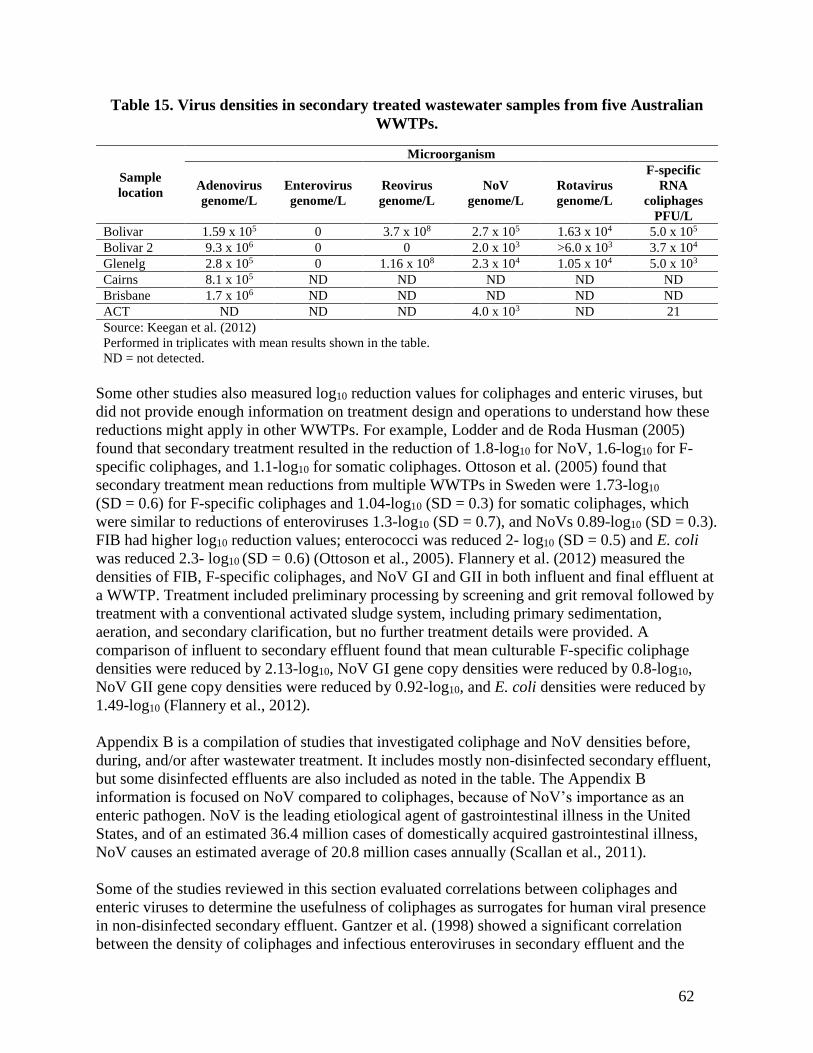
samples, enteroviruses were below the detection limits. In five Australian WWTPs, Keegan et al.
(2012) found coliphages, adenoviruses, rotaviruses, reoviruses, NoV, and enteroviruses in
secondary effluent (Table 15).
62
Table 15. Virus densities in secondary treated wastewater samples from five Australian
WWTPs.
Sample
location
Microorganism
Adenovirus
genome/L
Enterovirus
genome/L
Reovirus
genome/L
NoV
genome/L
Rotavirus
genome/L
F-specific
RNA
coliphages
PFU/L
Bolivar 1.59 x 10⁵ 0 3.7 x 10⁸ 2.7 x 10⁵ 1.63 x 10⁴ 5.0 x 10⁵
Bolivar 2 9.3 x 10⁶ 0 0 2.0 x 10³ >6.0 x 10³ 3.7 x 10⁴
Glenelg 2.8 x 10⁵ 0 1.16 x 10⁸ 2.3 x 10⁴ 1.05 x 10⁴ 5.0 x 10³
Cairns 8.1 x 10⁵ ND ND ND ND ND
Brisbane 1.7 x 10⁶ ND ND ND ND ND
ACT ND ND ND 4.0 x 10³ ND 21
Source: Keegan et al. (2012)
Performed in triplicates with mean results shown in the table.
ND = not detected.
Some other studies also measured log10 reduction values for coliphages and enteric viruses, but
did not provide enough information on treatment design and operations to understand how these
reductions might apply in other WWTPs. For example, Lodder and de Roda Husman (2005)
found that secondary treatment resulted in the reduction of 1.8-log10 for NoV, 1.6-log10 for F-
specific coliphages, and 1.1-log10 for somatic coliphages. Ottoson et al. (2005) found that
secondary treatment mean reductions from multiple WWTPs in Sweden were 1.73-log10
(SD = 0.6) for F-specific coliphages and 1.04-log10 (SD = 0.3) for somatic coliphages, which
were similar to reductions of enteroviruses 1.3-log10 (SD = 0.7), and NoVs 0.89-log10 (SD = 0.3).
FIB had higher log10 reduction values; enterococci was reduced 2- log10 (SD = 0.5) and E. coli
was reduced 2.3- log10 (SD = 0.6) (Ottoson et al., 2005). Flannery et al. (2012) measured the
densities of FIB, F-specific coliphages, and NoV GI and GII in both influent and final effluent at
a WWTP. Treatment included preliminary processing by screening and grit removal followed by
treatment with a conventional activated sludge system, including primary sedimentation,
aeration, and secondary clarification, but no further treatment details were provided. A
comparison of influent to secondary effluent found that mean culturable F-specific coliphage
densities were reduced by 2.13-log10, NoV GI gene copy densities were reduced by 0.8-log10,
NoV GII gene copy densities were reduced by 0.92-log10, and E. coli densities were reduced by
1.49-log10 (Flannery et al., 2012).
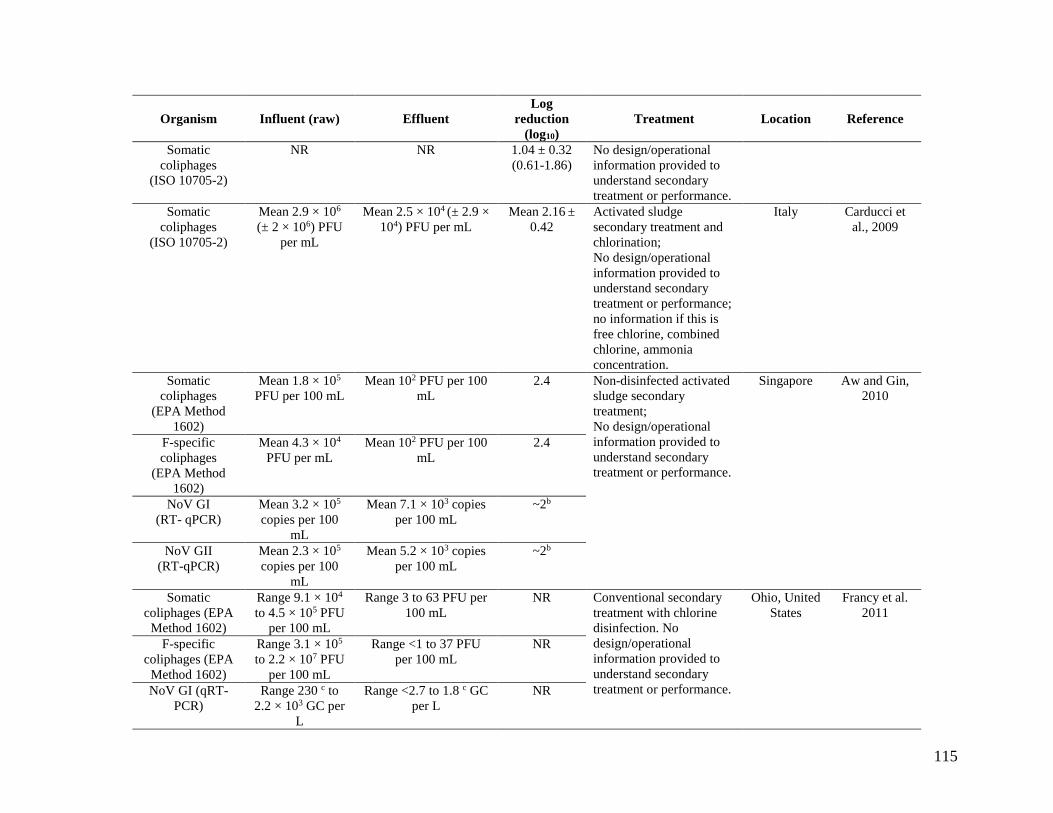
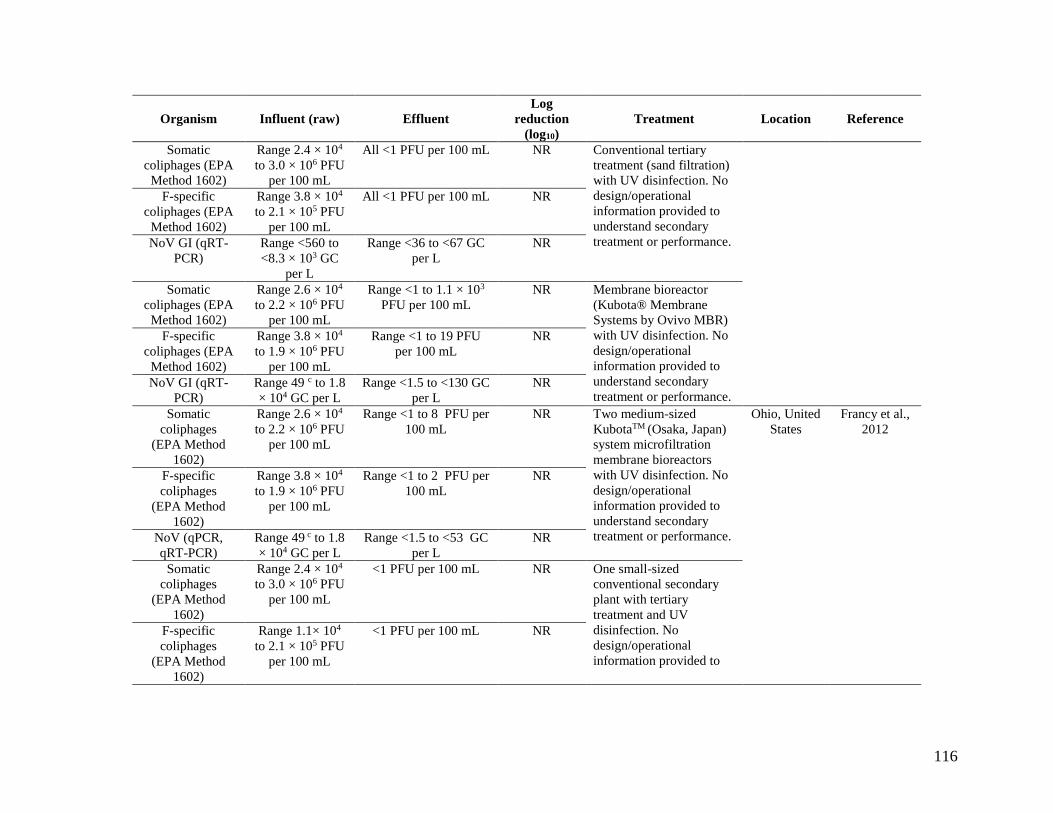
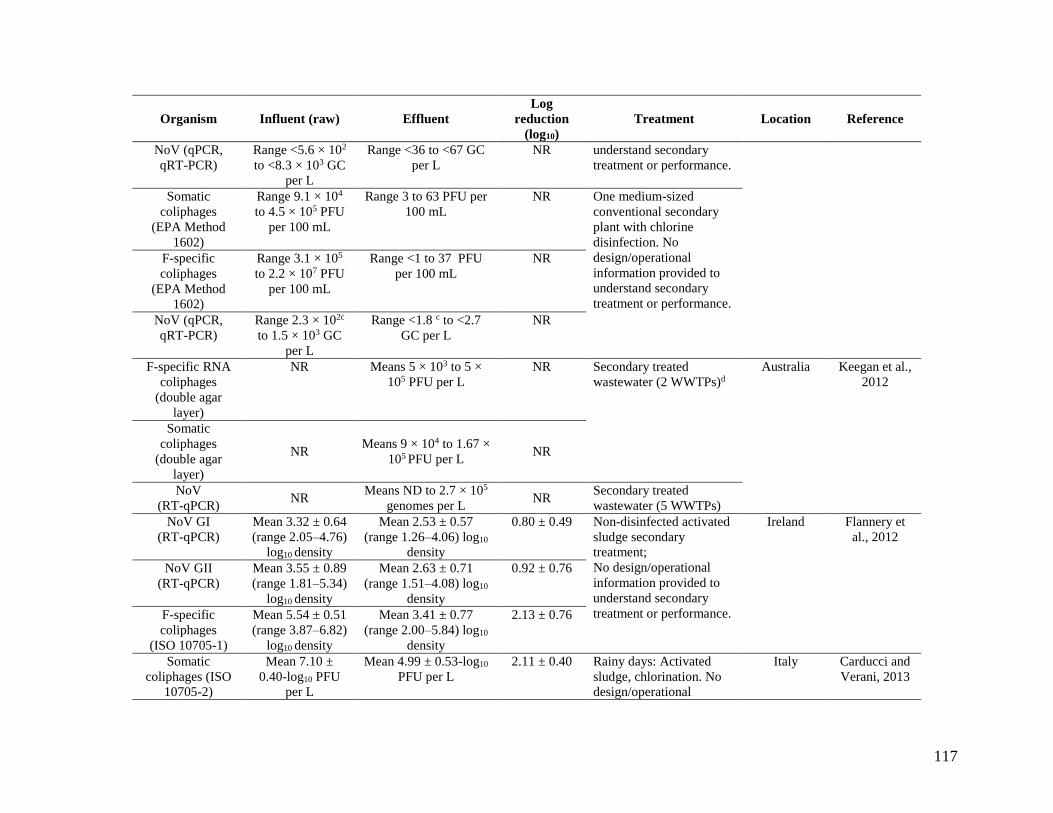
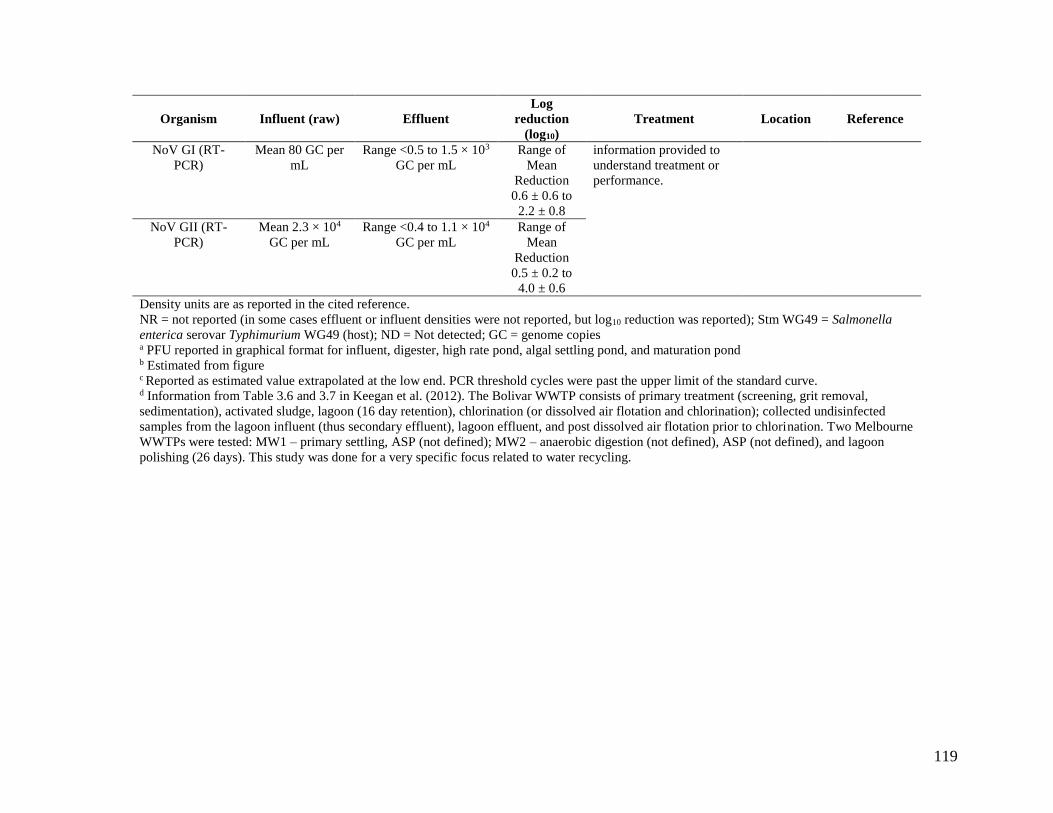
Appendix B is a compilation of studies that investigated coliphage and NoV densities before,
during, and/or after wastewater treatment. It includes mostly non-disinfected secondary effluent,
but some disinfected effluents are also included as noted in the table. The Appendix B
information is focused on NoV compared to coliphages, because of NoV’s importance as an
enteric pathogen. NoV is the leading etiological agent of gastrointestinal illness in the United
States, and of an estimated 36.4 million cases of domestically acquired gastrointestinal illness,
NoV causes an estimated average of 20.8 million cases annually (Scallan et al., 2011).
Some of the studies reviewed in this section evaluated correlations between coliphages and
enteric viruses to determine the usefulness of coliphages as surrogates for human viral presence
in non-disinfected secondary effluent. Gantzer et al. (1998) showed a significant correlation
between the density of coliphages and infectious enteroviruses in secondary effluent and the
63
correlation between the density of somatic coliphages and the presence of the enterovirus
genomes (p-value <0.0001). No enteroviruses were isolated in secondary effluent (without
disinfection) when the somatic coliphage density was between 100 and 10,000 PFU per L
(Gantzer et al., 1998). Although the treatment specifics were different, these results are similar to
those in Rose et al. (2004), who found that coliphage levels less than 10 PFU per 100 mL in final
disinfected effluent contained no detectable cultivatable enteric viruses (Rose et al., 2004). The
threshold level in the WERF study is based on tertiary disinfected effluent and not non-
disinfected secondary effluent (Rose et al., 2004). Ottoson et al. (2006) found there was no
significant correlation between the reduction of coliphages or FIB compared to viruses
(enteroviruses and NoV) in secondary treated wastewater. Flannery et al. (2012) also found no
correlation between the densities of E. coli and F-specific coliphages with either NoV GI or NoV
GII levels in effluent wastewater (r < 0.07 in all instances).
6.3. Wastewater Treatment Ponds
Wastewater treatment ponds, also known as waste stabilization ponds or lagoons, are shallow
synthetic basins that treat sewage in a single or series of anaerobic, facultative or maturation
ponds. Aeration and encouragement of aquatic life are other possible features of wastewater
treatment ponds. Verbyla and Mihelcic (2015) analyzed virus removal data from 71 different
systems. They found weak to moderate correlation between virus removal and hydraulic
retention time. For each log10 reduction of viruses a geometric mean of 14.5 days of retention
(95th percentile was 54 days of retention) was required. GI F-specific RNA coliphage MS2
coliphage is considered to be the best surrogate for studying sunlight disinfection in wastewater
treatment ponds. Inactivation of coliphages by solar radiation in lagoons and ponding systems
tends to be seasonal, with the most effective inactivation occurring in summer months (Davies-
Colley et al., 2005; Blatchley et al., 2007). Sunlight inactivation of viruses is discussed in
Section 5.2 and is compared to UVC inactivation in Section 6.5.4.
The open water wetland is similar to a maturation pond, but instead of having planktonic algae,
the algae are part of a biomat on the bottom of the pond. Silverman et al. (2015) found that
removals of F-specific and somatic coliphages were similar in a pilot-scale system. Based on
laboratory and modeling work, they determined that GI F-specific RNA coliphage MS2 was
inactivated more slowly than poliovirus under summer conditions, but more rapidly under winter
conditions. More research is needed to determine how the relative inactivation rates of
indigenous coliphages (F-specific and somatic coliphages) and other enteric viruses change
seasonally in open water wetlands.
6.4. Tertiary Treatment and Advanced Treatment
Tertiary treatment typically refers to particle removal processes (e.g., granular media filtration,
cloth filtration, or membrane filtration) that are employed before final disinfection. The amount
by which viruses (and other pathogens) are reduced by filtration varies depending on filter
characteristics, operating practices, microbial properties, including size, surface properties, and
degree of association with other microorganisms or particles, and water quality variables (Levine
et al., 2008). Tertiary treatment may also refer to chemical or biological nutrient removal
processes (e.g., targeting nitrogen and/or phosphorus), although these processes are sometimes
considered part of secondary treatment. Literature reports for treatment plants employing nutrient
64
removal were included in Section 6.2. Advanced treatment trains, which can be applied to
filtered tertiary effluents, can be used to further purify water for indirect or direct potable reuse.
Advanced treatment typically involves advanced oxidation processes (AOPs) and dense
membranes (nanofiltration and reverse osmosis) that target the removal of pathogens and trace
organic contaminants (Leverenz et al., 2011; NRC, 2011; Gerrity et al., 2013). Membrane
processes are reviewed here. Disinfection processes, including UV, ozone, free chlorine,
combined chlorine, and AOPs are described in detail in Section 6.5.
Depth filtration involves the use of granular media (e.g., sand, anthracite, garnet, or activated
carbon) in single (mono-media) or layered configurations (multi-media). Microorganism removal
differs based on a variety of factors, including water quality, the type and size of granular media,
the filtration velocity, and the use of coagulant and/or polymer. Typical removals from depth
filtration are reported to be 0 to 1-log10 for fecal coliforms, 0 to 3-log10 for Cryptosporidium, 0-
to 3-log10 for Giardia, 0- to 1-log10 for enteric viruses and ~0.14- to 2-log10 for coliphages
(Rajala et al., 2003; Hijnen et al., 2004; Zanetti et al., 2006; Asano et al., 2007; Hijnen and
Medema, 2007). Asano et al. (2007) report that tertiary treatment using depth filtration results in
a mean reduction of 0.29-log10 for GI F-specific RNA coliphage MS2, and Zanetti et al. (2006)
found that tertiary sand filtration resulted in a mean reduction of 0.31-log10 for E. coli and 0.14-
log10 for somatic coliphages.
Rajala et al. (2003) conducted both laboratory and pilot-scale experiments on rapid sand
filtration of wastewater effluent from WWTPs in Finland. In the laboratory experiment, the rapid
sand filtration reduced coliphages by 0.15- to 0.26-log10 (30–46%) at a hydraulic load of 5
meters per hour and 0.13- to 0.27-log10 (23–38%) at a hydraulic load of 10 meters per hour. In
the pilot experiments (hydraulic loads range 7.7 to 10 meters per hour), coliphages were reduced
by 0.66- to 1.5-log10 (7–97%), depending on the plant (Rajala et al., 2003). Based on pilot-scale
filter studies on rapid depth filtration, Williams et al. (2007) found that the removal efficiency of
GI F-specific RNA coliphage MS2 (seeded into secondary effluent) was similar to that of E. coli
and total coliforms (~ 0.8 log10 at a loading rate of 12.2 meters per hour). The removal efficiency
of MS2 was more sensitive to the coagulant dose, compared to the indicator bacteria. In an
experimental rapid sand filtration setup, virus size (based on ΦX174, MS2, and T4 coliphages)
was the only factor that influenced retention and the larger the virus, the greater the retention
(Aronino et al., 2009).
Levine et al. (2008) conducted experiments to examine pathogen reduction from sand filtration
of secondary effluent at five full-scale water reclamation facilities in the United States (three
plants using monomedium and two plants using dual media) at peak usage over the course of a
year. These are the same facilities that are reported in Rose et al. (2004). The average reductions
for all five plants ranged from 0.1- to 4.2-log10 for fecal coliforms, 0.3- to 1.1-log10 for infectious
Cryptosporidium, 0.7- to 1.5-log10 for Giardia, 0.3- to 1.2-log10 for culturable enteroviruses, 0.3-
to 1.3-log10 for F-specific coliphages, and 0.2- to 0.8-log10 for somatic and F-specific coliphages
(Levine et al., 2008). The authors found that the differences in average reduction rates between
plants were likely due to a combination of loading rates, chemical addition practices (chlorine
and coagulant), backwashing and post backwashing operating strategies, and the effectiveness of
upstream biological treatment and sedimentation (Levine et al., 2008). In general, log10
reductions of indicator bacteria (coliforms, enterococci, and Clostridium) was 2-to 9-fold greater
65
than the log10 reduction of pathogens, suggesting that monitoring with bacterial indicators may
over predict pathogen reductions. Rose et al. (2004) noted that shallow sand filters were more
effective than deep-bed dual-media or monomedia filters for removal of coliphages and viruses.
However, this result was affected by the fact that pre-disinfection (pre-chlorination) was used for
the shallow sand filter tests but not for the deep-bed filters.
Surface Filtration includes mechanical sieving of secondary effluent, through cloth, metal or
synthetic woven materials with a pore size of ~10 to 30 µm. In comparative testing for 15- to
30-µm particles, surface filtration removed more particles than granular filtration over all particle
sizes tested (Olivier et al., 2003). Asano et al. (2007) reported average reductions for surface
filtration of 0- to 1-log10 for coliform bacteria and 0- to 0.5-log10 for enteric viruses. These
results are consistent with Levine et al. (2008), who found that cloth filtration of secondary
effluent at a full-scale water reclamation facility at peak usage over the course of a year resulted
in average reductions of 3-log10 (range: 1.9 to 4.3) for fecal coliforms, 0.5-log10 (range: 0.3 to
0.7) for infectious Cryptosporidium, 0.5-log10 (range: -0.4 to 1.3) for Giardia, 0.5-log10 (range:
0.3 to 0.8) for culturable enteric viruses, 0.6-log10 (range: -0.1 to 1.8) for F-specific coliphages,
and 0.4-log10 (range: -0.1 to 1) for somatic and F-specific coliphages.
Membrane filtration, a type of advanced treatment, involves forcing wastewater through a thin
membrane filtering under pressure. Membranes with different sized pores can be used, including
microfilters (>50 nm), ultrafilters (2 to 50 nm), nanofilters (<2 nm), and reverse osmosis
(polymer matrix without discrete pores; particles are excluded and uncharged molecules pass
through membrane by diffusion). In general, the smaller the pore size used, the greater the
reduction of pathogens and the higher the operating pressure (Asano et al., 2007). For example,
Asano et al. (2007) reported that typical removal of pathogens from microfiltration are 1- to 4-
log10 for fecal coliforms, 1- to 4-log10 for Cryptosporidium, 2- to 6-log10 for Giardia, and 0- to 2-
log10 for enteric viruses. Ultrafiltration results in removal of 3- to 6-log10 for fecal coliforms, >6-
log10 for protozoa, and 2- to 7-log10 for viruses. Nanofiltration results in removal of 3- to 6-log10
for all types of bacteria, >6-log10 for protozoa, and 3- to 5-log10 for viruses. Reverse osmosis
results in reductions of 4- to 7-log10 for fecal coliforms, 4- to 7-log10 for Cryptosporidium, >7-
log10 for Giardia, and 4- to 7-log10 for enteric viruses (Asano et al., 2007).
Perfectly intact nanofiltration and reverse osmosis membranes should not allow passage of any
bacteria or viruses; however, leaks in seals, and membrane imperfections or damage to the
membranes could allow their passage. Thus, monitoring the integrity of membranes is critical to
ensuring high removal of microorganisms.
Juby (2003) found that microfiltration of screened primary effluent at a demonstration plant in
California resulted in typical reductions of 4.7-log10 for fecal coliforms and 1.7-log10 for
coliphages. Gomez et al. (2006) used secondary effluent from a WWTP in Spain to determine
pathogen reduction rates from microfiltration and ultrafiltration. They found that microfiltration
resulted in a 2.7-log10 reduction in fecal coliform, the removal of E. coli below detectable limits,
and a 1.3-log10 reduction of coliphages, whereas ultrafiltration resulted in a 4.7-log10 reduction of
fecal coliform, the removal of E. coli below detectable limits, and a 3.5-log10 reduction of
coliphages (Gomez et al., 2006).
66
Membrane Bioreactors are a relatively new technology that combine an activated sludge
bioreactor with membrane filtration, which replaces both secondary and tertiary treatment.
Zhang and Farahbakhsh (2007) found that membrane bioreactor pilot plants achieved 5.8-log10
removal of coliphages. Whereas conventional activated sludge process followed by advanced
tertiary treatment (nitrifying rotating biological contactors, sand filtration, and chlorination),
achieved 5.5-log10 removal of coliphages. For membrane systems, coliphages appear to be better
indicators of microbial removal efficacy (especially viral removal) probably because the pore
size of most microfiltration and ultrafiltration membranes exclude fecal coliforms, but some
coliphages can still pass through the membrane pores (Zhang and Farahbakhsh, 2007). In a full-
scale membrane bioreactor study, Purnell et al. (2015) reported a 5.3-log10 reduction in
indigenous somatic coliphages. Indigenous F-specific coliphages were less abundant and
demonstrated a 3.5-log10 reduction. In ‘spiking’ experiments, suspended GI F-specific RNA
coliphage MS2 demonstrated a 2.25-log10 reduction (Purnell et al., 2015).
6.5. Disinfection
Disinfection of secondary effluent can be achieved using physical (UVC radiation) and chemical
(chlorine, chloramines, and ozone) treatments. This section focuses on the physical and chemical
treatments of secondary effluent and the effects of these treatments on coliphages, FIB, and
enteric virus inactivation. Although solar radiation can also play a role in further disinfection of
secondary effluent by lagooning (Gomila et al., 2008), lagooning is not typically considered a
disinfection treatment (see Section 6.3). It is important to note that if ammonium levels are not
reported, it cannot be determined whether free chlorine or combined chlorine was present during
the disinfection step. This is important because many studies report on water samples from
secondary disinfected effluent, but there is wide variation in what secondary disinfected effluent
includes.
As mentioned previously, studies with water samples collected at full-scale WWTPs are
preferred. However, pilot scale and bench-scale studies are also included when full-scale data
were not available.
6.5.1 Free Chlorine
Chlorine (Cl-) is the most widely used wastewater disinfectant (Asano et al., 2007). Chlorine is
an efficient disinfectant for most enteric bacteria, but is generally less efficient against viruses,
protozoan cysts, and bacterial spores (Keegan et al., 2012). The effectiveness of chlorine is
impacted by disinfection dose, contact time, temperature, and water quality variables (pH,
turbidity, presence of ammonia and oxidant demand) (Rose et al., 2004; Asano et al., 2007). For
example, above pH 7, a 10 mg per L residual chlorine resulted in 4-log10 reduction of F2
coliphages, whereas at low pH, as little as one-fifth of this chlorine achieved the same reduction
(Hajenian and Butler, 1980).
Due to the highly reactive chemical nature of free chlorine (HOCl and OCl-), in secondary
effluents containing ammonium, it rapidly combines with ammonium to form chloramines, a
form of combined chlorine (U.S. EPA, 2002; Tree et al., 2003; Asano et al., 2007). Disinfection
with free chlorine can be achieved in ammonium-containing effluents if “breakpoint”
chlorination is practiced, in which sufficient free chlorine is added to convert all ammonium to
67
nitrogen. Free chlorine is a much stronger oxidant than combined chlorine, and is more effective
at inactivating pathogenic bacteria and coliphages than combined chlorine (Tyrrell et al., 1995;
Duran et al., 2003; Tree et al., 2003; Keegan et al., 2012). Combined chlorine will be discussed
in more detail in Section 6.5.2. It is important to note that both free chlorine and combined
chlorine can result in formation of hazardous disinfection byproducts such as trihalomethanes,
haloacetic acids, chlorite, and other hazardous compounds.
In a bench-scale study, Shin and Sobsey (2008) studied the inactivation of NoV by free chlorine
using molecular methods and compared its inactivation to F-specific RNA coliphage MS2 and
poliovirus type 1. F-specific RNA coliphage MS2 and poliovirus type 1 were measured using
both culture-based and molecular methods. The authors conducted experiments using 1 and 5 mg
per L free chlorine. Inactivation of NoV was similar to F-specific RNA coliphage MS2 and faster
than poliovirus type 1 when densities were measured using molecular methods. They also
showed that the CT (disinfectant concentration times contact time) required for NoV inactivation
was not significantly different from other viruses even though the molecular methods likely
overestimate the CT needed. Thus, the study authors concluded that chlorine is a useful
disinfectant for NoV.
If a study evaluates disinfected effluent, but does not report ammonium levels, it cannot be
determined whether free chlorine or combined chlorine was present. Of the six WWTPs
evaluated in Rose et al. (2004), four used chlorine disinfection, but only one of the WWTP had
ammonium levels that allowed for free chlorine. Rose et al. (2004) combined the data from the
four WWTPs and found that on average, 300 minutes of contact time with chlorine (or combined
chlorine) in secondary effluent resulted in a 3-log10 reduction of enterococci, whereas 500
minutes of contact time were required for a 3-log10 reduction of enteroviruses. Data from the
WWTP with free chlorine disinfection of nitrified and filtered effluent is show in Table 16. More
studies that compare chlorine inactivation of FIB, indigenous F-specific and somatic coliphages,
and enteric viruses in nitrified effluent are needed.
Table 16. Average (and percent positive) microorganism effluent densities in a WWTP with
free chlorine treatment of nitrified and filtered secondary wastewater.
Treatment
Microorganism
Total coliform
CFU/100 mL
Enterococci
CFU/100 mL
Somatic and F-
specific
coliphages
PFU/100 mL
F-specific
coliphages
PFU/100 mL
Enterovirus
MPN/100 mL
Influent 3.41 x 10⁷
(100%)
7.36 x 10⁵
(100%)
2.84 x 10⁵
(100%)
3.14 x 10⁵
(100%)
1.52 x 10⁴
(100%)
Filtered and
disinfected with
free chlorine
11.3
(60%)
0.2 detection
limit
(0%)
10.4
(80%)
10.4
(80%)
0.3
(80%)
Source: Rose et al. (2004)
Over a 13-month period water samples were taken at Easterly WWTP in Vacaville, California
and evaluated for FIB, F-specific coliphages, NoV, and other pathogens (Olivieri et al., 2012).
This WWTP has bar screens, grit removal, primary clarification, secondary treatment with
activated sludge, secondary clarification, nitrification, and chlorine disinfection and de-
68
chlorination. Log10 removal of fecal coliform through secondary disinfection was a median of
6.8-log10 (range 6.1- to 8.4-log10; all non-detects were set at the detection limit). In finished
effluent, fecal coliforms were not detected in 50 of the 55 samples (<2 MPN per 100 mL
detection limit), and the remaining 5 were at the limit of detection. For enterococci, log removals
through secondary disinfection was a median of 5.8-log10 (range 3.2- to 6.2-log10; all non-detects
were set at the detection limit). In finished effluent, enterococci were not detected in 22 of 32
samples (<1 MPN per 100 mL detection limit). The 10 detectable enterococci samples ranged
from 1 to 648.8 MPN per 100 mL. F-specific coliphages were detected in all 32 influent samples.
Densities ranged from 60 PFU per 100 mL to 13,000 PFU per mL, with a median of 2,750 PFU
per 100 mL. F-specific coliphages in the final disinfected and dechlorinated effluent were below
the detection limit (<1 PFU/100 mL) in all but two samples. One sample was at the detection
limit (1 PFU/100 mL), and the other sample was 2 PFU per 100 mL. The log removal of F-
specific coliphages had a median of 3.4-log10 (range 1.8- to 4.1-log10). NoV were present in the
ten WWTP influent samples and not detected in eleven final disinfected and dechlorinated
effluent samples (Olivieri et al., 2012). This demonstrates that free chlorine applied to nitrified
effluent is quite effective at inactivating F-specific coliphages and NoV.
6.5.2 Combined Chlorine
As stated above, studies have shown that in secondary effluent with ammonium, the free chlorine
rapidly combines with the ammonium to form chloramines (Asano et al., 2007). Combined
chlorine compounds are less effective at inactivating microorganisms than free chlorine (Tyrrell
et al., 1995; Duran et al., 2003; Tree et al., 2003; Keegan et al., 2012).
Tree et al. (2003) studied the chlorine-mediated inactivation of both seeded (E. coli,
Enterococcus faecalis, GI F-specific RNA coliphage MS2, and poliovirus – all measured using
culture-based methods) and naturally occurring (E. coli, enterococci, F-specific coliphages, and
enterovirus – also using culture-based methods) bacterial and viral indicators in primary sewage
effluent. The inactivation rates of three applied doses of free chlorine (8, 16, and 30 mg per L)
were investigated in both seeded sterilized primary effluent and unsterilized primary effluent.
Although free chlorine was applied, Tree et al. (2003) found that the amount of free chlorine
available in effluent decreased rapidly within the first 5 minutes and then remained
approximately constant for the duration of the experiments (30 minutes). In both experiments,
the authors found that FIB (E. coli and enterococci) were inactivated more rapidly and at lower
doses than the viruses (F-specific coliphages, poliovirus, and enterovirus) and that chlorine dose
and time of exposure had significant effects on survival of all organisms tested in both
experiments (Table 17). Both E. coli (laboratory-cultured and indigenous) and enterococci had
linear degradation rates and were completely inactivated over the course of the experiment at all
chlorine applications tested. In contrast, enteroviruses had biphasic degradation rates, with a
rapid initial rate, followed by a slower inactivation rate. F-specific RNA coliphages (both
laboratory-cultured and naturally occurring) only showed degradation for the first 5 minutes of
exposure after which no further degradation occurred. The authors suggest that the slower rate of
degradation for enteroviruses and lack of degradation of F-specific RNA coliphages after 5
minutes is likely due to the weaker effect of combined chlorine on viruses. The authors conclude
that F-specific RNA coliphages are a useful and conservative model surrogate for chlorine
inactivation of viruses in sewage (Tree et al., 2005).
69
Table 17. Log10 reduction of FIB, enteric virus, and F-specific coliphages in sewage matrix
To compare the effects of UV wavelengths present in sunlight on both coliphages and enteric
viruses, Lee and Ko (2013) exposed F-specific RNA coliphages MS2 and MNV, to UVA and
UVB lamps. For all experiments, viruses were suspended in either saline solution or groundwater
and viral densities were measured by EPA Method 1602 (MS2) or plaque assays (MNV). UVA
irradiation resulted in a negligible effect on both F-specific RNA coliphages MS2 and MNV
across the dose range tested (0 to 1500 mJ per cm2). In contrast, MNV was found to be
significantly more susceptible to UVB than MS2; exposure to 376 mJ per cm2 UVB resulted in a
7 Sewage from the Ruakura Research Centre, near Hamilton, New Zealand fed into the advanced pond system. The
F-specific coliphage level was consistently low in the Ruakura sewage, so primary treated sewage from Hamilton
City was “spiked” into the pond system.
77
4-log10 reduction of MNV whereas 909 mJ per cm2 UVB was required for the same reduction of
F-specific RNA coliphage MS2 (Lee and Ko, 2013). Duizer et al. (2004) found that caliciviruses
(enteric canine calicivirus no. 48 and respiratory FCV F9) were more susceptible to UVB than
coliphages as <50 mJ per cm2 UVB resulted in a 4-log10 reduction of both viruses (as determined
by cell culture) when suspended in buffer.
78
7. Conclusions
This review provides background information relevant to the use of coliphages, specifically
somatic and F-specific coliphages, as indicators of fecal contamination. The following is a
summary of the major conclusions of this review.
Methods. Coliphage enumeration methods are adequate for water quality monitoring. EPA
Method 1601 may be the most useful. Rapid methods are possible and MST methods for
coliphage are under development. The ability to measure both somatic and F-specific coliphages
on a single host may be useful, but needs validation (Rose et al., 2004; Guzmán et al., 2008).
EPA is currently evaluating a membrane filtration culture method and may also evaluate an
ultrafiltration culture method for use in coliphage enumeration. The intralaboratory (single
laboratory) method validation study is underway.
Epidemiological studies. This review summarizes eight epidemiological studies that evaluated
the relationship of coliphages and gastrointestinal illness from exposure to recreational water.
Five of the eight studies found a statistically significant relationship between F-specific
coliphages and illness levels (Lee et al., 1997; Colford et al., 2005, 2007; Wiedenmann et al.,
2006; Wade et al., 2010; Griffith et al., personal communication, 2015). One of the studies found
a statistically significant increase in RR of GE in bathers when somatic coliphage levels were
above the NOAEL of 10 PFU per 100 mL (Wiedenmann et al., 2006).
Occurrence in the Environment. Some studies have reported an association between the
presence of coliphages and human viruses, while other studies have found no association
between their presence in environmental waters. The results are strongly influenced by the
environments in which the studies are conducted. For example, an association between indicators
and pathogens has more often been reported for brackish and saline water than for freshwater.
There is evidence that coliphage and F-specific coliphage densities are more strongly associated
with pathogens than other traditional indicators (E. coli, enterococci, and fecal coliforms).
Environmental Fate. Coliphages might be reasonable surrogates for enteric viruses in the
environment. Human viruses and coliphages both decay faster at temperatures above 50°C
compared to lower temperatures. Human viruses and coliphages both decay faster in sunlight
than in the dark and are most stable near neutral pH (~6 to 9), but can also survive in lower pH
environments (i.e., in the gastrointestinal tract of warm-blooded animals). The effect of salinity
is equivocal and some studies have shown increased and others decreased inactivation in higher
salinity waters. In fresh, treated, septic, and salt water, predation and environmental factors (e.g.,
temperature, sunlight, pH) have been shown to increase degradation of both coliphages and
enteric viruses. Organic and inorganic matter affect inactivation—both have been shown to
increase or decrease decay rates, depending on the virus and the nature of the composition of the
organic or inorganic matter. There are synergistic or antagonistic interactions between all these
environmental stressors.
Wastewater treatment. For primary and secondary treatment, the removal efficiencies of FIB,
F-specific coliphages, somatic coliphages, and enteric viruses are not substantially different.
Disinfection is the key step in wastewater treatment for microbial inactivation. Although
79
disinfection efficacies vary depending on the details of the treatment process, and the
characteristics of the incoming water at each step, some general conclusions are possible. UVC
and ozone are most effective at virus inactivation, followed by free chlorine. Combined chlorine
is not as effective at virus inactivation as the other disinfection treatments. For free chlorine
(chlorination of nitrified effluents), there are insufficient data to draw conclusions about the
relative inactivation efficiencies of FIB, indigenous F-specific coliphages, indigenous somatic
coliphages, and enteric viruses. For combined chlorine (non-breakpoint chlorination of un-
nitrified effluents), F-specific coliphages and enteric viruses are more resistant to inactivation
than FIB. In laboratory studies of UVC disinfection, coliphages and enteric viruses are generally
more resistant to inactivation compared to FIB. However, the inactivation rates of individual
strains of F-specific and somatic coliphages, as well as enteric viruses, are variable. For example,
adenovirus is highly resistant to UVC. With the exception of ozone, F-specific and somatic
coliphages overall are likely to be more conservative indicators than FIB in water treated by
most disinfectants.
Overall. Table 23 compares coliphage attributes against the currently recommended indicators
of fecal contamination, E. coli and enterococci. Each indicator/method combination is
summarized and compared against indicator attributes described in Section 1.3. While some of
the same limitations exist, coliphages are likely a better indicator of viruses in fecal
contamination than the current FIB (i.e., enterococci and E. coli).
80
Table 23. Attributes of fecal contamination indicators.
Indicator
Attribute
Enterococci
(e.g. EPA Method 1600)
E. coli
(e.g. EPA Method 1603)
Coliphages
(e.g. EPA Method 1602)
Intestinal microflora of warm-
blooded animals
Yes Yes Yes
Present when pathogens are
present and absent in
uncontaminated samples
Present when fecal
pathogens are present, but
may also be present in
nonfecally contaminated
ambient water.
Present when fecal
pathogens are present, but
may also be present in
nonfecally contaminated
ambient water.
Present when fecal pathogens are
present, but is likely absent in
nonfecally contaminated ambient
water.
Not indicative of viruses in
WWTP effluent.
Not indicative of viruses
in WWTP effluent.
Better surrogate for viruses than
enterococci or E. coli in WWTP
effluent.
Present in greater numbers
than the pathogen (in this case,
human viruses)
Depends on sourcea Depends on sourcea In most cases
Equally resistant as pathogens
(in this case viruses) to
environmental factors
Not as resistant as viruses Not as resistant as viruses Under most conditions
Equally resistant as pathogens
(in this case viruses) to
disinfection in water and
WWTPs
Not as resistant as viruses
(except for ozone).
Not as resistant as viruses
(except for ozone).
Under most conditions.
However, adenovirus is more
resistant than coliphages and
other enteric viruses to UV
inactivation.
Should not multiply in the
environment
Can multiply in the
environment
Can multiply in the
environment
Not likely enough to affect
criteria levels
Detectable by means of easy,
rapid, and inexpensive
methods
Yes, but need EPA Method
1611 for rapid
enumeration. Other easy
and rapid methods are
available.
Yes, but EPA method is
not considered rapid
(requires overnight
incubation). Other easy
and rapid methods are
available.
Yes, but Method 1601 needs
validation for quantification.
Other easy and rapid methods are
available.
Indicator organism should be
nonpathogenic
Generally nonpathogenicb Generally nonpathogenic.c Nonpathogenic
Demonstrated association with
illness from epidemiological
studies
Yes Yes Yes
Specific to a fecal source or
identifiable as to source of
origin
Not EPA Method 1600, but
MST methods being
developed.
Not EPA Method 1603,
but MST methods being
developed.
Not EPA Method 1602, but MST
methods being developed.
a In raw sewage FIB are present in greater numbers than pathogens. Viruses are less vulnerable to treatment processes
than bacteria, so could survive treatment in greater numbers than bacteria. b Enterococci can be pathogenic or antibiotic resistant in some settings, like hospitals, but generally not in ambient water. c Enterohemorrhagic E. coli, specifically O157:H7, grows poorly at 44°C and is often negative for beta-glucuronidase, so
is not detected by Method 1603 (Degnan and Standridge, 2006). Other pathogenic strains could be detected by EPA
9-20-12 Google coliphage indicator environment 20 2
9-25-12 PubMed Policies and practices for beach
monitoring
40 2
9-25-12 Google
Scholar
coliphage detection in fresh water 20 2
9-25-12 Google
Scholar
coliphage presence in environment
review
20 2
9-25-12 Google
Scholar
alternative indicators of fecal
pollution
20 2
9-26-12 Google
Scholar
Bacteriophage in the environment 20 4
9-27-12 Google
Scholar
environmental detection coliphage 40 4
9-27-12 Google
Scholar
coliphages environment 40 4
9-27-12 Google
Scholar
fecal source tracking 40 4
10-1-12 PubMed coliphage source tracking 30 2
The document was undergoing internal EPA review and external peer review throughout 2013-
2014. Additional supplemental searches were conducted to address EPA internal and external
peer reviewer comments. Ultimately, over 2,500 titles were reviewed for inclusion in the
literature review. There are 342 citations in the final document.
The Quality Assurance Project Plan includes Information Decision Criteria for selection of cited
references. The relevant Information Decision Criteria for this project from the Quality
Assurance Project Plan includes:
1. More recent references were preferred over older references, unless the older reference
was particularly notable, important, or widely cited.
2. Accessibility – References needed to be obtained within project time and budget
constraints.
3. English language was required.
4. Scientific, peer-reviewed publications were preferred, along with others references that
presented a balanced and objective tone. Government publications such as federal
regulations, state regulations, standards, permits, guidance documents, and other
government publications were acceptable.
5. The reference related to the scope of the information sought. In this case a document
outline was available.
6. Geographic relevance – Data collected in the U.S was preferred, but data from other
countries was also relevant.
113
7. For a given topic, a literature review citation may have been used in lieu of listing
numerous primary research articles cited in the literature review. This was done when
the additional detail provided by the primary citations was not needed.
8. If a particular point was already in the document and a citation was already provided,
additional citations backing up this same point were not added. Redundant articles were
not necessarily cited.
9. Information provided through personal communication (phone, email) was used only
when another more widely obtainable source was not available for the same
information. Information obtained through personal communication needed to be
highly relevant.
10. Books citations were acceptable, but sources that could be more easily obtained were
preferred. Book citations were preferred when the book is an important resource in the
field.
11. Newspaper articles were not searched or cited.
12. Websites were not cited as primary sources of information. URLs are provided for
some of the references.
13. Information and references that presented alternative points of view or conclusions to
the mainstream view were given equal considerations to consensus or majority
viewpoints. Both alternative and majority viewpoints and conclusions had to provide
justification based on facts, employ accepted methodologies, and be grounded in the
scientific method.
114
APPENDIX B: Coliphage and NoV Densities during Wastewater Treatment
Table A illustrates how coliphage reduction compares to NoV reduction during wastewater treatment. To be included in Table A, the
study has to include quantitative norovirus data, quantitative coliphage data, and water samples from raw sewage or effluent. The
studies are listed in chronological order by year of publication.
Table A. Coliphage and NoV densities during wastewater treatment.
Organism Influent (raw) Effluent
Log
reduction
(log10)
Treatment Location Reference
NoV
(RT-qPCR)
Mean 2 × 10⁵
PCR detectable
unit per L
NRa 1.8 Non-disinfected activated
sludge secondary
treatment (preceded by
primary and phosphorus
removal);
No design/operational
information provided to
understand secondary
treatment or performance.
Netherlands Lodder and de
Roda
Husman, 2005
F-specific
bacteriophages
(ISO 10705-1)
Mean 106
PFU per L
NRa 1.6
Somatic
coliphages
(ISO 10705-2)
Mean 106
PFU per L
NRa 1.1
NoV GI
(RT-qPCR)
0.17–260 copies
per mL (range)
NR 2.27 ± 0.67 Activated sludge
secondary treatment and
chlorination;
No design/operational
information provided to
understand secondary
treatment or performance;
no information if this is
free chlorine, combined
chlorine, ammonia
concentration.
Tokyo, Japan Haramoto et
al., 2006
NoV GII
(RT-qPCR)
2.4–1900 copies
per mL (range)
NR 3.69 ± 1.21
F-specific
coliphages
(ISO 10705-1)
NR NR 2.81 ± 0.77
NoV
(RT-qPCR)
Mean 3.29 ± 0.26
(<2.9–3.65) log10
MPN PCR units
per L
NR 0.89 ± 0.26
(0.39->1.3)
Non-disinfected chemical
precipitation and activated
sludge (1 plant filtered the
effluent and 1 plant
provided additional
nitrogen removal);
Sweden Ottoson et al.,
2006
F-specific
coliphages
(ISO 10705-1)
NR NR 1.73 ± 0.59
(0.74-2.63)
115
Organism Influent (raw) Effluent
Log
reduction
(log10)
Treatment Location Reference
Somatic
coliphages
(ISO 10705-2)
NR NR 1.04 ± 0.32
(0.61-1.86)
No design/operational
information provided to
understand secondary
treatment or performance.
Somatic
coliphages
(ISO 10705-2)
Mean 2.9 × 10⁶
(± 2 × 10⁶) PFU
per mL
Mean 2.5 × 10⁴ (± 2.9 ×
104) PFU per mL
Mean 2.16 ±
0.42
Activated sludge
secondary treatment and
chlorination;
No design/operational
information provided to
understand secondary
treatment or performance;
no information if this is
free chlorine, combined
chlorine, ammonia
concentration.
Italy Carducci et
al., 2009
Somatic
coliphages
(EPA Method
1602)
Mean 1.8 × 10⁵
PFU per 100 mL
Mean 102 PFU per 100
mL
2.4 Non-disinfected activated
sludge secondary
treatment;
No design/operational
information provided to
understand secondary
treatment or performance.
Singapore
Aw and Gin,
2010
F-specific
coliphages
(EPA Method
1602)
Mean 4.3 × 10⁴
PFU per mL
Mean 102 PFU per 100
mL
2.4
NoV GI
(RT- qPCR)
Mean 3.2 × 10⁵
copies per 100
mL
Mean 7.1 × 10³ copies
per 100 mL
~2b
NoV GII
(RT-qPCR)
Mean 2.3 × 10⁵
copies per 100
mL
Mean 5.2 × 10³ copies
per 100 mL
~2b
Somatic
coliphages (EPA
Method 1602)
Range 9.1 × 10⁴
to 4.5 × 10⁵ PFU
per 100 mL
Range 3 to 63 PFU per
100 mL
NR Conventional secondary
treatment with chlorine
disinfection. No
design/operational
information provided to
understand secondary
treatment or performance.
Ohio, United
States
Francy et al.
2011
F-specific
coliphages (EPA
Method 1602)
Range 3.1 × 10⁵
to 2.2 × 10⁷ PFU
per 100 mL
Range <1 to 37 PFU
per 100 mL
NR
NoV GI (qRT-
PCR)
Range 230 c to
2.2 × 10³ GC per
L
Range <2.7 to 1.8 c GC
per L
NR
116
Organism Influent (raw) Effluent
Log
reduction
(log10)
Treatment Location Reference
Somatic
coliphages (EPA
Method 1602)
Range 2.4 × 10⁴
to 3.0 × 10⁶ PFU
per 100 mL
All <1 PFU per 100 mL NR Conventional tertiary
treatment (sand filtration)
with UV disinfection. No
design/operational
information provided to
understand secondary
treatment or performance.
F-specific
coliphages (EPA
Method 1602)
Range 3.8 × 10⁴
to 2.1 × 10⁵ PFU
per 100 mL
All <1 PFU per 100 mL NR
NoV GI (qRT-
PCR)
Range <560 to
<8.3 × 10³ GC
per L
Range <36 to <67 GC
per L
NR
Somatic
coliphages (EPA
Method 1602)
Range 2.6 × 10⁴
to 2.2 × 10⁶ PFU
per 100 mL
Range <1 to 1.1 × 10³
PFU per 100 mL
NR Membrane bioreactor
(Kubota® Membrane
Systems by Ovivo MBR)
with UV disinfection. No
design/operational
information provided to
understand secondary
treatment or performance.
F-specific
coliphages (EPA
Method 1602)
Range 3.8 × 10⁴
to 1.9 × 10⁶ PFU
per 100 mL
Range <1 to 19 PFU
per 100 mL
NR
NoV GI (qRT-
PCR)
Range 49 c to 1.8
× 104 GC per L
Range <1.5 to <130 GC
per L
NR
Somatic
coliphages
(EPA Method
1602)
Range 2.6 × 10⁴
to 2.2 × 10⁶ PFU
per 100 mL
Range <1 to 8 PFU per
100 mL
NR Two medium-sized
KubotaTM (Osaka, Japan)
system microfiltration
membrane bioreactors
with UV disinfection. No
design/operational
information provided to
understand secondary
treatment or performance.
Ohio, United
States
Francy et al.,
2012
F-specific
coliphages
(EPA Method
1602)
Range 3.8 × 10⁴
to 1.9 × 10⁶ PFU
per 100 mL
Range <1 to 2 PFU per
100 mL
NR
NoV (qPCR,
qRT-PCR)
Range 49 c to 1.8
× 104 GC per L
Range <1.5 to <53 GC
per L
NR
Somatic
coliphages
(EPA Method
1602)
Range 2.4 × 10⁴
to 3.0 × 10⁶ PFU
per 100 mL
<1 PFU per 100 mL NR One small-sized
conventional secondary
plant with tertiary
treatment and UV
disinfection. No
design/operational
information provided to
F-specific
coliphages
(EPA Method
1602)
Range 1.1× 10⁴
to 2.1 × 10⁵ PFU
per 100 mL
<1 PFU per 100 mL NR
117
Organism Influent (raw) Effluent
Log
reduction
(log10)
Treatment Location Reference
NoV (qPCR,
qRT-PCR)
Range <5.6 × 10²
to <8.3 × 10³ GC
per L
Range <36 to <67 GC
per L
NR understand secondary
treatment or performance.
Somatic
coliphages
(EPA Method
1602)
Range 9.1 × 10⁴
to 4.5 × 10⁵ PFU
per 100 mL
Range 3 to 63 PFU per
100 mL
NR One medium-sized
conventional secondary
plant with chlorine
disinfection. No
design/operational
information provided to
understand secondary
treatment or performance.
F-specific
coliphages
(EPA Method
1602)
Range 3.1 × 10⁵
to 2.2 × 10⁷ PFU
per 100 mL
Range <1 to 37 PFU
per 100 mL
NR
NoV (qPCR,
qRT-PCR)
Range 2.3 × 10²c
to 1.5 × 10³ GC
per L
Range <1.8 c to <2.7
GC per L
NR
F-specific RNA
coliphages
(double agar
layer)
NR Means 5 × 10³ to 5 ×
105 PFU per L
NR Secondary treated
wastewater (2 WWTPs)d
Australia Keegan et al.,
2012
Somatic
coliphages
(double agar
layer)
NR Means 9 × 10⁴ to 1.67 ×
105 PFU per L NR
NoV
(RT-qPCR) NR
Means ND to 2.7 × 10⁵
genomes per L NR
Secondary treated
wastewater (5 WWTPs)
NoV GI
(RT-qPCR)
Mean 3.32 ± 0.64
(range 2.05–4.76)
log10 density
Mean 2.53 ± 0.57
(range 1.26–4.06) log10
density
0.80 ± 0.49 Non-disinfected activated
sludge secondary
treatment;
No design/operational
information provided to
understand secondary
treatment or performance.
Ireland Flannery et
al., 2012
NoV GII
(RT-qPCR)
Mean 3.55 ± 0.89
(range 1.81–5.34)
log10 density
Mean 2.63 ± 0.71
(range 1.51–4.08) log10
density
0.92 ± 0.76
F-specific
coliphages
(ISO 10705-1)
Mean 5.54 ± 0.51
(range 3.87–6.82)
log10 density
Mean 3.41 ± 0.77
(range 2.00–5.84) log10
density
2.13 ± 0.76
Somatic
coliphages (ISO
10705-2)
Mean 7.10 ±
0.40-log10 PFU
per L
Mean 4.99 ± 0.53-log10
PFU per L
2.11 ± 0.40 Rainy days: Activated
sludge, chlorination. No
design/operational
Italy Carducci and
Verani, 2013
118
Organism Influent (raw) Effluent
Log
reduction
(log10)
Treatment Location Reference
NoV
(RT-qPCR)
Mean 5.83 ±
2.87-log10 GC
per L
Mean 5.80 ± 2.75-log10
GC per L
0.02 ± 0.61 information provided to
understand secondary
treatment or performance.
Somatic
coliphages (ISO
10705-2)
Mean 7.22 ±
0.40-log10 PFU
per L
Mean 5.00 ± 0.56-log10
PFU per L
2.21 ± 0.46 Dry days: Activated
sludge, chlorination. No
design/operational
information provided to
understand secondary
treatment or performance.
NoV
(RT-qPCR)
Mean 5.92 ±
2.86-log10 GC
per L
Mean 6.04 ± 2.94-log10
GC per L
−0.11 ± 0.34
F-specific RNA
coliphages (ISO
10705-1)
Mean 5.26-log10
PFU per 100 mL
Mean 2.96-log10 PFU
per 100 mL
NR Screening and grit
removal, phosphate
removal through ferric
sulfate, secondary
treatment, UV
disinfection. No
design/operational
information provided to
understand secondary
treatment or performance.
United States Flannery et al.
2013
F-specific RNA
coliphage (RT-
qPCR)
Mean 5.11-log10
GC per 100 mL
Mean 4.57-log10 GC
per 100 mL
NR
NoV GII (RT-
qPCR)
Mean 3.87-log10
GC per 100 mL
Mean 3.61-log10 GC
per 100 mL
NR
F-specific RNA
coliphages (ISO
10705-1)
Range 5.9 × 10⁴
to 7.5 × 10⁵ PFU
per L
Range 1.5 × 10³ to 2.5 ×
104 PFU per L
NR Primary sedimentation.
Influent data includes
samples taken when
treatment was interrupted.
No design/operational
information provided to
understand secondary
treatment or performance.
Fjellfoten,
Norway
Grøndahl-
Rosado et al.
2014
NoV GI (qPCR) Range 2.9 × 10³
to 1.4 × 10⁶ GC
per L
Range 5.6 × 10³ to 9.2
× 104 GC per L
NR
NoV GII (qPCR) Range 6.0 × 10⁴
to 1.4 × 10⁷ GC
per L
Range ND to 2.0 × 10⁵
GC per L
NR
Somatic
coliphages (ISO
10705-2.2)
Mean 4.9 × 10³
PFU per mL
Range <0.01 to 2.5 ×
104 PFU per mL
Range of
Mean
Reduction
0.6 ± 0.6 to
5.2 ± 1.2
Raw municipal post-
screen wastewater influent
and effluent from three
pilot-scale sand filters
with different filter
material and grain size
designs and one with a
separate phosphorous
removal unit. No
design/operational
Kuopio,
Finland
Kauppinen et
al. 2014
F-specific
coliphages (ISO
10705-1)
Mean 3.6 × 10³
PFU per mL
Range <0.01 to 1.8 ×
104 PFU per mL
Range of
Mean
Reduction
0.7 ± 0.6 to
5.3 ± 1.3
119
Organism Influent (raw) Effluent
Log
reduction
(log10)
Treatment Location Reference
NoV GI (RT-
PCR)
Mean 80 GC per
mL
Range <0.5 to 1.5 × 10³
GC per mL
Range of
Mean
Reduction
0.6 ± 0.6 to
2.2 ± 0.8
information provided to
understand treatment or
performance.
NoV GII (RT-
PCR)
Mean 2.3 × 10⁴
GC per mL
Range <0.4 to 1.1 × 10⁴
GC per mL
Range of
Mean
Reduction
0.5 ± 0.2 to
4.0 ± 0.6
Density units are as reported in the cited reference.
NR = not reported (in some cases effluent or influent densities were not reported, but log10 reduction was reported); Stm WG49 = Salmonella
enterica serovar Typhimurium WG49 (host); ND = Not detected; GC = genome copies a PFU reported in graphical format for influent, digester, high rate pond, algal settling pond, and maturation pond b Estimated from figure c Reported as estimated value extrapolated at the low end. PCR threshold cycles were past the upper limit of the standard curve. d Information from Table 3.6 and 3.7 in Keegan et al. (2012). The Bolivar WWTP consists of primary treatment (screening, grit removal,
sedimentation), activated sludge, lagoon (16 day retention), chlorination (or dissolved air flotation and chlorination); collected undisinfected
samples from the lagoon influent (thus secondary effluent), lagoon effluent, and post dissolved air flotation prior to chlorination. Two Melbourne
WWTPs were tested: MW1 – primary settling, ASP (not defined); MW2 – anaerobic digestion (not defined), ASP (not defined), and lagoon
polishing (26 days). This study was done for a very specific focus related to water recycling.