Health and Safety Executive Review of fit test pass criteria for Filtering Facepieces Class 3 (FFP3) Respirators Prepared by the Health and Safety Laboratory for the Health and Safety Executive 2015 RR1029 Research Report
Transcript
Health and Safety Executive
Review of fit test pass criteria for Filtering Facepieces Class 3 (FFP3) Respirators
Prepared by the Health and Safety Laboratory for the Health and Safety Executive 2015
RR1029Research Report
Shirley Frost BSc, Rhiannon Mogridge MPhys and Martin Roff BSc MScHealth and Safety LaboratoryHarpur HillBuxtonDerbyshire SK17 9JN
Respiratory Protective Equipment (RPE) is available in a range of types which often include a tight-fitting facepiece which must fit the wearer’s face well for the RPE to work effectively. Good fit must be demonstrated by fit testing.
In this study, 25 volunteer test subjects wearing tight-fitting FFP3 (randomly selected from 9 different models) underwent four fit tests (Bitrex qualitative taste test, Portacount particle counting with and without the N95 companion technology and the laboratory chamber method), in random order, according to methodology given in HSE guidance 282/28. The selected FFP3 model worn by each test subject was not adjusted until all four fit tests had been completed.
Results analysed according to the criteria given in the American National Standard for fit test validation, indicate that the Portacount fit test method is more difficult to pass than the other methods. Differences in the methodologies and the potential for bias in the results across the fit test methods are discussed.
The study also shows that a fit-check should never be used as a substitute for a fit test.
Many of the FFP3 were poor at fitting the test subjects.
This report and the work it describes were funded by the Health and Safety Executive (HSE). Its contents, including any opinions and/or conclusions expressed, are those of the authors alone and do not necessarily reflect HSE policy.
Review of fit test pass criteria for Filtering Facepieces Class 3 (FFP3) Respirators
You may reuse this information (not including logos) free of charge in any format or medium, under the terms of the Open Government Licence. To view the licence visit www.nationalarchives.gov.uk/doc/open-government-licence/, write to the Information Policy Team, The National Archives, Kew, London TW9 4DU, or email [email protected].
Some images and illustrations may not be owned by the Crown so cannot be reproduced without permission of the copyright owner. Enquiries should be sent to [email protected].
Acknowledgements
The help of the following is acknowledged here and is very much appreciated:
- The valued members of the HSL PPE test subject volunteer team who gave their time, effort and energy and without whom the work would not have been possible
- The technical contribution made by Nick Baxter of the PPE team in helping and leading with many of these test runs
- The members of the PSMA respiratory protection product group for providing information about their FFP3 products and donating samples for use in the test runs
ii
iii
EXECUTIVE SUMMARY
Respiratory Protective Equipment (RPE) facemasks need to seal tightly to the wearer’s face in order to provide the expected protection. HSE recommends that a fit test be carried out for each RPE wearer as a part of the selection process to ensure a good seal (fit) is achievable. There are several fit test methods which are discussed in HSE’s guidance. Not all are suitable for all types of tight-fitting RPE facepieces, and different criteria are applicable in defining a good fit for each facepiece type. This study was concerned with the fit testing of class 3 filtering facepieces, known as FFP3 under the British and European Standard.
Approach
Current HSE guidance recommends several fit test methods as being suitable for FFP3 and these were compared and contrasted, along with the Portacount-with-N95-Companion technology; this is not currently an HSE-recommended method for FFP3 fit testing, but is recommended for fit testing FFP2 class of respirator. In total four consecutive fit test methods, qualitative Bitrex, quantitative Portacount (both with and without the N95-Companion technology) and the laboratory-generated salt aerosol (Total Inward Leakage - TIL) chamber fit test method were conducted on the same test subject wearing an FFP3, without adjustment to the fit between tests. Fit tests were conducted by Fit2Fit accredited fit testers following HSE guidance on fit testing. The American National Standard Institute (ANSI) Criteria for Evaluating New Fit Test Methods were used to set the design for the work and statistically analyse the results. The current pass criterion for a TIL or quantitative Portacount fit test for an FFP3 is a fit factor of at least 100 in every exercise.
Main findings
The methodology assumes that there is an absolute measure of fit of the FFP3 against which other fit test methods should be measured. There are difficulties associated with determining the fit of FFP3 by taking quantitative measurements, related to a permitted amount of particle penetration through the filter material, wearer-generated particles being counted as faceseal leakage, and differences in measurement methods. Therefore, no such absolute measure of fit exists for FFP3 and one of the fit test methods must be selected as the reference method; ANSI specifies that a generated particle method should be used; therefore, the TIL fit test method was used as the reference method. The ANSI criteria place emphasis on correct detection of poor fit with a test sensitivity of at least 0.95 required, which was only achieved with the Portacount (without-N95-Companion technology) fit test method.
This reference method gives fit factor results which are biased low, due to the faceseal leakage measurements including particle penetration though the filtering material. This effect may be significant, and may lead to less favourable statistics, in particular in relation to correctly predicting a pass.
Statistical analysis of the results obtained when working to the criteria laid down by the ANSI standard, and following current HSE guidance and the information given in the methodology section of this report, shows that reducing the pass criterion from the current 100 to 70 would improve the overall agreement between the Portacount fit test method and the reference method. The kappa statistic, test specificity, beta error and predictive value of a fail are all increased, whilst the test sensitivity and predictive value of a pass are decreased. Such a change would reduce the number of good fits which fail the Portacount fit
iv
test method and increase correlation between fit test results across all fit test methods for all FFP3 used in this study. However, this does lead to slightly less favourable statistics for correctly predicting a pass at 0.88, which is below that expected by the ANSI standard (0.95), but the calculated value may be biased low by the unavoidable inaccuracy of the reference method. However, this is still a higher value than is achieved by either the Bitrex or Portacount –with –N95-Companion technology fit test methods.
Of note are results relating to a pass criterion at 80, which give higher probability of correctly detecting a fail than those obtained with the Portacount criterion at 70. However, while test specificity and predictive value of a fail are within recommended values, they are lower than those obtained with the pass criterion at 70. The kappa statistic, which indicates agreement of this method with the reference method is marginally lower than that obtained when a pass criterion of 70 is used.
The FFP3 used in this study had a range of filtering efficiencies and were broadly categorised into two groups, described in this study as either standard or higher filtering efficiency. It is important to note that application of the ANSI criteria is not appropriate for either group when separated from the full data set due to insufficient data and therefore no firm conclusions can be drawn from analysis of these sub-sets of data. However, more detailed analysis of the data from FFP3 with higher filtering efficiencies, suggest that better correlation with the reference method is obtained with Portacount pass at 80, 90 or 100; with standard filtering efficiency FFP3 the data suggest better correlation with the reference method with a Portacount pass criterion of 70. Analysis of the FFP3 data with high filtering efficiencies suggests that the Bitrex method correlates better with the reference method than when the data relating to FFP3 with standard filtering efficiencies alone are examined,
Based on the data from all of the FFP3 used, this study has shown that using the N95-Companion technology with the Portacount could provide a measure of FFP3 fit, if the pass criterion applied is 100. However, overall this method is returning results which are not in quite such good agreement with the TIL method as the Portacount used on its own, with correlation closest at Portacount pass 70.
The Bitrex qualitative fit test method has been shown to give a good determination of fit in this study. It may have the potential to give the most accurate determination of true fit as the challenge particles do not pass through the filtering material in a form which can be detected, a problem which can occur when using quantitative fit test methods. The validity of this theory is supported by the results of analysis of standard and higher filtering efficiency FFP3 separately. However, the Bitrex qualitative fit test is a subjective method, dependent on the wearer’s taste response.
Additional findings
Whilst many of the findings are direct outputs from the statistical analysis and distribution of the data, subjective opinions were also recorded and played an important part. Subjective opinions of the fit, including the wearer fit-check, were demonstrated to be of very little value as a substitute for a fit test. Many of the test subjects complained that the design detail of a certain FFP3 was not conducive to correct donning and other test subjects, wearing the same FFP3, frequently and independently repeated the same complaint.
Many of the fit tests carried out in this study failed to meet the current HSE pass criterion for the fit test method. 61 of the test runs failed to pass any of the four fit test methods used. Four of the nine FFP3 models used demonstrated the ability to fit between 21% and 50% of the 25 test subjects (with a range of face sizes), according to all four fit test methods. For
v
the remaining five FFP3 models a fit was not achieved by any test subject in every fit test method.
As such, a significant proportion of the FFP3s tested did not fit a range of wearers. The importance of fit testing before relying upon an FFP3 for respiratory protection cannot be over emphasised. Poor attention to design detail of some FFP3s, with insufficient focus on the importance of good wearer fit, is a significant factor leading to poor fit.
This work has demonstrated the importance of fit testing to establish a suitable FFP3 for the individual wearer and that there is value in all of the fit testing methods used in this study.
6. APPENDIX A - HSL STATISTICIAN’S REPORT ON THE ANSI STANDARD* ......................................................................... 35
7. APPENDIX B - RESULTS SUPPLEMENTARY TABLES AND GRAPHS ........................................................................................ 40
1
1. INTRODUCTION
1.1 BACKGROUND
Tight-fitting Respiratory Protective Equipment (RPE) facepieces must seal well to the wearer’s face in order to work effectively and provide the expected protection. Faces come in all shapes and sizes, as do facepieces, and for each individual wearer a suitable facepiece must be selected which is capable of fitting their face well. A fit test is a means of selecting such a facepiece; it is a measure of how effectively a tight-fitting facepiece can seal to an individual wearer’s face.
It is important to understand that a fit test is a brief (about 10 minute), closely-controlled test and results should in no way be considered as indicative of the amount of protection a wearer can expect to receive in the workplace, where other uncontrolled factors are present.
1.2 FIT TEST METHODS APPLICABLE TO FFP3
FFP3 are a type of filtering facepiece (FFP) of the highest classification achievable under the European Standard BS EN 1491. They are tight-fitting facepieces and therefore require fit testing to comply with HSE Approved Codes of Practice 2,3,4. Current HSE guidance5 allows FFP3 to be fit tested using any of the methods discussed below, but for practical reasons the laboratory test chamber method is rarely carried out.
1.2.1 Qualitative (taste) fit test
This is a subjective method and is dependent upon the wearer’s sensitivity to the test agent. The wearer’s head is enclosed in a loose-fitting hood. An aerosol, containing a test agent, is directed into the hood and the taste response noted. After allowing the taste to dissipate, with the aid of a drink of water, the FFP3 is donned and the fit test is conducted but with a more concentrated test agent directed into the hood, whilst the wearer carries out a specific exercise programme. The fit is determined as a pass or fail, dependent upon whether or not the wearer can taste the test agent at any time during the exercises. These fit tests are well established and validated6,7 in the USA on filtering facepieces and half masks where the Occupational Safety and Health Administration (OSHA)8 has laid down protocols. There is also an American National Standard (ANSI/AIHA Z88.10 – 2010)9 for respirator fit testing methods. In this report this standard will be referred to as the ANSI standard.
The test agent can be either:
Bitrex (Denatonium Benzoate) or
Saccharin
This fit method can be used for all classes of filtering facepiece and half mask as the test agent is thought not to pass through the filtering material in detectable form, but to be able to get inside the facepiece only through any gaps between the face and the seal of the facepiece.
1.2.2 Quantitative fit tests
These are objective tests with a numerical output. There are two methods by which such measurements can be taken, the Portacount method or the laboratory test chamber method but, almost exclusively, the Portacount method is used in the UK.
2
1.2.2.1 The Portacount fit test
The Portacount measures the number of ambient particles per cubic centimetre (outside of the FFP3 being worn) and the number of particles per cubic centimetre inside of the FFP3, whilst specific exercises are carried out. The ratio of the measured concentrations is referred to as a fit factor and determines whether the fit test has been passed or failed.
The Portacount fit test method was first developed in the USA as a means of assessing the fit of full facemasks and elastomeric half masks10,11.
In the USA some NIOSH12-approved filtering facepieces can be fit tested using the Portacount. Other NIOSH12 filtering facepieces (whose classification permits) have a lower filtering efficiency, allowing some particles to pass through the filtering material (these filtering facepieces are classified as N95). For these, the additional N95-Companion technology is used, together with the Portacount, to give a more accurate determination of fit. The N95 Companion technology restricts the particles entering the Portacount to a size range which is known to be largely filtered out by these NIOSH filtering facepieces12. NIOSH12 certified RPE does not have the same classification criteria as CE13 marked RPE and therefore there is no direct correlation between their performances, including during a fit test. HSE guidance5 does not suggest the use of the N95-Companion for fit testing FFP3.
1.2.2.2 The laboratory test chamber (TIL) fit test
The laboratory test chamber fit test method requires the use of a generated salt aerosol and is based on the European Standard BS EN 1491 test method for measuring Total Inward Leakage (TIL). The salt aerosol mass concentration is measured both inside and outside of the FFP3, whilst specific exercises are carried out. The ratio of the measured mass concentrations is referred to as a fit factor and determines whether the test has passed or failed. Specialist facilities are required.
The TIL test method is long established, being one of the tests required for certification of filtering facepieces to the European Standard BS EN1491 from the origin of this standard, circa 1992. Generated-aerosol fit test methods have long been used as a reference method against which the value of other fit test methods has been assessed10,11. Other authors14 have concluded that a generated-aerosol fit test method is the most reliable method of determining fit for filtering facepiece respirators. The ANSI standard9 recommends such a fit test method for use as a reference for validating alternatives.
1.3 HISTORY OF FIT TESTING IN THE UK
HSE Guidance5 on conducting fit testing of RPE was first published in 2000 to support the requirement for fit testing in the Control of Asbestos at Work Regulations, CAWR (1987)15, This guidance on fit testing was applicable to RPE used against asbestos fibres and the pass criterion for an FFP3 was given as 100, when carrying out a quantitative fit test. The pass criterion remains at 100 to date and is applicable to all respiratory hazards.
Concerns have been raised within the RPE community and dating back to 2006, that the current HSE guidance on Portacount quantitative fit test pass criteria may be too stringent as applied to FFP3. One stakeholder carried out investigative laboratory test work, and this was discussed with HSE and technical experts within HSL. Findings suggested that particles passing through the filtering material could be contributing to the measure of fit; as a result HSE agreed that work was needed to investigate further.
3
Following this discussion a small number of comparative fit tests were carried out at HSL using the Portacount both with and without the N95-Companion and also the qualitative (Bitrex taste) fit test method. Volunteers donned an FFP3 and, without disturbing this fit, consecutive fit tests were carried out using these different fit test methods. The results showed that the fit test was much more likely to fail the same FFP3-wearer fit when using the Portacount fit test method compared to either of the other fit test methods, although the small number of test runs carried out did not allow great statistical confidence in the results. The results backed up the anecdotal experience of HSL fit testers.
It is worth noting, however, that the two methods – qualitative and quantitative – operate on two fundamentally different principles and that a degree of variation is to be expected. Additionally, poor competence in fit testing is further clouding the situation, although the introduction of the Fit2Fit17 competency scheme is helping to address this.
1.4 PROJECT AIMS
This project was commissioned to establish the facts, clarify the situation and recommend an evidence-based way forward. In particular, answering the following questions:
Can the Portacount be used without the N95-companion to reliably measure the fit of all FFP3 in typical fit testing environments? What would be a reasonable pass/fail criterion to apply?
Can the Portacount be used with the N95-Companion to reliably measure the fit of all FFP3 in typical fit testing environments? What would be a reasonable pass/fail criterion to apply?
4
2. METHODOLOGY
2.1 REFERENCE STANDARD FOR FIT TESTING
Ideally, existing UK fit test methods should be evaluated against an agreed standard method, which is universally accepted as an absolute means of measuring fit. No such standard exists, although generated aerosol methods of quantitatively measuring fit have generally been used as reference standards7,10,11,14 and the ANSI standard9 recommends this. The Laboratory test chamber fit test method (TIL test) is an example of a generated aerosol method. In this work, UK fit test methods have been evaluated against the TIL method.
2.2 EVALUATION CRITERIA – STATISTICAL POWER
HSE guidance document OC 282/285 refers to the ANSI/AIHA standard Z88.10-2010 Respirator Fit Testing methods9 as including suitable evaluation criteria for fit testing equipment. These criteria are given in the ANSI standard in Annex A2: Criteria for Evaluating new Fit test methods. This Annex was reviewed at HSL by a statistician with experience of RPE testing, and considered fit for the purposes of this work for cross validation of existing UK fit test methods. The statistician’s report can be found at Appendix A. Following the methodology given, the statistical power is required to be at least 95% (or 0.95) to be able to accept a new test method against a given accepted method.
Note: The power of this test is defined as the probability of correctly identifying a poor fit.
2.3 CHOICE OF FIT TEST METHODS
In order to give a complete picture of how well UK fit test methods compare, as many test methods as possible were deployed consecutively. This was restricted by the onus which could reasonably be placed on the volunteer test subjects. They were required to don an FFP3, fitting it as well and as securely as possible, and wear it without disturbing the fit whilst all of the fit test methods under comparison were conducted. The test methods chosen were:
the quantitative TIL test method – this being a generated aerosol method
the qualitative taste test using the Bitrex test agent – this is the test agent most commonly used in the UK for this method
simultaneously conducted quantitative tests using both a Portacount alone (without the N95-Companion technology), and a second Portacount-with-N95-Companion technology.
In this way 4 different methods (including a generated aerosol method) could be evaluated against one another in a test run. Each test run took about 60 minutes of wearing FFP3, from donning the FFP3 to removing it.
Outlines of the fit test methods are given in the introduction, section 1.2
2.4 REQUIREMENTS OF THE ANSI STANDARD
The ANSI standard requires that the sequential tests are conducted in a certain way and specifies certain criteria. These are outlined in the following sections 2.4.1-2.4.5.
5
2.4.1 Test subjects
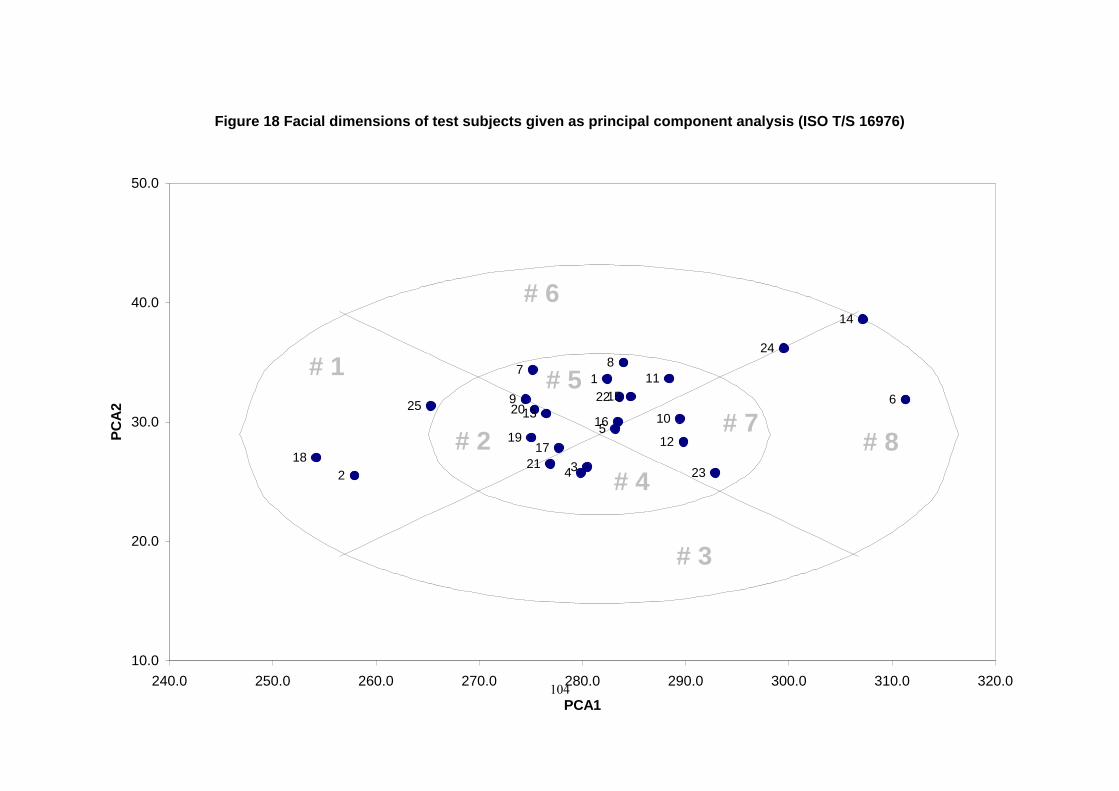
A total of at least 25 volunteer test subjects were needed, according to the ANSI standard. HSE ethical approval was given and 32 people volunteered to help with the study as test subjects. However, not everyone can taste Bitrex in low doses and this applied to 7 of the volunteers; this left 25 who were able to take part. All of these volunteers had anthropometric measurements taken of their face, in accordance with the technical specification ISO/TS 16976-218. Some of the test subjects were experienced at donning and wearing FFP3, others had never worn an FFP3 before.
2.4.2 FFP3 selected for use in the tests
The ANSI standard does not specify the number of different models which should be tested, although it does discuss using a variety of different sizes and models. All FFP3 are required to meet minimum standards, but some have significantly higher filtering efficiency than required. As it had been suggested that particles passing through the filter material could contribute to leakage measured during the Portacount test, FFP3 were selected with knowledge of their filtering efficiency. Manufacturers had submitted information on the performance of their products in the European Standard test1 requirement 7.9.2 “Penetration of filter material”. This information was used along with the design features of the FFP3 to select a range of 9 different FFP3 models for the testing. Three models had much higher filtering efficiency than the other 6. Filtering efficiencies are given in Table 1 as filter penetration levels. Note that the requirement to meet the standard is a filter penetration maximum of 1%.
Table 1 Approximate filter penetration of FFP3s selected
FFP3 Approximate filter penetration %
0.1 to 0.7
(standard efficiency) 0.004 to 0.06
(high efficiency)
M1 X
M2 X
M3 X
M4 X
M5 X
M6 X
M7 X
M8 X
M9 X
The range of design features represented within these 9 FFP3 included:
rigid pre-formed cup shape with no wearer nose adjustment
softer cup shape with a wearer-adjustable nose clip
fold flat with a vertical fold and wearer-adjustable nose clip
horizontal fold flat and wearer-adjustable nose clip
6
small section of faceseal material over nose only, remainder of seal formed by edge of filtering material
continuous elastomeric faceseal attached around the edge of the facepiece
continuous knitted fabric faceseal attached around the edge of the facepiece
adjustable elastic straps
fixed length elastic straps
All of the models had an exhalation valve, in common with most FFP3. Several manufacturers supplied samples of their FFP3 to use on the test runs.
2.4.3 Test order for sequential fit tests
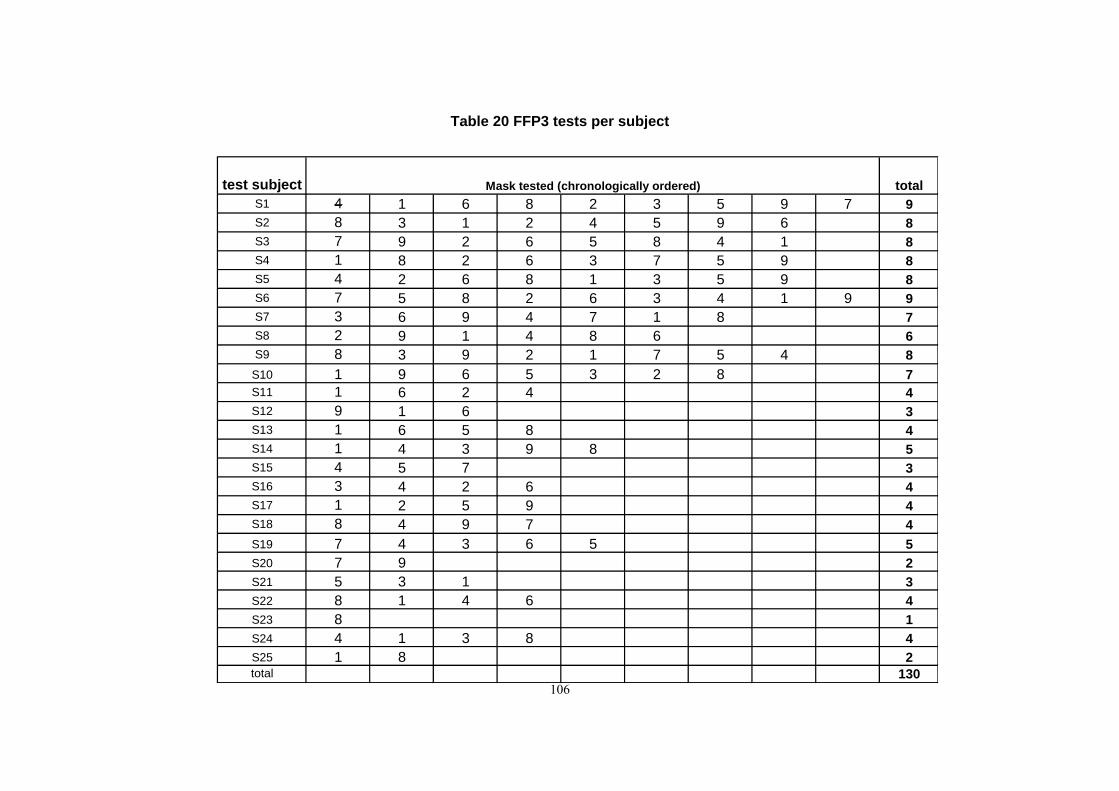
As required, the sequence in which the different fit tests were conducted was selected at random19 for each test run.
2.4.4 FFP3 test order
The order in which the 9 different FFP3 were used on test runs was selected at random19, for each individual test subject.
2.4.5 Total number of tests needed
This depends on a number of factors, principally the results of the test runs, which must meet certain criteria if they are to be included in the statistical analysis:
Reference fit test method fit factors had to be evenly distributed and not weighted towards low values.
Any reference fit test method fit factors within one coefficient of variation of the pass level had to be excluded. Details of how this was worked out are given in section 2.5.2, and followed the method suggested in the ANSI standard.
At least 100 valid tests runs were needed, of which at least 50 should fail the reference method and also be above 5% of the pass level for the reference fit test method. That is, with a reference pass level of fit factor 100, at least fifty tests should have fit factor between 5 and 100.
2.5 TEST METHOD DETAILS
2.5.1 Comparative test runs
2.5.1.1 FFP3 preparation
FFP3 facepieces were examined to ensure the absence of obvious manufacturing defects before a sampling port was applied in the most appropriate position for each model, following recommended practice as described in HSE guidance5. The sampling port was extended in to the ‘breathing zone’ described in paragraph 55 of the guidance5 and a ball probe attached. Where there was insufficient space for a ball probe to be used within the mask tested, a disc probe was used.
7
A second port was applied to the FFP3, in order to allow for detection of pressure changes inside of the FFP3 during the TIL test. This was located well away from the faceseal to reduce the chance of it becoming blocked by the test subject’s face.
The ports were sealed externally with rubber ‘bobbies’ if not needed for a fit test and replaced with sample tubing when needed, taking care not to disturb the fit of the FFP3.
The location of these ports was repeated each time the specific model of FFP3 was used, by reference to a prepared specimen sample.
2.5.1.2 Test subject preparation
The test protocol was approved by HSE Ethics committee and volunteers were recruited through the HSL PPE test pool of volunteers.
Volunteer test subjects were asked to be clean-shaven for the test run. To prevent interference of any strong tastes with the Bitrex test they were also asked not to eat or drink anything except water for about an hour before the test run. None of the volunteers were smokers.
Before each test run the Bitrex sensitivity test was carried out and the subject then asked to wash the Bitrex taste away by using plain water. At least 15 minutes were allowed to elapse and the test FFP3 was not donned until the Bitrex taste had cleared completely. This was considered especially important when the test order began with the Bitrex test.
Test subjects were then instructed to don the FFP3, following the manufacturer’s instructions and advice from the fit testers, sealing it to the face as correctly and as securely as possible. All research fit testers are accredited by the Fit2Fit scheme for both the Portacount and the Bitrex fit test methods.
Test subjects were then asked to carry out a fit-check, being instructed as necessary, and to comment on the fit of the FFP3. Test subjects were reminded that they should not disturb the FFP3 fit from this point until all 4 fit tests had been completed. The fit tester made a visual assessment of the fit. The following 4 fit test methods were then conducted, but not necessarily in the order given here, the test order was selected at random as explained in Section 2.4.3. After each of the 4 fit tests the test subject was asked to comment on the FFP3 fit and comfort and any changes. At the end of each test run the test subject was asked to comment again and the fit tester also visually reassessed the fit.
2.5.1.3 The Quantitative Total Inward Leakage TIL test
Tests were conducted in line with information given in the HSE guidance document OC 282/28. The methodology including the equipment used and the exercises performed is that given in the European Standard BS EN 1491 for the measurement of TIL. As this standard requires, measurements were taken using pulse sampling i.e. only when the test subject was breathing in and this was allowed for in the calculation. Both in-facepiece and chamber salt concentrations were continuously measured using two Moore’s Low Flow sodium flame photometers Type 1250 and the measurements logged electronically using Labview (National Instruments) software which also calculated the total inward leakage. From this the fit factor for each exercise was calculated.
8
2.5.1.4 The Qualitative Fit Test
As advised in HSE OC282/28 the equipment used complied with that specified in the OSHA 1910.134 standard8. The test hood and nebulisers used were those supplied with the 3M qualitative fit test kit. The Bitrex sensitivity and test solutions were made up at HSL as directed in the OSHA standard8 and using Bitrex supplied by Johnson Matthey Macfarlan Smith. Concentrations were confirmed by HSL analytical sciences team. The exercises and timings followed were those given in the OSHA standard, being the same as those given in HSE OC282/28. If the wearer had not tasted the Bitrex before the end of the test they were asked to carefully remove one of the bobbies to allow aerosol inside the FFP3 and so check that there was then sufficient aerosol in the hood to taste through this small leak.
2.5.1.5 The Portacount tests
The HSL test laboratories are air-conditioned. One consequence of this is that ambient particle levels are usually low, below the level which HSE recommends for Portacount fit testing. (Insufficient ambient particle count can be a problem when fit testing using this method. This is because a small amount of wearer generated particles will be counted by the Portacount as leakage11,23 and hence result in lower fit factors than their true value.) Therefore the tests were conducted inside a controlled temperature and humidity chamber which allowed for a homogenous concentration of particles to be maintained at the level recommended in HSE guidance, above 3000 particles per c.c. Particle levels were not allowed to get too high (above approximately 6000 particles per c.c.) to keep the levels in line with those typically experienced by fit testers. Particles were artificially generated by atomising a 1% salt solution. The size of these particles was measured and found to be distributed across a range which might be typical of the environment the Portacount fit tester could be expected to come across.
Simultaneous measurements were taken using two model 8030 TSI PortacountTM machines. The connection from the sampling port of the facepiece was split very close to the facepiece by use of a Y tube connection and each Portacount sampling tubing connected. One of these Portacount machines was equipped with the N95-Companion technology which was activated. The Portacounts were each operated from a dedicated laptop and using the Fitplus software version 3.4. Use of the N95-Companion requires a longer sampling period; therefore the Portacount without the N95-Companion unit had timings extended to match the longer N95-Companion timings. Apart from this timing change, tests were conducted in accordance with HSE guidance, with the test subject stepping on an aerobics step to increase their breathing rate, this being a common method in use by UK fit testers. The software calculates the fit factors for each exercise. Ambient particle levels were recorded during each test.
2.5.2 Coefficient of Variation - determination
The methodology for this comes from the report prepared by the statistician, see Appendix A.
A large proportion of the test runs required had been carried out before this assessment took place. From the results of those tests it was clear that it would not be unreasonable to follow the ANSI standard and use the TIL fit test method as the reference method. A measurement of Coefficient of Variation required assessment of the results from several repeat tests using this fit test method only. Separate HSE ethical approval was gained to carry out this test run which required one of the test subjects to wear an FFP3 for seven consecutive test runs,
9
without disturbing the fit. Between the tests the sample tubing and pressure measurement tubing were detached from the ports and reattached, replicating actions normally carried out between fit tests on the usual test runs. The FFP3 selected for this test run was one which had previously achieved a fit factor of approximately 100 on the volunteer test subject.
To be considered as a pass, all quantitative fit tests on FFP3 respirators are required to return a minimum fit factor of 100 on each and every test exercise. Therefore, the lowest fit factor of the 5 test exercises in each TIL test is critical in determining whether the test has passed or failed. The standard deviation of the lowest fit factor on each of the 7 consecutive test runs was used to determine the Coefficient of Variation.
10
3. RESULTS AND DISCUSSION
This section is supported by graphs and tables given in Appendix B and which are referred to individually in this text.
3.1 OVERVIEW
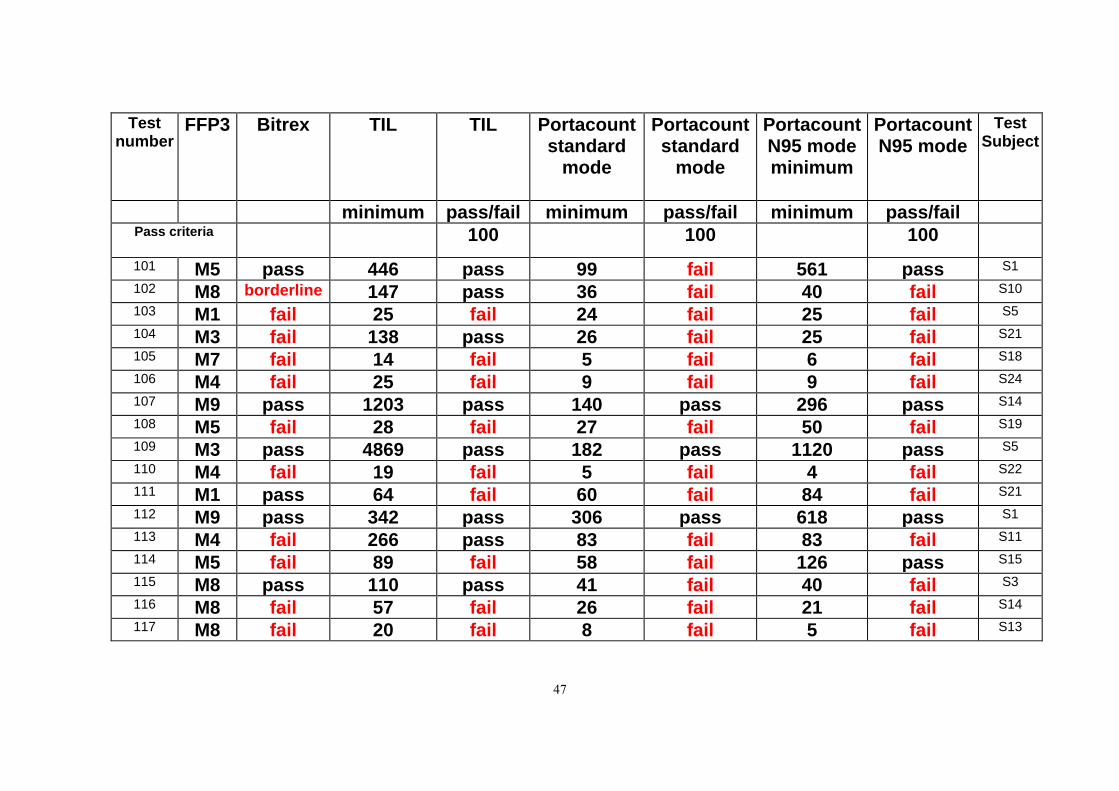
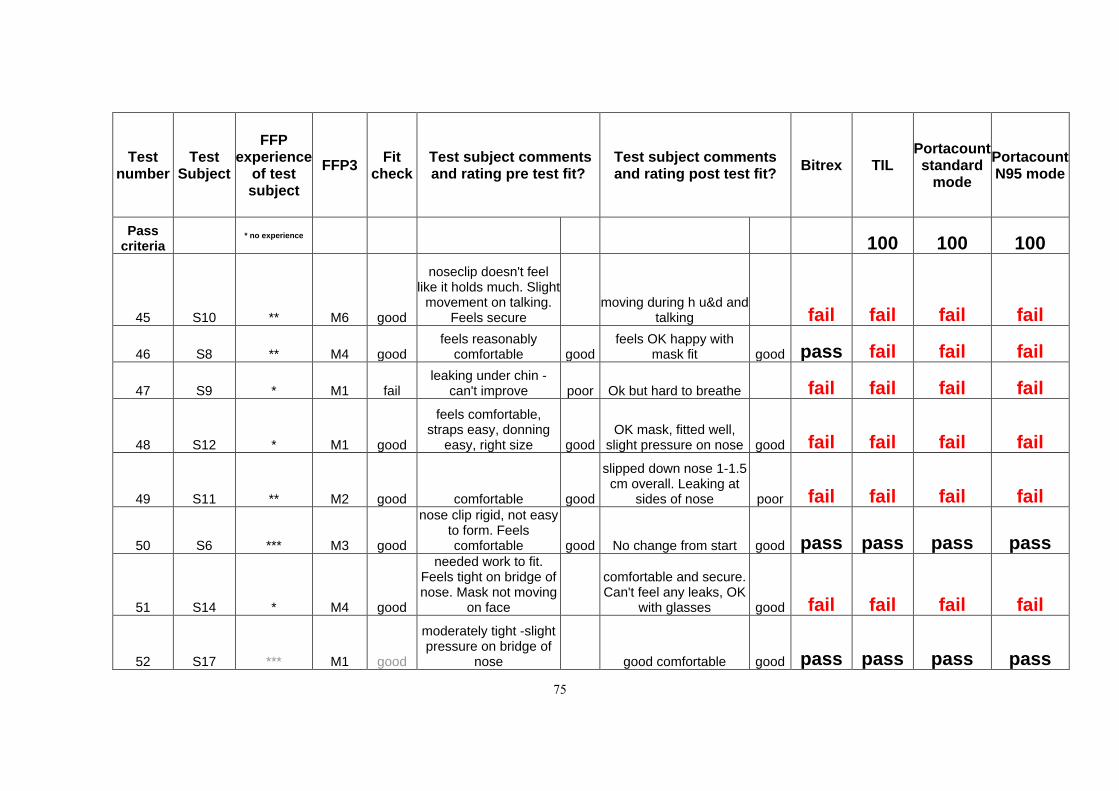
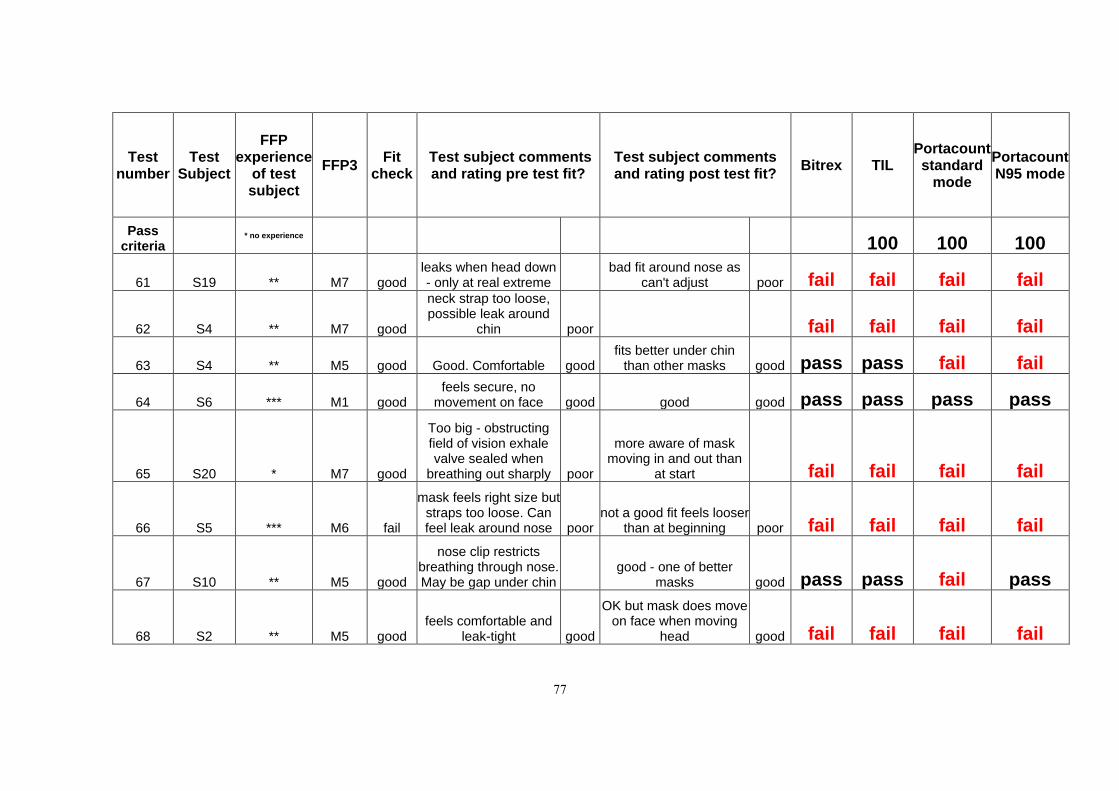
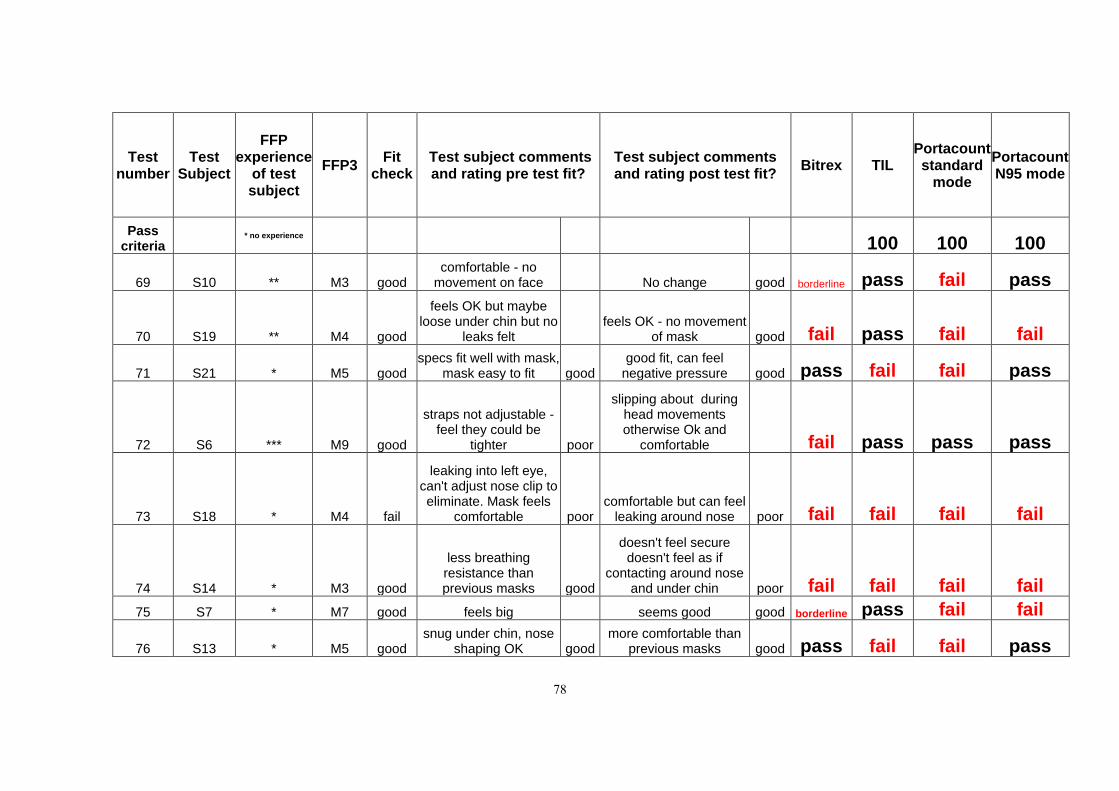
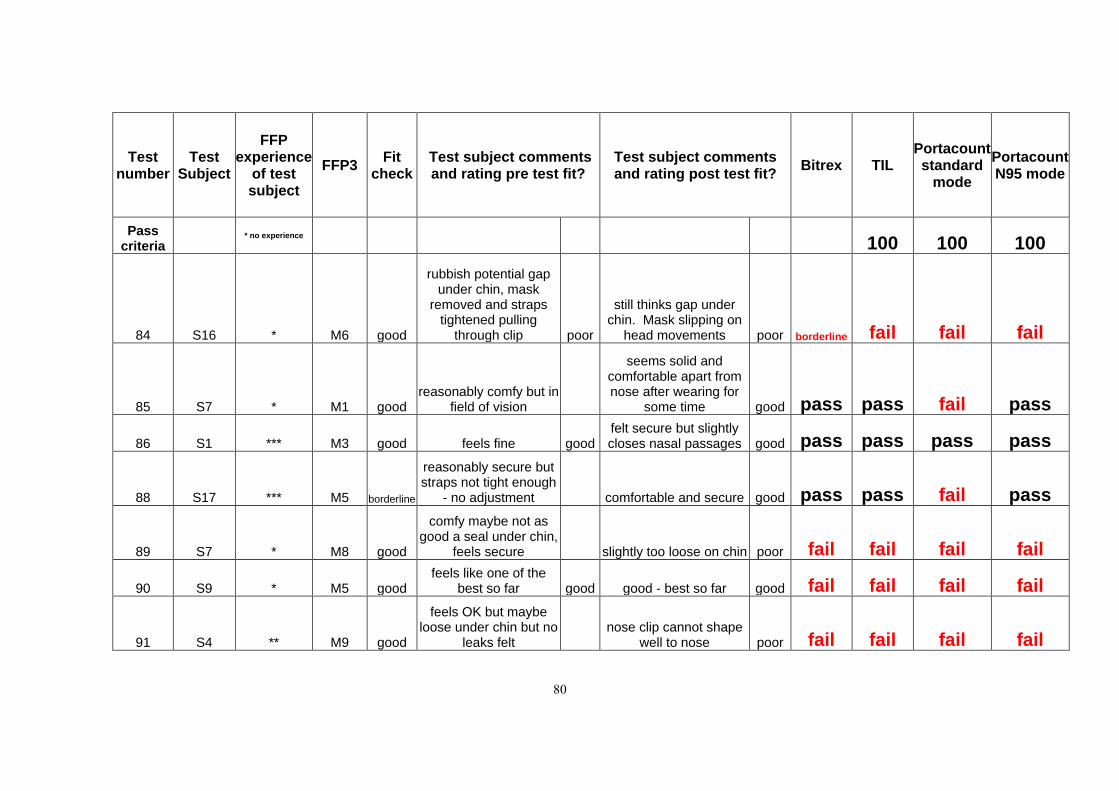
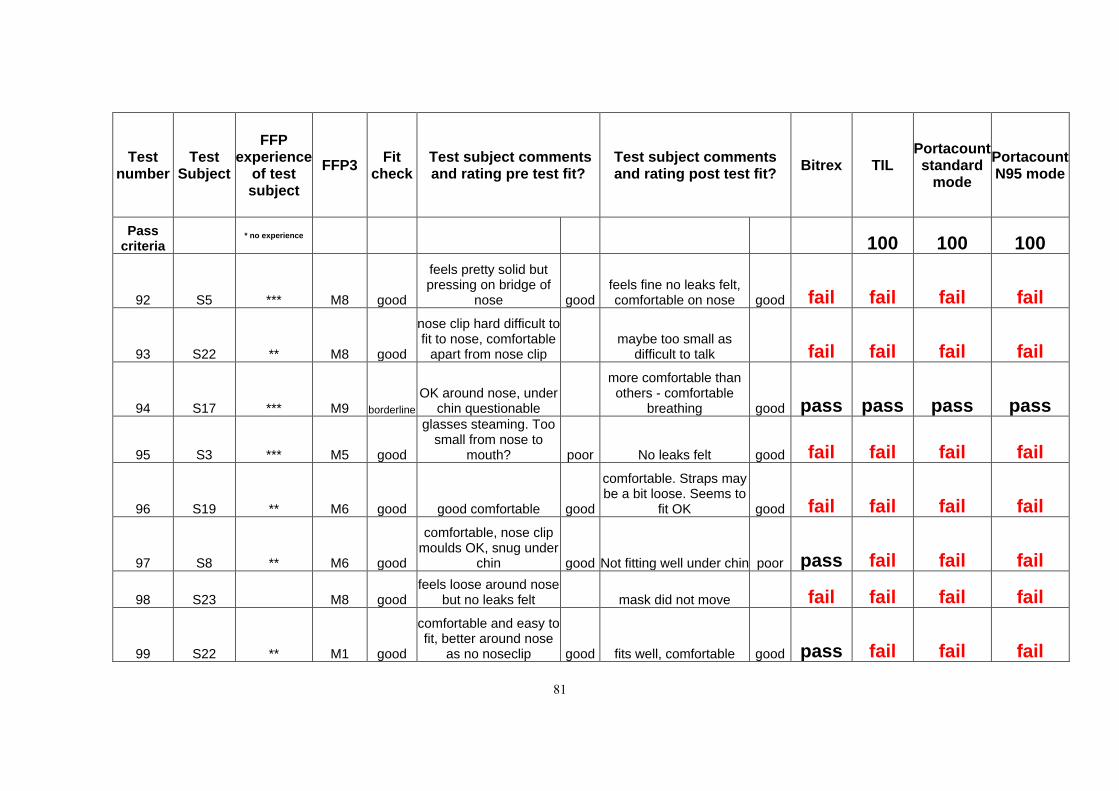
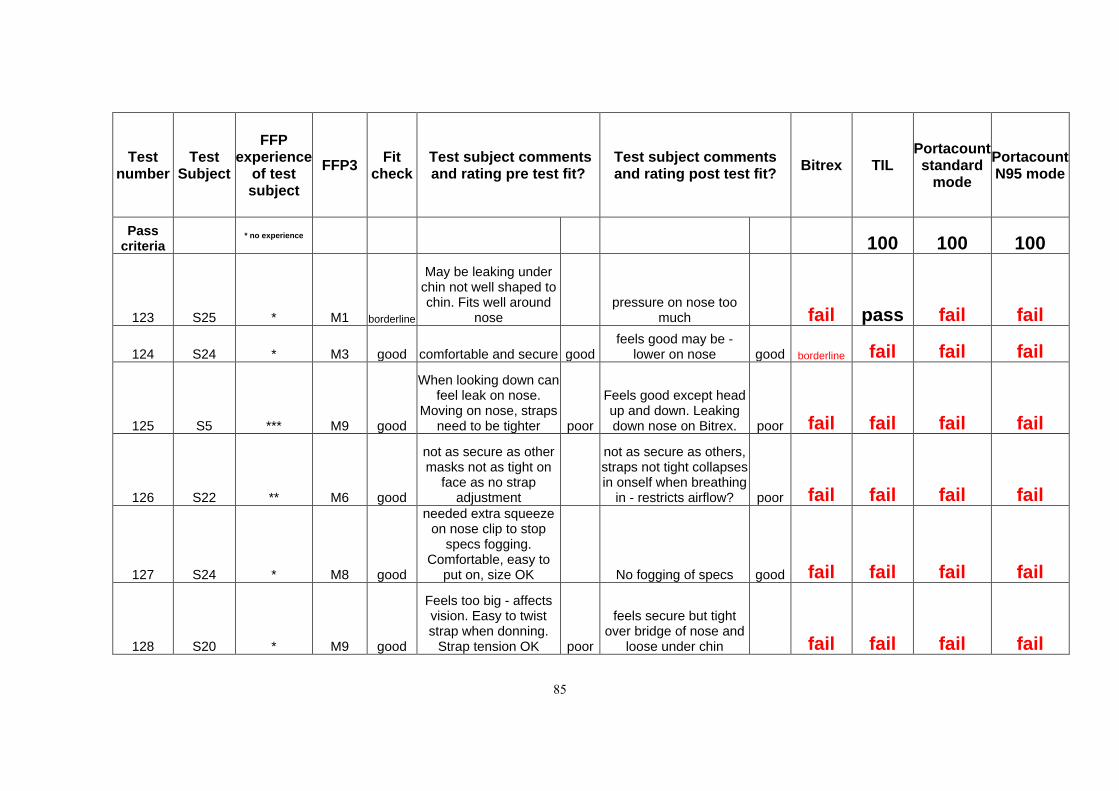
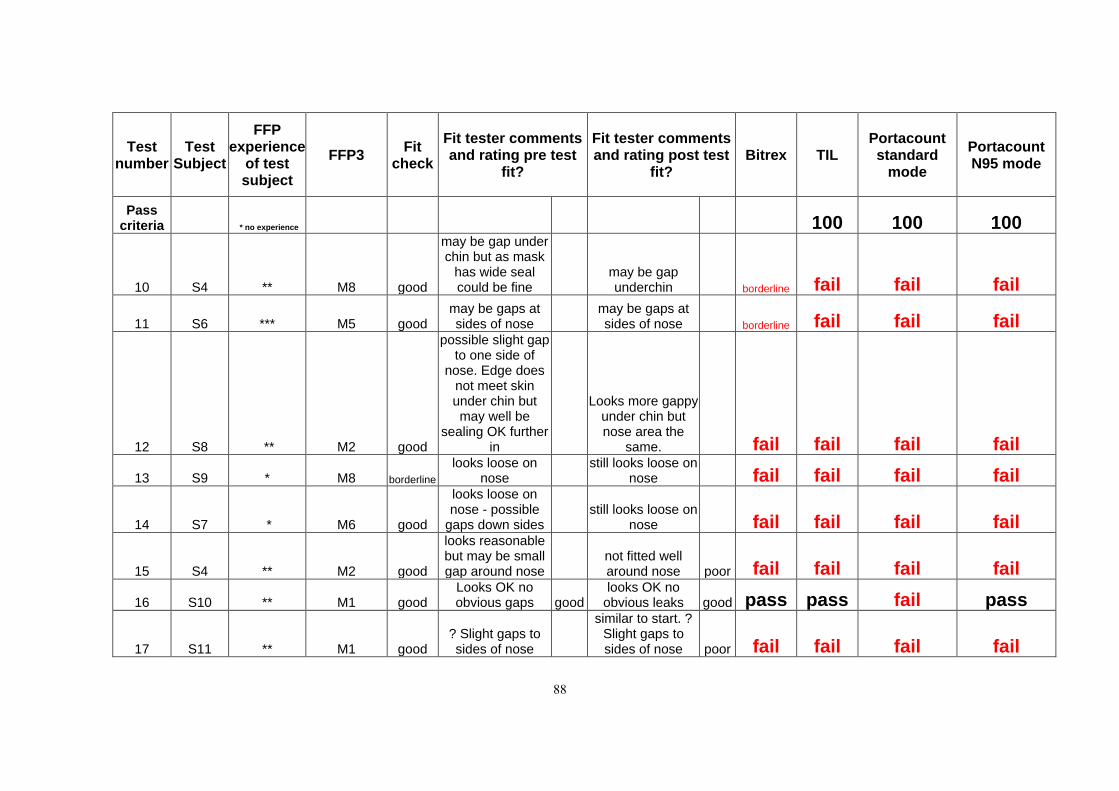
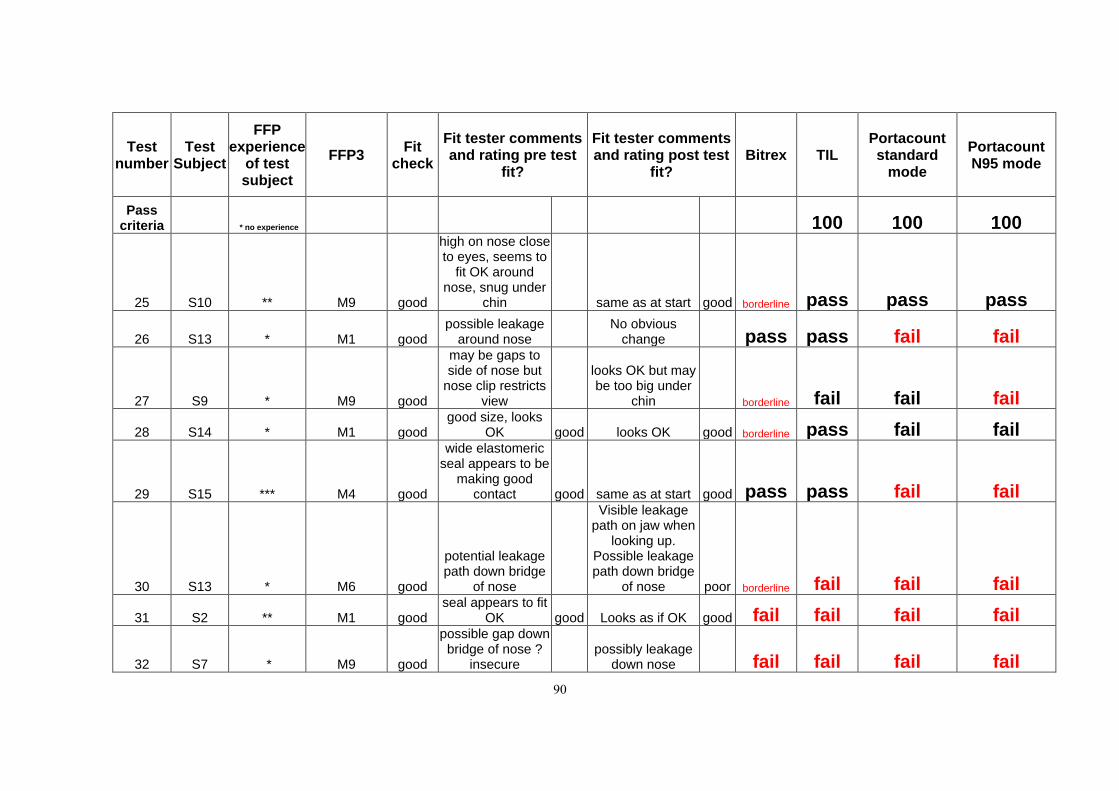
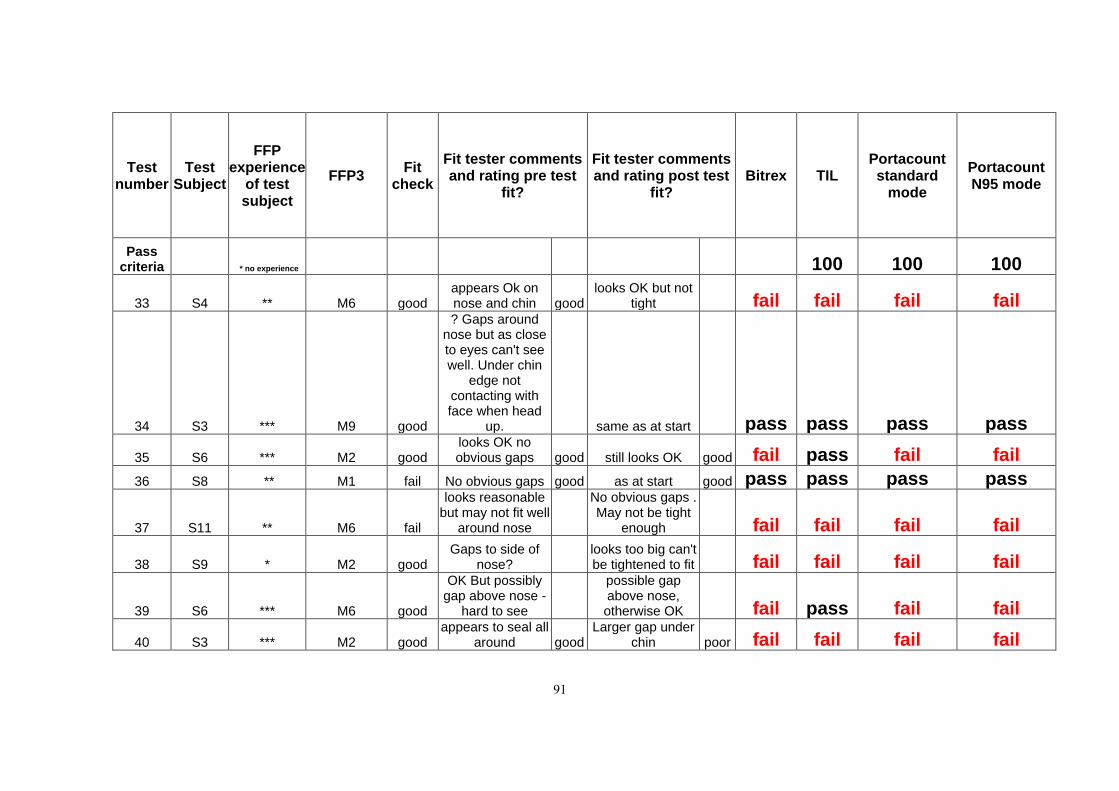
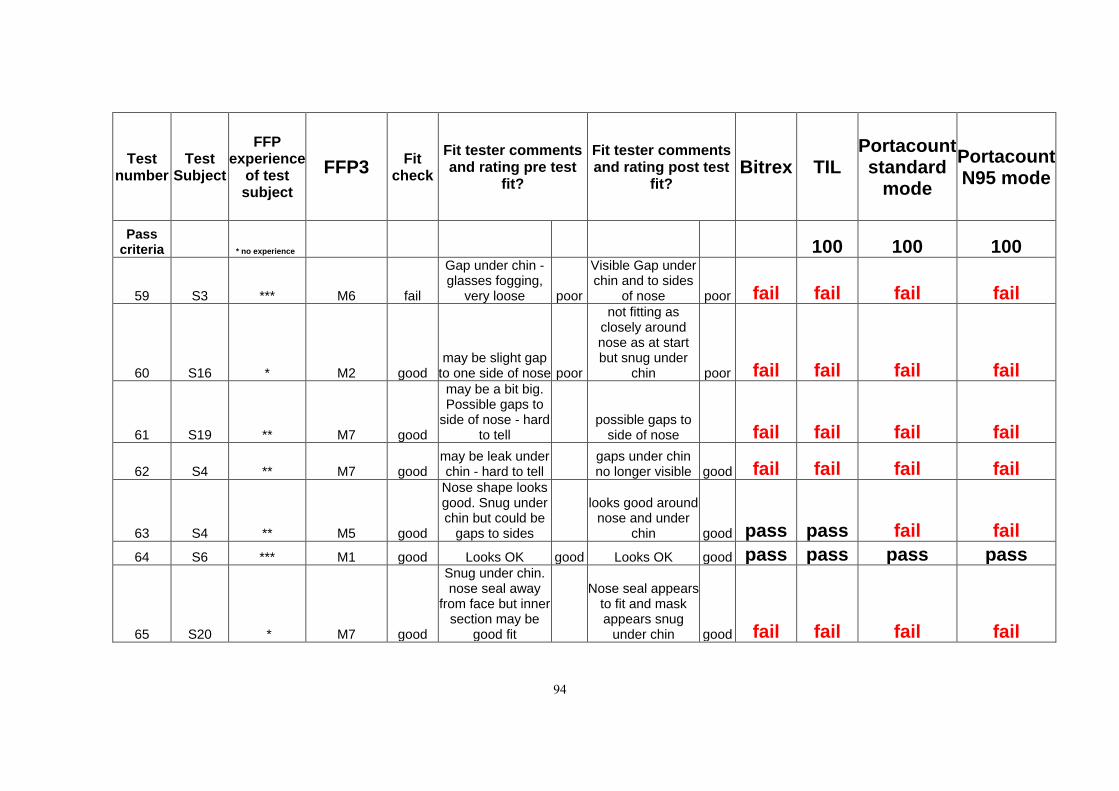
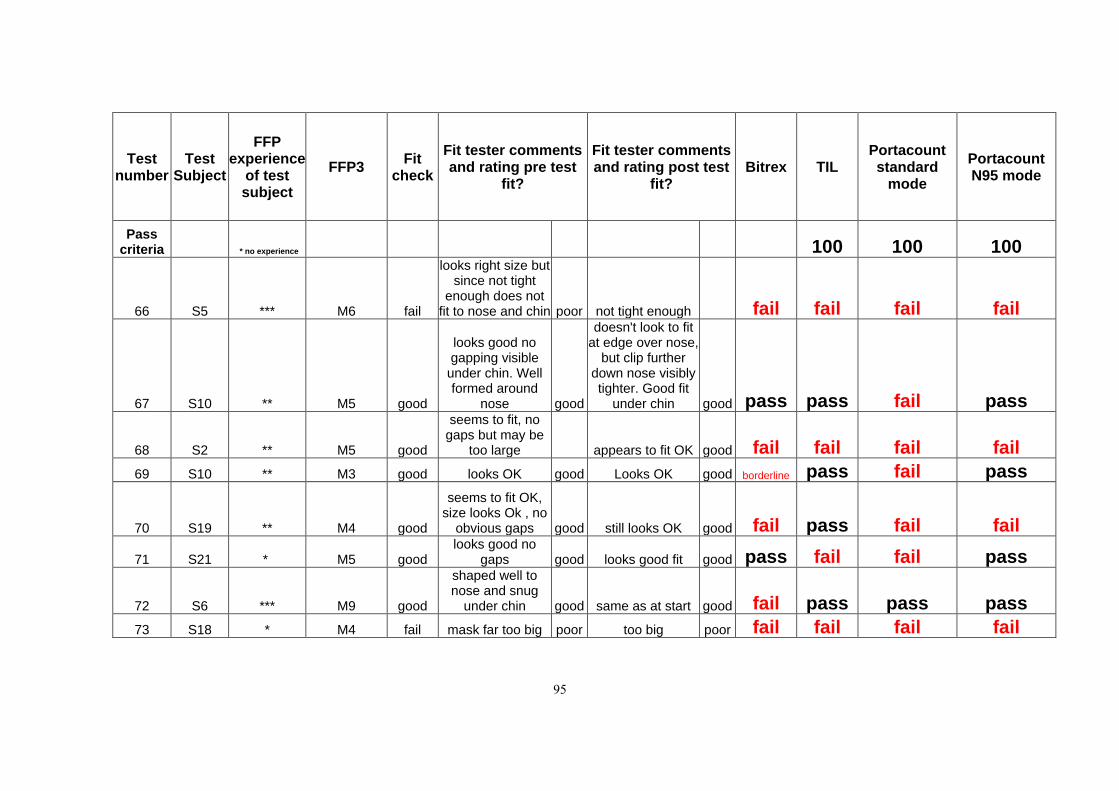
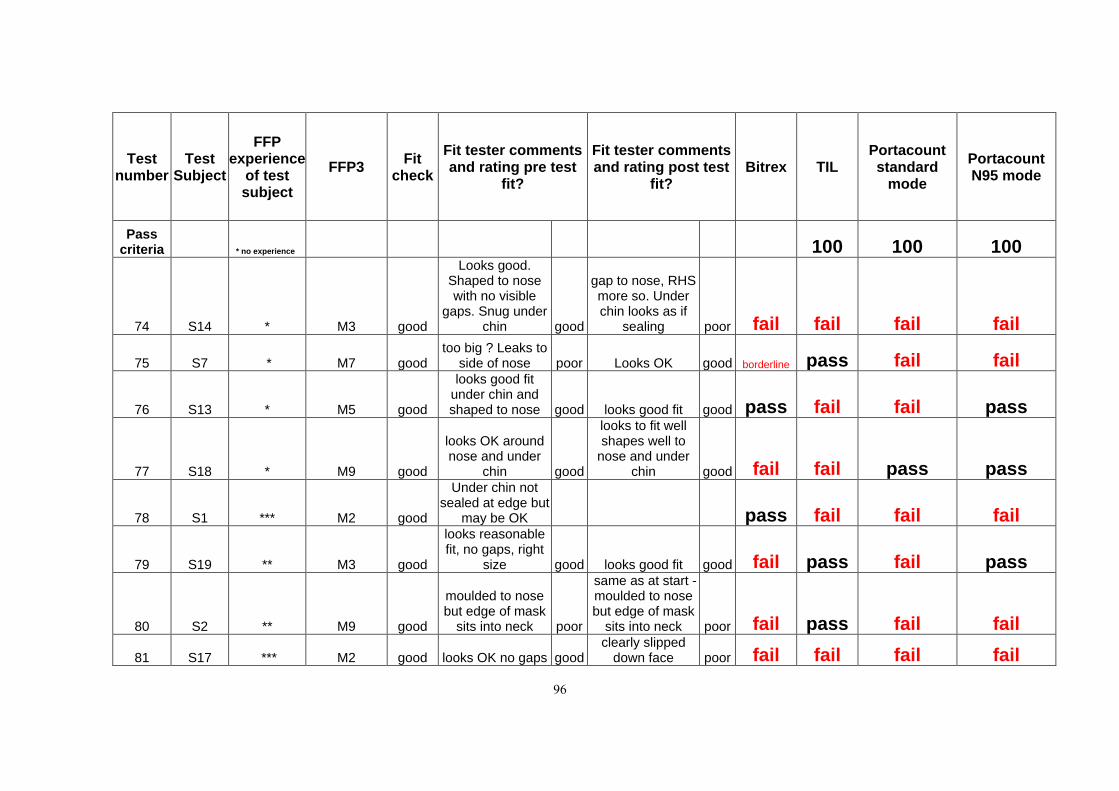
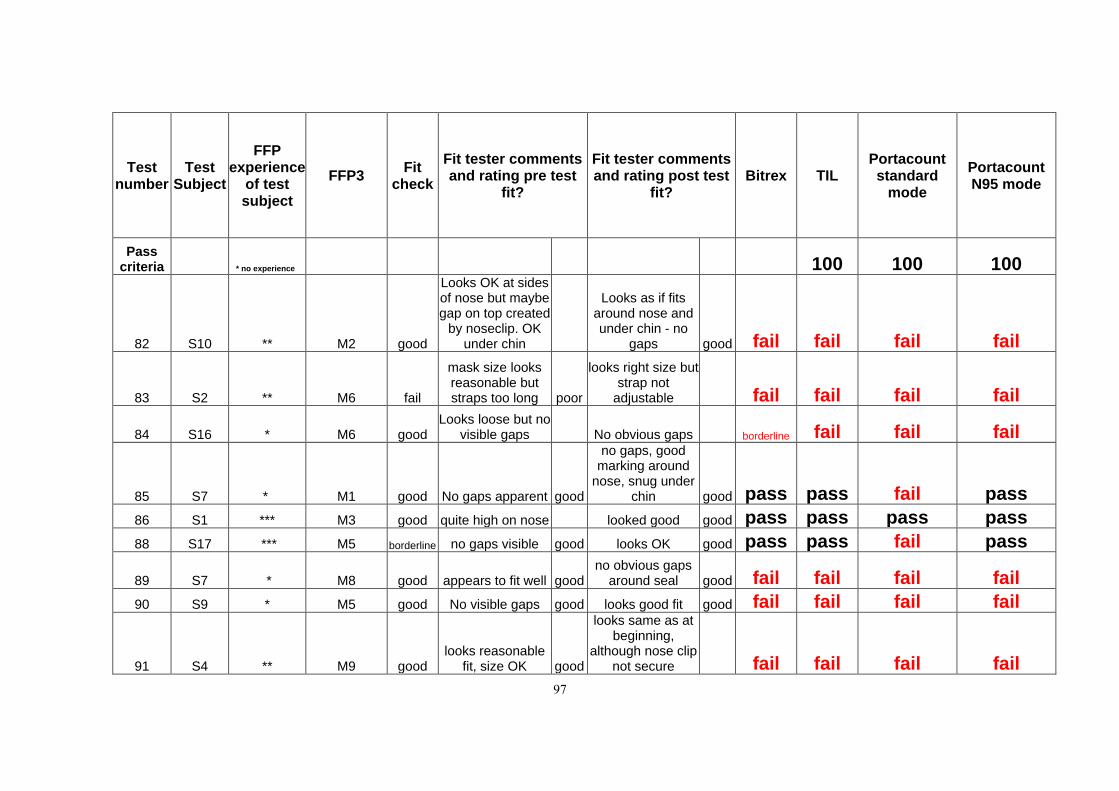
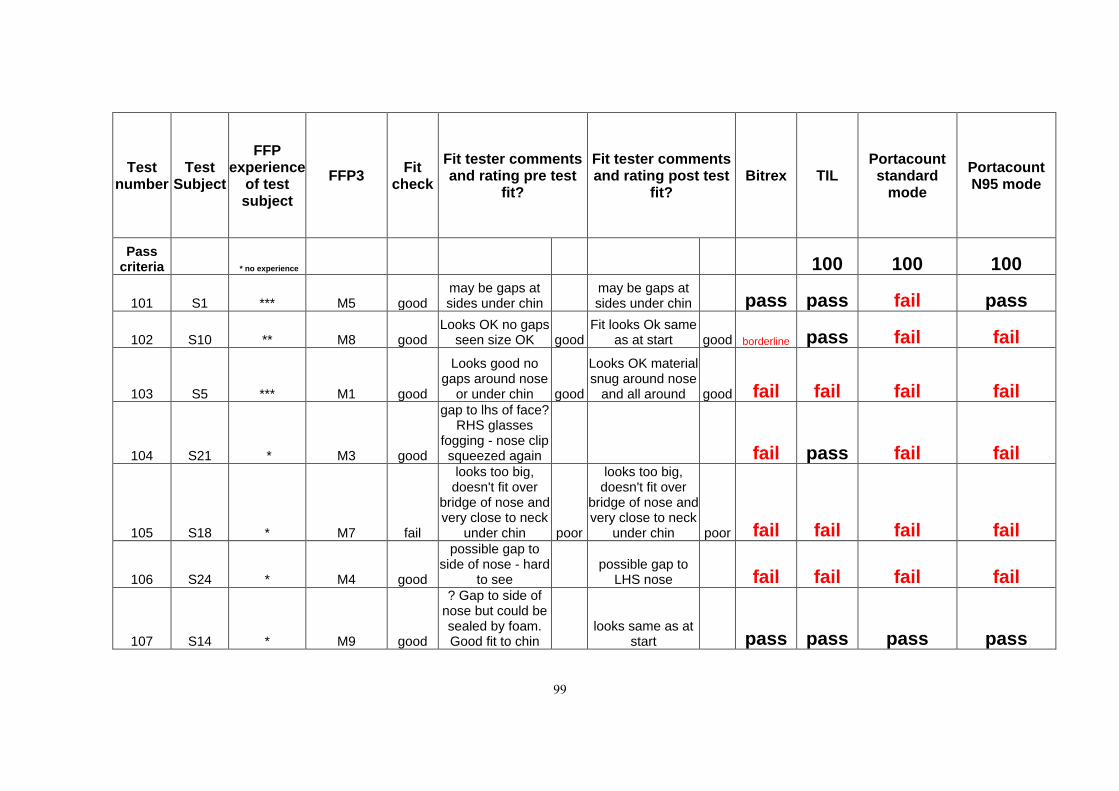
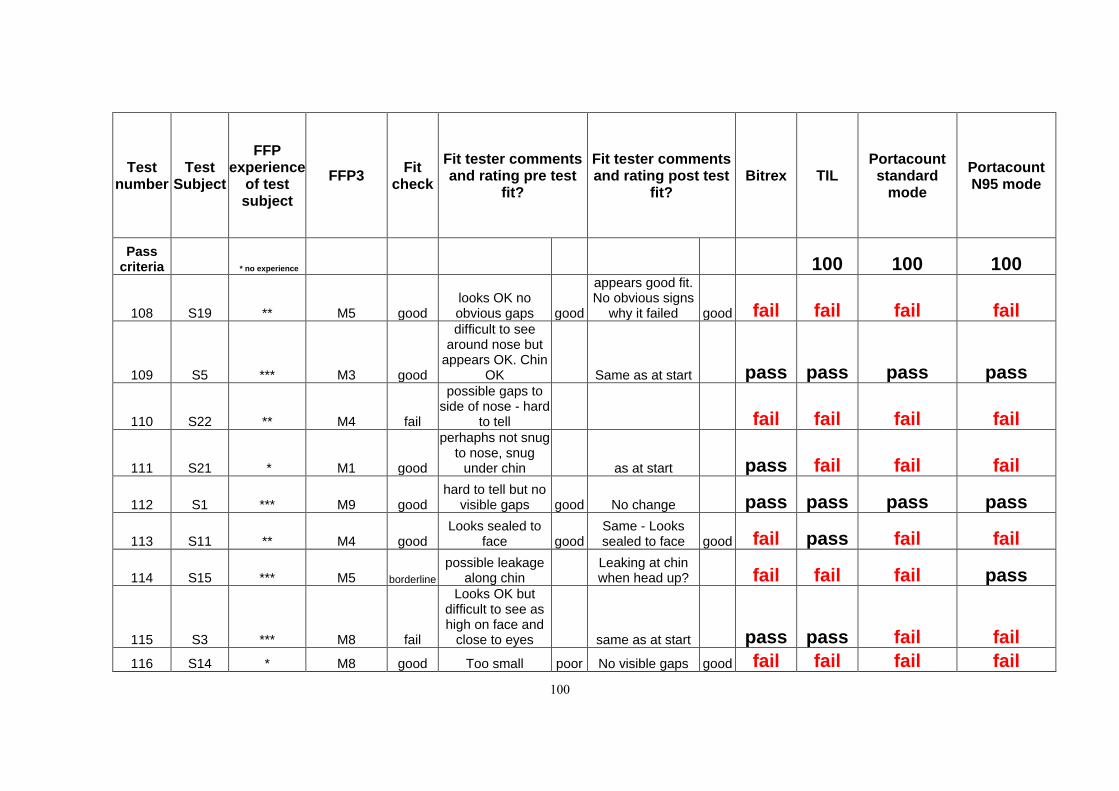
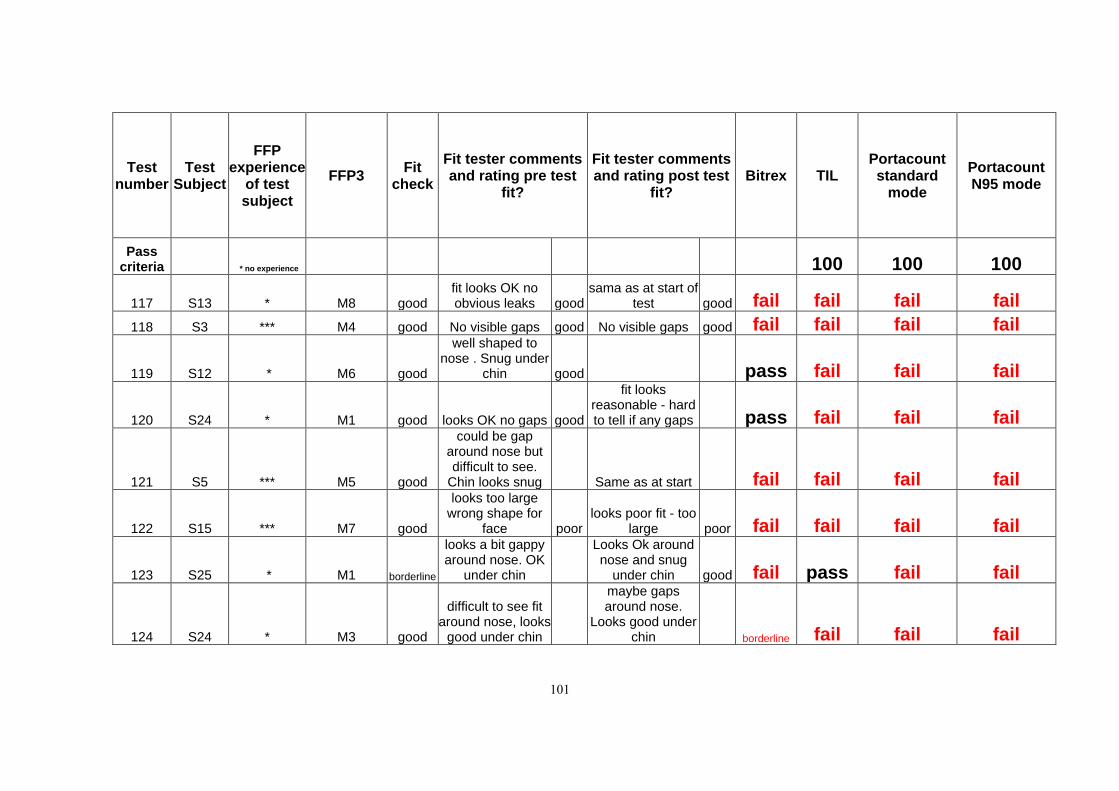
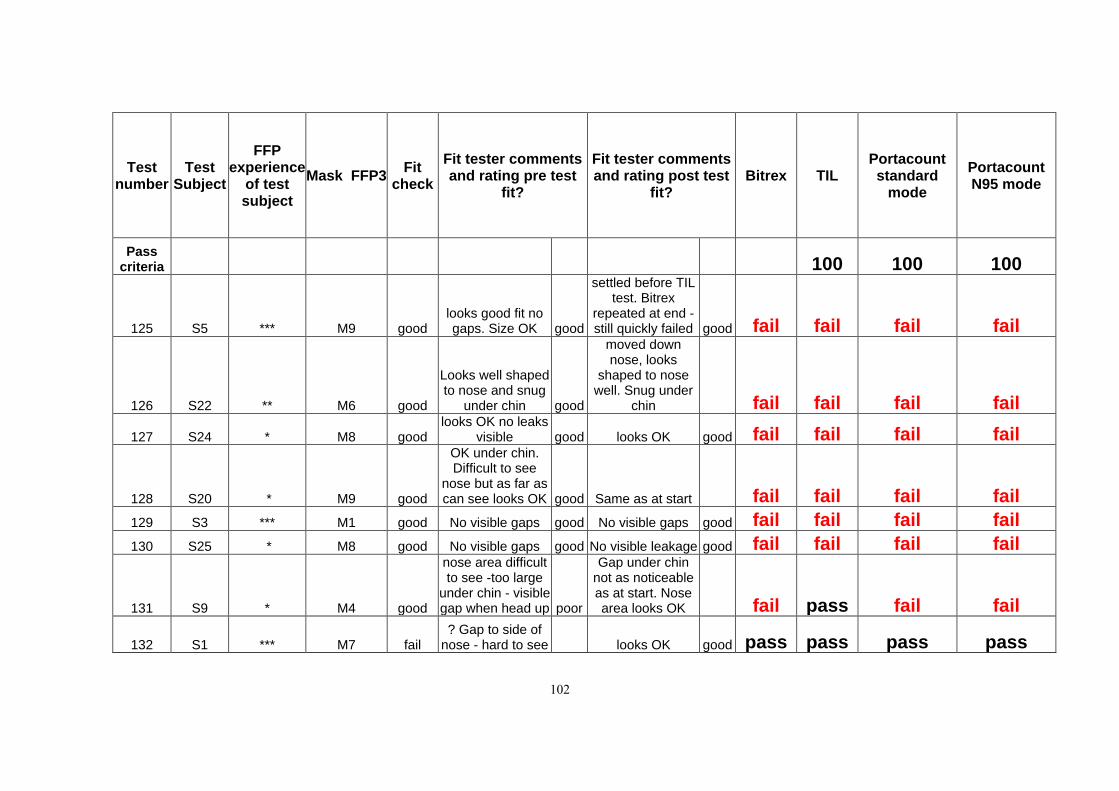
The raw data from the test runs is given in Table 5 (Appendix B). Test runs are numbered up to 132 but only 126 are completely valid. The first 4 test runs were excluded from many of the statistical calculations as there were technical problems with the TIL test equipment. These test runs have been identified in the results table by being presented in grey print. The Bitrex and Portacount parts of these test runs were successful and are therefore included wherever possible in calculations. A further 2 test runs had to be abandoned due to unplanned external events and these are not included in the results. Otherwise all test runs were considered valid.
A further 9 test runs are presented in grey as these were excluded from the ANSI statistical analysis as they were too close to the 100 pass criterion for the TIL method to be included in the calculations, see section 3.3.2.
The fit factor displayed is that of the exercise which resulted in the lowest fit factor on each fit test. HSE guidance requires achieving a minimum fit factor (currently 100) in quantitative fit test methods for each and every exercise within a fit test for the outcome to be considered as a pass. Therefore, it is the lowest fit factor of all the exercises used in the fit test method which is the critical result. In Table 5 the results are categorised as pass/fail, with the pass criterion of 100 applied to all quantitative tests.
The results were analysed with respect to the test order of individual fit tests (there being 6 possible test orders for each test run). “Fit test order” (1st, 2nd or 3rd) was used as a fixed factor in the Analysis of Variance along with “FFP3 model”, and showed no significant effect for the log-transformed data for either TIL or Portacount. For Bitrex, the proportion of passes was calculated for each group (1st, 2nd or 3rd) and used as the dependent variable in the Analysis of Variance along with “FFP3 model”, and again showed no significant effect.
3.1.1 Individual pass/fail results
In total 516 valid fit tests were carried out. The overall pass/fail results are given in Table 2. The criterion applied for a pass is that given in HSE guidance OC282/28, which is at least 100 in each and every exercise for quantitative fit test methods. Although the Portacount-with-N95-Companion is a method which is not currently recommended for FFP3, it is a quantitative method and therefore initially a pass criterion of 100 was applied to these fit tests, in line with other quantitative fit test methods.
Table 2 Overall pass/fail results for the 516 valid fit tests
total valid fit tests pass criterion pass fail borderline
Bitrex 130 N/A 39 (30%) 79 (61%) 12(9%)
TIL 126 100 46 (37%) 80 (63%)
Portacount 130 100 22 (17%) 108 (83%)
Portacount +N95 130 100 33 (25%) 97 (75%)
516
11
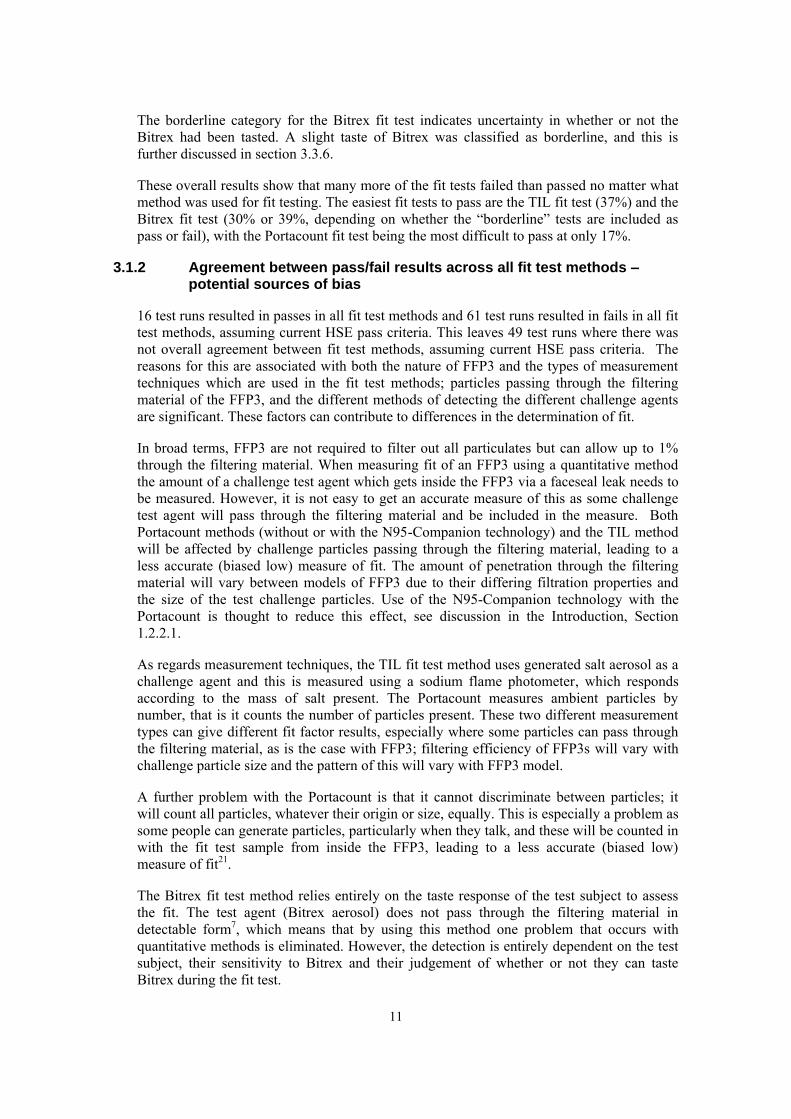
The borderline category for the Bitrex fit test indicates uncertainty in whether or not the Bitrex had been tasted. A slight taste of Bitrex was classified as borderline, and this is further discussed in section 3.3.6.
These overall results show that many more of the fit tests failed than passed no matter what method was used for fit testing. The easiest fit tests to pass are the TIL fit test (37%) and the Bitrex fit test (30% or 39%, depending on whether the “borderline” tests are included as pass or fail), with the Portacount fit test being the most difficult to pass at only 17%.
3.1.2 Agreement between pass/fail results across all fit test methods – potential sources of bias
16 test runs resulted in passes in all fit test methods and 61 test runs resulted in fails in all fit test methods, assuming current HSE pass criteria. This leaves 49 test runs where there was not overall agreement between fit test methods, assuming current HSE pass criteria. The reasons for this are associated with both the nature of FFP3 and the types of measurement techniques which are used in the fit test methods; particles passing through the filtering material of the FFP3, and the different methods of detecting the different challenge agents are significant. These factors can contribute to differences in the determination of fit.
In broad terms, FFP3 are not required to filter out all particulates but can allow up to 1% through the filtering material. When measuring fit of an FFP3 using a quantitative method the amount of a challenge test agent which gets inside the FFP3 via a faceseal leak needs to be measured. However, it is not easy to get an accurate measure of this as some challenge test agent will pass through the filtering material and be included in the measure. Both Portacount methods (without or with the N95-Companion technology) and the TIL method will be affected by challenge particles passing through the filtering material, leading to a less accurate (biased low) measure of fit. The amount of penetration through the filtering material will vary between models of FFP3 due to their differing filtration properties and the size of the test challenge particles. Use of the N95-Companion technology with the Portacount is thought to reduce this effect, see discussion in the Introduction, Section 1.2.2.1.
As regards measurement techniques, the TIL fit test method uses generated salt aerosol as a challenge agent and this is measured using a sodium flame photometer, which responds according to the mass of salt present. The Portacount measures ambient particles by number, that is it counts the number of particles present. These two different measurement types can give different fit factor results, especially where some particles can pass through the filtering material, as is the case with FFP3; filtering efficiency of FFP3s will vary with challenge particle size and the pattern of this will vary with FFP3 model.
A further problem with the Portacount is that it cannot discriminate between particles; it will count all particles, whatever their origin or size, equally. This is especially a problem as some people can generate particles, particularly when they talk, and these will be counted in with the fit test sample from inside the FFP3, leading to a less accurate (biased low) measure of fit21.
The Bitrex fit test method relies entirely on the taste response of the test subject to assess the fit. The test agent (Bitrex aerosol) does not pass through the filtering material in detectable form7, which means that by using this method one problem that occurs with quantitative methods is eliminated. However, the detection is entirely dependent on the test subject, their sensitivity to Bitrex and their judgement of whether or not they can taste Bitrex during the fit test.
12
3.2 ANALYSIS OF DATA DISTRIBUTION
3.2.1 Selection of the reference method
The TIL method was initially selected as the reference method for this study because it is well established, is the type of method required by ANSI as a reference, and tried and tested by other researchers. The overview of the results given in Table 2 shows that the TIL fit test criterion is similar in pass/fail rates to that of the Bitrex fit test, and easier to achieve than the Portacount fit test criterion. This would appear to fit in with the suggestion that the Portacount criterion may be too stringent.
The TIL test pass criterion for a fit test is much more stringent (requiring more than twice the level of protection to be achieved) than the criterion applied when the same test is used during the European Standard EN1491 approval. The European Standard EN149 TIL test is a measure of the performance of the filtering facepiece on 10 different wearers. The requirement for classification as an FFP3 is that the TIL is less than 2% mean for all exercises for 8 out of the 10 wearers and less than 5% for 46 out of the 50 individual test exercise results. Putting this in more simple terms it approximates to a mean fit factor (over all exercises) of 50. This compares with the requirement for a fit test pass, according to HSE guidance, of a minimum fit factor of 100 in every individual test exercise.
3.2.2 Limitations of using the TIL test as a reference method
The TIL method is not ideal for measuring the fit of FFP3 and there is no quantitative fit test method for FFP3 which can eliminate the influence of filter penetration on the fit factor measured. A certain amount of particulate challenge will always pass through the filtering material (with an FFP3 this can be up to a nominal 1%). Therefore, when the TIL fit test method is used it will always result in fit factors which are biased low compared to a true measure of fit. The measured percentage TIL will be biased high since it includes filter penetration:
Measured percentage TIL = percentage faceseal leakage (true measure of fit)
+ percentage filter penetration
Fit factors are the inverse of Total Inward Leakage (TIL) and therefore will be biased low:
Fit factor = 100
percentage TIL
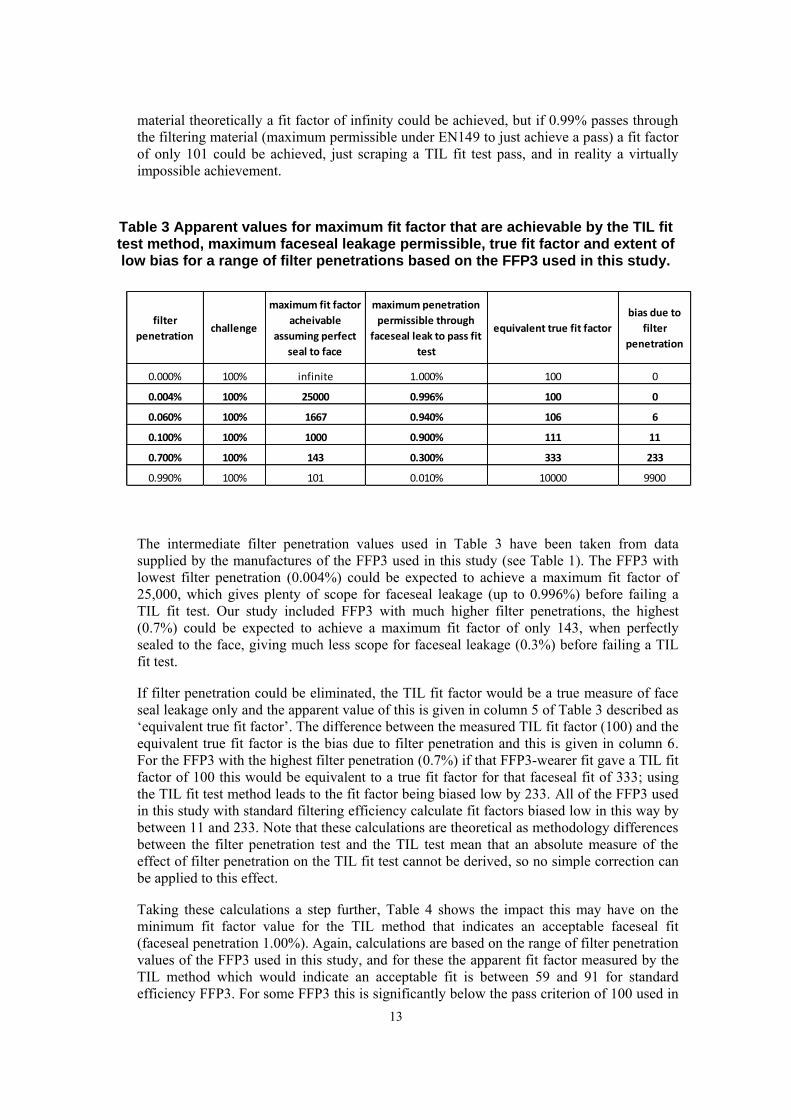
By considering the results from the EN149 filter penetration test we can get an idea of the comparative extent of this effect. Note that methodology differences between the filter penetration test and the TIL test mean that an absolute measure of the effect of filter penetration on the TIL fit test cannot be derived. Table 3 shows how the apparent fit factor of a facepiece which is perfectly sealed to a face would be expected to vary, depending upon the filter penetration. At the extremes, if zero challenge passes through the filtering
13
material theoretically a fit factor of infinity could be achieved, but if 0.99% passes through the filtering material (maximum permissible under EN149 to just achieve a pass) a fit factor of only 101 could be achieved, just scraping a TIL fit test pass, and in reality a virtually impossible achievement.
Table 3 Apparent values for maximum fit factor that are achievable by the TIL fit test method, maximum faceseal leakage permissible, true fit factor and extent of low bias for a range of filter penetrations based on the FFP3 used in this study.
The intermediate filter penetration values used in Table 3 have been taken from data supplied by the manufactures of the FFP3 used in this study (see Table 1). The FFP3 with lowest filter penetration (0.004%) could be expected to achieve a maximum fit factor of 25,000, which gives plenty of scope for faceseal leakage (up to 0.996%) before failing a TIL fit test. Our study included FFP3 with much higher filter penetrations, the highest (0.7%) could be expected to achieve a maximum fit factor of only 143, when perfectly sealed to the face, giving much less scope for faceseal leakage (0.3%) before failing a TIL fit test.
If filter penetration could be eliminated, the TIL fit factor would be a true measure of face seal leakage only and the apparent value of this is given in column 5 of Table 3 described as ‘equivalent true fit factor’. The difference between the measured TIL fit factor (100) and the equivalent true fit factor is the bias due to filter penetration and this is given in column 6. For the FFP3 with the highest filter penetration (0.7%) if that FFP3-wearer fit gave a TIL fit factor of 100 this would be equivalent to a true fit factor for that faceseal fit of 333; using the TIL fit test method leads to the fit factor being biased low by 233. All of the FFP3 used in this study with standard filtering efficiency calculate fit factors biased low in this way by between 11 and 233. Note that these calculations are theoretical as methodology differences between the filter penetration test and the TIL test mean that an absolute measure of the effect of filter penetration on the TIL fit test cannot be derived, so no simple correction can be applied to this effect.
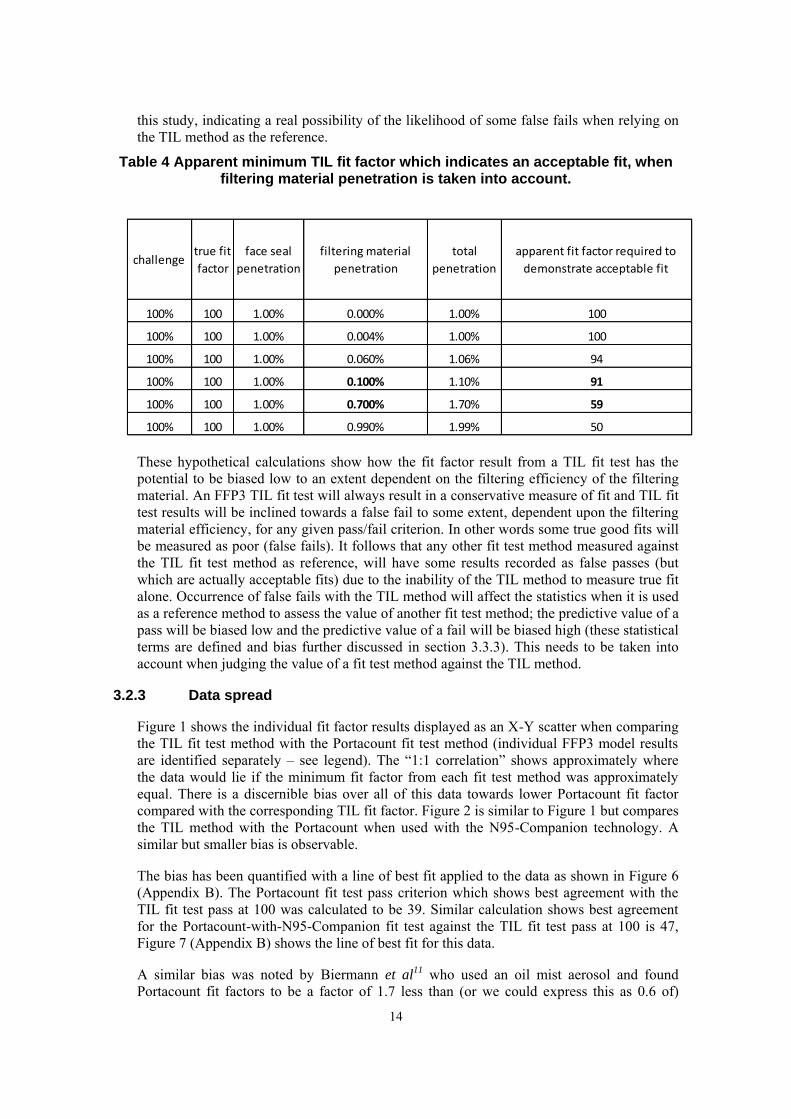
Taking these calculations a step further, Table 4 shows the impact this may have on the minimum fit factor value for the TIL method that indicates an acceptable faceseal fit (faceseal penetration 1.00%). Again, calculations are based on the range of filter penetration values of the FFP3 used in this study, and for these the apparent fit factor measured by the TIL method which would indicate an acceptable fit is between 59 and 91 for standard efficiency FFP3. For some FFP3 this is significantly below the pass criterion of 100 used in
filter
penetrationchallenge
maximum fit factor
acheivable
assuming perfect
seal to face
maximum penetration
permissible through
faceseal leak to pass fit
test
equivalent true fit factor
bias due to
filter
penetration
0.000% 100% infinite 1.000% 100 0
0.004% 100% 25000 0.996% 100 0
0.060% 100% 1667 0.940% 106 6
0.100% 100% 1000 0.900% 111 11
0.700% 100% 143 0.300% 333 233
0.990% 100% 101 0.010% 10000 9900
14
this study, indicating a real possibility of the likelihood of some false fails when relying on the TIL method as the reference.
Table 4 Apparent minimum TIL fit factor which indicates an acceptable fit, when filtering material penetration is taken into account.
These hypothetical calculations show how the fit factor result from a TIL fit test has the potential to be biased low to an extent dependent on the filtering efficiency of the filtering material. An FFP3 TIL fit test will always result in a conservative measure of fit and TIL fit test results will be inclined towards a false fail to some extent, dependent upon the filtering material efficiency, for any given pass/fail criterion. In other words some true good fits will be measured as poor (false fails). It follows that any other fit test method measured against the TIL fit test method as reference, will have some results recorded as false passes (but which are actually acceptable fits) due to the inability of the TIL method to measure true fit alone. Occurrence of false fails with the TIL method will affect the statistics when it is used as a reference method to assess the value of another fit test method; the predictive value of a pass will be biased low and the predictive value of a fail will be biased high (these statistical terms are defined and bias further discussed in section 3.3.3). This needs to be taken into account when judging the value of a fit test method against the TIL method.
3.2.3 Data spread
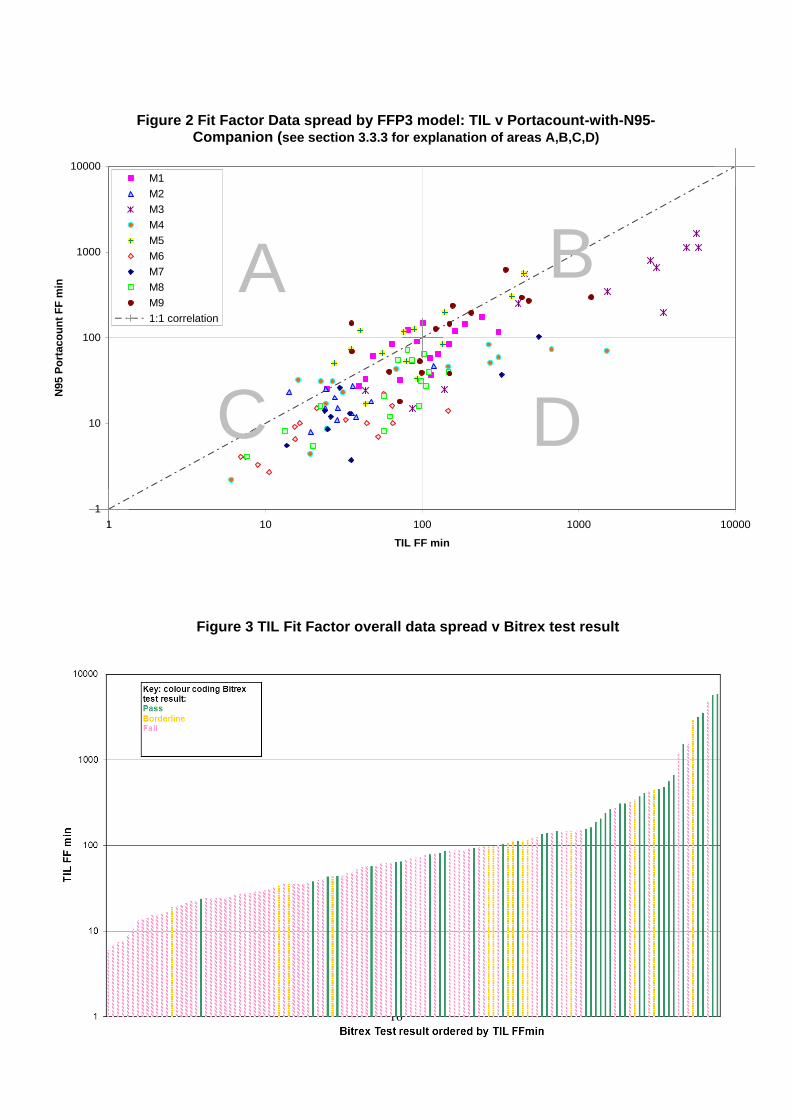
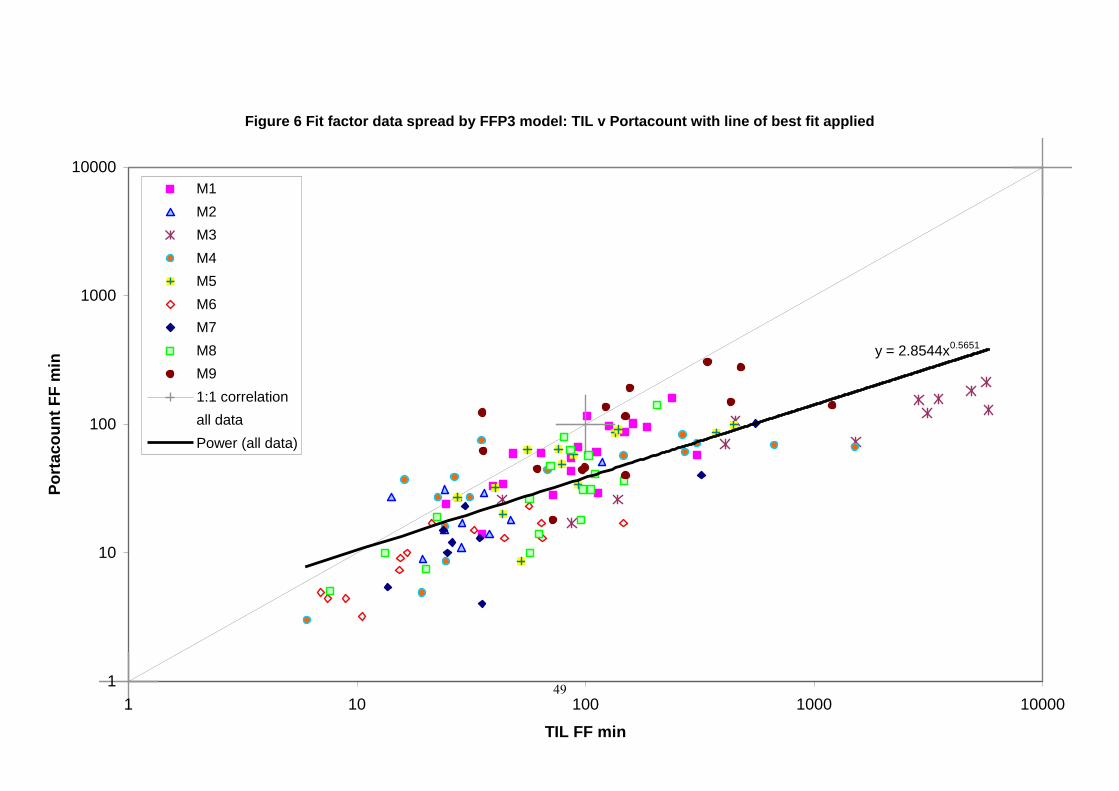
Figure 1 shows the individual fit factor results displayed as an X-Y scatter when comparing the TIL fit test method with the Portacount fit test method (individual FFP3 model results are identified separately – see legend). The “1:1 correlation” shows approximately where the data would lie if the minimum fit factor from each fit test method was approximately equal. There is a discernible bias over all of this data towards lower Portacount fit factor compared with the corresponding TIL fit factor. Figure 2 is similar to Figure 1 but compares the TIL method with the Portacount when used with the N95-Companion technology. A similar but smaller bias is observable.
The bias has been quantified with a line of best fit applied to the data as shown in Figure 6 (Appendix B). The Portacount fit test pass criterion which shows best agreement with the TIL fit test pass at 100 was calculated to be 39. Similar calculation shows best agreement for the Portacount-with-N95-Companion fit test against the TIL fit test pass at 100 is 47, Figure 7 (Appendix B) shows the line of best fit for this data.
A similar bias was noted by Biermann et al11 who used an oil mist aerosol and found Portacount fit factors to be a factor of 1.7 less than (or we could express this as 0.6 of)
challengetrue fit
factor
face seal
penetration
filtering material
penetration
total
penetration
apparent fit factor required to
demonstrate acceptable fit
100% 100 1.00% 0.000% 1.00% 100
100% 100 1.00% 0.004% 1.00% 100
100% 100 1.00% 0.060% 1.06% 94
100% 100 1.00% 0.100% 1.10% 91
100% 100 1.00% 0.700% 1.70% 59
100% 100 1.00% 0.990% 1.99% 50
15
forward scattering light photometer fit factors. Note that this type of photometry is projected area-dependent, whilst the TIL fit test method (which was used in this study) is flame photometry, which is mass-dependent, hence some difference between these two methods of photometry might be expected. However, there is a similar bias with both studies, the Portacount (particle counting method) fit factors being 0.4-0.6 of the photometry fit factors.
The results from the Bitrex method are compared to the TIL fit test method in the bar chart, Figure 3, with Bitrex passes represented by solid green colour, fails by diagonal-dashed pink and borderlines as dashed amber. The tests are ordered by TIL fit test minimum fit factor result. Around the TIL pass criterion of 100 (between 96 and 114) is where there are several borderline Bitrex fit test results, with Bitrex passes mainly above 100, and fails mainly below 100. There are further boxplots given in Figure 8 (Appendix B) which show the spread of the Bitrex fit test results.
Figure 1 Fit Factor Data spread by FFP3 model: TIL v Portacount (see section 3.3.3 for explanation of areas A,B,C,D)
1
10
100
1000
10000
1 10 100 1000 10000
TIL FF min
Po
rta
co
un
t F
F m
in
M1
M2
M3
M4
M5
M6
M7
M8
M9
1:1 correlation
A B
C D
16
Figure 2 Fit Factor Data spread by FFP3 model: TIL v Portacount-with-N95-Companion (see section 3.3.3 for explanation of areas A,B,C,D)
Figure 3 TIL Fit Factor overall data spread v Bitrex test result
1
10
100
1000
10000
1 10 100 1000 10000
TIL FF min
N9
5 P
ort
aco
un
t F
F m
in
M1
M2
M3
M4
M5
M6
M7
M8
M9
1:1 correlation
A B
C D
17
3.3 STATISTICAL ANALYSIS OF DATA USING THE ANSI/AIHA CRITERIA
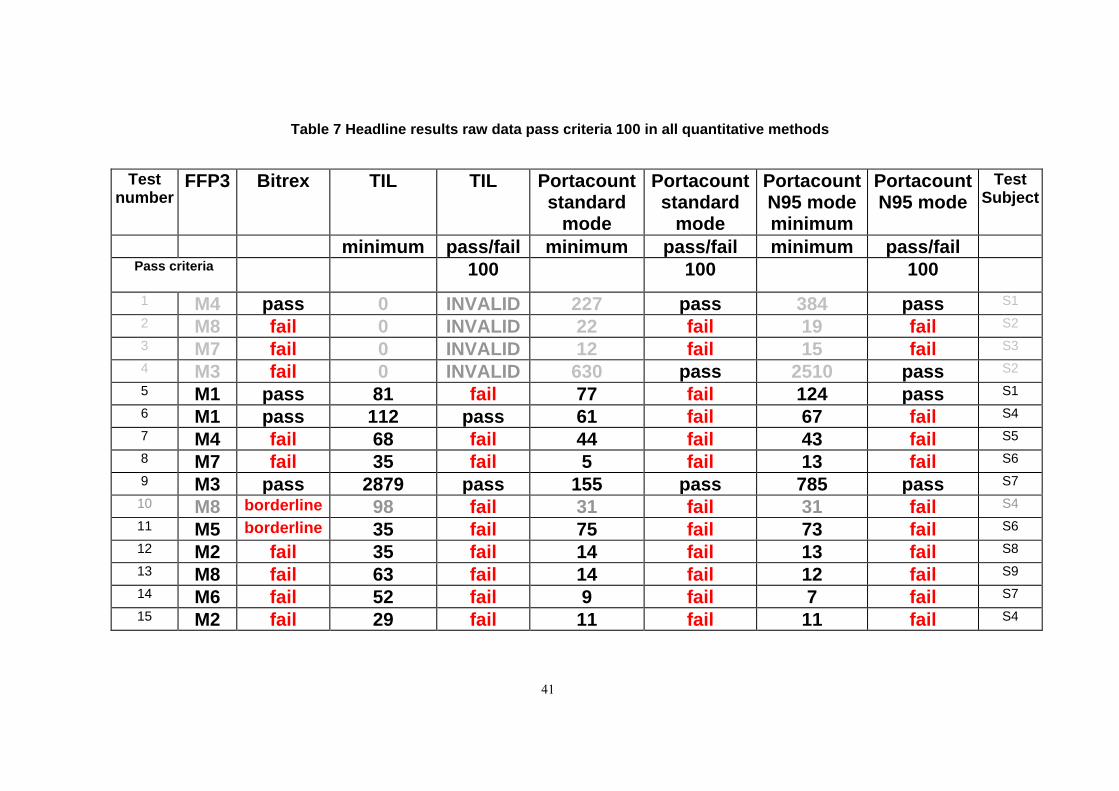
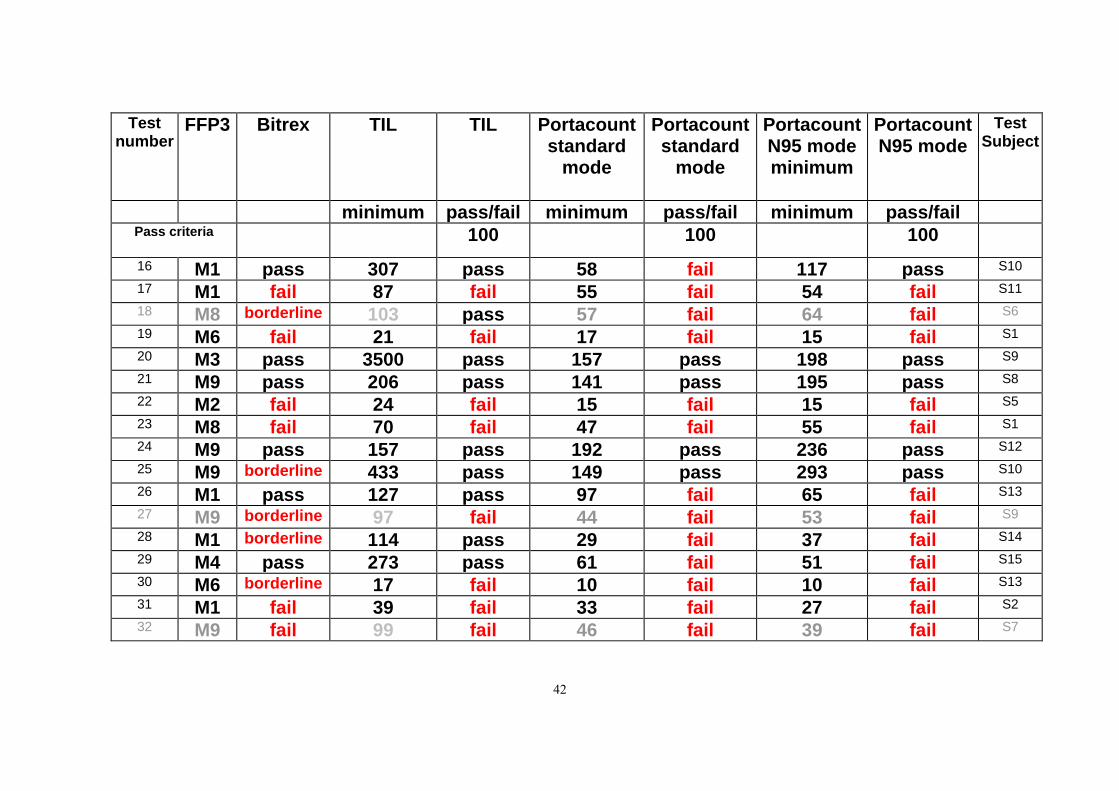
The raw data from all of the tests runs is given in Table 7 of Appendix B. These were analysed in accordance with the requirements of the ANSI standard.
3.3.1 Distribution of fit factors
A histogram of the distribution of TIL fit factors on a logarithmic scale is given in Figure 9 (Appendix B) which visually confirms that the fit factors are evenly distributed and that they bracket the required fit factor for the TIL reference method. This is a requirement of the ANSI standard.
3.3.2 Coefficient of Variation
Nine test runs were excluded from the statistical analysis of the data, these being too close to the pass criterion of 100 on the TIL fit test method. That is, any test run where the TIL fit test result was within the range 100+/- 7.9, (7.9 being the coefficient of variation). These tests are marked on the histogram Figure 9 by the dashed lines. Table 8 in Appendix B shows the results of the covariance test run and the calculation followed to determine the coefficient of variation and hence which tests needed to be excluded, as required by the ANSI standard.
3.3.3 Initial treatment of data and statistical measures determined
The initial analysis included all remaining data from the test runs regardless of the filtering efficiency of the FFP3.
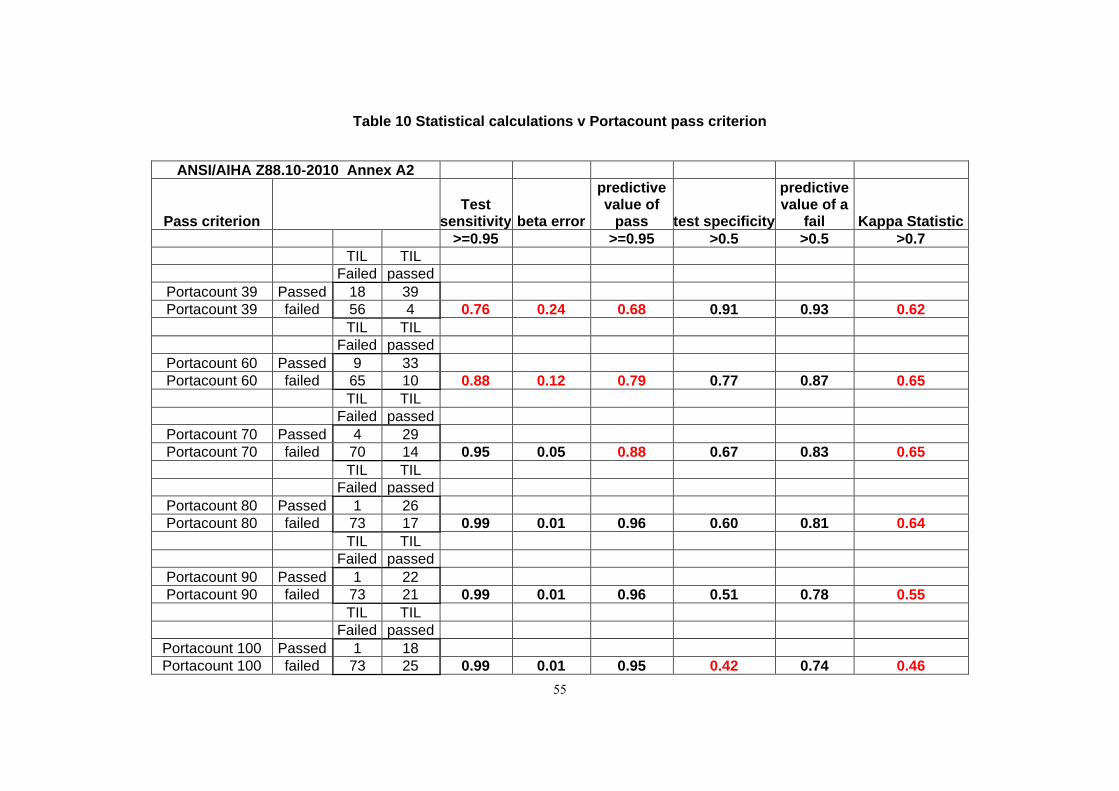
Table 9 (Appendix B) shows the analysis steps including the formulae used for determining the statistical values from the data and the expected levels to conform with the ANSI standard. Note that in all analysis tables a statistical value which does not meet the ANSI criteria is presented in red font to distinguish it from those which do (black font).
The initial step was to determine values of A, B, C and D as defined in the contingency table below (Table 5), for each of the fit test methods using the pass criterion currently applicable according to HSE guidance, against the TIL fit test method with pass criterion of 100 as the reference method. These values are also illustrated in Figures 1 and 2. The rectangular regions labelled A, B, C, D represent the areas in which all of the points fall into that category, therefore rectangle A contains all of the points which fail the reference fit test method and pass the comparison fit test method, for rectangle B, all points passed both fit test methods and so on. Note that figures 1 and 2 do include all data, although some points were not counted in the statistical analysis due to being too close to the pass criterion of 100 for the TIL fit test method (see section 3.3.2). The values of A, B, C and D were then used to determine the statistical values discussed below and given in Table 9 in Appendix B for each fit test method against the TIL fit test method.
Table 5 2 x 2 contingency table of results
Results Reference
method Reference
method
Failed Passed
Passed Method 1 A B
Failed Method 1 C D
18
The ANSI standard has a requirement for at least 50 fit test runs to fail the reference method to ensure confidence in the statistics concerning poor fit. This was easily achieved with 74 of our valid test runs failing the TIL reference fit test method.
In the ANSI standard there is much less importance given to the correct detection of good fits and no requirement on the number of reference method fit test passes to be achieved. However, 43 of the TIL fit tests resulted in a pass, and whilst this is less than the number of fails it is still a good proportion of the total number of tests. Having a lower number of TIL passes than fails does reduce the confidence which can be placed in the calculations which depend on passes, compared to the confidence which can be placed in the calculations dependent on the number of fails. However, 43 passes is a substantial number and therefore should give a good assessment of the comparability of the fit tests methods used.
The statistical terms are defined here and some of the values calculated are given but details will be discussed later.
Note that increased false passes with the TIL method (discussed in section 3.2.2) will affect the statistics when it is used as a reference method to assess the value of another fit test method. Some results which are placed in box A, perhaps should really be in box B as they are really good fits. Likewise, some results which are in box C perhaps should really be in box D. This needs to be taken into account when judging the value of a fit test method against the TIL method.
3.3.3.1 Test sensitivity = C/(A+C)
This is the probability that the test method will correctly identify a poor fit and must be greater than or equal to 0.95. It follows that beta error (probability of a false pass) should be less than or equal to 0.05. (Beta error = 1- test sensitivity).
Initial calculations using existing HSE pass criteria show that only the Portacount fit test method has achieved this level at 0.99 (when measured against the TIL test method). However, both the Portacount-with-N95-Companion technology fit test method and the Bitrex fit test method returned high values at 0.93 and 0.86 (with borderline test results being treated as fails) respectively.
The influence of low bias of TIL results on test sensitivity is complex as A and/or C could be biased high, but given the relative values of A and C in our data the calculated values of test sensitivity are most likely to be biased low.
3.3.3.2 Predictive value of a pass =B/(A+B)
This is the probability that if the fit test result is a pass, then the fit is acceptable and ANSI suggests it should be 0.95 or greater.
Initial calculations using existing HSE pass criteria show that only the Portacount fit test method achieved this level of probability (when measured against the TIL test method). For the other fit test methods values were high but the probability of a false pass was higher than ANSI recommend. However, since TIL results will be biased low (see section 3.2.2), some may be allocated to box A (fails in Table 5 above) when they should really be in box B (passes), which in turn will result in the calculated value for predictive value of a pass being biased low (since A+B is constant the value calculated is directly proportional to B only). The calculations for predictive value of pass given in tables 9 through to 16 assume all of the TIL test fails are true fails and hence are all conservative values.
19
3.3.3.3 Test specificity =B/(B+D)
This is the probability that the fit test method will correctly identify a good fit, and ANSI suggests it should be 0.5 or greater.
In initial calculations using existing HSE pass criteria this was achieved by all fit test methods except for the Portacount fit test method (when measured against the TIL test method).
With the Portacount fit test method the chance of a good fit leading to a pass is only 0.42. The influence of low bias of TIL results on test specificity is complex as B and/or D could be biased low, but with the data from this study Portacount B could only increase by one, whereas there is more scope to increase D further. As a consequence the calculated value of test specificity is more likely to be biased high, indicating that the Portacount test method may be even further below the ANSI suggested value, if the true fit could be measured.
3.3.3.4 Predictive value of a fail =C/(C+D)
This is the probability that if the fit test method result is a fail then the fit is actually poor, and ANSI suggests it should be 0.5 or greater.
Initial calculations using existing HSE pass criteria show that this was easily achieved for all fit test methods (when measured against the TIL test method), being 0.74 or greater. However, since TIL results will be biased low (section 3.2.2), some may be allocated to box C (fails in Table 5 above) when they perhaps should really be in box D (passes), which in turn will result in the calculated value for predictive value of a fail being biased high. The calculations for predictive value of fail given in tables 9 through to 16 assume all of the TIL test fails are true fails and hence are all optimistically high values.
3.3.3.5 Kappa Statistic
This is an overall measure of the degree of agreement with the reference fit test method. A value greater than + 0.7 is recommended.
Initial calculations using existing HSE pass criteria returned values below 0.7 with all fit test methods (when measured against the TIL test method with pass criterion 100).
3.3.3.6 Summary
Overall, no fit test method achieved all of the required, suggested and recommended values in all statistical calculations (when measured against the TIL test method with pass criterion 100). The ANSI criteria are very strong on the test sensitivity (a fail-safe approach in terms of placing greater emphasis on correct detection of poor fit) requiring at least 0.95, which was only achieved with the Portacount fit test method.
As explained in Section 3.2.2 the predictive value of a pass may be biased low, due to the inability of the TIL method to accurately assess fit, which may explain why Bitrex and Portacount-with-N95-Companion technology values are lower than the ANSI suggested value of 0.95.
The lower emphasis on the importance of detecting a good fit is reflected in the suggested minimum for the test specificity being given as 0.50 (much lower than the requirement for detecting a poor fit, at 0.95). Given this, it is surprising that this suggested 0.50 for the test
20
specificity was not achieved with the Portacount fit test method. However it was achieved by both the Bitrex and Portacount-with-N95-Companion technology fit test methods.
The calculated predictive value of a fail may be biased high which could explain why calculated values are well above the ANSI suggested value of at least 0.50, for all test methods.
In the discussions which follow, the greatest emphasis is placed on maximising the test sensitivity, whilst also recognising the value of sensible levels across all statistics, in the light of the ANSI criteria and the influence of low bias of TIL reference fit factors on the calculated values.
3.3.4 Portacount fit test results
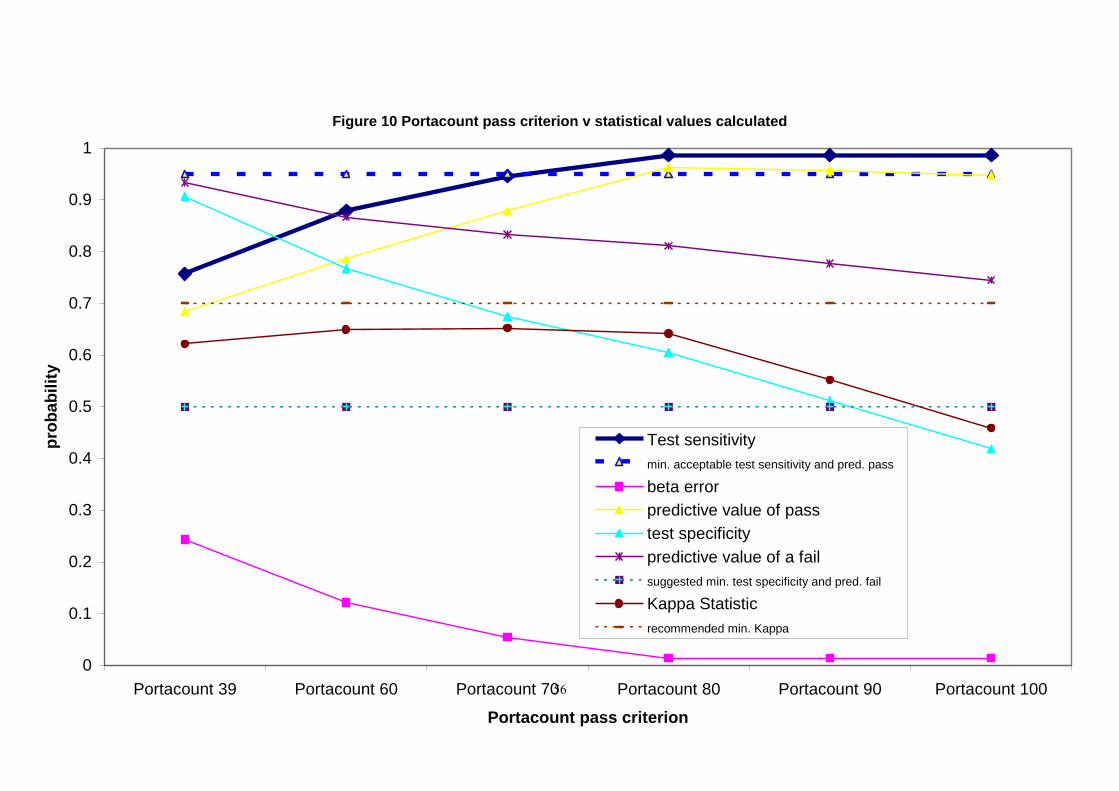
3.3.4.1 Effect of modifying the Portacount pass criterion on statistical values
Figure 1 shows that the Portacount fit factors are biased low compared to the TIL fit factors. The results from the initial statistical treatment of the data given in Table 9 (Appendix B) also show this tendency. Whilst there is very good test sensitivity, with a probability of 0.99 that the Portacount fit test will correctly identify a poor fit, there is poor test specificity with a probability of only 0.42 that test subjects with acceptable fits will pass the Portacount fit test.
A lower pass criterion for the Portacount fit test can improve the overall statistics without unduly compromising the ability of the Portacount fit test to detect a poor fit, when assessed according to the ANSI criteria. Table 10 (Appendix B) shows the calculated values and Figure 10 shows the effect on the statistical values of applying lower pass criteria to the Portacount fit test results, when the criterion is reduced to 90, 80, 70, 60 and 39 respectively (39 was included as it is the calculated value from the ‘line of best fit’ for the data). The test sensitivity remains good and at least to the required level of 0.95 if the pass level is reduced as far as 70, and this also has the effect of improving the test specificity (to 0.67) and the agreement between fit test methods, the Kappa statistic (to 0.65). The predictive value of a pass would be reduced to from 0.95 to 0.88, taking it below the level suggested by the ANSI standard (0.95), but it still remains well above the level achieved in the Bitrex fit test method (at 0.73), and also the Portacount-with-N95-Companion technology fit test method (at 0.83). Note that these values are all conservative. As explained in Section 3.3.3.2 the predictive value of a pass for all these three fit test methods may be lower than the true value due to the inability of the TIL method to accurately assess fit, giving fit factor results which are biased low. As an example, looking at Table 4 given in section 3.2.2, if we assume that we can justify the calculated correlation between filtering efficiency and the minimum fit factor required, then test run number 5 of Table 7 (Appendix B) becomes a pass on the TIL method, which increases the predictive value of a pass on the Portacount method from 0.88 to 0.91.
The effect of reducing the Portacount fit test method pass criterion to 70 gives a better set of statistics (across every statistical value calculated) than is achieved by either the Bitrex method or the Portacount –with- N95-Companion technology, in this study against the TIL fit test method, when assessed according to the ANSI criteria.
Note that reducing the pass criterion to 39 (best agreement from the ‘line of best fit’ discussed in section 3.2.3) would mean that the test sensitivity (probability of correctly detecting a poor fit) would be only 0.76.
21
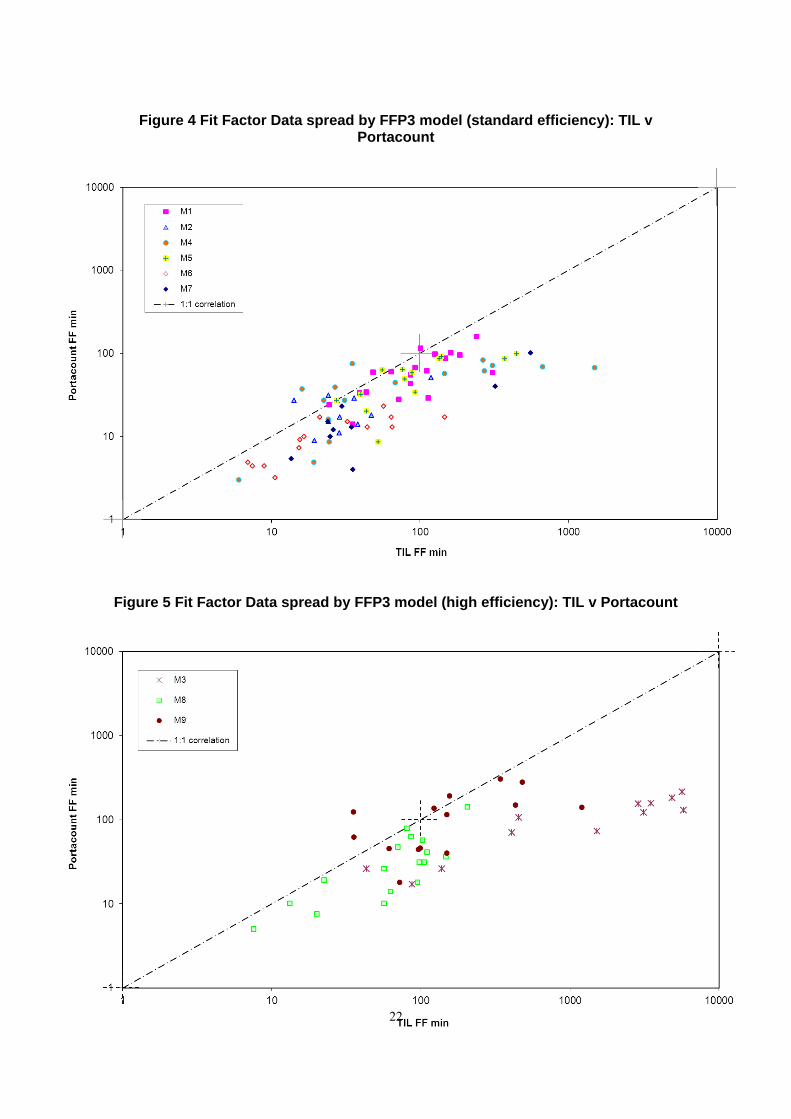
3.3.4.2 Effect of filtering efficiency of the FFP3 on the statistical values
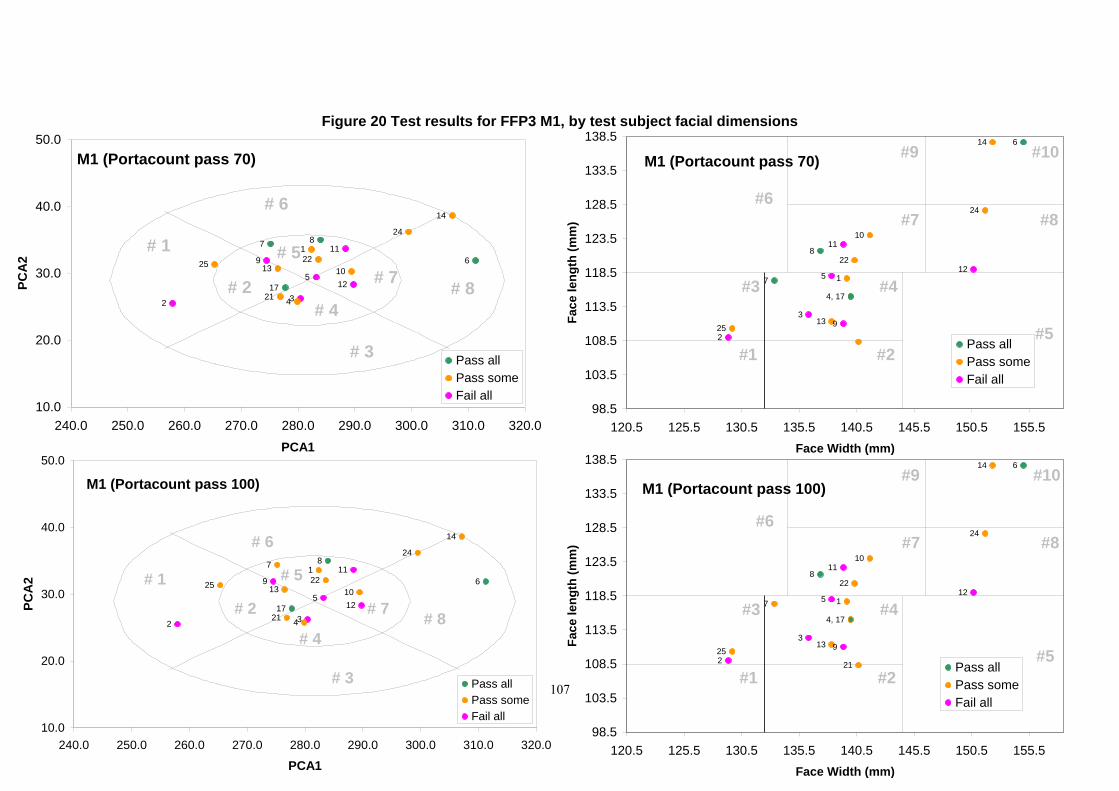
As it had been suggested that particles passing through the filter material could contribute to leakage measurement during the Portacount fit test, and this suggestion has been examined using the results from FFP3 with differing filtering efficiencies. Section 2.4.2 explains that the filtering efficiency of FFP3 M3, M8 and M9 is significantly higher than that of the other FFP3 used in the study. The results from tests on these two groups of FFP3 (M1,M2,M4,M5,M6,M7) and (M3,M8,M9) were analysed independently, as standard efficiency and high efficiency, respectively. These are presented in Figures 4 and 5 as X-Y scatter graphs of TIL v Portacount from which it is clear that there is little difference between the spread of the data between the two groups with the bias towards lower Portacount fit factors present with both sets of data to a similar extent.
This suggests that the reason for the overall bias towards higher TIL fit factors compared to the Portacount is not related to the filtering efficiency of the FFP3, but due to other factors. The extent of the effect of any particles passing through the filtering material is similar on both measurement methods (TIL and Portacount), especially in the critical pass criterion region of the TIL fit factor (around 100) and continuing up to fit factor 200. The type of measurement taken may well be the significant factor creating the bias. The Portacount method measures the number of all particles, whereas the TIL method measures the mass of salt particles only. A similar bias has been found by others11. This does not mean that particles passing through the filtering material will not detrimentally affect fit factor results, but that it will have a similar effect on both TIL and Portacount fit test methods. The statistical analyses against all fit test methods for standard efficiency and high efficiency FFP3 are given in, Tables 9 and 10 respectively (Appendix B).
At high fit factors the tests methods are more likely to behave differently with respect to one another and indications of this trend are appearing with some of the FFP3. M3 appears to show a different behaviour to the other FFP3 but this FFP3 performs very well (compared to M8 and M9) on some of the TIL tests, returning very high fit factors compared to the Portacount method. This may be because, with a high filtering efficiency and a good fit, the influence of wearer generated particles being included in the Portacount measurement is likely to become significant in limiting the Portacount fit factor. Also, the characteristics of the specific filtering material, especially its performance across a range of particle sizes will also have a significant effect on the actual fit factor result. Very small particles (nanoparticles) are known to readily penetrate some filtering materials22. These factors are not significant to the scope of this study which is concerned with borderline fit of FFP3, which these fit factor results are well above. The effect of wearer generated particles on fit factors of RPE which is expected to provide greater protection than FFP3 and requires a higher fit factor pass criterion is significant, and documented11,23.
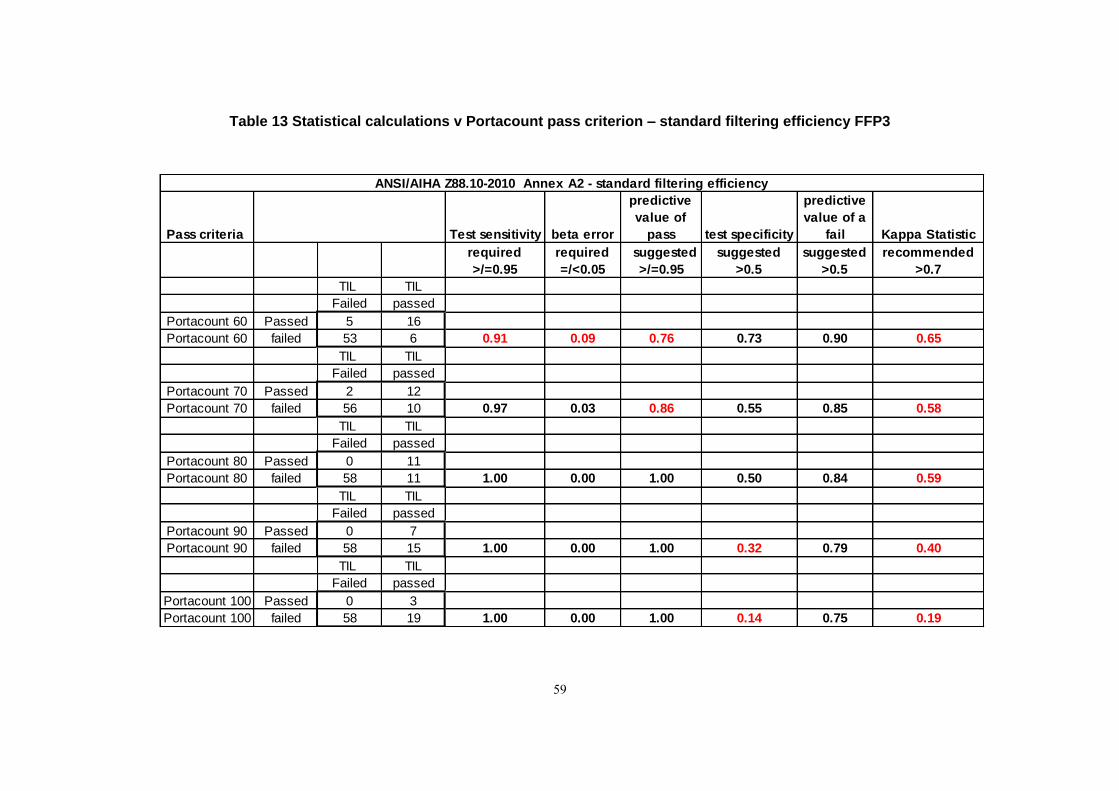
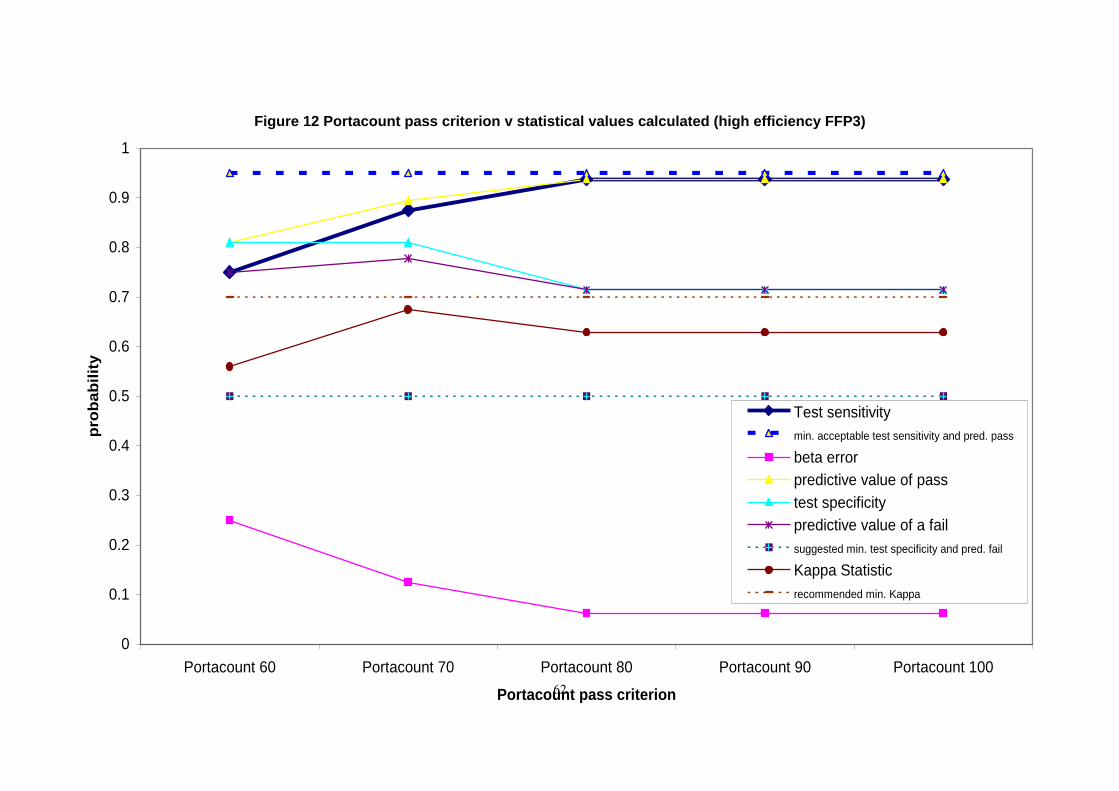
The ANSI standard requires analysis of data collected from tests on a range of FFP3 and specifies the number of test runs and reference method fails required (see discussion in section 2.4.5). Valid analysis requires our full data set; however, similar analysis to that carried out with the full data set was also carried out on these two groups of FFP3 to get an indication of the effect of adjusting the Portacount fit test pass criterion. The results are in Tables 11 and 12 (Appendix B) and are shown in graph form in Figure 11 (Appendix B) for standard efficiency FFP3, and in Figure 12 for high efficiency FFP3.
22
Figure 4 Fit Factor Data spread by FFP3 model (standard efficiency): TIL v Portacount
Figure 5 Fit Factor Data spread by FFP3 model (high efficiency): TIL v Portacount
23
Note that the number of test runs included in each of these groups is now much lower than the minimum of 100 required by the ANSI standard (and hence this analysis is not valid under the ANSI standard criteria) and that this will influence the statistics, reducing the confidence which can be placed in them. This is especially significant for the group of high filtering efficiency FFP3. As an example, the only test run to fail on the TIL fit test method, but achieve more than 100 on the Portacount fit test method, was with a high efficiency FFP3. This one test run alone reduces the calculated test sensitivity to 0.94 at best, below the ANSI standard requirement, whereas the group with standard filtering efficiency suggests a better test sensitivity at 0.97 (at a Portacount fit test pass criterion of 70) than for the whole data set.
It is also worth noting that for the standard efficiency FFP3 the statistics are particularly poor in respect of test specificity and predictive value of a fail with a Portacount pass criterion of 100 or 90, but that these improve markedly if the Portacount pass criterion is reduced to 70. Of note is that while these values are improved at 70, these values are also within recommended ranges with a pass criterion at 80 and the kappa statistic at 0.59 is higher than that at 0.58 when the pass criterion is at 70. At the pass criterion at 80, statistical values for test sensitivity, beta error and the predicted value of a pass are within ANSI recommended values. Although the low number of TIL fit test passes (22, with 58 fails) with this group will have a strong negative influence on the confidence which can be placed on the calculated value of the test specificity and the predictive value of a fail (see discussion in section 4.3.3 fifth paragraph). For the high filtering efficiency all statistics remain at the same levels for a Portacount fit test pass criteria of 100, 90 and 80. However, at pass criterion of 70, the test sensitivity is reduced from 0.94 to 0.88, the predictive value of a pass is reduced from 0.94 to 0.89, while the test specificity increases from 0.71 to 0.81 and the predictive value of a fail increases from 0.71 to 0.78.
3.3.4.3 Effect of modifying the Portacount pass criterion on the percentage of fit tests which fail on the talking exercise
A known disadvantage of the Portacount fit test method is that it measures all particles inside the FFP3, including any generated by the wearer. Many wearers generate particles when talking and it is often the talking exercise where the test fails. Figure 13 (Appendix B) shows the percentage of fit test fails, by exercise and how this varies with the pass criterion for the Portacount fit test method. With the pass criterion at 100 the talking exercise is clearly leading to a failure more often than any other exercise. As the pass criterion is reduced to 70 the dominance of talking as the fail exercise diminishes and the primary fail exercise is more evenly distributed across exercises.
Figure 13 (Appendix B) also shows exercise failure rates with the Portacount-with-N95-Companion method, the TIL fit test method, and the Bitrex fit test method. The use of the N95-Companion technology with the Portacount has a lower incidence of the talking exercise resulting in the lowest fit factor than the Portacount used alone. With the TIL fit test method the talking exercise rarely resulted in the lowest fit factor. These results reflect the fact that the TIL fit test method is not affected by wearer generated particles, and support the hypothesis that many wearer generated particles may be removed by the N95-Companion unit.
The Bitrex fit test is terminated as soon as Bitrex is tasted, therefore the exercise which shows the poorest fit cannot be determined, only the point at which the fit was poor enough for the test subject to detect the Bitrex taste. Many tests were over before they had even had the Bitrex challenge fully applied, or failed just into the first exercise. Of the remaining fails
24
all exercises contributed to these, including talking, which demonstrates that all exercises are of value and have the potential to detect a poor fit.
3.3.5 Portacount-with-N95-Companion technology fit test results
Figure 2 shows the comparison of Portacount-with-N95-Companion technology (N95- Portacount) fit factors against the TIL fit factors. The spread of data on this X-Y scatter is similar to that of the Portacount against TIL, but the bias towards lower fit factors is not as pronounced as when the Portacount is used without the N95-Companion technology (Figure 1). It is also noticeable that the N95-Portacount-with-N95-Companion technology fit factors in Figure 2 do not begin to “flatten out” at high levels of TIL in the same way as in Figure 1 (Portacount). This is likely to be due to the comparative amounts of wearer generated particles being counted. Wearer generated particles may be relatively large and therefore removed by the N95-Companion technology resulting in less of a contribution to the measured sample from inside the FFP3. This would explain why the talking exercise is not as likely to be the exercise which results in the minimum fit factor, discussed in section 3.3.4.3. It would also explain why the very high TIL fit factors resulting from some of the M3 tests (discussed section 3.3.4.2 ) are more closely matched by the Portacount-with-N95-Companion technology, than by the Portacount alone.
Table 9 (Appendix B) includes information on the initial statistical calculations, using a pass of 100 for the Portacount with N95-Companion technology fit test method returned a test sensitivity of 0.93, which falls slightly short of that required by the ANSI standard (0.95 needed), a specificity of 0.58 and a Kappa statistic of 0.55.
Figure 14 (Appendix B) shows the effect on the statistics of adjusting the Portacount-with-N95-Companion fit test pass criterion. Increasing this fit test pass criterion to 120 improves the test sensitivity to the 0.95 required by the ANSI standard but this also reduces the test specificity (to 0.51) and the Kappa statistic to 0.5 indicating less agreement with the reference TIL fit test method at this higher pass level.
Reducing the fit test pass criterion to 90 has no effect on the statistics, but reducing it to 80 takes the test sensitivity down to 0.92, slightly further away from the minimum required. However, the test specificity is improved to 0.65 and the Kappa statistic to 0.6. Reducing the pass to 47 (best agreement from the ‘line of best fit’ discussed in section 3.2.3) brings the test sensitivity to an unacceptably low level with probability of only 0.77 of a poor fit being detected, increasing the Beta error (probability of a false pass test result) to 0.23.
Overall, this method is returning results which are not in quite such good agreement with the TIL method as the Portacount used on its own, no matter how the pass criterion is adjusted.
Figure 15 (Appendix B) shows the X-Y scatter of Portacount-with-N95-Companion results against Portacount alone. Figure 16 (Appendix B) shows the same results but focuses on the critical pass/fail criterion area using a linear scale. Both show the 1:1 correlation and the 100:70 pass criteria point which is centrally located within the scatter supporting the suggestion that a pass of 70 on the Portacount fit test method correlates well with a pass of 100 using the Portacount-with-N95-Companion fit test method.
3.3.6 Bitrex fit test results
The Bitrex fit test results do not have a quantitative value but are categorised as pass, fail or borderline. They cannot therefore be plotted as an X-Y scatter graph against a quantitative method. Figure 3 shows Bitrex fit test results identified by colour and pattern on the bar
25
chart for the TIL result. This gives a visual presentation of the correlation between the Bitrex and TIL methods and these are further represented in the box plots, Figure 8 (Appendix B).
The Bitrex fit test results can be analysed according to the ANSI standard in exactly the same way as for the Portacount methods, and the statistical values calculated. These are shown in Table 9 of Appendix B. In some of the Bitrex fit tests the test subject detected a slight taste of Bitrex, but this was not a definite taste and the test continued through to the end without further detection of Bitrex taste. (Generally if the wearer can definitely taste Bitrex they are keen to remove the hood to take away the bitter taste as soon as possible.) The slight taste response was therefore classed as borderline and the data analysed in two ways. One way included the borderline cases as fails and the other included them as passes. Hence there are two sets of calculations which returned different statistical values. The test sensitivity is the most critical measure and this is higher (at 0.86 compared with 0.81) and hence more acceptable for the ANSI standard if the borderline results are counted as fails.
Looking back to the statistical analysis for the high filtering efficiency FFP3, this is where the Bitrex fit test sensitivity does increase to 0.94, nearly reaching the ANSI requirement, see Table 12 in (Appendix B). This result should be treated with caution as the number of fit test runs on which this is based is insufficient, but such a result might be expected as the Bitrex aerosol particles should not pass though the filtering material, as they are too large7 (the Bitrex fit test method can be used for fit testing lower classes of disposable masks FFP1 and FFP2 which have much lower filtering efficiency).
The TIL fit test is affected by particles passing through the filtering material, but with high efficiency FFP3 there will be fewer particles passing through the filtering material, therefore the TIL fit test should be giving a more accurate (or true) measure of fit than when it is used with standard efficiency FFP3. The statistical calculation of test sensitivity, at 0.94, with high efficiency FFP3 suggests a good correlation between the Bitrex fit test and the TIL fit test in the detection of poor fit, suggesting that the Bitrex fit test may also be giving a good measure of true fit. (Mullins7 et al also found good correlation of the Bitrex test against a quantitative method when using a reusable half mask fitted with high efficiency filters.) It follows that since the Bitrex fit test method is not affected by particles passing through the filtering material, when it is used for standard efficiency FFP3 it should also be giving a good measure of true fit. As the Bitrex fit test method is the only fit test method not affected by particles passing through the filtering material, it may be the best measure of true fit for all FFP3, and also for FFP2 and FFP1.
A good fit could just fail the TIL fit test because particles passing through the filtering material will be counted as faceseal leakage. In such a situation the Bitrex fit test should pass, if the Bitrex fit test is a true measure of fit. The few cases in our study where this may have happened will show up in the statistics and will show the Bitrex fit test method as not as well in agreement with the TIL fit test method, because the TIL fit test result is slightly incorrect. This should be taken into account when judging the statistics of the Bitrex fit test method.
It follows that a reasonable way forward might be to measure all fit test methods against the Bitrex fit test method as the reference method, not the TIL fit test method. However, this judgement does not take into account other potential problems with the Bitrex fit test method; it should be remembered that the Bitrex fit test is subjective and depends on other factors such as the wearer’s sensitivity to Bitrex taste and how they define a positive taste.
26
The test sensitivity is the most critical measure and this is higher (at 0.86 compared with 0.81) and hence more acceptable for the ANSI standard if the borderline results are counted as fails. Consideration was given to the possibility that adjusting the TIL pass level may improve the test sensitivity but calculations demonstrated that although the test sensitivity could be improved this would be at considerable detriment to the other statistical values.
3.3.6.1 Impact of test subject sensitivity to Bitrex on Bitrex fit test result
Another consideration was the sensitivity of the test subject to the taste of Bitrex and the impact of this on the test result. According to the accepted protocol, if the result of the Bitrex sensitivity test is any number from one to ten then, no matter what this actual number is, the amount of test agent applied in the subsequent Bitrex fit test should always be the same.
Figure 17 (Appendix B) categorises and quantifies the fit test results in relation to the Bitrex sensitivity test result. As can be seen from the bar chart, for most of the test runs the sensitivity of the test subject was 2 or 3 squirts of the Bitrex aerosol required for them to definitely taste this bitter substance. Three test runs only required 1 squirt of Bitrex whilst some needed 4 or more. The trend of this graph appears to show that a more sensitive test subject (low Bitrex sensitivity test result) may have a greater chance of returning a fail in the Bitrex fit test result. However, the number of test runs for which the Bitrex sensitivity test required more Bitrex (7, 8 or 9 squirts) is only 7. This is an insufficient quantity of data on which to draw definite conclusions but it does indicate a possible trend.
To explore the implications of this indicative trend further, the statistical analysis was repeated excluding the data from the test runs which followed a high numerical Bitrex sensitivity test result (i.e. relatively low subject sensitivity). This information is shown in Table 16 (Appendix B). Where test runs recording a numerical Bitrex sensitivity above 5 were excluded, the statistical values are improved with the test sensitivity increased to 0.89 and the predictive value of a pass and the Kappa statistic both increased slightly. This indicates that the Bitrex fit test may be giving more reliable results where test subjects have a more typical sensitivity to Bitrex.
In this study the 3M qualitative Bitrex fit test kit was used. The 3M hood is referred to in the OSHA standard8 but several other qualitative Bitrex fit test kits are available in the UK, which have a different design of hood. This modified hood design could affect fit test results, for example if the space inside the hood is larger this could dilute the aerosol. Correlating data from this study for a larger hood the Bitrex sensitivity test result might still be within the 1-10 range, with an average type response, therefore requiring the same challenge aerosol amount for the fit test as needed for the 3M hood. However, when applied to a larger volume this could result in a relatively more dilute challenge and possibly an incorrect fit test result, leading to a pass where the fit is poor. Further work would be needed to explore this hypothesis.
3.4 SUBJECTIVE OPINION OF FIT - CORRELATION WITH FIT TEST RESULTS
The fit test results did not generally reflect the opinion of the wearer and the fit tester as to how well the FFP3 appeared to fit. 61 test runs resulted in a fail in every fit test method, according to current HSE guidance. Both the test subject and the fit tester were of the opinion that many of these FFP3 were fitting well. Others20 have similarly found that user fit-checks cannot be relied upon to determine fit, and may be unreliable even for detecting gross misfits.
27
Table 17 and Table 18 (Appendix B) show the subjective opinion of the fit, including the fit-check result and the comments of the wearer and the fit tester both before and after the test run. These are further discussed in the following sections. The level of experience of the test subject in donning and wearing FFP is given as a star rating in these tables:
* no experience
** moderate experience
*** experienced
Table 19 (Appendix B) summarises the test subjects’ opinions of fit relative to their experience. This table shows the percentage and number of occasions a test subject judged the fit to be good, when the fit failed in all fit test methods.
3.4.1.1 Fit-check v fit test results
Tables 17 and 18 (Appendix B) show the results of the pre-test fit-check compared with actual fit test results. A fit-check should always be carried out after donning a respirator and before the wearer enters the hazardous area. As the table shows the majority 105 (81%) of the fit-checks were successful with the fit being declared good, however 61 (58%) of the subsequent fit test runs returned a fail in all 4 fit test methods. Conversely only 15 (12%) of fit-checks returned a fail but 2 of these ‘poor’ fits went on to return fit test passes in every fit test method.
Similar percentages of fit-check results across all levels of test subject experience, given in Table 19 (Appendix B), show that experience of the test subject in donning and wearing FFP3 did not affect ability to judge a good fit according to the fit-check.
Note; these results were partly subjected to the ANSI statistical analysis and this is discussed in section 3.4.2.
3.4.1.2 Test subject comments v fit test results
61 fit test runs returned a fail in all of the test methods. For these tests the test subject’s initial comments on the fit after first donning the FFP3 were “good” in 18 (30%) donnings and “poor” in 18 (30%), with the remainder being “unsure”. Following the test run the test subject’s comments indicated that the fit was “good” for 15 (25%) and “poor” for 31(51%), with the remainder “unsure”. This data shows that a few of the poor fits had been identified by the test subject during the test run, but by no means all of them, and 25% still thought that the fit was good.
16 test runs returned a pass in all methods. 7 (44%) of these were thought by the test subject to be good fits initially with none thought to be a poor fit. By the end of the test run 14 (88%) of test subjects thought that the fit of the FFP3 was good.
Table 19 (Appendix B) data shows the relatively higher percentage of inexperienced and moderately experienced test subjects judging a poor fit to be good prior to the test run, and indicates that experience is important in judgement of fit on first donning an FFP3. However, similar percentages of post-test run opinions across all levels of experience show that such experience did not affect ability to correctly judge a poor fit following wearing the FFP3 for the test run. In other words poor fits not initially recognised due to inexperience of test subjects can be picked up on by wearing the FFP3 for the test run (approximately 1 hour of wear time).
28
3.4.1.3 Fit tester observations v fit test results
Again looking at the 61 fit test runs which failed in all methods, the fit tester’s initial comments after donning were good for 26 (43%) and poor for 15 (25%) of donnings, with the remainder unclear. At the end of the test run 23 (38%) were still being judged by the fit tester to be good fits and 17 (28%) poor.
16 test runs returned a pass in all methods. 9 (56%) of these were thought by the fit tester to be good fits from the first donning. This number increased slightly to 11(69%) by the end of the test run.
3.4.2 Fit-check results
A fit-check is not a method of fit testing. A fit-check is used as a simple subjective check to give an indication of fit. The European Standard for filtering facepieces EN149 requires manufacturers to include information and warnings for the user of filtering facepieces, and these are expected to cover fit. In response, many manufacturers recommend a fit-check to be carried out as a pre-use check on the wearer fit of a facepiece following each donning and before exposure to the respiratory hazard. There is currently no specific requirement in the European Standard EN149 for a recommendation in support of fit testing to be included in manufacturers’ instructions, although there is support for fit testing in EN52921, the European RPE guidance document on selection use and maintenance.
Looking back to the results of the fit-check discussed in section 3.4.1.1, these were analysed using the ANSI methodology against the TIL fit test method calculating the test sensitivity. Where the test subject was uncertain of the result of the fit-check, this was termed borderline and classed as a fail for the purposes of calculation. The analysis gave a test sensitivity of 0.18 which is very poor, indicating that use of this fit-check alone is of little value in determining the quality of the fit of the FFP3. Similar test sensitivity for fit-checking, with values of 0.15 and 0.23 respectively on two models of filtering facepieces, was found by Lam et al 20. The ANSI standard requires a test sensitivity of at least 0.95.
Given that there is much more value in a fit test than a fit-check in determining fit, there is justification for including information within the manufacturers’ instructions recommending that a fit test should be carried out when selecting an FFP3.
3.5 FACIAL SIZES AND FIT OF FFP3
Figures 18 and 19 in Appendix B show the facial dimensions of the 25 test subjects plotted in accordance with ISO technical report ISO/TS 1697618, both as PCA (principal component analysis) and bivariate length-width measurements. The number of tests which each subject took part in is shown in Table 19 (Appendix B) along with the identity of the FFP3s which they wore for test runs. Results are further presented in Figures 20 to 28 of Appendix B, identifying the face sizes with the fit test results for each FFP3. Green dots indicate that the fit test passed in all test methods, pink dots a fail in all methods and amber a mix of pass and fail across methods. Results are shown for a pass criterion of 100 in all quantitative fit test methods, and also with a pass of 70 applied to the Portacount fit test method (whilst other fit test methods remain at pass criterion 100).
Many of the test subjects fall within the most common face shape and size with a few outsiders with long wide faces or short narrow faces and short wide faces. No volunteers had long narrow faces.
29
S23 was the only test subject not to record a pass in at least one fit test but S23 was only able to take part in one test run, the only test subject who did not do multiple runs. All face shapes and sizes were able to achieve at least a single fit test pass in one test method with at least one FFP3. This does not mean that it would be straightforward for an employer to easily find suitable FFP3 for all their employees, especially if they have smaller faces. M9 proved a good fit on a wide range of face sizes including long wide faces and short narrow faces.
3.6 FIT TEST PASS RATE WITH FFP3 MODEL
Table 6 shows the number of fit test passes in all four fit test methods and the percentage pass rate, according to FFP3. M9 and M3 performed well with 40% and 50% of test subjects passing in all fit test methods. M1 passed in all fit test methods with 16% of test subjects, which is improved to 21% with a Portacount pass criterion of 70 applied. M5 results were improved from zero passes to 23% by reducing the Portacount pass criterion to 70. M7 returned a pass in all fit test methods on one test subject only. All other FFP3s (M2, M4, M6 and M8) did not achieve a pass in all four fit test methods with any test subject, even when the Portacount pass level was reduced to 70.
Table 6 Test runs achieving a pass in all four fit test methods by FFP3
No single design feature dominated the results. The FFP3s which returned the best results M1, M3, M5 and M9 included one or more of the full range of design features:
rigid pre-formed cup shape with no nose adjustment
softer cup shape with an a wearer-adjustable nose clip
fold flat with a vertical fold and wearer-adjustable nose clip
horizontal fold flat and wearer-adjustable nose clip
small section of faceseal material over nose only, remainder of seal formed by edge of filtering material
continuous elastomeric faceseal attached around the edge of the facepiece
continuous knitted fabric faceseal attached around the edge of the facepiece
FFP3
model
Number of test subjects
passed in all test methods
% test subjects passed
in all test methods
Number of test subjects
passed in all test methods
% test subjects passed
in all test methods
M1 3 16 4 21
M2 0 0 0 0
M3 6 50 6 50
M4 0 0 0 0
M5 0 0 3 23
M6 0 0 0 0
M7 1 11 1 11
M8 0 0 0 0
M9 6 40 6 40
Portacount pass 70Portacount pass 100
30
adjustable elastic straps
fixed length elastic straps
Many test subjects complained that the FFP3 they were given was difficult or impossible to fit or uncomfortable. These were mainly the FFP3s which failed to give a pass for any test subject with all four fit test methods. A number of areas for design improvement were identified. These included:
overall shape of FFP3
nose clip - difficult to shape due to poor malleability or strength and /or insufficient length
quality and /or length of strap material
3.7 PASS LEVEL FOR THE EUROPEAN STANDARD EN1491 TIL TEST
A simple assessment of the results of the TIL tests show that 93 of the 130 tests would easily have passed the European Standard EN1491 test for Total Inward Leakage, achieving a fit factor of at least 50 in every exercise, or less than 2% TIL. The EN149 requirements (see section 3.2.1), are actually less stringent than indicated by this summary, therefore, even more of this study’s TIL tests could well have passed the European Standard EN 149 test. It should also be considered that our test runs were carried out no matter how well the FFP3 appeared to fit whereas in a European Standard EN 149 TIL test, wearers who deemed the fit poor after donning would not have begun the test. Following such a pre–test run sifting an even greater percentage of the remaining TIL fit tests would result in an EN 149 TIL test pass.
In our study 61 of the test runs failed in every method of fit test, and at least 40 of these were not regarded as poor fits when donned. Therefore, many European Standard EN 149 TIL test passes would not be regarded as good fits using any of the fit test methods and criteria suggested in this study.
31
4. CONCLUSIONS
Overall, none of the fit test methods used in this study achieved all of the required, suggested or recommended values in all statistical calculations given in the ANSI standard, against the TIL fit test chamber method. That is, the three fit test methods (Portacount, Bitrex and Portacount-with-N95-Companion technology) when used for FFP3 do not meet all of the criteria for acceptance of a new fit test method, under ANSI/AIHA recommendations.
Failure to meet the ANSI criteria will be influenced by the shortcomings of the TIL fit test method when applied to FFP3 and used as a reference method. Unfortunately, there is no quantitative fit test method which can eliminate the effect of filtering material penetration on the fit factor results. The effect is to bias the fit factor low, which may lead to inaccuracies in the calculated statistical values when it is used as a reference method, especially reducing the predictive value of a pass and increasing the predictive value of a fail.
It would be impractical to expect all FFP3 fit tests to be carried out using the reference method, that is the TIL chamber fit test method. The test sensitivity (ability to correctly detect a poor fit) of the three other fit test methods used in this study was at least 0.88, which, whilst it falls short of the ANSI requirement of 0.95, is considerably better than the 0.18 which is the test sensitivity of a simple fit-check. It is clear from this work and that of others that simple subjective assessments cannot be relied upon to give an assessment of adequate fit and that any of the fit test methods used in this work are vastly superior to a fit-check in identifying poor fit. The reality is that the fit test methods used in this study do not fall far short of the ANSI criteria: they all meet the criteria in some respects.
One of the specific aims of this research was to examine the pass/fail criterion for the Portacount fit test method. Statistical analysis of the results obtained when working to the criteria laid down by the ANSI standard and following current HSE guidance and the information given in the methodology section of this report, shows that reducing the pass criterion from the current 100 to 70 would improve the overall agreement between the Portacount fit test method and the reference method based on the kappa statistic, with an increase from 0.46 to 0.65, an increase in test specificity from 0.42 to 0.67 and the predictive value of a fail increasing from 0.74 to 0.83. Note that the ANSI standard only specifies one outcome criterion as a requirement, the test sensitivity must be at least 0.95, other criteria are suggested or recommended by the ANSI standard. However, a pass criterion at 70 results in a decrease in test sensitivity from 0.99 to 0.95, still meeting the ANSI requirement, with a corresponding increase in beta error from 0.01 to 0.05. The reduction in the predicted value of a pass from 0.96 to 0.88 reduces the number of good fits which fail the Portacount fit test method and increases correlation between fit test results across all fit test methods when considering results for all FFP3 used in this study. However, this does lead to slightly less favourable statistics for correctly predicting a pass at 0.88, which is below that expected by the ANSI standard (0.95), but the calculated value may be biased low by the unavoidable inaccuracy of the reference method, however this is still a higher value than is achieved by either the Bitrex or Portacount –with –N95-Companion technology fit test methods.
Of note, are results relating to a pass criterion at 80 where test sensitivity is 0.99, beta error 0.01 and predictive value of a pass is 0.96 (>0.95), which are better statistical values than those with the Portacount criterion at 70. However, while test specificity at 0.60 and predictive value of a fail at 0.81 are within recommended values, they are lower than those
32
obtained with the pass criterion at 70. The kappa statistic at 0.64 which is the statistical value which indicates good agreement of this method with the reference method is 0.01 less than the kappa statistic obtained when a pass criterion of 70 is used. Therefore, the pass criterion at 70 gives better overall agreement with the reference method with all FFP3 used in this study.
The FFP3 used in this study had a range of filtering efficiencies and were broadly categorised into two groups described in this study as either standard or higher filtering efficiency. It is important to note that application of the ANSI criteria is not appropriate for either group when separated from the full data set due to insufficient data and therefore no firm conclusions can be drawn. However, more detailed analysis of the data from FFP3 with higher filtering efficiencies suggest that better correlation with the reference method is obtained with Portacount pass at 80, 90 or 100, although the test sensitivity is 0.94, below the ANSI requirement of 0.95. With standard filtering efficiency FFP3, the data suggest better correlation with the reference method is with Portacount pass 70 where the test sensitivity is 0.97, meeting the ANSI requirement. This analysis also suggests that the Bitrex method correlates better with the reference method with FFP3 with higher filtering efficiency than with FFP3 with standard filtering efficiency, as might be expected.
Also addressing one of the specific aims of this research to examine the suitability of using the Portacount-with-N95-Companion technology fit test method, based on the data from all of the FFP3 used, this study has shown that using the N95-Companion technology with the Portacount could provide a measure of FFP3 fit, if the pass criterion applied is 100. However, overall this method is returning results which are not in quite such good agreement with the TIL method as the Portacount used on its own, with correlation closest at Portacount pass 70.
Differences between the ANSI requirements and the levels achieved with the Portacount method may be (at least in part) due to the influence of filtering material penetration on the TIL results, especially for the predictive value of a pass which may be biased low at 0.88, but is still a better value when compared against either the Bitrex or the Portacount –with –N95-Companion technology fit test methods.
The reasons why the different fit test methods do not agree will be influenced by a number of factors. As well as filtering material penetration, differences in measurement methodologies, and the effect of wearer-generated particles will all play a part.
The Bitrex qualitative fit test method has been shown to give a good determination of fit in this study. It may have the potential to give the most accurate determination of true fit as the challenge particles do not pass through the filtering material in a form which can be detected, a problem which can occur when using quantitative fit test methods. The validity of this theory is supported when considering the results of standard and higher filtering efficiency FFP3 separately. However, the Bitrex qualitative fit test is a subjective method, dependent on the wearer’s taste response, which is arguably less reliable than quantitative measuring equipment. The statistical values with the Bitrex fit test method are similar to those achieved with the Portacount-with-N95-companion technology (pass criterion 100).
Some FFP3 used in this study demonstrated that they can readily fit a significant proportion of the test subjects, with a range of face sizes, across all four fit test methods. Other FFP3 were poor at fitting all of our volunteers. There is room for significant improvement in the design of some FFP3 towards better wearer fit which could be aided by more stringent standard requirements for FFP3.
33
5. REFERENCES
1 European Standard: Respiratory protective devices – Filtering half masks to protect against particles –Requirements, testing, marking BS EN149:2001 +A1:2009
2 L5 The Control of Substances Hazardous to Health Regulations 2002 (as amended) Approved Code of Practice and guidance, Sixth edition. HSE Books 2013 ISBN 978 0 7176 6582 2
3 L132 The Control of Lead at Work Regulations 2002 - Approved Code of Practice and guidance, Third edition. HSE Books 2002 ISBN 0 7176 2565 6
4 L143 Managing and working with asbestos. Control of Asbestos Regulations 2012. Approved Code of Practice and guidance. HSE Books 2006 ISBN 978 0 7176 6618 8
5 HSE Guidance: Fit testing of Respiratory Protective Equipment Facepieces HSE OC 282/28 (30/4/2012) http://www.hse.gov.uk/foi/internalops/fod/oc/200-299/282_28.pdf
6 Minesota Mining and Manufacturing Company post hearing data submission on qualitative fit testing protocols under the lead standard before OSHA Docket No. H-049A 1981
7 Mullins H.E. et al (1995) Development of a new Qualitative Test for Fit Testing Respirators Am. Ind. Hyg. Assoc. J 56:1068-1073
8 Occupational Safety and Health Administration (OSHA) 2004 Fit Testing Procedures (Mandatory) –1910.134 App A http://www.osha.gov/pls/oshaweb/owadisp.show_document?p_table=STANDARDS&p_id=9780
9 American National Standard (ANSI/AIHA Z88.10-2010) Respirator Fit Testing Methods ISBN: 978-1-935082-24-8
10 Ernstberger H.G. et al, Experiments Supporting the Use of Ambient Aerosols for Quantitative Respirator Fit Testing Am Ind. Hyg.Assoc. J 49(12) :613-619(1988)
11 Bierman et al, LLNL Evaluation of the Portacount for Determining Respirator Fit Factors Lawrence Livermore Laboratory Oct 1991
12 NIOSH National Institute for Occupational Safety and Health Approved Particulate Filtering Facepiece Respirators http://www.cdc.gov/niosh/npptl/topics/respirators/disp_part/
13 European Conformity (CE) marking for RPE Council Directive (89/686/EEC) 2003 http://eur-lex.europa.eu/LexUriServ/LexUriServ.do?uri=CONSLEG:1989L0686:20031120:EN:PDF
14 Coffey et al (2002) Comparison of Five Methods for Fit-Testing N95 Filtering –Facepiece Respirators Applied Occupational and Environmental Hygiene Volume 17(10): 723-730, 2002
34
15 HSE Guidance L28 (1987) Work with asbestos insulation, asbestos coating and asbestos insulating board (Third Edition); Control of Asbestos at Work Regulations 1987 ISBN 0 7176 1674 6
16
17 British Safety Industry Federation (2010) The Fit2Fit RPE fit testers accreditation scheme http://www.fit2fit.org/
18 International Organization for Standardization ISO/TS 16976-2 (Technical Specification 2010) Respiratory protective devices – Human factors – Part2: Anthropometrics Reference number ISO/TS 16976-2:2010(E)
19 www.random.org (Jan 2013)
20 Lam et al; Sensitivity and specificity of the user -seal -check in determining the fit of N95 respirators; Journal of Hospital Infection Vol 77, Issue 3, March 2011, pages 252-256 Proceedings from the Sporicidal Workshop
21 European Standard: Respiratory protective devices – Recommendations for selection, use, care and maintenance – guidance document EN529:2005
22 Rengasamy et al (2011) Evaluation of the filtration performance of NIOSH-approved N95 filtering facepiece respirators by photometric and number-based test methods. J Occup Environ Hyg; 8: 23-30
23 Clayton M. (2001) The effect of exhaled particles on RPE fit testing using the TSI Portacount PlusTM Respirator fit tester, HSL Internal Report PE/0/01
6. APPENDIX A - HSL STATISTICIAN’S REPORT ON THE ANSI STANDARD*
(*The ANSI/AIHA standard Z88.10-2010 Respirator Fit Testing methods Annex A2: Criteria for Evaluating new Fit test methods)
Comparison of methods of fit testing respirators with Fit Factors around 100
INTRODUCTION The latest ANSI standard draft has just been published. The requirements to validate a new type of fit test procedure against the reference procedure have changed.
1. The exclusion criterion for “results too near to the pass/fail limit” has changed.
This criterion is in the standard to ensure that the “gold” standard test (the Reference method) gives a reliable pass or fail. To apply the exclusion criterion, first the Standard Deviation of ONE subject using ONE mask at or around the Reference Fit Test Method Limit, must be measured. The new change now excludes results within one Coefficient of Variation. Previously it was within one Standard Deviation. Now CoV= SD/Mean, from repeat measurements on one subject with one facemask where that combination is close to the pass/fail limit, in this case a Fit Factor of 100. This is a sensible change that defines the criterion more appropriately, but has no impact on the number of tests required.
2. If results are to be excluded under point 1 above, more than 100 tests must be made. 3. At least 50 of those 100+ tests accepted under point 1 must also be below the pass/fail
limit, i.e. below the CoV of the limit after point 1. This depends on the selection of the types of facemasks likely to give good and poor performances. It will extend the number of tests required to beyond 100.
4. The new ANSI standard acknowledges that the outcome of the test could depend on the underlying distribution of fit test results. A binary logistic regression method has been proposed but has not been independently evaluated.
NUMBER OF RESULTS For planning a project around the standard to investigate a new test method, or to compare two existing test methods, the total number of tests is required, including those that would be excluded under point 1 above. The problem is to state how many are likely to be excluded so as to design and cost an experiment that will end up with 100 usable results after exclusion has been applied. The ANSI standard reveals that tests carried out so far show a within-subject CoV of between 0.23 and 0.82 based on variations in leak location and breathing patterns and possibly, probe placement. By contrast, in a real ANSI test, the CoV would not reflect differences in breathing patterns or probe placement as only one subject and one mask is used so the probe location would not be changed. These CoV’s may be overestimates.
36
Standard Deviation of results – Log transform method
Data from another HSL consultancy project showed that the distribution of Fit Factors was not normally distributed. Log-transformation was required to normalise it. The ANSI standard does not make any recommendation as to whether a suitable normalising transformation should or should not be used. The data was truncated such that Fit Factors >200 were reported as 200, so the standard deviation is known to be an underestimate. The estimate is based on variability of all 33 subjects with different fittings of the facemask each time. By contrast, in a real ANSI test, the one subject chosen to determine CoV would be near to the 100 limit and the data would not be affected by truncation to FF=200 in the reference test method. The facemask is not refitted between readings, and the CoV should therefore be lower. The underestimate from the paragraph above may be near to the real situation. The within-subject CoV was 0.12 using normalised (log-transformed) data. The figure below shows this CoV bracketing the log-transformed data around a fit factor of Ln(100) = 4.605, which is from 4.04 to 5.17, equivalent to Fit Factors of 56.8 and 175.9 respectively.
This was using ONE facemask, which complies with the ANSI standard test criterion. This is a much lower CoV than those reported by ANSI. The CoV was obtained using 33 subjects 3 times each, and calculating the within-subject Standard deviation using ANOVA. Probe placement variability was not an issue here, nor would it be in the proposed test programme, so the ANSI CoV’s may be overestimates. If the new ANSI rejection criterion were applied to the original results, 36 of the 99 tests (36%) would have been excluded between FF=56.8 and FF=175.9. Three subjects out of the 33 would
37
have been entirely excluded from this data set because they were too close to the limit on each occasion with this facemask, however the ANSI test programme being considered would use more than one mask on each individual, so volunteers are unlikely to have to be rejected entirely. Increasing the number of tests in proportion, and accepting that some of those re-tests would also be rejected in turn, then the number of tests required to get 100 accepted tests would be 156. Standard Deviation of results – Untransformed method
If normalising is NOT required, the same data set yields a CoV of 0.43. Although this seems to be much higher figure than the log-transformed data (which was 0.12) the criterion only excludes 28 of the data points around FF=100, i.e. between FF=57 and FF=143. These limits are quite similar to the CoV limits from the log-normal transformation. Increasing the number of tests in proportion, and accepting that some of those re-tests would also be rejected in turn, then the number of tests required to get 100 accepted tests would be 139.
POWER The power of a test is defined as the probability of accepting a result (passing the method) when it should be accepted. This is the Sensitivity of the test. The ANSI standard comments that this
38
criterion (based on the beta error) was the most important in defining the test criteria. The power is therefore specified to be at least 0.95 (95%) by the ANSI test method “success” criterion to be able to accept the new test method. However, a paper from 20041 stated that “The calculated test sensitivity can vary as a function of the distribution of the reference fit factors” and that this was an undesirable property in a test. Nevertheless, the ANSI test as formulated with 100 tests will have sufficient power to assess the fit test methods. BIAS There is the possibility of bias from one facemask to a particular type of test method. The bias may be caused by a less than ideal probe location forced by the structure of the facemask. Bias cannot therefore be eliminated so it must be minimised. Bias is minimised by expanding the range of facemasks in the study. It is proposed to use nine facemask models of various brands for this project to reduce the effects of bias. A minimum number of models of facemasks is not specified in the ANSI standard. The requirement that at least 50 tests must be less than the pass/fail limit (or rather less than one CoV below the pass/fail limit) depends on the performance of the selected models of facemask. A balance of good and poor performing models should be selected amongst the nine. To satisfy this requirement, more than 100 acceptable tests will have to be gathered, but this cannot be quantified further at this stage. It is worth noting that poor performers will often allow more inward leakage through the filter material, and therefore are not purely measures of fit to the face that the fit test comparison procedure is supposed to isolate. There may be biases between different fit test procedures because filter material performance depends on particle size and charge. CONCLUSION Between 139 and 155 tests would need to be made to obtain a set of 100 acceptable results according to the ANSI “±CoV” acceptance criterion. An additional unknown number will have to be gathered to satisfy the “50 or more <limit” criterion. However this additional number will be minimised by appropriate prior choice of facemask models and the outcome cannot be quantitatively assessed further here. Chance will dictate that a significant number of results will be less than the limit because poor fits can occur with good facemasks, even with subjects known to fit facemasks well. The converse situation is encountered less often, whereby a poor respirator on a poorly fitting subject achieves a very good fit, but this is the author’s opinion based on many years of experience of respirator testing in the past. It is the author’s opinion that relatively few additional tests, if any, would need to be performed to fulfil this second criterion. It is worth planning for the upper bound of the 139-155 sample number estimated range.
1 Nelson TJ and Mullins HE (2004) Recommendations for the Acceptance Criteria for New Fit Test Methods. JISRP
V 21 pp 1-10
39
In addition, one subject will need several repeat tests on one fitting using the reference method only, to ascertain the CoV. This does not take as long to perform as the full test regime so will not impact very much on time and costs. However the ANSI standard does not recommend a minimum number of repeats to assess the CoV. More samples are needed to measure a standard deviation with any degree of accuracy than to measure the mean. The value of the CoV is critical to the number of tests that must be rejected, although the normal/log-normal analyses above suggest that that number is relatively stable. It is suggested here that at least 7 repeat tests should be performed. As an aside, the data set that will be created in this project will be of great value in future for modelling by bootstrapping of results. This statistical method picks data from the set in a random process, allowing the final result to be recalculated, which might have a slightly different outcome to the first (full) analysis. Many random repeats of this process can allow a distribution of the outcomes to be generated, informing decisions about the reliability of the ANSI standard method. Martin Roff 19/4/2011
40
7. APPENDIX B - RESULTS SUPPLEMENTARY TABLES AND GRAPHS
Tables and graphs included in this section are referred to in the main results, section 3.
41
Table 7 Headline results raw data pass criteria 100 in all quantitative methods
Figure 6 Fit factor data spread by FFP3 model: TIL v Portacount with line of best fit applied
y = 2.8544x0.5651
1
10
100
1000
10000
1 10 100 1000 10000
TIL FF min
Po
rtaco
un
t F
F m
in
M1
M2
M3
M4
M5
M6
M7
M8
M9
1:1 correlation
all data
Power (all data)
50
Figure 7 Fit factor data spread by FFP3 model: TIL v Portacount-with-N95-Companion with line of best fit applied
y = 1.1047x0.8162
1
10
100
1000
10000
1 10 100 1000 10000
TIL FF min
N9
5 P
ort
aco
un
t F
F m
in
M1
M2
M3
M4
M5
M6
M7
M8
M9
1:1 correlation
Power (all data)
51
Figure 8 Box plots showing spread of Bitrex results
Outliers are marked as circles. Outliers are deemed to be data points more than 1.5 times the length of the box above or below the top or bottom lines of the box. There are high outliers but no low outliers in this (log-transformed) data set. The whiskers reach to the highest and lowest data points that are not outliers. The top and bottom lines of the boxes represent the upper and lower 25%ile of the data. The line across the box is the median (50%ile). Extreme outliers are data points more than 3 box lengths above or below the box and would be marked as asterisks, but none are present in this data set.
Borderline
52
Figure 9 Distribution of Fit factors for the TIL method
Solid line = 100 Dashed lines = excluded data range 100±7.9 Dotted line = Geometric Mean
Solid line = 100 Dashed lines = excluded data range 100±7.9 Dotted line = Geometric Mean
TIL Fit Factor
53
Table 8 Covariance test run results and calculation of coefficient of variation
Covariance test run results and calculation of coefficient of variation
Exercise Fit Factors
Part 1 Part 2 Part 3 Part 4 Part 5 Part 6 Part 7
Walking 63.0 54.9 55.2 78.7 53.2 52.8 56.8
Head side to side 82.8 92.1 50.7 71.6 56.6 53.7 54.1
Head up and down 78.2 68.1 69.9 59.1 72.7 57.0 75.9
Published by the Health and Safety Executive 02/15
Review of fit test pass criteria for Filtering Facepieces Class 3 (FFP3) Respirators
Health and Safety Executive
RR1029
www.hse.gov.uk
Respiratory Protective Equipment (RPE) is available in a range of types which often include a tight-fitting facepiece which must fit the wearer’s face well for the RPE to work effectively. Good fit must be demonstrated by fit testing.
In this study, 25 volunteer test subjects wearing tight-fitting FFP3 (randomly selected from 9 different models) underwent four fit tests (Bitrex qualitative taste test, Portacount particle counting with and without the N95 companion technology and the laboratory chamber method), in random order, according to methodology given in HSE guidance 282/28. The selected FFP3 model worn by each test subject was not adjusted until all four fit tests had been completed.
Results analysed according to the criteria given in the American National Standard for fit test validation, indicate that the Portacount fit test method is more difficult to pass than the other methods. Differences in the methodologies and the potential for bias in the results across the fit test methods are discussed.
The study also shows that a fit-check should never be used as a substitute for a fit test.
Many of the FFP3 were poor at fitting the test subjects.
This report and the work it describes were funded by the Health and Safety Executive (HSE). Its contents, including any opinions and/or conclusions expressed, are those of the authors alone and do not necessarily reflect HSE policy.