Review of In-Service Moisture and Temperature Conditions in Wood- Frame Buildings Samuel V. Glass Anton TenWolde United States Department of Agriculture Forest Service Forest Products Laboratory General Technical Report FPL–GTR–174
Transcript
Review of In-Service Moisture and Temperature Conditions in Wood-Frame BuildingsSamuel V. GlassAnton TenWolde
United StatesDepartment ofAgriculture
Forest Service
ForestProductsLaboratory
GeneralTechnicalReportFPL–GTR–174
September 2007
Glass, Samuel V.; TenWolde, Anton. 2007. Review of in-service moisture and temperature conditions in wood-frame buildings. General Technical Report FPL-GTR-174. Madison, WI: U.S. Department of Agriculture, Forest Service, Forest Products Laboratory. 53 p.
A limited number of free copies of this publication are available to the public from the Forest Products Laboratory, One Gifford Pinchot Drive, Madison, WI 53726–2398. This publication is also available online at www.fpl.fs.fed.us. Laboratory publications are sent to hundreds of libraries in the United States and elsewhere.
The Forest Products Laboratory is maintained in cooperation with the University of Wisconsin.
The use of trade or firm names in this publication is for reader information and does not imply endorsement by the United States Department of Agriculture (USDA) of any product or service.
The USDA prohibits discrimination in all its programs and activities on the basis of race, color, national origin, age, disability, and where applicable, sex, marital status, familial status, parental status, religion, sexual orienta-tion, genetic information, political beliefs, reprisal, or because all or a part of an individual’s income is derived from any public assistance program. (Not all prohibited bases apply to all programs.) Persons with disabilities who require alternative means for communication of program informa-tion (Braille, large print, audiotape, etc.) should contact USDA’s TARGET Center at (202) 720–2600 (voice and TDD). To file a complaint of discrimi-nation, write to USDA, Director, Office of Civil Rights, 1400 Independence Avenue, S.W., Washington, D.C. 20250–9410, or call (800) 795–3272 (voice) or (202) 720–6382 (TDD). USDA is an equal opportunity provider and employer.
AbstractThis literature review reports in-service moisture and temperature conditions of floor, wall, and roof members of wood-frame buildings and exposed wood decks and perma-nent wood foundations. A wide variation exists in reported wood moisture content, spanning a range from as low as 2% to well above 30%. Relevant studies are summarized, and measured values of wood moisture content and temperature are tabulated. Trends are discussed that relate moisture con-ditions to climate and season, moisture sources and transport mechanisms, and building design and construction.
AcknowledgmentsThe authors are grateful to the American Forest & Paper Association (AF&PA) for funding this study. We also thank Philip Line of AF&PA; William Rose of the University of Illinois at Urbana-Champaign; and Charles Carll, Stan Lebow, and Samuel Zelinka of FPL for valuable comments and discussions.
Cover photo: Top left and bottom right used by permission of APA–The Engineered Wood Association.
ContentsPage
Executive Summary ..............................................................i1 Introduction ....................................................................... 1 1.1 Scope .......................................................................... 1 1.2 Moisture-Related Properties of Wood ........................ 1 1.3 Role of Climate .......................................................... 2 1.4 Instrumentation for Measuring Wood Moisture Content and Temperature ................................................. 32 Floor Members over Basement and Crawlspace Foundations .......................................................................... 4 2.1 Hot-Humid Climate ................................................... 5 2.2 Mixed-Humid Climate ............................................... 7 2.3 Marine Climate .........................................................11 2.4 Cold Climate .............................................................13 2.5 Summary: Floor Members ........................................153 Wall Framing and Sheathing ............................................16 3.1 Hot-Humid Climate ..................................................16 3.2 Mixed-Humid Climate ..............................................22 3.3 Marine Climate .........................................................24 3.4 Cold Climate .............................................................27 3.5 Summary: Wall Framing and Sheathing ...................334 Roof Framing and Sheathing ...........................................38 4.1 Mixed-Humid Climate ..............................................40 4.2 Hot-Dry Climate .......................................................40 4.3 Marine Climate .........................................................41 4.4 Cold Climate .............................................................41 4.5 Very Cold Climate .....................................................43 4.6 Summary: Roof Framing and Sheathing ...................445 Exposed Wood Decks ......................................................446 Permanent Wood Foundations .........................................46Conclusions .........................................................................47Literature Cited ...................................................................48
Executive SummaryThe objective of this report is to summarize available infor-mation about in-service moisture and temperature condi-tions in wood framing and sheathing members in floors, walls, and roofs of buildings. Additionally, this literature review documents limited information on exposed wood decks and permanent wood foundations. The reported ranges of moisture content (MC) and temperature observed in different types of assemblies (floors, walls, roofs, decks, and wood foundations), organized by climatic region and season, are given in the body of this manuscript. Because the data reported in the literature may not be statistically representative of all wood-frame buildings, whether a bias exists towards either higher or lower moisture contents can-not be determined. However, the studies include common construction found throughout North America, and the data therefore represent conditions that can occur. Overall trends in the different types of assemblies are as follows.
Crawlspaces• The most extreme moisture contents in wood structural members above crawlspace foundations occur when the ground is not covered with a vapor diffusion retarder. This effect is magnified for sites with poor drainage.
• Two different seasonal trends have been observed for crawlspaces:
1. Moisture content reached a maximum in winter and minimum in summer. This trend was observed in studies prior to around 1955 in uncovered crawlspaces in both mixed-humid and cold climates. The most likely explanation is that when the crawlspace vents either were lacking or were closed during winter, the uncovered soil supplied moisture that condensed on the coldest wood members in the crawlspace. During winter months, the coldest members are the sill plates, rim joists, and floor joists near the exterior. It should be noted that the buildings were not air-conditioned during the summer, and the floor framing therefore was probably warmer than the crawlspace floor (or below-grade portions of the crawlspace walls) for most of the time during summer months.
2. Moisture content reached a minimum in winter and maximum in summer. This trend has been reported in hot-humid and mixed-humid climates in all studies conducted since around 1955 in which seasonal trends were investigated. These studies included various types of crawlspaces (both covered and uncovered, vented and sealed). In many of these studies, the living space above the crawlspace was either known to be, or was probably, air-conditioned during the summer. Most likely, the major source of crawlspace moisture in these studies was warm, humid outdoor air rather than moisture evaporating from the soil. In summer, the
floor members can be cooler than the outdoor air (sometimes cooler than the outdoor dew point tempera-ture), especially when the building is air-conditioned. Lower outdoor temperatures during fall and winter would logically lower the intensity of crawlspace mois-ture sources.
Walls• High moisture contents in walls may occur in response
to rainwater intrusion. Moisture content depends on the magnitude of leakage and the rate at which drying occurs.
• High moisture levels may occur in exterior wall sheathing in cold and marine climates during winter. Exfiltration of humid indoor air and diffusion of moisture through insulated wall cavities lacking effective air barriers and vapor retarders allow moisture to accumulate in the cold sheathing. The severity of this problem correlates with indoor humidity levels maintained during winter.
• In cold and marine climates, sheathing usually dries dur-ing the spring and reaches a minimum moisture content during the summer, unless excessive rainwater intrudes. However, in some cases, design or construction of the wall prevents effective drying.
• In cold and marine climates, framing members in insu-lated walls generally do not accumulate as much moisture as does exterior sheathing. During winter, the cold sides of framing members tend to be wetter than the warm sides for the reasons discussed above. Drying usually occurs in spring and summer.
• In hot-humid climates, the significant moisture transport mechanisms (besides rainwater intrusion) are infiltration of humid outdoor air and inward diffusion of water vapor through wall cavities lacking effective air barriers and (exterior) vapor retarders, the opposite of cold climates in winter. In addition, solar radiation can drive moisture from exterior sheathing into the wall cavity. When a vapor retarder is placed on the interior (cold side) of an insu-lated wall cavity, condensation can occur on the vapor retarder.
• All studies that have investigated the effect of a ventilated space between the sheathing and cladding have found that this feature reduces moisture accumulation in the wall.
• When bottom plates are in direct contact with concrete slab foundations (no capillary break), moisture can be ab-sorbed by the bottom plate, resulting in moisture contents near 30%.
Roofs• High moisture contents in roofs may occur in response to
rainwater intrusion. Moisture content depends on the mag-nitude of the leakage and rate at which drying occurs.
• A trend of higher moisture content during winter and lower moisture content during summer has been observed
in roof framing and sheathing in all studies in which sea-sonal trends were investigated. Higher moisture contents have generally been found in sheathing than in rafters or trusses.
• Wintertime moisture accumulation in roof members is worse when indoor humidity levels are high and solar gain is low. The dominant moisture transport mechanism is likely exfiltration of humid indoor air through ceilings lacking effective air barriers. Ventilation of the attic space has not been a dependable method of controlling moisture levels in roofs when air leakage is significant.
Wood Decks• Untreated boards and pressure-treated boards without
water repellent additives exhibit large fluctuations in moisture content with weather. Water absorption occurs more rapidly when the wood surface is checked.
• Treating boards with a preservative and water repellent additive significantly dampens these fluctuations. The water repellency of certain treatments improves over time. Water repellents also minimize checking and cupping.
Permanent Wood Foundations• Moisture contents in permanent wood foundations are
generally higher below grade than above grade. Factors such as site drainage, soil conditions, and the presence of a protective film may affect the moisture levels.
ii
Review of In-Service Moisture and Temperature Conditions in Wood-Frame BuildingsSamuel V. Glass, Research Physical ScientistAnton TenWolde, Research PhysicistForest Products Laboratory, Madison, Wisconsin
1 IntroductionThe purpose of this literature review is to compile available information about in-service moisture and temperature con-ditions in wood framing and sheathing members in floors, walls, and roofs of buildings. In addition, limited informa-tion about conditions in exposed wood decks and perma-nent wood foundations is included. Moisture content and temperature can affect the durability of wood members and metal fasteners: high moisture content and high temperature can be conducive to fastener corrosion, especially in preser-vative-treated wood (Zelinka and Rammer 2005a,b). Before presenting information on moisture and temperature condi-tions, we first discuss the scope of this review, moisture-re-lated properties of wood, the role that climate plays in build-ing design and construction, and instrumentation typically used for measuring temperature and wood moisture content.
1.1 ScopeIn-service moisture and temperature conditions that any given wood member of a building experiences depend on many complicated factors. In this review, we aim to respect this complexity while presenting the information as simply as possible. Results are reported from a variety of sources, including surveys of large samples of buildings, field experi-ments with a smaller group of buildings, forensic investiga-tions of moisture damage, and controlled studies of different types of wood-frame construction, usually in test structures built specifically for research. Because the data reported in the literature may not be statistically representative of all wood-frame buildings, whether a bias exists towards either higher or lower moisture contents cannot be determined. However, the studies include common construction found throughout North America, and the data therefore represent conditions that can occur. We choose to exclude extreme conditions that result from catastrophic events such as hur-ricanes and floods. Although plumbing leaks are fairly com-mon—one survey of a thousand houses throughout the Unit-ed States found the occurrence of such leaks to be between 10% and 30% of all houses at the time of inspection (Moses and Scheffer 1962)—we choose to exclude major plumbing leaks from this review.
1.2 Moisture-Related Properties of WoodMoisture content (MC) is defined as the ratio of the mass of water in a given volume of wood to the oven-dry mass of
the same volume of wood, usually expressed as a percent-age. A number of properties of wood depend on moisture content, such as density, dimensional shrinkage and swell-ing, strength, thermal properties, and electrical properties (see FPL 1999). Water can exist in wood as liquid (free wa-ter) or vapor in cell lumens (cavities) or as water absorbed by the cell walls (bound water). Conceptually, the fiber saturation point is defined as the moisture content at which cell walls are completely saturated (all bound water) but no liquid water exists in the cell lumens; the fiber saturation point of wood averages approximately 30% MC but can vary by several percentage points in individual species and individual pieces of wood (FPL 1999).
Below the fiber saturation point, the moisture content of wood depends on both the relative humidity (RH) and tem-perature of the surrounding air. Figure 1 relates equilibrium moisture content (EMC) of wood to relative humidity for several selected temperatures, based on equation (3-3) in the Wood Handbook (FPL 1999). Such a plot is called a sorption isotherm. At RH values between 20% and 80%, the EMC of wood at 70°F (21°C) ranges from 4.5% to 16%. There is a slight temperature dependence, such that EMC changes by less than 1% MC for a 30°F (17°C) change
Figure 1—Wood equilibrium moisture content as a func-tion of relative humidity for select temperatures (based on FPL 1999).
2
General Technical Report FPL–GTR–174
in temperature. The Wood Handbook (FPL 1999) also lists calculated EMC values for wood exposed to the outdoor atmosphere (protected from sun and rain) in several U.S. locations, determined from monthly average relative humid-ity and temperature data. The values range from a low of 4% (Las Vegas, Nevada, in June) to a high of 18% (Juneau, Alaska, from September to December, and Missoula, Mon-tana, in December).
Wood in service, however, is rarely in moisture equilibrium, being exposed to both long-term (seasonal) and short-term (daily) changes in relative humidity and temperature of the surrounding air and is thus continually undergoing slight changes in moisture content. Short-term fluctuations in air temperature and relative humidity tend to influence only the wood surface. On the other hand, contact with liquid water can rapidly increase the moisture content above fiber saturation, and it can take a long time for wet wood to dry to its EMC. Nevertheless, the Wood Handbook (FPL 1999) recommends that exterior sheathing and siding be installed with an average MC of 12% (allowing a range of 7–14%) for most areas of the United States. Softwood lumber in-tended for framing may be air-dried or kiln-dried to a MC of 19% or less (FPL 1999).
A number of the studies cited in this review refer to mold and decay. The growth of decay fungi in wood requires several conditions: favorable temperature (~50–95°F (10–35°C)); a supply of oxygen; adequate moisture (neither too little nor too much); and a suitable food supply, such as wood cell walls (FPL 1999). The wood moisture content needs to exceed the fiber saturation point for decay fungi to propagate, and at MCs below 20% their development is completely inhibited; traditionally, the guideline for protec-tion of wood and wood products from decay has been to keep the moisture content below 20% (Carll and Highley 1999). Scheffer (1971) developed an index based on month-ly climatic data (mean temperature and number of days with precipitation) to estimate the relative potential at different locales for decay propagation in above-ground wood assem-blies that are fully or semi-exposed to weather. While molds require a similar temperature range to that of decay fungi, they can propagate on surfaces without free water, provided the surface RH remains near 80% (International Energy Agency 1991).
1.3 Role of ClimateIn this review, we attempt to summarize in-service moisture and temperature conditions in a simple, rational format. We therefore draw attention here to major factors that af-fect the flow of heat and moisture in buildings (Straube and Burnett 2005). Exterior climate is the first major factor to consider. Figure 2 depicts various ways in which moisture can be transported between the exterior environment and the building and among various parts of the building. The various spaces within a building (living space, crawlspace or basement, and attic) are not isolated from each other or from
the building envelope components—walls, roof, and foun-dation. Moisture migration can occur through three distinct pathways:
1. Intrusion of liquid water into buildings has the potential to carry the largest quantity of moisture (Carll 2000, Christian 1994, Verrall and Amburgey 1980). This could occur through leaks in roofs; leaks in walls due to wet-ting by wind-driven rain, seepage at and around roof edges, or splash from the ground; poor detailing around windows and doors; leaks into the basement or crawl-space due to poor site drainage; or capillary transport (wicking) in porous material such as brick, concrete, and wood.
2. Water vapor can be transported by the flow of air (con-vection) through vents or unintended leaks in the build-ing. For example, venting of crawlspaces and attics is commonly used as a strategy to remove excess moisture; however, under certain conditions, venting can have the opposite effect and actually introduce moisture into the building. Examples of unintentional air flow include leakage around penetrations in walls or ceilings, such as electrical outlets, windows, doors, light fixtures, and pipes.
3. Water vapor can migrate by diffusion through materi-als from regions of high to low concentration. Although vapor diffusion usually is negligible in comparison to liquid water intrusion and air leakage, it can be signifi-cant when interior and exterior conditions differ greatly, such as during the winter in cold climates and during the summer in hot-humid climates.
Figure 2—Depiction of the interactions of various parts of a building and the exterior environment. Pathways for moisture transport include liquid water flow by gravity, wind pressure, diffusion, and capillary suction and water vapor migration by air flow and vapor diffusion.
3
Review of In-Service Moisture and Temperature Conditions in Wood-Frame Buildings
Wetting can occur through any of these three mechanisms. Drying can occur by air flow and vapor diffusion. Liquid transport can contribute to drying in the sense of redistribu-tion of moisture from a wet region over a larger volume.
Major factors that affect flow of heat and moisture in build-ings include the following:
• Building orientation and exposure to exterior conditions• Building envelope and material characteristics
o Susceptibility to wetting by intrusion of liquid water, air leakage, and vapor diffusion
o Ability to store and dissipate intruding watero Air exchange rateo Water vapor permeanceo Drying potentialo Thermal resistanceo Solar absorptance and surface emissivity of roof
• Building operation and interior environmental loadso Heating/coolingo Humidification/dehumidificationo Ventilationo Other interior moisture sources
Given the importance of climate to thermal and moisture transport in buildings, we organize this review according to a recent classification of the climatic regions of North America (Lstiburek 2006a) (Figure 3, Table 1). A number of other similar classifications are given by Straube and Burnett (2005). Measurements of moisture and temperature conditions are reported for most climatic regions; however, due to lack of data, we have omitted the Subarctic/Arctic, Mixed-Dry, and Hot-Dry climates.
1.4 Instrumentation for Measuring Wood Moisture Content and TemperatureTechniques for measuring moisture in buildings have been reviewed by TenWolde and Courville (1985), James (1988), Derome et al. (2001), Straube et al. (2002), and Healy (2003). The most commonly used techniques are based on electrical resistance, electrical capacitance, and gravimetric analysis.
Electrical resistance moisture meters are the most com-monly used method in the studies reported here. This tech-nique is based on the principle that the resistivity of wood decreases with increasing moisture content. A simple direct current (DC) circuit is established when two pins or probes are inserted into a wood specimen. The probes can be in-sulated with only the tips exposed so that moisture content can be measured at various depths. This technique can be
implemented with hand-held meters or with numerous pins wired to a central data acquisition system. Accuracy is typi-cally within a few percentage points in the range 6–30% MC, with better accuracy at lower moisture content. When the wood moisture content is above 30%, “only approxi-mate qualitative readings may be obtained” (James 1988). The measured resistance also depends on temperature and wood species, so these need to be factored in to determine moisture content. For an increase of 20°F (11°C), resistance decreases such that the moisture content reading should be corrected to roughly 1% MC lower (James 1988).
A variation on moisture measurement by DC resistance is the “matchstick” sensor (or probe) developed by Duff (1966). By virtue of their compact size, these sensors can be individually calibrated with relative ease, thereby per-mitting accuracies of roughly ±1% MC. The sensors’ small size, combined with the fact that they are composed largely of wood, means that they are, relative to other types of sen-sors, non-disruptive of conditions within wood members or within assemblies of interest. This probe can alternatively be used to monitor relative humidity at specific locations within assemblies where wood may not be present, such as within a layer of glass fiber insulation or against a polyeth-ylene vapor retarder (Sherwood 1985, TenWolde and Mei 1986), or where the measurement location is at the surface of a material whose sorption isotherm may differ from that of wood (TenWolde et al. 1995). When used to monitor rela-tive humidity, the sensor readings are influenced by sorption hysteresis (Carll and TenWolde 1996).
Figure 3—Climatic regions of North America (Lstiburek 2006a). Used with permission of Building Science Cor-poration, Westford, Massachusetts.
4
General Technical Report FPL–GTR–174
Another technique based on the electrical properties of wood involves measuring the capacitance, which increases with moisture content. Hand-held meters based on this prin-ciple typically consist of two pads that are placed against a surface. Because the accuracy of these sensors varies and the moisture content is averaged over a large area, this tech-nique is most useful for detecting high moisture contents and water leaks.
Gravimetric analysis requires a comparison of the weight of a specimen before and after ovendrying. In practice, this technique is executed either by cutting out a specimen from the wood member for analysis or by inserting a plug that will later be removed. Although this method is very accu-rate, it has several drawbacks. First, it is inherently destruc-tive; the wood member of interest is necessarily damaged. This method cannot be used for wood members that are enclosed within an assembly unless the assembly is opened. Second, it is labor intensive, which limits the frequency and extent of data collection. Third, when a plug is used, there is uncertainty about whether the plug represents the moisture content of the surrounding material due to the lack of con-tinuity and possible changes in the moisture behavior of the wood member due to the plug.
Temperature measurement is fairly straightforward. Simple sensors such as thermocouples, thermistors, and resistance
temperature devices can be incorporated into hand-held dig-ital devices or data acquisition systems to give readings with accuracies as good as ±0.5°F (±0.3°C). Hand-held non-con-tact infrared thermometers may be accurate to ±2°F (±1°C). Although temperatures are reported in some studies cited below, most of the studies use the measured temperatures for correcting moisture content readings but unfortunately do not report the actual measured temperatures. In addition, the air temperature is reported in some cases rather than the actual wood member temperature.
2 Floor Members over Basement and Crawlspace FoundationsIn this section we discuss measurements of wood moisture content and temperature in floor structural members such as sill plates, joists, beams, and subfloor sheathing. Several factors influence these conditions: climate, quality of site drainage, interior conditions (such as heating and cooling), and the presence and location of insulation. For crawlspaces in particular, the presence of a ground cover (vapor diffu-sion retarder) and whether the space is vented with outdoor air or sealed from the exterior may have a large effect. In addition, moisture and temperature conditions may depend on the proximity of the floor members to the perimeter of the foundation. Rose and TenWolde (1994) summarized the 1
Table 1—Climatic regions with defining temperature and moisture criteria (Lstiburek 2006a)a
Designation Temperature criteria Moisture criteria Hot-humid Winter mean monthly temperature
remains above 45°F (7°C) Annual precipitation > 20 in. (0.5 m)
Hot-dry Winter mean monthly temp. remains above 45°F (7°C)
Annual precipitation < 20 in. (0.5 m)
Mixed-dry (1) HDDF < 5400 (HDDC < 3000); and (2) winter mean monthly temp. drops below 45°F (7°C)
Annual precipitation < 20 in. (0.5 m)
Marine (1) Coldest month mean temp. between 27°F (–3°C) and 65°F (18°C); (2) warmest month mean temp. below 72°F (22°C); and (3) at least 4 months with mean temp. over 50°F (10°C)
Dry season in summer; the month with heaviest precipitation in the cold season has at least three times as much precipitation as the month with least precipitation
Subarctic/arctic HDDF ≥ 12,600 (HDDC ≥ 7000) a The climatic definitions given in Table 1 are the same as those adopted by the U.S. Department of Energy’s Building America Program (http://www.eere.energy.gov/buildings/building_america/climate_zones.html). b Heating degree days, 65°F basis. The number of heating degree days is equivalent to the difference between the baseline temperature (65°F) and the mean daily temperature summed over all the days of the year for which the mean daily temperature is less than the baseline temperature. c Heating degree days, 18°C basis.
5
Review of In-Service Moisture and Temperature Conditions in Wood-Frame Buildings
main issues in crawlspace design and construction. As noted by Rose (1993, 1994, 2001) from a historical perspective, moisture problems have been associated with crawlspaces since the 1940s (Britton 1948). A substantial body of work has since been published toward understanding and solving these problems. More of the literature in this section there-fore deals with crawlspaces than with basements.
2.1 Hot-Humid ClimateDiller (1953) investigated the effects of soil cover and ven-tilation on crawlspace moisture in groups of four houses in seven locations throughout the United States, including North Charleston, South Carolina. The studies were con-ducted from 1948 to 1951. In two of the four houses in each location, the crawlspaces were covered with 55-lb (2.5-kg/m2) roll roofing;1 one was vented with 10% of the “2 + 1/3” formula,2 and the other was without ventilation. In the two houses with uncovered crawlspaces, one was vented with 100% of this formula, and the other was without ven-tilation. In many cases, however, the occupants altered the vents, typically closing them in the winter. Diller remarked that in about 90% of all houses in the study, the fundamen-tal causes of crawlspace moisture were “improper grading around the house, the absence of gutters and downspouts, and ineffective splash boards, all leading to the accumula-tion of water in the crawl spaces.” The houses in North Charleston were built on continuous cinder block founda-tions, with an average of 27 in. (0.69 m) of clearance in the crawlspace. The soil was sandy with a high water table.
Wood moisture contents were measured periodically with a resistance-type meter in sill plates at each of the four corners and in a central girder. The covered crawlspaces had aver-age MCs between 15% and 20%, with ventilation having no significant effect. In the uncovered crawlspaces (both vented and nonvented), moisture contents ranged from 20% during summer to peaks of over ~40%3 during the winter.
Moses and Scheffer (1962) measured wood moisture con-tents in a thousand houses in various U.S. climate regions with the purpose of locating conditions that would make wood members susceptible to decay. Given the large number of measurements, conditions were monitored only once for each house, and therefore meaningful seasonal trends could not be inferred from the data. A resistance-type moisture meter was used; readings were not corrected for temperature because only a rough estimate of moisture content was de-sired to detect critical wetness.
In houses with crawlspaces in the southeastern United States, Moses and Scheffer (1962) found that up to 20% of
�The weights of roll roofing cited here and elsewhere in this report are based on an area of 108 ft2 (10 m2).�The recommendation at the time by the Housing and Home Finance Agency was that crawlspace vents should have a net unobstructed area equal to 2 ft2 for each 100 ft of wall perimeter, plus 1/3 ft2 for each 100 ft2 of crawlspace area.�MC readings above 30% by electrical resistance are approximate (see Section 1.4).
the houses monitored between August and October had average wood moisture contents in the range of 20–30%. The majority of houses had average MC values between 12% and 20%. These averages represent measurements in floor joists, rim joists, edge joists, and sill plates. The re-sults were grouped by crawlspaces with dry soil, those with covered damp soil and good ventilation, and those with uncovered damp soil and poor ventilation. The correspond-ing percentages of moisture content readings in the 20–30% range for crawlspaces in each category were 8%, 17%, and 20%, respectively. Unfortunately, because the presence of a ground vapor retarder and ventilation were lumped in this study, their separate effects cannot be ascertained. In contrast, measurements in the Gulf Coast region between October and December found no crawlspaces with average wood moisture content above 20%. This difference between the Southeast and the Gulf Coast regions likely has less to do with geographical location than with the time of year in which readings were taken. Measurements in houses with basements were also reported for wood members that were close to the basement walls. All the houses with basements in the southeastern United States (August–October) had an average MC below 20%.
Verrall (1962) conducted a survey of air-conditioned build-ings throughout the hot-humid region including residences, office buildings, and commercial buildings. Locations in-cluded Corpus Christi, Kingsville, and Orange, Texas; New Orleans, Louisiana; Gulfport, Mississippi; Pensacola, Jack-sonville, and Key West, Florida; Brunswick, Georgia; and Charleston, South Carolina. Wood decay in floor members was noted in many instances and was usually linked to wet (uncovered) soil in crawlspaces, continuous air- conditioning, or low indoor temperatures (≤70°F (21°C)).
Moisture contents were measured mainly in subflooring with a resistance-type meter. Readings were reported for a New Orleans clubhouse built with wood-frame construction over a wet crawlspace with poor ventilation. Large areas of the floor needed replacement. The crawlspace soil was then covered with 55-lb (2.5-kg/m2) roll roofing and blowers were installed to hasten drying, but subfloor MCs remained relatively high at 21–22% (values prior to these were not reported). The air in the crawlspace was at 80–87°F (27–31°C) and 70–80% RH. Eventually the crawlspace vents were closed and dehumidifiers were installed to keep the RH below 70% and the dew point temperature below 70°F (21°C).
Verrall (1962) also reported results from an investigation of an office building in Saucier, Mississippi. This wood-frame building had an open pier foundation with a solid brick wall on one side. The soil was dry and dusty. A window air-con-ditioning unit was installed in a room with dimensions 7.5 by 13 by 8 ft (2.3 by 4.0 by 2.4 m). Pins for resistance mois-ture content measurements were installed in the subflooring. One section of the floor (between joists) was insulated with
6
General Technical Report FPL–GTR–174
glass-wool blanket insulation with an aluminum foil vapor retarder on the under side. The subfloor MC was 11% prior to installation of the vapor retarder. Readings were taken pe-riodically between mid-June and mid-September. Although conditions were extreme—the indoor temperature was de-creased to 60°F (16°C), the outdoor dew point was 70–75°F (21–24°C) for most of the time, and rain fell on 57% of the days during the experiment—the subfloor moisture content in the section with the insulation and vapor retarder re-mained at 10–12% MC next to the joists and 12–14% MC midway between the joists. However, in the floor section without the vapor retarder, the subfloor moisture content gradually rose to a peak of 30% between the joists and 24% adjacent to the joists.
Choong and Cassens (1985) studied the effects of soil cover and ventilation in three adjacent houses with pier-and-beam foundations in the (levied) flood plain of the Mississippi River in Baton Rouge, Louisiana. The houses were 3 ft (0.9 m) off the ground, and only the front of the crawlspace of each house was enclosed (partially so) with mortared brick, leaving the under-floor area mostly open. House A had open vents in the brick stem wall and 100% of the crawlspace covered with 6-mil (0.15-mm) polyethylene. The vents in House B were partially blocked with hardboard and shrubbery, and the ground was 50% covered. House C had open vents and no soil cover. No insulation was present be-tween floor joists in any of the houses. Moisture content was measured periodically over 18 months with a resistance-type meter in 10 samples of southern pine blocking, 1 by 3 by 6 in. (25 by 75 by 150 mm), attached to the subflooring at various places under each house. The report did not mention whether the houses were air-conditioned during the summer months.
Average moisture contents among the three houses were generally not significantly different. Average values ranged from minima of 8–10% MC to maxima of 16–20% MC. Many fluctuations (probably due to periods of wet and dry weather) were evident, with no discernable seasonal trend. The lack of differences in average moisture contents implies that evaporation of water from the soil was not a major source of moisture in these crawlspaces, likely because they were well ventilated, being enclosed only on the front side. However, when all individual data points were considered (as opposed to averages), maximum values for the three houses were 20% (A), 24% (B), and 25% (C). These differ-ences in maximum moisture contents imply that localized extremes may result when a ground cover is absent.4 The times of year when these maximum moisture contents oc-curred were not reported.
Recently, Advanced Energy (2005a,b) conducted a survey of 45 houses with wall-vented crawlspaces in North Carolina,
�If individual maximum moisture contents occurred during summer months and if the houses were air-conditioned, then the differences in moisture content may have been an artifact of different thermostat settings rather than a result of the presence or absence of a ground cover.
including 22 houses in coastal New Hanover County in the hot-humid climatic region. The remaining houses were in Durham, Wayne, and Wilson counties in the piedmont re-gion (mixed-humid climate), but the results generally were pooled and not classified by county. The houses represented a variety of construction types and ranged in age from 2 to 60 years. Almost all had heating, ventilating, and air-condi-tioning (HVAC) ducts located in the crawlspace. Although about 75% of the crawlspaces had a polyethylene vapor retarder covering the ground, in most cases it covered less than 80% of the floor area. Vents in the crawlspace founda-tion walls were fully open in 67% of the houses, partially open in 27%, and closed in 7%.
Crawlspace inspections and wood moisture content and temperature measurements were made between July and December 2004. Moisture contents and wood surface tem-peratures were recorded at 10–12 locations within each crawlspace using a resistance-type meter and a non-contact thermometer. These locations included the sill plate and rim joist next to the crawlspace access; the floor joist above and below insulation next to the access; the sill plate, rim joist, and floor joist above and below insulation at what was judged to be potentially the worst location;5 the center floor joist above and below insulation; the center beam; the subflooring in the middle of the floor; and any other loca-tions where moisture or mold appeared to be significant. In addition to single-point temperature and relative humidity measurements at each site visit, data loggers were attached to floor framing in a central location in each crawlspace for long-term monitoring.
Specific wood moisture contents were not given; instead, proportions of the readings that exceeded specified mois-ture levels were reported. Values exceeding the range of the moisture meter were found (>30% MC). Furthermore, 36% of all houses had at least one reading of 25% MC or higher, and 67% of all houses had at least one reading of 19% MC or higher. Table 2 provides further details of the moisture content readings for the various wood members. Several other observations relating to moisture were reported. Sixty-two percent of the crawlspaces had visible mold growth, and 47% had visible wood decay in floor members. About half the houses with decayed wood also had plumbing leaks. Other signs of moisture damage included discoloration and efflorescence on foundation walls. Water puddles on top of the polyethylene were found in 42% of the crawlspaces that had ground covers. In 16% of the crawlspaces, a clothes dryer was vented into the crawlspace rather than ducted to the outside.
Air temperature and relative humidity measurements ac-quired over a period of 11 months showed that during the summer months, outdoor air contained more moisture than
�This was often the location of least clearance between the ground and the floor framing, though other locations were selected, such as near vents or near the center beam.
7
Review of In-Service Moisture and Temperature Conditions in Wood-Frame Buildings
crawlspace air. Furthermore, crawlspace air temperatures (dry-bulb) often were below outdoor dew point tempera-tures. This means that when humid outdoor air entered the vented crawlspace, moisture could condense on surfaces with temperatures at or below the dew point. Measured crawlspace RH values ranged from 40% to 100%. Nearly all the crawlspace RH readings exceeded 70% during June, July, and August (except in a few crawlspaces with dehu-midifiers).
The study also measured pressure differentials, airflows, and effective leakage areas (ELAs) between the crawlspace and living space. The ELAs were on the order of 0.5 ft2 (0.05 m2), and for the majority of houses sampled, crawl-space-to-house air leakage represented 11–30% of the total house air leakage. Natural stack effect pressures and me-chanical HVAC systems caused airflow through the holes in the floor.
2.2 Mixed-Humid ClimateDiller (1946, 1950) measured moisture contents in crawl-spaces of four government-built houses in Washington, D.C., between 1942 and 1950. The houses were built in 1941 on concrete piers averaging 30 in. (0.8 m) in height. There was no foundation wall, but 1/4-in. (6-mm) mineral board skirting was placed against the outside of the build-ing, extending down into the soil. Vents were cut at regular intervals, but the vent area was less than recommended at the time. Occupants usually closed the vents during winter, and in some instances did not reopen them in spring. The
combination of clay soil and poor drainage resulted in stand-ing water in the crawlspaces after rain.
Moisture contents were measured in sill plates and floor joists at 25–45 locations under each house with a resistance-type meter at intervals of 1 to 4 months. After the first year of measurements, the soil under the two wettest houses, designated FP 5 and FP 15, was covered with 55- and 90-lb (2.5- and 4.1-kg/m2) roll roofing, respectively. The wood moisture contents in these two houses dropped significantly over a period of less than 6 months. For the subsequent 7 years, the two houses with covered soil remained below 20% MC, with average values between 12% and 18% MC, whereas in the year prior to application of the soil covers they had averaged around 25% MC. Condensation on fram-ing members was never observed with the soil covers in place. In contrast, the two houses without soil covers had wood MCs ranging from ~20% in summer to ~35%6 in winter, with the MCs exceeding 30% each winter. In these two houses, heavy condensation was evident on the sill plates and floor joists near exterior walls from November through May. This was the first observation of a seasonal trend where moisture levels reached a maximum in winter and minimum in summer. Differences in ventilation of the crawlspaces were usually negligible; opening and closing the vents had relatively little influence on the wood mois-ture contents. No significant difference in effectiveness was found between the two weights of roll roofing.
Diller (1953) also reported similar measurements with groups of four houses in seven U.S. locations, including Washington, D.C., Philadelphia, Pennsylvania, and Oak Ridge, Tennessee, in the mixed-humid climatic region. The studies were conducted as described in Section 2.1, examin-ing the various combinations of soil covers and ventilation.
The houses in Washington, D.C., (different from those dis-cussed above) were built on cement block piers with mineral board skirting placed against the outside. The floors were insulated, and the average crawlspace clearance was 20 in. (0.5 m). In the houses with soil covers, the average moisture contents were in the 10–15% range, with no significant dif-ference between the vented and unvented crawlspaces. The uncovered, unvented crawlspace had winter peaks between 20% and 30% MC, but the uncovered, vented crawlspace remained in the 15–20% MC range.
The Philadelphia houses were built on untreated oak piers, with mineral board skirting. The floors were insulated, and the average crawlspace clearance was 16 in. (0.4 m). Cov-ered crawlspaces had average MCs ranging from ~10% to ~15%, similar to those in Washington. The uncovered, un-vented crawlspace had winter peaks over 30% MC and one peak as high ~50% MC.6 In the uncovered crawlspace with full ventilation, the MC stayed just below 20% until
�MC readings above 30% by electrical resistance are approximate (see Section 1.4).2
Table 2—Proportion of moisture content measurements in wood floor members in North Carolina crawlspaces above 19% and 25% MC (Advanced Energy 2005a) Percentage of MC readings
Wood member/location MC ≥ 19% MC ≥ 25%
Sill plate (access) 16 0 Rim joist (access) 11 0 Floor joist (access, below insulation) 24 0 Floor joist (access, above insulation) 8 0 Center joist (below insulation) 40 9 Center joist (above insulation) 12 6 Sill plate (worst) 32 3 Rim joist (worst) 30 9 Floor joist (worst, below insulation) 47 16 Floor joist (worst, above insulation) 29 9 Subflooring 30 16 Other (worst)a 59 28 Total of all locations 28 8 a This was often the location of least clearance between the ground and the
floor framing, though other locations were selected, such as near vents or near the center beam.
Table 3—Summary of reported moisture contents of wood floor members in New Jersey crawlspaces (Dutt and others 1988)
Group Groundcover
Wall insulation Vents
Range of maximum MC (%)
Average maximum MC (%)
Average minimum MC (%)
1 Yes Yes Closed 12–17 14 10 2 Yes Yes Open 12–17 15 11 3 No No Open 13–25 19 15
Table 4—Summary of reported average moisture contents of floor joists and rim joists and air temperatures in southern New Jersey crawlspaces (Stiles and Custer 1994)
Moisture content (%) Air temperature (°F (°C))
Group Houses Fall Winter Spring Summer Fall Winter Spring Summer
Control 7 15–19 8.5–15 12–14 15–19 68–74(20–23)
54–59(12–15)
58(14)
72(22)
Moisturebarrier 5 14–20 8–12 9–11 12–16 69–71
(21–22)60–62
(16–17)62
(17)71–72(22)
Fulltreatment 5 15–21 9–13 10–13 12–17 68–71
(20-22)56–61(13-16)
60(16)
68–71(20–22)
8
General Technical Report FPL–GTR–174
February, when the occupants closed the vents; the MC then rose to ~25%, but dried out in the spring. Summer moisture contents for the uncovered crawlspaces were similar to those for the covered crawlspaces, with values near ~15%.
The houses in Oak Ridge, Tennessee, had a continuous ce-ment block foundation, with an average of 23 in. (0.6 m) of crawlspace clearance. The floors were not insulated. The building site was sloped, allowing water to seep through the foundation walls and wet the soil under the houses. Results were similar to those for the Washington and Philadelphia houses. Covered crawlspaces had average MCs in the 10–16% range. The uncovered crawlspace without ventila-tion had winter peaks around 30% MC, but the uncovered, vented crawlspace remained in the 15–20% MC range.
Moses and Scheffer (1962) surveyed houses in Baltimore, Maryland (August), and Memphis, Tennessee (January). For houses with crawlspaces, none of those in Baltimore had average moisture contents above 20%. In Memphis, the percentage of readings in the 20–30% MC range were as follows: crawlspaces with dry soil, 9%; those with covered damp soil and good ventilation, 8%; and those with uncov-ered damp soil and poor ventilation, 17%. For Baltimore houses with basements, the percentages in this range were as follows: floor joists, 5%; rim joists, edge joists, or sill plates on basement walls, 5%.
Amburgey and French (1970) monitored conditions in two adjacent houses with crawlspaces in Raleigh, North Caro-lina, to determine the extent to which a soil cover could aid in reducing wood moisture contents. Both were single-story, air-conditioned houses on well-drained lots. The crawl-space in house A was 2 to 2.5 ft (0.6 to 0.8 m) high with vents blocked by dense shrubbery. Insulation was installed between floor joists, many of which were covered with fungus. A heating/air-conditioning unit was located in the crawlspace. House B had a 3- to 4-ft (0.9- to 1.2-m) high crawlspace with unblocked vents and without insulation. There was no obvious mold growing on the joists or sub-flooring. The heating/air-conditioning unit was not located in the crawlspace. The vents in both houses remained open year-round.
Moisture content was measured periodically with a resis-tance-type meter in the subflooring, floor joists, and sill plates. In addition, wooden blocks were placed near some sampling points in house A; moisture meter readings for these blocks were checked gravimetrically. House A was monitored at 22 sampling points from November 1965 to January 1967; a 6-mil (0.15-mm) polyethylene ground cover was installed over 70% of the crawlspace in November 1966. House B was monitored at 38 sampling points from June 1966 to January 1967, and a soil cover was installed over 100% of the crawlspace in August 1966.
Measurements revealed a seasonal trend, where moisture levels reached a maximum in summer and a minimum in winter. As is seen in many other studies that follow, this
trend has been widely observed. The average moisture content of the floor joists and sill plates of house A varied between 14% during winter and 19% during summer, prior to installation of the soil cover. Individual sampling points ranged from 11% to 22%. After the soil cover was applied, average MC dropped to 10% during the second winter. Most sampling points were in the 9–11% range, with a maximum of 14%. Thus, on average the soil cover reduced moisture content of the wood members in the crawlspace by 3–4% (assuming the drop was not caused by other factors such as differences in weather). In house B, summer average MC of the subflooring, floor joists, and sill plates was between 14% and 17% without the soil cover. Following the installation of the soil cover, average MC decreased steadily through the fall and reached a minimum of 8.5% in winter. Because no measurements were taken the previous winter (before the soil cover was applied), it could not be determined whether the soil cover had any effect on moisture conditions in house B.
In two separate studies using a test house near Athens, Georgia, Duff (1978, 1980) monitored moisture conditions in floor assemblies over a crawlspace. Moisture content was measured with sensors designed by Duff (1966) in plywood subflooring and floor joists in an 8- by 24-ft (2.4- by 7.3-m) section of the house with the crawlspace. The height of the crawlspace ranged from 29 in. to 33 in. (0.74 to 0.84 m) from the soil to the bottom of the floor joists. Temperature inside the house was kept at 75°F ± 5°F (24°C ± 3°C). In-terior relative humidity was maintained at 30% ± 5% dur-ing the winter and was not controlled during the summer, though dehumidification was provided by a window heat pump, which typically kept the RH below 70%.
In the initial 2-year study, Duff (1978) investigated the ef-fects of several different types of construction on wood moisture content, relative humidity, and temperature within the crawlspace. Direct comparisons were drawn between cavities with and without insulation, with and without a va-por retarder, and with a vapor retarder placed above insula-tion and below the insulation. For the first year of the study, the soil was covered with 6-mil (0.15-mm) polyethylene and the vents were closed; during the second year, the soil cover was removed and the vents were opened.
We designate the baseline case to be the cavity without in-sulation and without a vapor retarder during the first year (vents closed, soil covered). The floor joist MC peaked at ~20% in August but stayed around 12–15% during fall, winter, and spring. The plywood subflooring also peaked in August at ~18% MC, with values between 10% and 15% the rest of the year. Removing the ground cover and open-ing the vents actually made little difference, aside from the initial release of moisture that had been contained under the ground cover. The MC of floor joists and subflooring peaked at ~20% in July; for the rest of the second year, the floor joists varied between 13% and 17% and the subflooring be-tween 10% and 14%.
9
Review of In-Service Moisture and Temperature Conditions in Wood-Frame Buildings
A polyethylene vapor retarder placed under the uninsulated plywood subflooring had a significant effect on reducing the flow of moisture into the subflooring. The MC stayed at ~9–12% through both years of the study (with vents closed and soil covered and with vents open and soil un-covered). Insulating the floor of the crawlspace with 4-in.- (100-mm-) thick fiberglass batts between the joists (without a vapor retarder) did not have a significant effect on wood moisture contents: in both years of the study, the floor joists and plywood subflooring peaked at ~18–20% MC in late summer, similar to the baseline case. However, the subfloor-ing temperature stayed about 10°F (6°C) warmer in winter when it was insulated. When the floor was insulated and a vapor retarder was placed directly under the joists, the mois-ture content of the joists remained at 10–12% throughout both years of the study. Similarly, when the vapor retarder was placed over the joists, the subflooring MC remained at 8–12% throughout both years.
In the second study, Duff (1980) investigated the effect of insulating the exterior walls of the crawlspace. The con-crete-block foundation walls were covered with sections of 3.5-in.- (90-mm-) thick fiberglass batt insulation, with the kraft paper facing the interior of the crawlspace. The vents in the foundation walls were sealed and caulked, and the access door was insulated and weather-stripped. For the first 22 months of the study, the ground was covered with 6-mil (0.15-mm) polyethylene; for the last 8 months, 10% of the ground cover was opened to expose the soil. During the first winter of the study, the moisture content of the floor joists and subflooring reached a minimum of 9–10%. The mois-ture content rose during the spring and summer and reached a maximum of 15% in the floor joists and 16% in the sub-flooring in September. These values are a few percentage points less than the baseline case in the initial study (Duff 1978). During the second winter, the floor members dried again to 9–10% MC. The polyethylene soil cover was then partially removed such that it covered 90% of the crawl-space area. Wood moisture contents rose rapidly the follow-ing spring; by August, floor joists peaked at 18% MC and subflooring at 17% MC.
Jennings and Moody (1983) reported the results of a survey of 36 houses in various locations in Tennessee that were investigated due to complaints of moisture-related problems following weatherization measures. Nearly 600,000 houses were surveyed, of which about half had received energy efficiency improvements. The 36 houses reported here ob-viously did not represent a statistically significant sample. Complaints were related both to excessive moisture (such as condensation, mold, mildew) and excessive drying (such as shrinkage, cracking). Moisture content ranges were re-ported based on 10 measurements in the wood substructure of each house. Of the 36 houses, 23 were constructed on crawlspace foundations, five had basement foundations, one had a basement combined with a crawlspace, one had a
crawlspace combined with a slab, and the remaining six had slab foundations. The houses on slab foundations by de-sign had no wood substructure; moisture measurements for these houses were not reported. In the houses on crawlspace foundations, wood substructure moisture contents ranged from 7% to 30%; in the houses on basement foundations, the corresponding range in moisture contents was from 8% to 15%. Visible moisture was reported in most of the crawl-space houses, typically on HVAC ducts and exterior walls, and in some cases on floor insulation or floor joists. Visible signs of fungal decay were also found in six of the houses with crawlspace foundations, typically on floor joists and subflooring. When signs of condensation were reported in houses with basement or slab foundations, they were usually on (above-grade) walls and ceilings.
Moody et al. (1983) (see also Jennings and Moody 1984) studied the effects on moisture and heat flux of insulating crawlspace walls and eliminating ventilation using four houses in Murfreesboro, Tennessee. The houses were in the same neighborhood, with the same general terrain, and of approximately the same size and age. One house (des-ignated Wyatt) was left uninsulated with no ground vapor retarder, while three were insulated with 2-in.- (50-mm-) thick foil-backed fiberglass (duct wrap) on the walls of the crawlspace. The ground and the foundation walls were cov-ered with 6-mil (0.15-mm) polyethylene (before insulation was applied). Two of the houses (including the Wyatt house) had ceiling radiant heating and central air conditioning with ducts in the crawlspace; two of the houses had air source heat pumps with ducts in the crawlspace. The moisture con-tent of the floor joists was measured with a resistance-type meter in four locations within each crawlspace on a weekly basis for a period of 10 months (January through October).
Prior to the installation of the polyethylene ground cover, the floor joists in all four houses had an average moisture content of 16% (December). Initially, the vents in the foun-dation walls were closed in all four houses. The houses with ground covers reached minimum MCs of 7–10% between February and April and maximum MCs of 13–14% between August and October (vents remained closed). The house without a ground cover (Wyatt) ranged from 14% MC in mid-winter (vents closed) to 18% MC in late summer (vents open during summer). This seasonal trend is in agreement with the findings of Amburgey and French (1970) and of Duff (1978, 1980). It was concluded that removing crawl-space ventilation did not adversely affect moisture condi-tions in the floor joists.
Moody et al. (1985) (see also Jennings and Moody 1984) continued to monitor three of these houses for an additional 2 years. The Wyatt house was left uninsulated for the first year; for the second year, the ground and walls were covered with polyethylene and the walls were insulated with 2-in.- (50-mm-) thick foil-backed fiberglass (duct wrap). The same seasonal trend was observed. For the first year, the floor
10
General Technical Report FPL–GTR–174
joists in the Wyatt house were between 14% and 18% MC and showed a slight decrease to 14–17% MC in the second year. The other two houses had floor joist moisture contents between 8% and 14%.
Dutt et al. (1988) conducted a field study of crawlspace moisture in 15 houses in a development in Toms River, New Jersey. The location is 8 miles from the ocean; with a high water table, the sandy soil was typically wet. Of the 15 houses, 6 received a major retrofit including 6-mil (0.15-mm) polyethylene covering the ground of the crawl-space to 1 ft (0.3 m) up the walls along with 1-in. (25-mm) extruded polystyrene glued to the walls over the polyethyl-ene. The foundation vents were sealed in three of these six houses, while the vents were left open in the other three. Periodic measurements of moisture content were taken with a resistance-type meter in floor joists, rim joists, and support beams. The study was carried out for 1 year; moisture con-tents were monitored every month for the first 3 months and then every other month after that.
A consistent seasonal trend was observed in all 15 houses: wood moisture content reached a maximum in July and a minimum in February, in agreement with the studies above. Larger variations were found in the houses without wall insulation and with open vents. When the results for vari-ous wood members (floor joists, rim joists, and beams) were pooled, the most striking difference was found between crawlspaces with a ground cover and those without a ground cover. The former (Groups 1 and 2 pooled) peaked at an average maximum MC of 14%, with an average minimum of 11%; the latter (Group 3) had an average maximum of 19% and an average minimum of 15%. The houses with a good ground cover were also those with insulated walls, so their individual effects could not be assessed. Results are presented with greater detail in Table 3.
Stiles and Custer (1994) conducted a similar study of crawl-space moisture in 17 single-family houses in southern New Jersey, also dividing the houses into three groups. The first group was left untreated (control). The second group had 6-mil (0.15-mm) polyethylene covering the ground and walls of the crawlspace. The third group had polyethylene on the ground and walls, fiberglass insulation on the walls, 1-in. (25-mm) extruded polystyrene covering the vents, and caulking at the rim. Moisture contents were measured periodically with a resistance-type meter at the rim joist, floor joist at a distance 1 ft (0.3 m) from the rim, and in the middle of the crawlspace (in at least three joists), above and below the insulation, if present. A baseline was established prior to any treatment of the crawlspaces (September), then six data sets were collected over a 9-month period that in-cluded winter, spring, and summer.
Average moisture contents for various locations and dates were reported for each group of crawlspaces, and the re-sults are summarized in Table 4. Individual values as high as ~32% MC were measured in two crawlspaces prior to
treatment. The same seasonal trend of high moisture con-tent in summer and low moisture content in winter was also observed here. When moisture contents were normalized by the control group and the initial conditions, it was found that the full treatment (polyethylene ground and wall cover, insulation, and caulking) reduced the floor joist moisture contents by 3–5% MC, whereas the polyethylene ground and wall cover alone reduced moisture contents by about half this amount. The moisture contents of the rim joists, however, were not significantly affected by either treatment. The authors also found, by using air pressurization tests to measure ELAs, that a strong correlation existed between moisture content and ELA of the crawlspace to the outside for the five crawlspaces that received the full treatment. This suggests that a significant source of moisture in the closed crawlspaces was the entry of humid air from the outside.
More recently, Davis and Dastur (2004) measured tem-perature, relative humidity, and wood moisture content in 12 identical houses in Princeville, North Carolina, over a 3-year period (see also Advanced Energy 2005c). The study was conducted in two phases, with three groups of houses in each phase. In the first phase, the control group had open foundation wall vents, 6-mil (0.15-mm) polyethylene ground cover, and R-19 floor insulation; in the first experi-ment group (EXP1), the vents were sealed, the ground and walls were covered with polyethylene, and the floor was left uninsulated; the second experiment group (EXP2) was the same as EXP1 except that R-3 rock wool insulation was placed on the walls. In the second phase of the study, air sealing was done on all 12 houses. In addition, R-19 floor insulation was added to the EXP1 group and the rock wool insulation in the EXP2 group was replaced with R-13 rigid foam insulation. Furthermore, in both experimental groups, 1 ft3/min (0.5 L/s) of HVAC supply air per 30 ft2 (3 m2) of floor area was introduced.
Moisture content measurements were taken periodically with a resistance-type meter. The MC values of the floor joists in the vented crawlspaces (control group) ranged from 9% in winter to 15% in late summer. In the closed crawlspaces (EXP1 and EXP2 groups), the floor joist MCs remained steady year-round between 9.5% and 11%. These differences in wood moisture content between vented and closed crawlspaces were attributed to differences in rela-tive humidity of the crawlspace air. The RH in the closed crawlspaces stayed below 60% most of the time, whereas in the vented crawlspaces it exceeded 80% for a significant amount of time during the humid summer months.
In addition to this controlled study, Advanced Energy (2005d) conducted a survey of 10 houses with wall-vented crawlspaces in the central Piedmont region (Chatham, Dur-ham, and Orange counties) of North Carolina. The study protocol was similar to that discussed in Section 2.1 (Ad-vanced Energy 2005a,b). The houses represented a variety of construction types and ranged in age from 2 to 9 years.
11
Review of In-Service Moisture and Temperature Conditions in Wood-Frame Buildings
All houses had HVAC ducts located in the crawlspace. Poly-ethylene ground covers were present in 7 of the 10 houses, with coverage ranging from 60% to 95% of crawlspace area. R-19 fiberglass batt insulation was installed in the joist cavi-ties and held in place with wires. Vents in the crawlspace foundation walls were fully open in nine of the houses.
Crawlspace inspections and wood moisture content and temperature measurements were made between June and September 2001. Moisture contents and wood surface tem-peratures were recorded at 10–12 locations within each crawlspace using a resistance-type meter and a non-contact thermometer, as described in Section 2.1. Table 5 lists the moisture content and surface temperature range for each wood member. In nine of the houses, the maximum moisture reading was located in a floor joist below the insulation, typically in the area of lowest clearance in the crawlspace.
All 10 crawlspaces had visible mold growing on the wood framing. Other signs of moisture damage included discolor-ation and efflorescence on the foundation walls. Water pud-dles on top of the polyethylene were present in three of the crawlspaces and condensation on pipes or ducts was found in six. The relative humidity of the crawlspace air varied from 73% to 88%, with an average of 79%. This study also measured airflows as discussed in Section 2.1 and found that air leakage from the crawlspace into the living space was significant.
2.3 Marine ClimateMoses and Scheffer (1962) surveyed houses in Southern California (March–April) and in Oregon and Washington (April–June). For houses with crawlspaces in Southern California, the percentages of moisture content readings in
the 20–30% range were as follows: crawlspaces with dry soil, 2%; those with covered damp soil and good ventilation, 11%; and those with uncovered damp soil and poor ventila-tion, 0%.7 The corresponding values for Oregon and Wash-ington were 7%, 12%, and 29%, respectively.
Quarles (1989) investigated the combined effects of ventila-tion area and ground cover level on crawlspace moisture conditions in an occupied house in Richmond, California. Three different levels of ventilation were investigated: 1:150 area ratio (net vent area to floor area); 1:1,500 area ratio; and no ventilation. The vapor retarder used was 6-mil (0.15-mm) polyethylene at coverages of 0%, 75%, 90%, and 100%. Each treatment was monitored until condi-tions stabilized, which took at least 5 weeks (except one case noted below). A total of eight conditions were moni-tored during the 16-month study (March 1987–June 1988).
Wood moisture contents were measured using resistance-type probes (Duff 1966) inserted in the middle of 2-ft (0.6-m) sections of Douglas-fir 2 by 4s,8 which were then hung between floor joists, uniformly distributed throughout the crawlspace in 20 locations. Temperature sensors were placed next to the moisture probes. For comparison with the resistance moisture measurements, small wood blocks were hung in the crawlspace and were removed periodically for gravimetric analysis. The moisture contents determined with these two methods were not significantly different. To gauge the variation in wood MC in different locations, the 19- by 42-ft (5.8- by 13-m) crawlspace was divided into six zones,
7The number of houses in this category was significantly less than in the other categories and probably too small a sample to be meaningful. 8Lumber dimensions given throughout this report are strictly nominal values in inches.
2
Table 2—Proportion of moisture content measurements in wood floor members in North Carolina crawlspaces above 19% and 25% MC (Advanced Energy 2005a) Percentage of MC readings
Wood member/location MC ≥ 19% MC ≥ 25%
Sill plate (access) 16 0 Rim joist (access) 11 0 Floor joist (access, below insulation) 24 0 Floor joist (access, above insulation) 8 0 Center joist (below insulation) 40 9 Center joist (above insulation) 12 6 Sill plate (worst) 32 3 Rim joist (worst) 30 9 Floor joist (worst, below insulation) 47 16 Floor joist (worst, above insulation) 29 9 Subflooring 30 16 Other (worst)a 59 28 Total of all locations 28 8 a This was often the location of least clearance between the ground and the
floor framing, though other locations were selected, such as near vents or near the center beam.
Table 3—Summary of reported moisture contents of wood floor members in New Jersey crawlspaces (Dutt et al. 1988)
Group Groundcover
Wall insulation Vents
Range of maximum MC (%)
Average maximum MC (%)
Average minimum MC (%)
1 Yes Yes Closed 12–17 14 10 2 Yes Yes Open 12–17 15 11 3 No No Open 13–25 19 15
Table 4—Summary of reported average moisture contents of floor joists and rim joists and air temperatures in southern New Jersey crawlspaces (Stiles and Custer 1994)
Moisture content (%) Air temperature (°F (°C))
Group Houses Fall Winter Spring Summer Fall Winter Spring Summer
Control 7 15–19 8.5–15 12–14 15–19 68–74(20–23)
54–59(12–15)
58(14)
72(22)
Moisturebarrier 5 14–20 8–12 9–11 12–16 69–71
(21–22)60–62
(16–17)62
(17)71–72(22)
Fulltreatment 5 15–21 9–13 10–13 12–17 68–71
(20-22)56–61(13-16)
60(16)
68–71(20–22)
2
Table 2—Proportion of moisture content measurements in wood floor members in North Carolina crawlspaces above 19% and 25% MC (Advanced Energy 2005a) Percentage of MC readings
Wood member/location MC ≥ 19% MC ≥ 25%
Sill plate (access) 16 0 Rim joist (access) 11 0 Floor joist (access, below insulation) 24 0 Floor joist (access, above insulation) 8 0 Center joist (below insulation) 40 9 Center joist (above insulation) 12 6 Sill plate (worst) 32 3 Rim joist (worst) 30 9 Floor joist (worst, below insulation) 47 16 Floor joist (worst, above insulation) 29 9 Subflooring 30 16 Other (worst)a 59 28 Total of all locations 28 8 a This was often the location of least clearance between the ground and the
floor framing, though other locations were selected, such as near vents or near the center beam.
Table 3—Summary of reported moisture contents of wood floor members in New Jersey crawlspaces (Dutt and others 1988)
Group Groundcover
Wall insulation Vents
Range of maximum MC (%)
Average maximum MC (%)
Average minimum MC (%)
1 Yes Yes Closed 12–17 14 10 2 Yes Yes Open 12–17 15 11 3 No No Open 13–25 19 15
Table 4—Summary of reported average moisture contents of floor joists and rim joists and air temperatures in southern New Jersey crawlspaces (Stiles and Custer 1994)
Moisture content (%) Air temperature (°F (°C))
Group Houses Fall Winter Spring Summer Fall Winter Spring Summer
Control 7 15–19 8.5–15 12–14 15–19 68–74(20–23)
54–59(12–15)
58(14)
72(22)
Moisturebarrier 5 14–20 8–12 9–11 12–16 69–71
(21–22)60–62
(16–17)62
(17)71–72(22)
Fulltreatment 5 15–21 9–13 10–13 12–17 68–71
(20-22)56–61(13-16)
60(16)
68–71(20–22)
12
General Technical Report FPL–GTR–174
each zone measuring 9.5 by 14 ft (2.9 by 4.3 m), and the MC readings in each zone were averaged. Relative humid-ity was determined from dry-bulb and wet-bulb temperature measurements. Soil moisture content was also measured periodically; statistical analysis showed that soil moisture content did not vary significantly during the course of the study.
Table 6 shows the wood moisture contents averaged over the 20 sensors, along with the relative humidity for each vent and ground cover condition. The trends in wood moisture content ran parallel those in relative humidity. The values in zones 1 and 4 (the corners of the crawlspace adjacent to the garage) were consistently higher than in the other zones. For a given venting ratio, increasing the ground coverage clearly decreased the wood moisture content. This suggests that evaporation of water from the crawlspace soil was a major source of moisture. Unfortunately, this study did not examine the role of outside air as a source of crawlspace moisture, although the increase in wood moisture content and relative humidity between conditions 1 and 2 suggests that increased ventilation helps to dry the crawlspace when the ground is uncovered. This study did not consider sea-sonal moisture variation under any given set of vent/ground cover conditions.
Moffatt (1992) conducted a study of 10 houses in Brit-ish Columbia that had crawlspace moisture problems. A number of the houses had inadequate or ineffective drain-age systems, or a high water table that resulted in very wet soil. Wood moisture contents were measured with a resis-tance-type meter at site visits in July, September, October, or January. The measured values of MC in the sill plates varied from 10% to ~32%, with an average of 17%. It was suggested that sill plate gaskets in use were only partially effective in preventing moisture from wicking through con-crete foundation walls into the sill plates. In the floor joists, the MC varied from 10% to 22%, with an average of 13%. Crawlspace air temperatures ranged from 52°F (11°C) in January to 72°F (22°C) in July. The importance of an effec-tive moisture barrier (ground cover) was emphasized as the greatest single factor influencing the rate of moisture pro-duction in crawlspaces.
Additional details of this study were reported by Sheltair Scientific Ltd. (1991). Moisture content measurements were carried out in one house five times between October 1990 and March 1991. The average, minimum, and maximum MC values were as follows: subflooring, 15%, 11%, 18%; floor joists, 15%, 10%, 22%; and rim joists, 23%, 16%, 27%.
3
Table 5—Reported moisture contents and surface temperatures in wood floor members in North Carolina crawlspaces during summer months (Advanced Energy 2005d)
Table 6—Summary of reported wood moisture contents in a California crawlspace (Quarles 1989)
ConditionVent:floorarea ratio
Groundcoverage
(%)
Average wood
MC (%)
Zone 1 wood
MC (%)
Average crawl space
RH (%)
1–initial 1:150 0 12.9 15 86 2a 1:1500 0 18.0 22 98 3 1:1500 75 16.1 20 87 4 1:1500 90 15.0 19 84 5 1:1500 100 13.8 18 79 6 0 75 16.2 20 88 7 0 90 15.1 18 83 8 0 100 13.1 16 74 1–final 1:150 0 14.4 18 82 a Condition 2 did not stabilize; it was terminated because excessive mold growth was observed in one corner (zone 1) of the crawlspace.
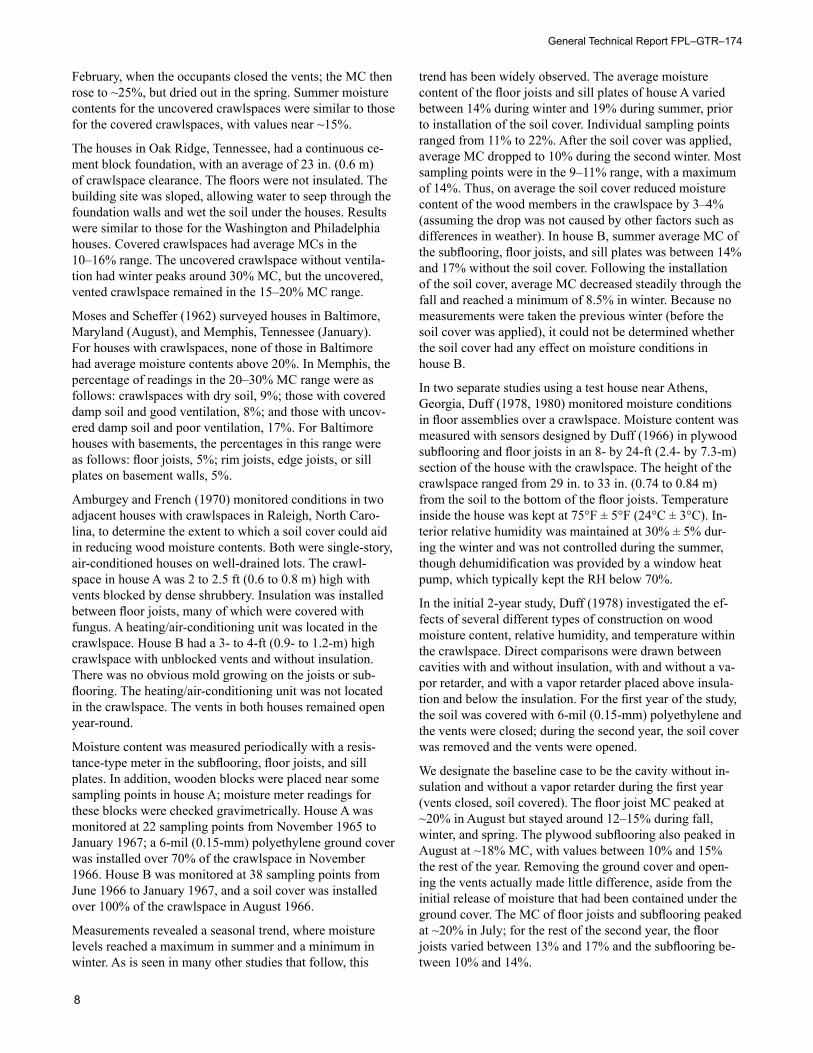
Table 7—Reported moisture contents of wood members during winter in coastal Washington homes with basement and crawlspace foundations (Tsongas 1990) Moisture content (%)
Wood member Measurements Average Minimum Maximuma
Sill plate 29 21.6 13 ~36 Rim joist 22 17.7 11 26 Subflooring 28 20.3 11 30 a MC readings above 30% by electrical resistance are approximate (see Section 1.4).
Table 8—Reported moisture contents of wood members during winter in Seattle/Olympia homes with basement and crawlspace foundations (Tsongas 1990)
Moisture content (%)
Wood member Measurements Average Minimum Maximuma
3
Table 5—Reported moisture contents and surface temperatures in wood floor members in North Carolina crawlspaces during summer months (Advanced Energy 2005d)
Table 6—Summary of reported wood moisture contents in a California crawlspace (Quarles 1989)
ConditionVent:floorarea ratio
Groundcoverage
(%)
Average wood
MC (%)
Zone 1 wood
MC (%)
Average crawl space
RH (%)
1–initial 1:150 0 12.9 15 86 2a 1:1500 0 18.0 22 98 3 1:1500 75 16.1 20 87 4 1:1500 90 15.0 19 84 5 1:1500 100 13.8 18 79 6 0 75 16.2 20 88 7 0 90 15.1 18 83 8 0 100 13.1 16 74 1–final 1:150 0 14.4 18 82 a Condition 2 did not stabilize; it was terminated because excessive mold growth was observed in one corner (zone 1) of the crawlspace.
Table 7—Reported moisture contents of wood members during winter in coastal Washington homes with basement and crawlspace foundations (Tsongas 1990) Moisture content (%)
Wood member Measurements Average Minimum Maximuma
Sill plate 29 21.6 13 ~36 Rim joist 22 17.7 11 26 Subflooring 28 20.3 11 30 a MC readings above 30% by electrical resistance are approximate (see Section 1.4).
Table 8—Reported moisture contents of wood members during winter in Seattle/Olympia homes with basement and crawlspace foundations (Tsongas 1990)
Moisture content (%)
Wood member Measurements Average Minimum Maximuma
13
Review of In-Service Moisture and Temperature Conditions in Wood-Frame Buildings
Fugler and Moffatt (1994) followed up on the 1991 study in British Columbia. Temperature, humidity, and wood mois-ture content were measured in one house in which remedial measures had been applied. A 6-mil (0.15-mm) polyethylene ground cover was installed, and passive and active ventila-tion systems were eliminated. Comparisons can be drawn between measured values in March 1991 and March 1993. The moisture content of the floor joists dropped from 10% to 9% and the rim joists dropped from 14% to 12%. The foundations in British Columbia were typically built with a wood internal support wall that rested on concrete foot-ings. The moisture contents in these internal support walls dropped from 12–15% to 11%, and in the sill plates resting on the concrete footings, the MCs dropped from 25–30% to 12% (measured at the top of the plate).
Flynn et al. (1994) investigated wood moisture content along with air temperature and relative humidity in four crawlspaces in a six-unit condominium complex in Petalu-ma, California. This complex had noticeable problems with mold and decay of wood members in the crawlspace, likely resulting from poor site drainage and lack of a ground cover. Although the foundation walls did have vents, the amount of ventilation did not satisfy code requirements, and only one end unit had cross-ventilation (though ventilation was not necessarily a significant factor). Two end units and two interior units were selected for study. A 6-mil (0.15-mm) polyethylene ground cover was installed in one end unit and one interior unit, while the other units were left in their original condition.
Wood moisture content was measured with a resistance-type meter in support beams (4 by 8 in. (100 by 200 mm)) that ran perpendicular to the floor joists. The joists were not monitored because they were not as affected by fungal growth as were the beams. Prior to installation of the ground cover, the moisture contents ranged from 22% to 27%. Afterwards, in the two units with ground covers, the MC dropped to 16–18%, while the MC values in the two units without ground covers were between 19% and 25%. These results were consistent with measured relative humidities of 79% ± 4% in the interior unit without a ground cover and 55% ± 17% RH in the interior unit with a ground cover (the uncertainties represent the 95% confidence interval). Air temperatures in the crawlspaces were also monitored: for the period between October and February, the temperatures were 65°F ± 5°F (18°C ± 3°C) in the interior unit with a ground cover and 64°F ± 5°F (18°C ± 3°C) in the interior unit without a ground cover (again, 95% confidence intervals).
Several field studies of moisture in houses in the Pacific Northwest region were undertaken by Tsongas (1980, 1984, 1990). Although these studies primarily focused on condi-tions in walls, crawlspaces were also investigated to a lim-ited extent, and the results were reported in a separate paper (Tsongas 1994b). The majority of houses were located in
marine climates: Portland, Oregon; the Seattle–Olympia, Washington, metropolitan area; and the Washington coastal area. Inspections were conducted during the winter months. In general, the crawlspaces did not have moisture problems despite the wet winter weather: they did not smell musty; only a few had standing water; and there were only a few cases of minor mold and surface staining on subflooring or rim joists, but no cases of wood decay (other than due to plumbing leaks).
Moisture contents were measured with a resistance-type meter in a few instances. The average MC of sill plates (treated wood) was 21%, and this winter average value did not drop below 20% by August. Tsongas (1994b) suggested that the high moisture levels in the sill plates were caused by rain water splashing against the house from the ground. Ad-ditional measurements in the San Francisco Bay area found that the moisture contents of wood members in crawlspaces were generally less than 20%. Attempting to explain the lack of moisture problems, Tsongas (1994b) argued that the conditions that favor mold and decay—high moisture levels coincident with warm temperatures—do not often occur in this climate. While the winter is wet and mild, the sum-mer tends to be dry in the Pacific Northwest compared with other parts of the country (such as the southeastern United States).
Further details of moisture content measurements were given for sill plates, rim joists, and subflooring in the coastal Washington and Seattle–Olympia houses (Tsongas 1990). Tables 7 and 8 list the average, minimum, and maximum moisture content values. However, these results are pooled and do not differentiate between houses with crawlspaces and those with basements. Tsongas did note that sill plates over basement foundations were generally drier, possibly because most of the basements were heated.
2.4 Cold ClimateBritton (1948) reported the results of investigations into crawlspace moisture problems carried out by the U.S. Hous-ing and Home Finance Agency. About 50 WWII housing projects were surveyed in Wisconsin, Illinois, Indiana, Maryland, Virginia, and Washington, D.C. Although very few details were given regarding the construction of these houses, Britton described one project in the central states in which the crawlspaces were not vented (presumably there was no soil vapor retarder). The moisture contents of wood members in the foundation were found to be as high as 50% (measurement method not specified). In other projects (loca-tions not specified), wood moisture contents over 50% were found, and plywood flooring was delaminated and softened to the extent that it acted “like a sheet of rubber.”
Diller (1953) investigated the effects of soil cover and ventilation in groups of four houses with crawlspaces in South Portland, Maine; Hartford, Connecticut; and Wayne, Michigan. The studies were conducted as described previ-ously (Section 2.1). The Maine and Michigan houses were
14
General Technical Report FPL–GTR–174
built on continuous cement block foundations, with 42 in. (1.1 m) and 16 in. (0.4 m) of crawlspace clearance, respec-tively. None of the houses had insulation below the floor. The Maine crawlspaces had permanent pools of water, while those in Michigan were frequently flooded to a depth of 2–3 in. (50–75 mm) due to poor drainage. Despite these conditions, the crawlspaces with soil covers had average moisture contents in the 10–20% range, whereas the uncov-ered crawlspaces had very wet wood members, reaching winter peaks of ~40% and in some cases as high as ~60% MC.9 The Connecticut houses had wood pier foundations with mineral board skirting and 16 in. (0.4 m) of clear-ance. The covered crawlspaces had moisture contents in the 10–15% range. In the uncovered crawlspaces, after an initial winter peak of around 30%, the MCs dropped to between 15% and 22%. Diller suggested that these more favor-able conditions were caused by insulation, which had been tacked to the bottoms of the joists, coming loose and falling to the ground, creating a partial soil cover.
Moses (1954) also studied the effect of a ground cover on the moisture content of wood members in houses with crawlspaces. In the first part of the study, measurements were taken in the crawlspace of a house in Madison, Wis-consin, which did not have a ground cover. Wood moisture content was measured using a resistance-type meter, with the pins installed permanently in the wood members (rim joists, end joists, floor joists, and subflooring) so that read-ings could be obtained on a weekly basis. Wood surface temperature and air temperature were measured with
�MC readings above 30% by electrical resistance are approximate (see Section 1.4).
thermocouples, and the air relative humidity was gauged by measuring the moisture content of a central joist (it was assumed that the wood and air were in equilibrium). The measured relative humidity and temperature were then used to calculate the dew point temperature.
Data were acquired from October 1944 until June 1945. The crawlspace vents were closed and the soil was left uncovered during the study; it was observed to be wet and sticky, but not muddy or soft. For the rim joists and edge joists, most of the readings by far were above 30% MC. In one floor joist, about 40% of the readings were above 30% MC. The moisture content tended to rise above 30% when the outside temperature dropped below 40°F (4°C). Data from early October to late November showed that the MC values rose from ~20% to ~60%9 as the wood surface temperature dropped from 63°F (17°C) to 51°F (11°C). Dur-ing this same period, the wood temperature began to drop below the dew point, which likely induced condensation. Conversely, for the period from mid-March to mid-April, the MC values dropped from nearly 60%9 to ~25% as the wood temperature rose from 48°F (9°C) to 58°F (14°C). The accuracy of the moisture meter was verified by small wood blocks clamped to the rim joist, which were later removed for gravimetric analysis.
The second part of the study investigated crawlspaces in two suburban Chicago houses between 1948 and 1951. Vents were closed during the tests, and 45-lb (2.0-kg/m2) asphalt roll roofing was used as a soil cover. The moisture content of the crawlspace wood members was measured as before. Prior to installation of the soil cover, MC values during win-ter in the two crawlspaces ranged from as low as ~15% to as
3
Table 5—Reported moisture contents and surface temperatures in wood floor members in North Carolina crawlspaces during summer months (Advanced Energy 2005d)
Table 6—Summary of reported wood moisture contents in a California crawlspace (Quarles 1989)
ConditionVent:floorarea ratio
Groundcoverage
(%)
Average wood
MC (%)
Zone 1 wood
MC (%)
Average crawl space
RH (%)
1–initial 1:150 0 12.9 15 86 2a 1:1500 0 18.0 22 98 3 1:1500 75 16.1 20 87 4 1:1500 90 15.0 19 84 5 1:1500 100 13.8 18 79 6 0 75 16.2 20 88 7 0 90 15.1 18 83 8 0 100 13.1 16 74 1–final 1:150 0 14.4 18 82 a Condition 2 did not stabilize; it was terminated because excessive mold growth was observed in one corner (zone 1) of the crawlspace.
Table 7—Reported moisture contents of wood members during winter in coastal Washington houses with basement and crawlspace foundations (Tsongas 1990) Moisture content (%)
Wood member Measurements Average Minimum Maximuma
Sill plate 29 21.6 13 ~36 Rim joist 22 17.7 11 26 Subflooring 28 20.3 11 30 a MC readings above 30% by electrical resistance are approximate (see Section 1.4).
4
Table 8—Reported moisture contents of wood members during winter in Seattle–Olympia houses with basement and crawlspace foundations (Tsongas 1990)
Moisture content (%)
Wood member Measurements Average Minimum Maximuma
Sill plate 59 21.8 13 ~50 Rim joist 69 15.9 11 20 Subflooring 73 17.3 11 24 a MC readings above 30% by electrical resistance are approximate (see Section 1.4).
Table 9—Reported moisture content range of wood members in insulated basements of Minneapolis–St. Paul homes (Anderson 1989)
Wood member MonthMoisture content
range (%)
Insulation cavity framing, above grade March–April 6–18 Insulation cavity framing, above grade June 6–16 Insulation cavity framing, below grade March–April 6–24 Insulation cavity framing, below grade June 7–24 Rim joist March–April 6–15 Rim joist June 6–14 “Interior framing” March–April 6–10 “Interior framing” June 6–10
Table 10—Reported moisture contents of wood floor members during winter in Montana homes with basement and crawlspace foundations (Tsongas 1990)
Moisture content (%)
Wood member Measurements Average Minimum Maximuma
Sill plate 5 12.7 9.5 15 Rim joist 18 12.4 8.5 22 Subflooring 20 15.4 8.0 ~55 a MC readings above 30% by electrical resistance are approximate (see Section 1.4).
Table 11—Reported moisture contents of wood floor members during winter in Spokane, Washington, homes with basement and crawlspace foundations (Tsongas 1984) Moisture content (%)
Review of In-Service Moisture and Temperature Conditions in Wood-Frame Buildings
high as ~100%.10 This extreme variation in moisture content may have been due to localized variations in temperature: the coldest members (rim joists and floor joists near the exterior) would be the likely places for condensation. With the soil cover in place, MC values during the month of June were between 8% and 20%, and the following winter remained steady between 6% and 14%. There was a period during which the soil covers were partially removed (expos-ing 20% and 50% of the soil in the two houses); the major-ity of the readings ranged from 7% to 15%, though a few were as high as 30%. The soil covers were then completely removed; MC values in July remained low (9–15%), but in December, as in the first winter with the soil uncovered, MC values again were measured from ~15% to as high as ~85%.10 The soil covers were finally installed again, and during the month of March, values were typically between 7% and 20% MC. Thus it was concluded that a ground cov-er (even a partial cover) has a substantial effect on reducing the moisture content of wood members in crawlspaces.
Moses and Scheffer (1962) reported moisture content mea-surements in houses in Chicago, Illinois, and Madison, Wisconsin, during the month of January. For houses with crawlspaces, the percentages of moisture content readings in the 20–30% range were as follows: crawlspaces with dry soil, 0%; those with covered damp soil and good ventila-tion, 65%; and those with uncovered damp soil and poor ventilation, 100%. Moisture contents exceeding 30% were observed.
Anderson (1989) surveyed 42 houses in the Minneapolis–St. Paul, Minnesota, metropolitan area to determine whether in-sulating the interior of the foundation walls led to moisture problems. Several different types of basement foundations were included: masonry block, cast concrete, and permanent wood foundations. All the houses were less than 5 years old. Wood moisture contents were measured with a resistance-type meter in several locations: the framing members in the insulation cavity (the type of insulation was not specified), rim joists, and “interior framing”—framing exposed only to interior air (not in contact with the foundation wall). Table 9 lists the range of moisture contents for these members in the 42 houses visited in late March–early April and in the 16 houses revisited in early June. Values less than 6% MC were outside the range of the meter. Excessive wetness (with mold growth in some instances) was found in 2 of the 42 buildings in March–April and in 4 of the 16 buildings in June, likely because there was more rainfall in June. The excessive moisture levels were associated with water pen-etrating the foundation due to poor exterior surface drainage and lack of gutters.
Tsongas (1994b) surveyed houses in Montana and Spokane, Washington, during the winter months. The ground was typ-ically dry, and the crawlspaces in these houses did not have
10MC readings above 30% by electrical resistance are approximate (see Section 1.4).
noticeable moisture problems: there were no occurrences of mold or staining and no musty smells. Many crawlspaces did not have ground covers, but this did not appear to result in any problems. Moisture content measurements were re-ported for sill plates, rim joists, and subflooring in both the Montana houses (Tsongas 1990) and the Spokane houses (Tsongas 1984). A resistance-type meter was used, and all readings were corrected for temperature. These results were pooled and did not differentiate between houses with crawl-spaces and those with basements. Tables 10 and 11 list the average, minimum, and maximum moisture content values.
2.5 Summary: Floor MembersTable 12 summarizes the studies reporting moisture contents in floor members. Tables 13–16 summarize the reported moisture contents for each member, including sill plates, rim joists, floor joists, and subfloor sheathing. Several conclu-sions can be drawn from these studies for crawlspace foundations.
1. The most extreme moisture contents in wood structural members above crawlspace foundations occur when the ground is not covered with a vapor diffusion retarder. This effect is magnified for sites with poor drainage.
2. Two different seasonal trends have been observed for crawlspaces:a. The moisture content reached a maximum in winter
and minimum in summer. This trend was observed in studies prior to around 1955 in uncovered crawl-spaces in both mixed-humid and cold climates. The most likely explanation is that when the crawlspace vents either were lacking or were closed during winter, the uncovered soil supplied moisture that condensed on the coldest wood members in the crawlspace. During winter months, the coldest members are the sill plates, rim joists, and floor joists near the exterior. The buildings were not air-conditioned during the summer, and the floor framing therefore was probably warmer than the crawlspace floor (or below-grade portions of the crawlspace walls) for most of the time during summer months.
b. The moisture content peaked in summer, with a minimum in winter. This trend has been reported in hot-humid and mixed-humid climates in all stud-ies conducted since around 1955 in which seasonal trends were investigated. These studies included various types of crawlspaces (both covered and un-covered, vented and sealed). In many of these stud-ies, the living space above the crawlspace was ei-ther known to be, or was probably, air-conditioned during the summer. Most likely, the major source of crawlspace moisture in these studies was warm, humid outdoor air rather than moisture evaporating from the soil. In summer, the floor members can be cooler than the outdoor air (sometimes cooler
16
General Technical Report FPL–GTR–174
than the outdoor dew point temperature), espe-cially when the building is air-conditioned. Lower outdoor temperatures during fall and winter would logically lower the intensity of crawlspace moisture sources.
3 Wall Framing and SheathingIn this section we report measurements of wood moisture content and temperature in wall framing and sheathing. In addition to climate, major factors that influence conditions in wall members are resistance to bulk water intrusion, air-tightness of the wall system, water vapor permeances of the inner and outer wall assemblies, and thermal characteristics. For example, the location of insulation can have a large af-fect on sheathing temperature and its potential for moisture accumulation. Additionally, the way in which the building is operated plays an important role; for example, heating, cool-
ing, ventilation, humidification, and dehumidification can strongly affect conditions. Gavin (1984) reviewed field stud-ies and outdoor exposure studies as well as laboratory stud-ies and theoretical work related to understanding moisture migration in walls. Tsongas (1994a) summarized case stud-ies of moisture problems in walls of residential buildings.
3.1 Hot-Humid ClimateMoses and Scheffer (1962) measured wood moisture con-tents in the bottom plates and lower ends of studs of exterior walls and partition walls of houses with slab-on-grade foundations. In the southeastern United States (August– October), 6% of the houses had exterior wall bottom plates in the range of 20–30% MC, whereas all the partition wall bottom plates and studs were below 20%. Similarly, in the Gulf Coast region (October–December), exterior wall bot-tom plates were in the range of 20–30% MC in 4% of the houses and above 30% MC in 3% of the houses. All the
4
Table 8—Reported moisture contents of wood members during winter in Seattle–Olympia houses with basement and crawlspace foundations (Tsongas 1990)
Moisture content (%)
Wood member Measurements Average Minimum Maximuma
Sill plate 59 21.8 13 ~50 Rim joist 69 15.9 11 20 Subflooring 73 17.3 11 24 a MC readings above 30% by electrical resistance are approximate (see Section 1.4).
Table 9—Reported moisture content range of wood members in insulated basements of Minneapolis–St. Paul houses (Anderson 1989)
Wood member MonthMoisture content
range (%)
Insulation cavity framing, above grade March–April 6–18 Insulation cavity framing, above grade June 6–16 Insulation cavity framing, below grade March–April 6–24 Insulation cavity framing, below grade June 7–24 Rim joist March–April 6–15 Rim joist June 6–14 “Interior framing” March–April 6–10 “Interior framing” June 6–10
Table 10—Reported moisture contents of wood floor members during winter in Montana houses with basement and crawlspace foundations (Tsongas 1990)
Moisture content (%)
Wood member Measurements Average Minimum Maximuma
Sill plate 5 12.7 9.5 15 Rim joist 18 12.4 8.5 22 Subflooring 20 15.4 8.0 ~55 a MC readings above 30% by electrical resistance are approximate (see Section 1.4).
Table 11—Reported moisture contents of wood floor members during winter in Spokane, Washington, houses with basement and crawlspace foundations (Tsongas 1984) Moisture content (%)
Spokane, WA Survey Winter 103 B, CS RJ, SF, SP 11 <6 >30 Highest MC in sill plates
a Number of buildings sampled. b B, basement; CS, crawlspace. c FJ, floor joist; RJ, rim joist; SF, subfloor sheathing; SP, sill plate. d Moisture content measurements above 30% by electrical resistance are approximate (see Section 1.4).
20
General Technical Report FPL–GTR–174
8
Table 13—Summary of studies reporting moisture contents in sill plates Moisture content (%)
Reference LocationType of study Duration Na Foundationb Mean Minimum Maximumc
Tsongas 1984 Spokane, WA Survey Winter 91 B, CS 14.0 <6 >30 Tsongas 1990 Montana Survey Winter 5 B, CS 12.7 9.5 15 Tsongas 1990 Seattle–Olympia, WA Survey Winter 59 B, CS 21.8 13 ~50 Tsongas 1990 Washington Coast Survey Winter 29 B, CS 21.6 13 ~36 Moffatt 1992 British Columbia Survey Various months 10 CS 17 10 ~32 Fugler & Moffatt 1994 British Columbia Survey Mar 1 CS 12 — — Advanced Energy 2005d Central NC Survey Jun–Sep >100 CS — 13 22 a Number of measurements. b B, basement; CS, crawlspace. c Moisture content measurements above 30% by electrical resistance are approximate (see Section 1.4).
Table 14—Summary of studies reporting moisture contents in rim joists Moisture content (%)
Reference LocationType of study Duration Na Foundationb Mean Minimum Maximum
Dutt et al. 1988 Toms River, NJ Field Experiment 1 yr >100 CS — 11 16
Anderson 1989 Minneapolis, MN Survey Mar, Apr, Jun >100 B — ≤6 15 Tsongas 1990 Montana Survey Winter 18 B, CS 12.4 8.5 22 Tsongas 1990 Seattle–Olympia, WA Survey Winter 69 B, CS 15.9 11 20 Tsongas 1990 Washington Coast Survey Winter 22 B, CS 17.7 11 26 Sheltair Scientific 1991 British Columbia Survey Oct–Mar 5 CS 23 16 27 Fugler & Moffatt 1994 British Columbia Survey Mar 1 CS 12 — —
Stiles & Custer 1994 Southern NJ Field experiment 10 mo >170 CS — 10 18
Advanced Energy 2005d Central NC Survey Jun–Sep >100 CS — 11 24 a Number of measurements. b B, basement; CS, crawlspace.
9
Table 15—Summary of studies reporting moisture contents in floor joists Moisture content (%)
Reference LocationType of study Duration Na Foundationb Mean Minimum Maximum
Duff 1978, 1980 Athens, GA Teststructure 4.5 yr 1 CS — 9 20
Moody et al. 1983, 1985 Murfreesboro, TN Field experiment 3 yr 4 CS — 7 18
Dutt et al. 1988 Toms River, NJ Field experiment 1 yr 15 CS — 10 23
Quarles 1989 Richmond, CA Field experiment 16 mo 1 CS — 13 22
Sheltair Scientific 1991 British Columbia Survey Oct–Mar 1 CS 15 10 22 Moffatt 1992 British Columbia Survey Various months 10 CS 13 10 22 Fugler & Moffatt 1994 British Columbia Survey Mar 1 CS 9 — —
Stiles & Custer 1994 Southern NJ Field experiment 10 mo 17 CS — 8 21
Davis & Dastur 2004 Princeville, NC Field experiment 3 yr 12 CS — 9 15
Advanced Energy 2005d Central NC Survey Jun–Sep 10 CS — 11 22 a Number of buildings sampled. b CS, crawlspace.
Table 16—Summary of studies reporting moisture contents in subfloor sheathing Moisture content (%)
Reference LocationType of study Duration Na Foundationb Mean Minimum Maximumc
Verrall 1962 Saucier, MS Field Experiment Jun–Sep 1 CS — 10 30
Duff 1978, 1980 Athens, GA Test structure 4.5 yr 1 CS — 8 20 Tsongas 1984 Spokane, WA Survey Winter 103 B, CS 10.6 <6 20
Choong & Cassens 1985 Baton Rouge, LA Field experiment 1.5 yr 3 CS — 8 25
Tsongas 1990 Montana Survey Winter 20 B, CS 15.4 8 ~55 Tsongas 1990 Seattle–Olympia, WA Survey Winter 50 B, CS 17.3 11 24 Tsongas 1990 Washington Coast Survey Winter 16 B, CS 20.3 11 30 Sheltair Scientific 1991 British Columbia Survey Oct–Mar 1 CS 15 11 18 Advanced Energy 2005d Central NC Survey Jun–Sep 10 CS — 10 18 a Number of buildings sampled. b B, basement; CS, crawlspace. c Moisture content measurements above 30% by electrical resistance are approximate (see Section 1.4).
21
Review of In-Service Moisture and Temperature Conditions in Wood-Frame Buildings
exterior wall studs and partition wall bottom plates and studs were below 20%. The higher moisture levels in exte-rior wall bottom plates might be attributable to rain wetting (direct or splash wetting) of exterior walls or to a higher soil moisture content around the building perimeter (and result-ing capillary rise through the slab).
Sherwood (1985, 1987) used a test building near Gulfport, Mississippi, to investigate moisture conditions in highly insulated walls. The 8- by 48-ft (2.4- by 12-m) structure had eight identical rooms with north- and south-facing walls that could be framed with test panels of various construction. All test panels had 1/2-in. (13-mm) gypsum board on the inside, full-thickness fiberglass insulation in the cavity, and hardboard lap siding on the outside. The primary variables investigated were the following:
• Vapor retarder—6-mil (0.15-mm) polyethylene or as-phalted kraft paper facing on the insulation (stapled be-tween the studs)11
One test panel was framed with 2 by 6 studs at 24-in. (600-mm) spacing and the rest with 2 by 4 studs at 16-in. (400-mm) spacing. During the first year of the study, there were no penetrations in the gypsum board and vapor retard-er; in the second year, a standard duplex electrical outlet was installed in each panel to represent the effect of air leakage. Inside conditions were maintained at 67–70°F (19–21°C) with relative humidity above 40% during the heating season and at 76–79°F (24–26°C) during the cooling season, with humidity uncontrolled.
��The placement of the vapor retarder against the interior side of the wall is atypical for this climate.
Each test panel was instrumented with moisture sensors and thermocouples at various locations, including the sid-ing–sheathing interface, the sheathing–insulation interface, at the center of the cavity insulation, and at various locations within the framing. The moisture sensors (Duff 1966) were calibrated to an accuracy of ±2% MC within the range of 7–20% MC and were corrected for temperature.
Sherwood (1985) found that during the first year (no pen-etrations in test panels) moisture contents were typically in the 8–12% range with an average of 11%. When the walls were penetrated with electrical outlets (second year), the MCs generally increased into the 12–16% range with an average of 14%, with much greater variation in MC read-ings. The framing in the wall with 2 by 6 studs (which had fiberboard sheathing and a 6-mil (0.15-mm) interior poly-ethylene vapor retarder) had an average MC of about 16% at the end of both summers. This wall was the only one with wet insulation near the top of the wall during both sum-mers. Where hygroscopic sheathing (plywood or fiberboard) was used, the moisture content in the south wall cavities was higher than in the north wall cavities. This differ-ence between south and north walls did not occur for foam sheathings, implying that increased moisture in the south walls was solar-driven. In contrast, the low-permeance foam sheathings reduced the movement of moisture into the wall cavities during the summer. During the second winter, some walls had periods of elevated moisture content (16–20% MC), but most readings were between 12% and 16% MC. Disassembly of the test panels showed no deterioration of the wood framing or wood-based sheathing.
TenWolde and Mei (1986) studied moisture movement in the walls of a test building in Beaumont, Texas. The build-ing contained nine instrumented wall panels of various size and construction, all facing south. All walls were framed with 2 by 4 studs, insulated with fiberglass batts, finished
9
Table 15—Summary of studies reporting moisture contents in floor joists Moisture content (%)
Reference LocationType of study Duration Na Foundationb Mean Minimum Maximum
Duff 1978, 1980 Athens, GA Teststructure 4.5 yr 1 CS — 9 20
Moody et al. 1983, 1985 Murfreesboro, TN Field experiment 3 yr 4 CS — 7 18
Dutt et al. 1988 Toms River, NJ Field experiment 1 yr 15 CS — 10 23
Quarles 1989 Richmond, CA Field experiment 16 mo 1 CS — 13 22
Sheltair Scientific 1991 British Columbia Survey Oct–Mar 1 CS 15 10 22 Moffatt 1992 British Columbia Survey Various months 10 CS 13 10 22 Fugler & Moffatt 1994 British Columbia Survey Mar 1 CS 9 — —
Stiles & Custer 1994 Southern NJ Field experiment 10 mo 17 CS — 8 21
Davis & Dastur 2004 Princeville, NC Field experiment 3 yr 12 CS — 9 15
Advanced Energy 2005d Central NC Survey Jun–Sep 10 CS — 11 22 a Number of buildings sampled. b CS, crawlspace.
Table 16—Summary of studies reporting moisture contents in subfloor sheathing Moisture content (%)
Reference LocationType of study Duration Na Foundationb Mean Minimum Maximumc
Verrall 1962 Saucier, MS Field Experiment Jun–Sep 1 CS — 10 30
Duff 1978, 1980 Athens, GA Test structure 4.5 yr 1 CS — 8 20 Tsongas 1984 Spokane, WA Survey Winter 103 B, CS 10.6 <6 20
Choong & Cassens 1985 Baton Rouge, LA Field experiment 1.5 yr 3 CS — 8 25
Tsongas 1990 Montana Survey Winter 20 B, CS 15.4 8 ~55 Tsongas 1990 Seattle–Olympia, WA Survey Winter 50 B, CS 17.3 11 24 Tsongas 1990 Washington Coast Survey Winter 16 B, CS 20.3 11 30 Sheltair Scientific 1991 British Columbia Survey Oct–Mar 1 CS 15 11 18 Advanced Energy 2005d Central NC Survey Jun–Sep 10 CS — 10 18 a Number of buildings sampled. b B, basement; CS, crawlspace. c Moisture content measurements above 30% by electrical resistance are approximate (see Section 1.4).
22
General Technical Report FPL–GTR–174
with gypsum board, and clad with hardboard siding. The variables investigated were the following:
• Wood fiberboard sheathing or aluminum-faced molded expanded polystyrene sheathing
• Presence of a polyethylene vapor retarder between the siding and sheathing
• Presence of a ventilated airspace between the siding and sheathing
• Presence of a polyethylene vapor retarder between the insulation and gypsum board
• Kraft paper facing or no facing on the insulation
Indoor temperature was maintained at 68–73°F (20–23°C) and indoor relative humidity at 50–60%. Although wood moisture content was not specifically reported, temperature and relative humidity were monitored in the wall panels us-ing thermocouples and modified wood electrical resistance sensors (Duff 1966) between April and November 1984. The wood moisture sensors measured RH in the 40–100% range with a reported accuracy of ±10% RH, which roughly corresponds to moisture contents of 8–30%.
Condensation of moisture was observed during afternoons in one test panel (designated S9) with fiberboard sheathing (no exterior vapor retarder) and a polyethylene vapor re-tarder between the insulation and gypsum board. However, the moisture evaporated at night. None of the other panels showed evidence of condensation. This confirms the finding of Sherwood (1985) that in hot-humid climates, solar radia-tion can drive moisture from hygroscopic sheathing into the wall cavity when an exterior vapor retarder is absent, and the moisture can condense when an interior vapor retarder is present.
Mei (1988) modified this test facility in Beaumont, Texas, to investigate brick facades and plywood siding and to further explore the effect of a ventilated airspace between the clad-ding and exterior sheathing. After the hardboard siding was replaced with 3/8-in. (9-mm) plywood on the panel that had experienced cyclical condensation and evaporation (S9 men-tioned above), this condensation disappeared. In one panel with brick cladding, fiberboard sheathing, no exterior vapor retarder, and a polyethylene interior vapor retarder, a daily cycle was observed of very high humidity levels (>90% RH) in the evening that then dropped overnight. A ventilated air-space between cladding and sheathing was found to reduce the flow of heat and moisture into the wall cavity.
During the 1990s, moisture problems ranging from wet sheathing to completely rotted walls were uncovered in hundreds of houses with an exterior insulation and fin-ish system (EIFS) in Wilmington, North Carolina (Nisson 1995). Although the number of EIFS-clad houses in the United States was estimated to be 150,000 in 1997, the extent of damage was not known but was thought to be con-centrated in the hot, humid coastal regions of the Southeast and not limited to North Carolina (Best and Wardell 1997).
The design of this cladding system consisted of rigid foam panels applied over exterior sheathing (commonly wood-based, though gypsum board and cement board were also used), a reinforcing mesh, and a synthetic plaster base coat and finish coat. Rainwater that penetrated the cladding sys-tem—usually around penetrations in walls such as windows and doors or at interfaces with roofs and decks—became trapped inside the wall, leading to high moisture contents and decay of wood sheathing and, in some cases, framing members.
Crandell and Kenney (1996) investigated eight EIFS-clad houses in Wilmington that were representative of the mois-ture problems in that area. Moisture content readings in the wood-based sheathing below window and door openings ranged from 18% to greater than 50% with a resistance-type meter. In most cases, wood decay in walls was not readily detected by visual observation from either side of the wall. Moisture accumulation in walls was attributed to rainwater intrusion through improper sealing at joints around windows, doors, and other penetrations; improperly sloped horizontal EIFS surfaces; inadequate flashing at roof lines, dormers, decks, fireplace chases, and other points; and window frames that leaked into wall cavities. In New Hanover County, it was reported that as many as 16% of properly caulked windows had internal leaking through win-dow frames. It was also noted that the county building code required an interior vapor retarder, which, when combined with EIFS cladding, yielded walls that were unable to dry by vapor diffusion in either direction.
Lstiburek (1995) argued that failures resulted from a funda-mental flaw in the design of EIFS—the lack of a drainage plane. That is, the design did not include a way for water that had penetrated the cladding to drain to the outside or to be dried by airflow, and the low permeance of the exterior base and finish coats prevented drying by vapor diffusion. He proposed details that included drainage planes between the coatings and rigid insulation, between the rigid insu-lation and the sheathing, and within the rigid insulation. Williams and Williams (1998) suggested that the details, methods, and procedures for waterproofing EIFS-clad resi-dential construction had never been sufficiently developed. They pointed out the route of water ingress at a typically constructed window sill and proposed new remedial designs for window head and sill details that would direct water to the exterior of the EIFS rather than between the cladding and sheathing.
3.2 Mixed-Humid ClimateWeber and Reichel (1942) compared the performance of seven different sections of 2 by 4 construction in the north wall of a test structure in Washington, D.C. The variables of interest in the study were the following:
• Vapor retarder (presence, type, and location)• Type of exterior sheathing (fiber insulation board or
southern yellow pine)
23
Review of In-Service Moisture and Temperature Conditions in Wood-Frame Buildings
The wall cavities were not insulated. The various sections were monitored for a 14-day period in mid-winter, during which the average outdoor temperature was 28°F (–2°C). The indoor temperature was maintained at 75°F (24°C) dur-ing the day and 60°F (16°C) during the night, with a mean of 71°F (22°C). The indoor RH was maintained at a mean of 70%. Temperatures were measured daily with thermo-couples at eight locations within each wall section. Moisture levels were monitored gravimetrically using photographic blotting paper of known RH–MC relationship. These papers were placed within the wall cavities and at the exterior side of the sheathing and were removed and weighed daily. They were accessed from the interior through a removable section of sheathing or from the exterior through a small door cut in the siding, which was then sealed with rubber gasketing.
Temperature profiles indicated that the fiber insulation board exterior sheathing raised the cavity temperature by about 5°F (3°C) compared with the pine sheathing. The placement of a vapor retarder was found to have a significant effect: condensation was observed in all sections except those that had a vapor retarder on the warm side of the cavity. In one section with a vapor retarder on the warm side of the cavity, the RH of the air in the cavity was 55%, and the sheathing moisture content was reported to be ~9%. With no vapor retarder, the RH in the wall cavity reached 93%, and con-densation was observed on the exterior sheathing. In the sections where a vapor retarder was placed anywhere on the cold side of the cavity (that is, between the cavity and exte-rior sheathing, between the sheathing and siding, or on both sides of the sheathing), the cavity RH reached 100% and condensation was observed. Sheathing moisture contents were reported between 6% and 60%.12
Moses and Scheffer (1962) surveyed houses in Baltimore, Maryland (August), and Memphis, Tennessee (January). For houses with slab foundations, all the MC readings in studs were below 20%. Exterior wall bottom plates with MCs in the 20–30% range were found in 12% of the houses in Balti-more and only 2% of those in Memphis.
Using an air-conditioned test house in Athens, Georgia, Duff (1971) measured temperature and moisture conditions on the interior and exterior sides of an insulated wall cavity. The 24- by 24-ft (7.3- by 7.3-m) structure contained 4- by 8-ft (1.2- by 2.4-m) removable test sections on each of the four sides. These sections were constructed with wood lap siding, 3/8-in. (9-mm) plywood sheathing, fiberglass batt insulation, 6-mil (0.15-mm) polyethylene interior vapor retarder, and 1/2-in. (13-mm) gypsum board. The study was conducted to determine whether the interior vapor retarder would contribute to high moisture conditions in the walls of an air-conditioned building during the summer. The interior of the test house was conditioned at 75°F ± 2°F (24°C ± 1°C) with humidity uncontrolled. Temperature and
��The measurement technique for wood MC was not reported; it was most likely gravimetric.
moisture content in the test panels were measured with ther-mocouples and wood moisture probes (Duff 1966). Based on measurements in the month of June, the moisture content at the plywood–insulation interface was fairly constant at about 12%, whereas a maximum of 24% MC was reached between the insulation and the interior vapor retarder. The peak in moisture content coincided with the peak in temper-ature (~90–100°F (32–38°C) depending on weather condi-tions and wall orientation) on the exterior wall surface dur-ing daylight hours and typically lasted only about 4 hours. During the night, the exterior temperature fell below the interior temperature, and the MC at the insulation–polyeth-ylene interface typically fell back to 12% or lower. The most likely mechanism for this transient moisture transfer was that heating of the exterior surface drove moisture towards the cooler interior.
Duff (1972) used the same test house to monitor moisture and temperature conditions over a 1-year period. Test sec-tions (same dimensions as above) were constructed with wood lap siding, 3/4-in. (19-mm) fiberboard sheathing, fiberglass batt insulation between 2 by 4 studs spaced 16-in. (400-mm) on center, and 1/2-in. (13-mm) gypsum board. These sections were installed in each of the four walls of the structure, facing each of the four cardinal directions. Each test section had three panels (no penetrations): the first had a 6-mil (0.15-mm) polyethylene vapor retarder positioned at the interior (between insulation and gypsum board), the second had the same positioned at the exterior (between insulation and fiberboard, also covering the studs on each side), and the third had no vapor retarder. The interior of the test house was conditioned at 75°F ± 3°F (24°C ± 2°C) year-round. During the heating season the interior humidity was maintained at 30% ± 5% RH but was uncontrolled during the cooling season. Wood moisture probes (Duff 1966) and thermocouples were used to monitor moisture content and temperature in the siding, fiberboard, studs, and at the in-terface between the insulation and gypsum board. Monthly maximum moisture contents were reported.
In the panel with the interior vapor retarder, moisture con-tent in the fiberboard sheathing reached 14% in the winter and stayed at 11–12% the rest of the year. At the center of the 2 by 4 studs, MC remained at about 10% throughout the year. Maximum moisture content was 23% at the insula-tion–polyethylene interface for a very short duration (sev-eral hours) during the summer. In the panel with the exterior vapor retarder, sheathing MC remained between 12% and 15%, with the minimum in September and the maximum in March. During the winter, a maximum of 25% MC in the sheathing was found in the panel with no vapor retarder, and this high moisture level (>20%) persisted for about 4 months. The direction of exposure was found to have an effect: the east-facing panel reached 25% MC, followed by the north-facing panel at 24%, the south-facing panel at 23%, and the west-facing panel at 22%. These differences
24
General Technical Report FPL–GTR–174
were attributed to drying effects of wind and solar radiation. Sheathing MC dropped to 10–12% in the summer in all pan-els with no vapor retarder. At the center of the 2 by 4 studs, MC varied from 10% in summer to 13% in winter.
3.3 Marine ClimateMoses and Scheffer (1962) surveyed houses with slab foundations in Southern California (March–April) and in Oregon and Washington (April–June). In California, 14% of the houses had exterior wall bottom plates with MCs in the 20–30% range (sample size N = 74) and 20% had partition wall bottom plates with MCs in this range (though only 10 partition walls were sampled). Exterior wall and partition wall studs were all below 20% MC (N = 14). Houses in Or-egon and Washington had bottom plate moisture contents all below 20% (N = 20).
Tsongas (1980) surveyed 93 houses in Portland, Oregon, to determine whether houses retrofitted with wall insulation without a vapor retarder developed moisture problems. Of these 93 houses, 25 were uninsulated (control group), 43 had urea-formaldehyde foam insulation, 10 had cellulose insulation, and 15 had mineral wool insulation. Almost all the houses had wood siding and #15 felt weather barrier; the majority had lapboard sheathing, and the rest had plywood sheathing. The majority of houses were heated with gas or oil, though some were electrically heated. The average num-ber of occupants was three persons. Fan depressurization tests showed that the houses had fairly high air exchange rates, with an average of 16 air changes per hour at 50 Pa. However, the average indoor relative humidity was rather high at 56% RH.
In a preliminary survey, two locations for opening the walls of each house were determined. The objective was to find regions with the highest moisture levels that were not af-fected by bulk water leakage (12% of the houses had leaks in the walls). A capacitive surface-type moisture meter was used to scan the walls from the inside. Two locations were selected for each house, and at each location, two openings were made from the outside: one just below the top plate and one just above the bottom plate. The moisture contents of the sheathing and framing members were measured with a resistance-type meter at both the surface and the interior. Furthermore, small samples were taken for gravimetric anal-ysis in the laboratory. Data were collected between February and early April 1979.
Table 17 lists the average, minimum, and maximum mois-ture contents for each wood member at the surface and inte-rior determined from moisture meter readings. Gravimetric results were generally in good agreement. Average MC values ranged from about 11% to 14%, with an average of 11.8% for all houses. No significant difference was found between insulated and uninsulated houses, or between hous-es with different types of insulation. Wood interior moisture content values were consistently higher than surface values.
The maximum reading was 20% MC. However, some of the measurements were not included because some type of bulk water leak was found that would have biased the data. Moisture contents as high as 30% were found in such instances. Leaks were also found with the surface moisture meter when selecting sites for opening, and these wet loca-tions were avoided.
Tsongas (1990) conducted another field study of indoor moisture problems in new houses in the Pacific Northwest. Inspections and moisture measurements were made at 16 houses in the coastal western Washington area, 50 in the Seattle–Olympia metropolitan area, and 20 in Montana (see Section 3.4). These houses ranged from a few months to a few years old. They were relatively airtight and highly insu-lated (at least R-19). All were electrically heated; most had an air-to-air heat exchanger for ventilation, and some had a dehumidifier. In the first phase of the study, the houses were selected, the occupants were interviewed, wall sections were opened, and moisture content measurements were taken during the winter of 1987. In phase 2 (summer 1988), the 28 wettest houses were revisited, and remedial measures were taken in the 10 houses with the worst moisture prob-lems. In phase 3 (winter 1989), the 16 wettest houses were again revisited.
Tables 18 and 19 list the average, minimum, and maximum moisture contents for each wood member measured during winter 1987 (January–March). Average values range from 14% to 21%. The walls of the coastal Washington houses were generally 3–4% higher in MC than those of the Se-attle–Olympia houses. In both regions, the sheathing was significantly wetter than the various framing members. A correlation was found between high wood moisture content and high indoor relative humidity. Ventilation systems (spot exhaust fans and air-to-air heat exchangers) were often not working properly or not used. Tsongas suggested that portable dehumidifiers may be necessary to control indoor moisture in marine climates where the outdoor RH averages ~90% during fall, winter, and spring.
During summer 1988, the 14 wettest houses in the Seattle–Olympia area were revisited. While average and minimum values were not reported, the maximum sheathing MC had dropped to 17% (from ~50%13), and all the framing MC values were less than 17% (down from a maximum of 26%). In the 12 houses in the coastal Washington area that were revisited, the sheathing had dried to 23% or lower (from 32%) and the studs to 25% or lower (from ~40%13), though a similar high value of 29% MC was found in a top plate.
In a separate paper, Tsongas (1991) compared the houses in this study that had exterior insulating sheathing with those that did not. Either foil-faced polyisocyanurate, extruded polystyrene, or expanded polystyrene insulation was present
��MC readings above 30% by electrical resistance are approximate (see Section 1.4).
25
Review of In-Service Moisture and Temperature Conditions in Wood-Frame Buildings
10
Table 17—Reported moisture contents of wall members during winter in Portland, Oregon, houses (Tsongas 1980)
Table 18—Reported moisture contents of wall members during winter in coastal Washington houses (Tsongas 1990) Moisture content (%)
Wood member Measurements Average Minimum Maximuma
Bottom plate 31 18.9 10 28 Top plate 15 19.6 12 29 Left stud 48 18.4 10 ~40 Right stud 48 18.9 12 34 Sheathing 41 20.6 9 32 a MC readings above 30% by electrical resistance are approximate (see Section 1.4).
Table 19—Reported moisture contents of wall members during winter in Seattle–Olympia houses (Tsongas 1990) Moisture content (%)
Wood member Measurements Average Minimum Maximuma
Bottom plate 90 15.5 10 26 Top plate 48 14.1 8 21 Left stud 150 14.7 10 26 Right stud 150 14.8 9 25 Sheathing 101 18.1 9 ~50 a MC readings above 30% by electrical resistance are approximate (see Section 1.4).
in 15 of the 50 houses in the Seattle–Olympia area, none of 16 houses in coastal Washington, and 10 of the 20 houses in Montana (see Section 3.4). The presence of exterior insulat-ing sheathing was found to greatly reduce wall moisture lev-els. Furthermore, a higher R-value (greater thickness) of the exterior insulating sheathing correlated with a lower mois-ture level. Two possible explanations were offered. First, the exterior insulating sheathing keeps the wall cavity wood members warmer, reducing the accumulation of moisture within the cavity. Second, the insulating sheathing acts as a break between the siding and the wall cavity, preventing the transfer of moisture from wet siding into the wall cavity. A disconcerting finding was that increased wall cavity insula-tion (not including exterior or interior insulating sheathing) correlated with increased wall moisture levels. It was argued that increasing the amount of wall cavity insulation has the effect of lowering the temperature in the outer layers of the wall cavity.
During the 1990s in Vancouver, British Columbia, an inor-dinate number of major decay problems were discovered in wood-frame condominiums due to rainwater intrusion (Kadulski 1998, Morrison Hershfield Ltd. 1998). Best (2000) reported that an estimated 50–90% of the buildings constructed in Vancouver since 1985 were experiencing moisture problems. Many buildings developed extensive rot in the wood framing members and sheathing after less than 8 years. Of all the problems reported, 25% were related to windows themselves and their interface with the walls; 25% had to do with poor flashing of horizontal surfaces or the interfaces between horizontal and vertical surfaces such as guard-rail–wall interfaces; 17% were associated with decks, balconies, walkways, and their interfaces with walls; and the remaining 33% were spread between roof–wall flashing, poor gutter–downspout installation and maintenance, poor vents, and other problems. An important finding was that the proportion of walls with problems dropped with increasing width of the roof overhang. Finally, walls clad with stucco had a proportionally greater incidence of problems than walls with other types of cladding.
Lawton (1999a,b) described the main factors relating to the Vancouver crisis. As mentioned above, smaller overhangs on three- and four-story condominiums resulted in greater exposure to rain than “traditional” residential construction. A second significant factor was the use of complicated fea-tures that were more difficult to construct in a manner that did not leak. Ninety percent of the problems were associ-ated with joints and interface details at decks, balconies, stairs, handrails, windows, and other penetrations. Windows typically lacked a projecting sill with drip edge and, when exposed to high volumes of water, leaked into the walls. The third major factor was poor quality in water protection detailing (see also Dell and Liaw 1998), which resulted from a combination of inadequate design detailing, poor construction, and inadequate site supervision and inspection.
Additional factors were changes in stucco construction that made the cladding less forgiving: (1) the lack of a drainage space between the stucco and sheathing paper, resulting from changes in the metal lath and (2) the reduction in dry-ing potential due to acrylic finishes. While the magnitude of these changes is debated (other cladding systems had water intrusion problems as well), they likely compounded the increased exposure to wetting.
A similar crisis, though less severe, has plagued wood-frame buildings in Seattle, Washington (Best 2000, Desjarlais et al. 2001). An estimated 20% of the multi-story, multi-fam-ily residential structures built in Seattle between 1984 and 1998 had wall moisture damage. Sources of water intrusion were similar to those described for Vancouver. The extent of moisture damage was less severe in Seattle because of several factors:
• Seattle gets less rain (38–42 in. (0.97–1.1 m) per year) than Vancouver (40–90 in. (1.0–2.3 m) per year).
• Size of roof overhangs tended to be larger in Seattle, helping to shield the walls from wind-driven rain.
• Rate of new construction in Seattle was not as great as in Vancouver, and Seattle did not experience the same shortage of skilled labor and site inspectors as in Van-couver.
• The building industry in Seattle was more regulated than in Vancouver (builders were required to register with the State and carry a certain level of liability insurance).
Moisture content measurements have not been reported for either Vancouver or Seattle.
Murray and Tichy (2006) recently reported initial results from a test facility with 12 south-facing wall sections in Puyallup, Washington (Seattle metropolitan area). The variables of interest were as follows:
• Cladding type—cement stucco or fibercement lap siding
• Cladding ventilation—none, vented (3/4-in. (19-mm) cavity between sheathing and cladding open at the bot-tom only), or ventilated (3/4-in. (19-mm) cavity open at both top and bottom)
• Framing and cavity insulation—2 by 6 studs with R-21 glass fiber batt insulation, 2 by 4 studs with R-13 batts and R-5 rigid foam sheathing over the structural sheath-ing, or 2 by 4 studs with R-11 batts
• Interior vapor retarder—polyethylene, “smart” vapor retarder (synthetic polymer sheet with RH-dependent permeance), kraft paper facing, or paint
All wall sections had two layers of 60-minute building paper over the exterior sheathing. The interior temperature and relative humidity were maintained at 69°F (21°C) and
26
50–55% RH, respectively. Data were reported from the period between October 1, 2003, and September 13, 2004. Wood moisture contents were measured using electrical re-sistance at unspecified locations.
Several types of unvented stucco-clad wall sections are discussed first. A wall with construction details common in Seattle prior to 1985 featured 2 by 4 framing, plywood sheathing, and R-11 batt insulation with kraft paper fac-ing. For comparison, a more contemporary wall had 2 by 6 framing, OSB sheathing, unfaced R-21 batt insulation, and a polyethylene vapor retarder. Both wall sections were with-out rigid foam sheathing. The moisture performance was similar: MC values were below 19% except for a few hours out of the entire test period. The combination of R-5 rigid foam sheathing over OSB, 2 by 4 framing with R-13 batt insulation, and the “smart” vapor retarder resulted in mois-ture contents averaging between 8% and 10.5%, and never exceeding 14%. A wall section identical to the one described above with 2 by 6 construction but with the “smart” vapor retarder instead of polyethylene had peak moisture contents approaching 20% (the location was unspecified but was likely in the OSB sheathing).
The effect of a cavity between the stucco cladding and sheathing is discussed next. The wall sections were identi-cal to the one described above with 2 by 6 framing and polyethylene vapor retarder aside from the 3/4-in. (19-mm) cavity. The fully ventilated stucco cladding (open at the top and bottom) performed better than the vented (open only at the bottom) and non-vented claddings. An air pressure difference of 5 Pa was measured between the bottom and top of the ventilated wall. The vented stucco was similar in moisture performance to the non-vented stucco. Although specific MC values were not given, it can be deduced from the values above that they were below 19%.
Walls with fibercement lap siding were all fairly dry, and the vented and ventilated walls were slightly dryer than the non-vented. In general, fibercement lap siding performed better than stucco, though the fully ventilated stucco-clad wall performed as well as those with fibercement lap siding. The wall with no vapor retarder had moisture content readings over 30% for several months in winter. The RH remained near 100%, and mold growth was observed on the OSB sheathing; however, this wall also dried quickly in spring. The “smart” vapor retarder allowed more moisture into wall cavities during winter than did polyethylene but also dried more quickly in spring. On stucco-clad walls, plywood al-lowed more moisture into the cavity than did OSB, but no differences between plywood and OSB were found for walls with fibercement lap siding.
3.4 Cold ClimateTeesdale (1959) used a test house near Madison, Wisconsin, to study moisture accumulation in wall sheathing. Three dif-ferent wall panels were constructed with 2 by 4 studs, gyp-sum lath and plaster, wood sheathing (type not specified),
tarred felt building paper, and painted wood bevel siding. Three stud cavities were uninsulated, three had loose-fill insulation with no vapor retarder, and three had loose-fill in-sulation with asphalt-coated kraft paper as a vapor retarder. The interior environment was maintained at ~40% RH and ~70°F (21°C).
Moisture content was measured gravimetrically in remov-able sections of the wood sheathing at the top and bottom of each wall for an 8-month period from October 1938 to early June 1939. The sheathing had previously been conditioned to 6% MC. On the uninsulated cavities, the sheathing MC peaked at 24% (bottom) and 16% (top) in January and fell to 13% in June at both locations. On the insulated cavities without a vapor retarder, the sheathing rose to 47% MC (top) and 38% (bottom) in March, dropping down to 18% (top) and 15% (bottom) in June. Finally, on the insulated cavities with a vapor retarder, the sheathing MCs at the top and bottom were 18% and 13% in March and 13% and 11% in June, respectively.
Moses and Scheffer (1962) reported moisture content mea-surements in houses with slab foundations in Chicago, Illi-nois, and Madison, Wisconsin, during the month of January. In all cases (only 6 houses), the exterior wall bottom plates had MC values below 20%.
Duff (1968) measured moisture contents in a test house near Madison, Wisconsin, during two consecutive winters. Re-movable 8- by 8-ft (2.4- by 2.4-m) wall sections were con-structed with 2 by 4 studs, 1/2-in. (13-mm) gypsum board, fiberglass insulation with kraft paper facing, 3/8-in. (9-mm) exterior plywood sheathing, and various types of siding. The variable of interest in this study was the installation of a 6-mil (0.15-mm) polyethylene vapor retarder. In one sec-tion, the polyethylene was installed over the inside surface (between gypsum board and kraft paper); a second section had no polyethylene with the kraft paper removed; and a third section had the polyethylene and kraft paper punctured and four 1/4-in. (6-mm) holes drilled in the gypsum board to simulate the effect of an electrical outlet. Prior to the second winter, these holes were plugged. The interior environment was maintained at 30% ± 5% RH and ~72°F (22°C).
Moisture content and temperature were monitored at 2-day intervals with wood moisture probes (Duff 1966) and ther-mocouples in wall framing and sheathing. The sensors were positioned at the bottom, middle, and top of each section, and those in the studs were placed 3/8 in. (9 mm) from the inside and outside. In general, moisture content increased with increasing height in any given section. Duff attributed this effect to convective airflow within the wall cavity: warm air rises and absorbs moisture along the inside of the wall cavity and then deposits this moisture on the cold sheathing surface, where it cools and flows downward. The moisture content values reported below are from the probes at the top of each section.
27
During the first winter, the sheathing moisture contents were 12–13% in the section with the “good” vapor retarder, as high as 24% in the section with the broken vapor retarder, and exceeding 30% (the maximum was estimated to be nearly 60%14) in the section without a vapor retarder. Dur-ing the second winter, the sheathing MC was about 14–15% in the section with the “good” vapor retarder. The warm side of the stud remained constant at 7–8% MC in winter and rose to 11% in spring. The cold side of the stud stayed at 13–14% MC in winter and at 13% in spring. In the sec-tion with the broken vapor retarder with plugged holes, the sheathing stayed constant at 15–16% MC. In the section with no vapor retarder, the sheathing rose to a maximum of ~40% MC14; the warm side of the stud stayed constant at 7–9% in winter, rising to 10% in spring; and the cold side of the stud rose to a maximum of 17% in winter (5 weeks after the ~40% MC peak in the sheathing), dropping to 10% in spring.
Wang (1981) carried out a series of wood-frame house inspections in various locations in the United States and Canada, most of which were in the cold climatic region. Locations included Marion, Illinois; Boston, Massachu-setts; Midland, Michigan; St. Paul, Minnesota; Charlotte, North Carolina; Portsmouth, New Hampshire; Rochester, New York; Cleveland and Columbus, Ohio; and Madison, Wisconsin. Moisture contents were measured with a resis-tance-type meter in wall framing members during winter months between 1974 and 1979. More than 70 houses were inspected, covering a variety of construction types and ranging in age from 0 to 10 years. Moisture contents were mostly between 7% and 12%; all were below 15%. No ap-preciable difference in moisture content was found between walls sheathed with extruded polystyrene insulation, wood fiberboard, and plywood. No signs of condensation, water staining, wood decay, or fungal growth were observed.
Marshall Macklin Monaghan Ltd. (1983) conducted a sur-vey of 201 government-financed housing units with reported moisture damage in Canada, including single-family houses, semi-detached row houses, and multi-family dwellings. The sample of housing units was selected according the geographic distribution of reported problems. The major-ity was located on the Atlantic coast (Newfoundland, New Brunswick, and Nova Scotia) and the Pacific coast (British Columbia). The average age of the buildings was less than 5 years. Single point-in-time moisture content measure-ments were made in wall framing and sheathing (the time of year was not specified). Specific wood moisture contents were not given; instead, proportions of the readings below or above specified moisture levels were reported. These are shown in Table 20. High moisture content readings in first floor framing were correlated with high indoor relative hu-midity. The higher incidence of moisture accumulation in second floor framing was thought to be due to air
��MC readings above 30% by electrical resistance are approximate (see Section 1.4).
exfiltration. Moisture accumulation in wall sheathing was correlated with exposure to wind-driven rain and exposure to wind (which can induce air leakage).
Sherwood (1983, 1987) studied moisture conditions in highly insulated walls with a test building near Madison, Wisconsin. The structure was identical to that described above for Gulfport, Mississippi (Sherwood 1985), having eight rooms with north- and south-facing walls containing test panels of various construction. This study also had a 2-year duration, with no penetrations in the gypsum board for the first year and electrical outlets in each panel for the second year.
During the first summer, moisture contents were typically in the 8–12% range. In winter, condensation was found in walls with kraft paper vapor retarders (stapled to the sides of the studs) in conjunction with fiberboard or polystyrene sheathing but not plywood sheathing. No condensation was found in walls with polyethylene vapor retarders, regardless of the type of sheathing. In the walls in which condensation was found, moisture contents exceeded 20% for no more than 6 weeks, and the location of increased moisture con-tent was generally at the sheathing–siding interface or the sheathing–insulation interface. The framing MC never ex-ceeded 12%. Winter temperatures recorded at the sheathing–insulation interface generally were between 20°F (–7°C) and 50°F (10°C) depending on the outside temperature and the type of construction.
When the walls were penetrated with electrical outlets (sec-ond year), moisture contents at the sheathing–insulation interface generally rose above 16% in winter. Localized condensation was found on the sheathing surface behind the electrical outlet for panels with R-13 or R-19 batt insulation during January through March, but not in panels with low-density R-11 blanket insulation. By early April, all moisture content readings were below 11%. Again, the framing mois-ture content did not increase significantly at any time.
Tsongas (1984) surveyed 103 houses in Spokane, Wash-ington, to determine whether houses retrofitted with wall insulation without a vapor retarder developed moisture problems. Of these 103 houses, 24 were uninsulated (con-trol group), 61 had cellulose insulation, 11 had fiberglass insulation, and 7 had rock wool insulation. The majority of the houses had wood siding, the rest had metal or vinyl sid-ing. Almost all had #15 felt or building paper as the weather barrier. Lapboard sheathing was the most common, though a few houses had plywood or wood fiberboard sheathing. The majority of houses were electrically heated (most with baseboards, some with forced air). The average number of occupants was three persons, and the average indoor relative humidity was 47% RH.
In a preliminary survey, three locations for opening the walls of each house were determined. The objective was to find regions with the highest moisture levels that were not
28
affected by bulk water leakage. Typical locations were near bathrooms or kitchens, near electrical outlets, away from heat sources, and in areas showing evidence of possible moisture damage (blistering paint, warped siding, discol-oration, mold or mildew, and termite or dry rot damage). All locations were selected to be near the floor line and were opened from the outside. The moisture content of the sheathing and framing members were measured with a re-sistance-type meter both at the surface and the interior. Data were collected between December 1982 and February 1983.
Table 21 lists the average, minimum, and maximum mois-ture contents for each wood member at the surface and inte-rior. The average MC values range from about 10% to 13%, with an average of 11.3% for all houses. No significant difference was found between insulated and uninsulated houses, or between houses with different types of insulation. Sheathing moisture content values were consistently higher than those for framing members. Readings above 20% MC were attributed mainly to wetting by water dripping from the roof and splashing back against the house, wood mem-bers in contact with the ground, and bulk water leaks.
Platts (1988) summarized the findings of a survey of older houses with retrofit-insulated walls in Canada in which 1,900 houses were examined during October, when the walls should not have been affected by the usual pattern of winter moisture accumulation. Moisture contents were measured in the bottom plates in 10 locations in each house. Exces-
sive moisture contents (near or above 30% MC) were found in the walls of 1–3% of the houses in the inland provinces but as many as 15% in Newfoundland and 12% in British Columbia. The higher incidence of moisture problems in coastal provinces is in agreement with the findings of Mar-shall Macklin Monaghan Ltd. (1983) discussed above. Most of the moisture problems were related to rainwater intrusion or excessive indoor humidity in winter. In the coastal prov-inces, a significant source of moisture accumulation in walls was wind-induced exfiltration of humid indoor air through leaks on the lee side of the house.
Tsongas (1990) conducted a field study of indoor moisture problems in new houses in the northwestern United States (as described in Section 3.3). Inspections and moisture measurements were made at 20 houses in several cities in Montana during winter 1987. Table 22 lists the average, minimum, and maximum moisture contents for each wood member. The sheathing, with an average of 15.5% MC, was significantly wetter than the various framing members, which all averaged 12–13% MC. However, when the two wettest houses were revisited during August 1988, the high-est moisture content measured in the walls (sheathing and framing) was 7.5% MC, which indicated that walls dried out satisfactorily during warm weather.
Tsongas and Nelson (1991) reported a separate investigation of one of the houses in Helena, Montana, from the study mentioned above. Following the initial visit on February 18,
11
Table 20—Proportion of moisture content measurements in wall members in Canadian houses below 15% MC and above 22% MC (Marshall Macklin Monaghan 1983) Percentage of MC readings
Table 21—Reported moisture contents of wall members during winter in Spokane, Washington, houses (Tsongas 1984)
Moisture content (%)
Wood member Measurements Average Minimum Maximum
Bottom plate, surface 304 10.9 6.5 26 Bottom plate, interior 304 11.0 6.5 26 Right stud, surf 305 10.6 6.5 22 Right stud, int 305 10.8 6.5 22 Left stud, surf 304 10.6 6.5 24 Left stud, int 303 10.9 6.5 24 Sheathing, surfa 283 12.7 6.5 >30 Sheathing, int 283 13.2 6.5 >30 a Warm side.
Table 22—Reported moisture contents of wall members during winter in Montana houses (Tsongas 1990) Moisture content (%)
Wood member Measurements Average Minimum Maximuma
Bottom plate 38 12.0 8.0 19 Top plate 17 12.6 6.0 24 Left stud 57 12.0 6.0 22 Right stud 57 12.7 6.0 34 Sheathing 30 15.5 8.0 ~50 a MC readings above 30% by electrical resistance are approximate (see Section 1.4).
29
1987, a second visit was made on February 20, and moisture contents were measured at 120 locations in the exterior wall sheathing (at the top and bottom of every cavity). Three lo-cations exceeded 40% MC, four locations were between 30 and 40% MC, and 11 locations were between 20 and 30% MC.15 It was discovered that the interior relative humidity was quite high: the air-to-air heat exchanger was set to run when the humidistat read 40% RH; however, the humidistat was not calibrated and the unit turned on at 55% RH. On a later visit in mid-April, depressurization measurements showed that the house was fairly airtight, with 1.2 air chang-es per hour at 50 Pa. Infrared thermography was used during house pressurization and depressurization to locate air leak-age sites and paths. Numerous leaks were found both inside and outside, resulting from improper sealing or poor quality of work. The main leakage sites were at penetrations for the air-to-air heat exchanger ducts, electrical service box, win-dows, exterior lights, and ceiling penetrations for vent stacks and electrical wiring. A correlation was established between the locations of air leaks and the locations of high sheathing moisture content, implying that the source of moisture in the wall sheathing was exfiltration of humid indoor air.
TenWolde et al. (1995) investigated the relationship between air leakage and moisture conditions in the walls of a test building near Madison, Wisconsin. Of particular interest was the construction practice of ventilating the stud spaces, which was common in manufactured houses. The 50- by 8-ft (15- by 2.4-m) test building had two 20-ft (6-m) sections (east and west rooms) and one central 10-ft (3-m) section. The east and west rooms were maintained at 35% RH and 45% RH, respectively, and 70°F (21°C) during the winter, but temperature and humidity were not controlled during spring and fall. East and west rooms contained replicates of 10 different wall modules. All walls were framed with 2 by 6 studs, 16-in. (400-mm) on center, and insulated with R-19 fiberglass with kraft paper facing. The variables un-der investigation were type of siding, presence and type of sheathing, presence of wall cavity (stud-space) ventilation, presence of an electrical outlet, and presence of a gasket
15MC readings above 30% by electrical resistance are approximate (see Section 1.4).
around the outlet cover plate. Because the walls were in-tended to be representative of modestly priced manufactured housing, 6 of the 10 module designs used combination sheathing–siding. The other four module designs had sepa-rate sheathing and siding; two had steel siding, and the other two had waferboard siding. In these four modules a ventila-tion space between the sheathing and siding was formed intentionally with spacers (with waferboard siding) or pro-vided by the siding corrugations (with steel siding).
Relative humidity and temperature were measured at the inside surface of the exterior sheathing with wood electrical resistance probes (Duff 1966) and thermocouples. The aver-age RH from November through February varied from less than 40% (~8% MC) to as high as 90% (~20% MC) for the different wall modules. The average for all modules in the low-humidity room was 64% RH, while that for the high-humidity room was 75% RH. Values of 100% RH (indicat-ing condensation) were recorded for short periods in some modules and for extended periods in several others. Visual inspection after completion of the study found water stain-ing or mold in the modules that had sustained periods of condensation. All these modules were in the high-humidity room. The only walls in the high-humidity room that consis-tently remained free of condensation were those constructed with separate sheathing and with intentionally-installed spacers between the sheathing and siding; these walls did not have ventilated stud spaces.
By comparing the different types of construction in the wall modules, several conclusions were reached. In walls without electrical outlets, stud-space ventilation did promote dry-ing. In walls with outlets in the low-humidity room, cavity ventilation either promoted drying or had no effect. In walls with outlets in the high-humidity room, cavity ventilation had no apparent influence on wall moisture conditions. The presence of mold and evidence of sustained condensation in at least two wall modules with stud-space ventilation dem-onstrated that ventilation of the insulated cavity was not a dependable moisture-control strategy. Air pressure differen-tial measurements indicated that the prevailing direction of air leakage across the gypsum board was infiltrative. If the prevailing direction had been exfiltrative, the walls would likely have been wetter.
30
11
Table 20—Proportion of moisture content measurements in wall members in Canadian houses below 15% MC and above 22% MC (Marshall Macklin Monaghan 1983) Percentage of MC readings
Table 21—Reported moisture contents of wall members during winter in Spokane, Washington, houses (Tsongas 1984)
Moisture content (%)
Wood member Measurements Average Minimum Maximum
Bottom plate, surface 304 10.9 6.5 26 Bottom plate, interior 304 11.0 6.5 26 Right stud, surf 305 10.6 6.5 22 Right stud, int 305 10.8 6.5 22 Left stud, surf 304 10.6 6.5 24 Left stud, int 303 10.9 6.5 24 Sheathing, surfa 283 12.7 6.5 >30 Sheathing, int 283 13.2 6.5 >30 a Warm side.
Table 22—Reported moisture contents of wall members during winter in Montana houses (Tsongas 1990) Moisture content (%)
Wood member Measurements Average Minimum Maximuma
Bottom plate 38 12.0 8.0 19 Top plate 17 12.6 6.0 24 Left stud 57 12.0 6.0 22 Right stud 57 12.7 6.0 34 Sheathing 30 15.5 8.0 ~50 a MC readings above 30% by electrical resistance are approximate (see Section 1.4).
Investigations of decayed plywood sheathing in manufac-tured houses in Wisconsin have been reported by several authors (TenWolde 1988, Merrill and TenWolde 1989, Tsongas and Olson 1995, TenWolde 2000). Typical wall construction included 2 by 4 framing with 1/2-in. (13-mm) gypsum board, 1/2-in. (13-mm) exterior plywood sheathing, asphalt-coated building paper, and hardboard lap siding. The wall cavity was filled with mineral fiber insulation that had a kraft paper exterior facing and an interior facing of kraft paper, polyethylene, or aluminum foil. Merrill and Ten-Wolde (1989) found through site inspections that decay oc-curred in fewer than half the houses and was located mainly in the plywood sheathing, with very few instances of dam-age to wood framing. They observed a correlation between incidence of moisture problems and occupant density. Air-tightness measurements indicated that ventilation rates were very low. This resulted in high indoor humidities that led to condensation in the walls during winter.
Moisture contents were measured in 17 of these manufac-tured houses by Tsongas and Olson (1995). A surface ca-pacitance-type meter was used to scan for MC values up to 20%; a resistance-type meter with a reported range between 6% and 60% MC was used for higher moisture contents.15 Measurements were made at various times, including winter, early spring, and summer. In many cases, the plywood sheathing was found to be very wet, with MC values exceeding 20%, especially at the upper portions of gable end walls and non-gable end walls outside bedroom closets. Moisture contents greater than 60%16 were reported during the summer, when the walls have typically dried out in this climate. On many houses the plywood sheathing was decayed, delaminated, and moldy. In only a few instances were the wood framing members decayed. The authors argued that the exterior building paper acted as a vapor retarder that trapped moisture in the plywood. However, TenWolde (2000) analyzed the design of the houses with a computer model and found that only a combination of in-door humidity control, a permeable exterior weather barrier, and elimination of indoor air leakage through the wall could eliminate all potential for decay and mold growth.
Rose and McCaa (1998) measured moisture and temperature conditions in a test house in Champaign, Illinois, during three consecutive winters. The setup was designed to focus on water vapor diffusion and to exclude air leakage through the walls. Removable 8- by 8-ft (2.4- by 2.4-m) wall sec-tions were constructed with 2 by 4 studs spaced 16 in. (400 mm) on center, 1/2-in. (13-mm) gypsum board with two coats of latex paint, 7/16-in. (11-mm) OSB sheathing, and vinyl siding. The variables of interest in this study were the following:
• Insulation material—fiberglass or cellulose• Vapor retarder—none, polyethylene, or kraft-paper
facing
16MC readings above 30% by electrical resistance are approximate (see Section 1.4).
• Encapsulation materials• Method of attaching the kraft paper facing—unstapled,
face-stapled, or inset-stapled• Location within the wall cavity
A total of 16 different wall samples were monitored. The interior environment was maintained at 70°F (21°C) with 50–55% RH during the first winter and 40% RH during the second and third winters. Heating was by electrical resis-tance with fans for circulation; there was no mechanical pressurization or depressurization of the building. The test panels were on the south side of the building (the north side could not be used); since the more severe moisture condi-tions occur on shaded walls, a nylon tarpaulin was installed from the fascia to the ground as a sun shield.
Moisture content and temperature were monitored hourly with wood moisture probes (Duff 1966) and thermocouples. The sensors were positioned at the center and edge of the framing cavities, 2 ft (0.6 m) below the top plate and 2 ft (0.6 m) above the bottom plate. In addition, 2-in.- (50-mm-) diameter holes were cut in the OSB sheathing and plugs were fit snugly into the holes. The plugs were re-moved periodically for gravimetric moisture content deter-mination. The correlation between the electrical resistance and gravimetric moisture content measurements was not very strong.
Although the resistance measurements did not give consis-tent outputs from year to year, they were reliable for side-by-side comparison of different insulation–vapor retarder installations.
In general, moisture content and temperature increased with increasing height in any given cavity. During the first winter with the interior RH at 50–55%, the sheathing MC varied from 8–12% for cavities with vapor retarders to 24–35% for cavities without vapor retarders. The plugs without vapor protection actually delaminated from excess moisture (they were replaced the following winter). During the second and third winters with the interior RH at 40%, all the sheathing MCs were between 6% and 12%. Following the study, the walls were disassembled and checked for mold growth and signs of moisture. The cavities without vapor retarders had mold distributed uniformly on the sheathing, as well as cor-rosion on metal fasteners. The cavities with polyethylene showed no mold growth. All the fiberglass-insulated cavities with kraft paper facings showed some mold growth on the sheathing near the tops of the cavities where the electrical cables penetrated the drywall. Although the penetrations were caulked, the mold growth pattern indicated there was some air leakage.
Straube and Burnett (1998) investigated the role of ventila-tion in the drying of masonry-clad wood-frame walls using a test building in Waterloo, Ontario. Two different types of 4- by 8-ft (1.2- by 2.4-m) wall sections were constructed. Both types had 3.3-in. (85-mm) brick veneer with open head joints (24 in. (600 mm) on center) at both top and bottom, a
31
1.2-in. (30-mm) air space, 2 by 4 framing (16 in. (400 mm) on center) filled with low-density batt insulation, a 6-mil (0.15-mm) polyethylene vapor retarder, and painted gypsum board. The combination of interior drywall and polyethyl-ene was tested and confirmed to be airtight. The variables of interest in this study included permeance of the exterior sheathing and whether the air space was vented or unvented.
Wall type A had 2-in. (50-mm) mineral fiberboard insula-tion over exterior gypsum board sheathing. Wall type B was constructed with asphalt-impregnated building paper over 1-1/4-in. (32-mm) extruded polystyrene sheathing. The water vapor permeance of wall type B was about 2% of that of wall type A. One panel of type A was placed on an east-facing wall. Four panels of type B were placed on walls facing all four cardinal directions. Each panel was instru-mented with temperature sensors, relative humidity sensors, and moisture pins for electrical resistance measurements of wood moisture content near the center of the studs and top and bottom plates. The interior environment was maintained at 70°F ± 2°F (21°C ± 1°C) and 50% ± 5% RH for a two-year period. The air space in panel A was vented for the first year, and its vents were sealed airtight for the second year.
The moisture content in the framing of the wall panels with polystyrene exterior sheathing (low permeance, type B) remained at 9–11% MC for the 2-year period. During the year that panel A was vented, the framing moisture content was in the same range except for a rise to 15% MC for a ~10-day period in the summer. This increase was attributed to moisture being driven from the brick cladding by solar heating and permeating the exterior sheathing.17 When the vents in panel A were sealed the following summer, the framing MC rose to 18–20%. Occasional condensation was found on the interior polyethylene vapor retarder in this panel. Measurements showed that the water vapor concen-tration in the air space between the brick veneer and the exterior sheathing depended significantly on ventilation: the unvented air space had 44% more moisture than did outside air, whereas the vented air space had only 11% more mois-ture than did outside air when averaged over the summer months.
In response to reported wall moisture problems in Alberta similar to those in British Columbia (see Section 3.3), Building Envelope Engineering, Inc. (1999) inspected 41 houses and 9 multi-unit residential buildings located pri-marily in Calgary and Edmonton. All buildings were under 10 years old. The sampling was not random but was biased towards houses that had a higher occurrence of moisture problems than the general Alberta population. The
�7The study did not discuss the possibility that the brick veneer was wet by rain water that ran off the roof and splashed from the ground. The test building was constructed with a hip roof, minimal overhang, and no gut-ters. If splash wetting did occur, the degree of wetting of a particular wall section would have depended on its distance from the corner because the amount of run-off from a hip roof is greatest at the center of the wall. The study did not specify the horizontal locations of wall panels A and B.
buildings were representative of typical materials and meth-ods used in single-family and low-rise multi-family wood-frame construction in Alberta. Although wood moisture contents were not reported, most moisture-related failures were found to stem from inadequacies in either design or construction. Rainwater intrusion was a contributing factor in 91% of problems, most of which occurred at window and door perimeters and decks. Buildings with stucco cladding had a higher incidence of rainwater intrusion problems than did buildings with vinyl siding. Condensation within wall cavities due to indoor relative humidities above 30% during winter was a factor in 14% of all problems.
Similarly, Chouinard and Lawton (2001) reported detailed investigations of bulk water entry and wood decay in three multi-story wood-frame housing complexes built in the late 1980s. The first was a condominium in Bedford, Nova Scotia. Significant water penetration at windows and warp-ing of cladding at balcony walls were reported a few years after construction, and wood decay was found in framing members. A few years after remediation, new problems arose from water leakage through improperly nailed cedar shingles and at window corners. Moisture contents in wood sheathing and framing members often exceeded 25%. The second case was a housing cooperative in Dartmouth, Nova Scotia. Water intrusion problems were discovered 9 years after construction and were mainly due to poor detailing around balconies and patio doors. Moisture contents in wall sheathing and framing and floor members were above 25% where wood was rotted or bulk water was present, but in areas with no damage, MCs were in the 10–13% range. The third case was a townhouse complex in Ottawa, Ontario. The partial collapse of a second-floor balcony 12 years after construction led to the discovery of extensive decay of fram-ing members in the first- and second-floor exterior walls. Water entry was attributed to deficiencies in flashing details at windows and doors. Curiously, the tops of windows and doors were wrapped with polyethylene, which actually col-lected water and then redistributed it to the surrounding framing members. In all three cases, bulk water intrusion was related to inadequate detailing.
Cautley (2004) compared moisture performance of wall sec-tions in an unoccupied house in Madison, Wisconsin. Walls were constructed with 2 by 6 framing, 16 in. (400 mm) on center, fiberglass insulation, interior gypsum board, an ex-terior housewrap, and vinyl siding. The variables of interest were the following:
• Wall orientation—west- or north-facing• Exterior sheathing—1/2-in. (13-mm) OSB, 1/2-in.
(13-mm) extruded polystyrene (XPS), 1-in. (25-mm) XPS, or combination of 1/2-in. (13-mm) OSB and 1/2-in. (13-mm) XPS
• Interior vapor retarder—none or polyethylene• Airtightness of the assembly—continuous bead of
sealant applied around perimeter of insulated cavity or
32
air leakage paths intentionally left to both interior and exterior
Wood moisture content was monitored for 12 different stud cavities in framing members and OSB sheathing by elec-trical resistance measurements. Stainless steel pins were installed in the bottom plates, top plates, and studs at mid-height at locations 1/2 in. (13 mm) from the gypsum board and 1/2 in. (13 mm) from the sheathing. Pins were installed in OSB sheathing near the bottom plate, top plate, and at mid-height. Temperature was measured with thermocouples at the same locations. Data were acquired over a 10-month period (November 2000 through August 2001) at intervals of 15 min. The interior of the house was initially humidi-fied to ~50% RH during November. Subsequently, the in-door RH was gradually decreased to a minimum of ~20% in March, after which it was increased again. The average indoor temperature and relative humidity over this Novem-ber–March period were 71°F (22°C) and 29% RH. Tempera-ture and humidity were uncontrolled during the summer.
In walls that did not incorporate a polyethylene vapor re-tarder, a trend was observed of high moisture content at or near the sheathing during winter, followed by drying in spring and summer. A similar trend was apparently also observed in walls with a polyethylene vapor retarder, pro-vided they were not airtight. Average winter framing mois-ture contents near the sheathing ranged from 8% to ~22%, the driest winter conditions being associated with airtight walls with a polyethylene vapor retarder. In all walls except airtight walls with a polyethylene vapor retarder, a higher moisture content was observed during winter in the bottom plates near the exterior (>25% MC) than at any other loca-tion in the framing. Moisture levels in OSB sheathing were similar to those in outer portions of the framing, but there was no discernable spatial variation in sheathing moisture content. It was also noted that in most cases, the tempera-ture was slightly higher at the bottom than at mid-height or at the top. The high moisture content in the outer bottom plates was thus attributed to condensation dripping from the sheathing (whether OSB or XPS).
No benefit of insulating sheathing (XPS) was observed on wintertime moisture conditions at the most critical loca-tion in the framing (the bottom plate). However, more rapid springtime dissipation of moisture was observed in airtight walls sheathed with XPS than in comparable walls sheathed with OSB. In a similar manner, the influence of air leak-age on wall moisture conditions was not straightforward; in some cases it apparently exacerbated winter moisture accumulation, but it also evidently accelerated springtime moisture dissipation.
During spring and summer, a few episodes of rapid, local-ized wetting (>30% MC) followed by several days of drying were observed in framing below windows near the sheathing (different locations than the 12 cavities discussed above).
Each wetting event was preceded by rainfall. Window type and installation method were not reported.
Decay in wall framing and sheathing was reported for houses built in Woodbury, Minnesota, during the 1990s (Holladay 2006a). Most of the problems occurred in wood-frame houses with stucco cladding, OSB sheathing, fiberglass batt insulation, and interior polyethylene vapor retarder. Although water damage occurred in houses with claddings other than stucco, the percentage of houses need-ing repair was 51% for stucco and about 3% for other clad-dings. The extensive decay clearly points to within-wall moisture conditions in excess of fiber saturation coinciding with temperatures that would support decay.
Holladay (2006a) listed nine factors that have been sug-gested by experts as contributing to the failures. In the ma-jority of cases, the high moisture levels were attributable to bulk water leakage, while in some cases high indoor relative humidity during the winter in conjunction with air exfiltra-tion was cited as the source of moisture. According to the City of Woodbury (2005), “Window leaks, a lack of kickout flashing, improper deck flashing, and grade above the wood framing are the primary causes that account for the majority of the damage. All other causes are secondary.” In contrast to the stated opinion of the City, Bomberg et al. (2005a,b) suggested that two additional factors came into play: “The stucco cladding, which is a major reservoir of moisture, is not properly separated from the wall sheathing to prevent transfer of exterior moisture to the inner part of the wall as-sembly,” and “The exterior wall has limited drying ability to the exterior and interior. This fact increases the effect of water entrapment and further compounds the effects of the first two problems.”
3.5 Summary: Wall Framing and SheathingTable 23 summarizes studies that report moisture contents in wall framing and sheathing for each climatic region. Again, moisture conditions span a very wide range. Tables 24–27 summarize moisture contents for various members, includ-ing bottom plates, top plates, studs, and wall sheathing. Several conclusions can be drawn from the literature.
1. High moisture contents in walls may occur in response to rainwater intrusion. The moisture content depends on the magnitude of the leakage and the rate at which drying occurs.
2. High moisture levels may occur in exterior wall sheath-ing in cold and marine climates during winter. Exfil-tration of humid indoor air and diffusion of moisture through insulated wall cavities lacking effective air bar-riers and vapor retarders allow moisture to accumulate in the cold sheathing. The severity of this problem cor-relates with indoor humidity levels maintained during the winter.
3. In cold and marine climates, the sheathing usually dries during the spring and reaches a minimum during the
33
12
Table 23—Summary of studies reporting moisture contents in wall framing and sheathing by climatic region Moisture content (%)
Reference LocationType of study Duration Na
Measurement locationb Mean Minimum Maximumc Trends
Hot-humid climate Moses & Scheffer 1962
Southeastern US
Survey Aug–Oct 78 BP, St — <12 ≤30
Moses & Scheffer 1962
Gulf Coast Survey Oct–Dec 255 BP, St — <12 >30
Sherwood1985, 1987
Gulfport, MS Test structure 2 yr 8 BP, Sh, St, TP — 8 >20 Higher MC in walls penetrated by electrical outlets Highest summer MC in
walls with fiberboard sheathing Higher summer MC in
walls with wood-based sheathing than with exterior insulating sheathing
TenWoldeand Mei 1986
Beaumont, TX Test structure Apr–Nov 9 RH sensors at interfaces between
materials in wall cavity
— — — Walls remained dry with an exterior vapor retarder or without any vapor retarder either inside or outside Wall with interior vapor
retarder experienced daily cyclical condensation
Mei 1988 Beaumont, TX Test structure Jun–Oct 9 RH sensors at interfaces between
materials in wall cavity
— — — Ventilation between cladding and sheathing reduced moisture flow into wall cavity Daily cyclical
condensation at interior vapor retarder in wall with brick veneer but not plywood siding
Crandell & Kenney 1996
Wilmington,NC
Survey Aug 8 Sh 18 ~50 Bulk water intrusion related to inadequate detailing
Mixed-humid climate Weber & Reichel 1942
Washington,DC
Test structure 2 wk (winter)
7 Sh — 6 ~60 Condensation in wall cavities without interior vapor retarder
Moses & Scheffer 1962
Baltimore, MD Survey Aug 97 BP, St — <12 ≤30
Moses & Scheffer 1962
Memphis, TN Survey Jan 59 BP, St — <12 ≤30
Duff 1971 Athens, GA Test structure Jun 4 Sh — 10 13 Sensors at interface between insulation and interior vapor retarder showed daily period of high RH
Duff 1972 Athens, GA Test structure 1 yr 12 Sh, St — 10 25 Highest MC occurred in sheathing during winter
34
12
Table 23—Summary of studies reporting moisture contents in wall framing and sheathing by climatic region Moisture content (%)
Reference LocationType of study Duration Na
Measurement locationb Mean Minimum Maximumc Trends
Hot-humid climate Moses & Scheffer 1962
Southeastern US
Survey Aug–Oct 78 BP, St — <12 ≤30
Moses & Scheffer 1962
Gulf Coast Survey Oct–Dec 255 BP, St — <12 >30
Sherwood1985, 1987
Gulfport, MS Test structure 2 yr 8 BP, Sh, St, TP — 8 >20 Higher MC in walls penetrated by electrical outlets Highest summer MC in
walls with fiberboard sheathing Higher summer MC in
walls with wood-based sheathing than with exterior insulating sheathing
TenWoldeand Mei 1986
Beaumont, TX Test structure Apr–Nov 9 RH sensors at interfaces between
materials in wall cavity
— — — Walls remained dry with an exterior vapor retarder or without any vapor retarder either inside or outside Wall with interior vapor
retarder experienced daily cyclical condensation
Mei 1988 Beaumont, TX Test structure Jun–Oct 9 RH sensors at interfaces between
materials in wall cavity
— — — Ventilation between cladding and sheathing reduced moisture flow into wall cavity Daily cyclical
condensation at interior vapor retarder in wall with brick veneer but not plywood siding
Crandell & Kenney 1996
Wilmington,NC
Survey Aug 8 Sh 18 ~50 Bulk water intrusion related to inadequate detailing
Mixed-humid climate Weber & Reichel 1942
Washington,DC
Test structure 2 wk (winter)
7 Sh — 6 ~60 Condensation in wall cavities without interior vapor retarder
Moses & Scheffer 1962
Baltimore, MD Survey Aug 97 BP, St — <12 ≤30
Moses & Scheffer 1962
Memphis, TN Survey Jan 59 BP, St — <12 ≤30
Duff 1971 Athens, GA Test structure Jun 4 Sh — 10 13 Sensors at interface between insulation and interior vapor retarder showed daily period of high RH
Duff 1972 Athens, GA Test structure 1 yr 12 Sh, St — 10 25 Highest MC occurred in sheathing during winter
13
in wall without vapor retarder Daily periodic high RH
occurred at interface between insulation and interior vapor retarder during summer
Marine climate Moses & Scheffer 1962
Southern CA Survey Mar–Apr 98 BP, St — <12 >30
Moses & Scheffer 1962
Oregon & Washington
Survey Apr–Jun 20 BP — <12 <20
Tsongas1980
Portland, OR Survey Feb–Apr 93 BP, Sh, St, TP 11.8 6 20 MC > 30% due to bulk water leakage not included No significant difference
in MC between insulated and uninsulated homes
Tsongas1990
WashingtonCoast
Survey Winter 16 BP, Sh, St, TP
19.2 9 ~40
Tsongas1990
Seattle-Olympia, WA
Survey Winter 50 BP, Sh, St, TP
15.4 8 ~50
Correlation between high indoor RH and high wood MC Sheathing generally
wetter than framing Lower MC in walls with
exterior insulating sheathing
Murray & Tichy 2006
Puyallup, WA Test structure 1 yr 12 Not specified — 8 >30 Highest MC in wall without vapor retarder Low MC in walls with
exterior insulating sheathing Low MC in walls with
ventilated space between cladding and sheathing
Cold climate Teesdale 1959
Madison, WI Test structure Oct–Jun 3 Sh — 11 47 MC increased in order ofinsulated wall with vapor retarder < uninsulated wall (no vapor retarder) < insulated wall with no vapor retarder
Moses & Scheffer 1962
Chicago, IL & Madison, WI
Survey Jan 6 BP — <12 <20
Duff 1968 Madison, WI Test structure 2 yr 3 Sh, St — 7 ~60 MC increased in order ofwall with “good” vapor retarder < wall with punctured vapor retarder < wall with no vapor retarder
Wang 1981 Various Survey Winter >70 St — ≤7 <15 No appreciable differences in MC between walls sheathed with extruded polystyrene, wood fiberboard, and plywood
35
12
Table 23—Summary of studies reporting moisture contents in wall framing and sheathing by climatic region Moisture content (%)
Reference LocationType of study Duration Na
Measurement locationb Mean Minimum Maximumc Trends
Hot-humid climate Moses & Scheffer 1962
Southeastern US
Survey Aug–Oct 78 BP, St — <12 ≤30
Moses & Scheffer 1962
Gulf Coast Survey Oct–Dec 255 BP, St — <12 >30
Sherwood1985, 1987
Gulfport, MS Test structure 2 yr 8 BP, Sh, St, TP — 8 >20 Higher MC in walls penetrated by electrical outlets Highest summer MC in
walls with fiberboard sheathing Higher summer MC in
walls with wood-based sheathing than with exterior insulating sheathing
TenWoldeand Mei 1986
Beaumont, TX Test structure Apr–Nov 9 RH sensors at interfaces between
materials in wall cavity
— — — Walls remained dry with an exterior vapor retarder or without any vapor retarder either inside or outside Wall with interior vapor
retarder experienced daily cyclical condensation
Mei 1988 Beaumont, TX Test structure Jun–Oct 9 RH sensors at interfaces between
materials in wall cavity
— — — Ventilation between cladding and sheathing reduced moisture flow into wall cavity Daily cyclical
condensation at interior vapor retarder in wall with brick veneer but not plywood siding
Crandell & Kenney 1996
Wilmington,NC
Survey Aug 8 Sh 18 ~50 Bulk water intrusion related to inadequate detailing
Mixed-humid climate Weber & Reichel 1942
Washington,DC
Test structure 2 wk (winter)
7 Sh — 6 ~60 Condensation in wall cavities without interior vapor retarder
Moses & Scheffer 1962
Baltimore, MD Survey Aug 97 BP, St — <12 ≤30
Moses & Scheffer 1962
Memphis, TN Survey Jan 59 BP, St — <12 ≤30
Duff 1971 Athens, GA Test structure Jun 4 Sh — 10 13 Sensors at interface between insulation and interior vapor retarder showed daily period of high RH
Duff 1972 Athens, GA Test structure 1 yr 12 Sh, St — 10 25 Highest MC occurred in sheathing during winter
14
MarshallMacklin Monaghan1983
Canada—various
provinces
Survey Not specified
201 Sh, St — <15 >22 High MC readings correlated with high indoor RH Higher MCs in second
floor than first floor Moisture accumulation
in sheathing correlated with exposure to wind-driven rain and exposure to wind
Sherwood1983, 1987
Madison, WI Test structure 2 yr 8 BP, Sh, St, TP — 8 >20 Condensation found in walls with kraft paper but not polyethylene vapor retarders When electrical outlets
were added, localized condensation found on sheathing surface behind outlet
Tsongas1984
Spokane, WA Survey Dec–Feb 103 BP, Sh, St 11.3 6.5 >30 No significant difference in MC between insulated and uninsulated walls, or between walls with different types of insulation Sheathing consistently
wetter than framing MC > 20% attributed
mainly to splash wetting, wood members in contact with ground, and bulk water leaks
Platts 1988 Canada—various
provinces
Survey Oct 1900 BP, Sh, St — — >30 Higher incidence of high MC in coastal provinces than inland provinces High MC attributed to
rainwater intrusion or excessive indoor RH in winter In coastal provinces,
high MC attributed to wind-induced exfiltration of humid indoor air through leaks on lee side of house
Tsongas1990
Montana Survey Winter 20 BP, Sh, St 12.8 6 ~50 Sheathing wetter than framing All wood members dried
to MC < 8% by august Tsongas & Nelson 1991
Helena, MT Forensic Feb–Apr 1 Sh — 6 ~50 Locations of high MC correlated with locations of major air leakage
TenWoldeet al. 1995
Madison, WI Test structure Nov–Feb 10 Sh, inside surface
— <8 >30 MC generally increased as indoor RH increased from 35% to 45% RH Condensation observed
only when indoor RH was 45% Ventilation of the
insulated cavity did not
36
12
Table 23—Summary of studies reporting moisture contents in wall framing and sheathing by climatic region Moisture content (%)
Reference LocationType of study Duration Na
Measurement locationb Mean Minimum Maximumc Trends
Hot-humid climate Moses & Scheffer 1962
Southeastern US
Survey Aug–Oct 78 BP, St — <12 ≤30
Moses & Scheffer 1962
Gulf Coast Survey Oct–Dec 255 BP, St — <12 >30
Sherwood1985, 1987
Gulfport, MS Test structure 2 yr 8 BP, Sh, St, TP — 8 >20 Higher MC in walls penetrated by electrical outlets Highest summer MC in
walls with fiberboard sheathing Higher summer MC in
walls with wood-based sheathing than with exterior insulating sheathing
TenWoldeand Mei 1986
Beaumont, TX Test structure Apr–Nov 9 RH sensors at interfaces between
materials in wall cavity
— — — Walls remained dry with an exterior vapor retarder or without any vapor retarder either inside or outside Wall with interior vapor
retarder experienced daily cyclical condensation
Mei 1988 Beaumont, TX Test structure Jun–Oct 9 RH sensors at interfaces between
materials in wall cavity
— — — Ventilation between cladding and sheathing reduced moisture flow into wall cavity Daily cyclical
condensation at interior vapor retarder in wall with brick veneer but not plywood siding
Crandell & Kenney 1996
Wilmington,NC
Survey Aug 8 Sh 18 ~50 Bulk water intrusion related to inadequate detailing
Mixed-humid climate Weber & Reichel 1942
Washington,DC
Test structure 2 wk (winter)
7 Sh — 6 ~60 Condensation in wall cavities without interior vapor retarder
Moses & Scheffer 1962
Baltimore, MD Survey Aug 97 BP, St — <12 ≤30
Moses & Scheffer 1962
Memphis, TN Survey Jan 59 BP, St — <12 ≤30
Duff 1971 Athens, GA Test structure Jun 4 Sh — 10 13 Sensors at interface between insulation and interior vapor retarder showed daily period of high RH
Duff 1972 Athens, GA Test structure 1 yr 12 Sh, St — 10 25 Highest MC occurred in sheathing during winter
15
consistently promote drying whereas ventilation between siding and sheathing was effective
Tsongas & Olson 1995
Wisconsin Forensic Winter, spring,summer
17 Sh — — ~80 Plywood sheathing had mold, decay, delamination, but framing was generally not harmed
Rose & McCaa 1998
Champaign, IL Test structure 3 yr 16 Sh — 6 35 MC and temperature increased with increasing height in any given cavity Cavities without vapor
retarders had high winter MC, mold growth, and nail corrosion MC generally decreased
as indoor RH decreased from 50% to 40% RH
Straube & Burnett1998
Waterloo, ON Test structure 2 yr 2 BP, St, TP — 9 20 Low MC in framing of wall with low-permeance sheathing Ventilation between
brick cladding and high-permeance sheathing reduced framing MC during summer
Chouinard& Lawton 2001
Nova Scotia, Ontario
Forensic — 3 Framing and Sh
— 10 >25 Bulk water intrusion related to inadequate detailing
Cautley 2004
Madison, WI Field experiment
10 mo 1 BP, Sh, St, TP, window
framing
— <8 >30 Lowest winter MCs in airtight walls with polyethylene vapor retarder In walls without airtight
construction or vapor retarder, high MC in winter followed by drying in springtime In same walls, highest
framing MC found in outer bottom plates Leaky walls dried faster
than airtight walls Rapid, localized wetting
observed in framing below windows following rainfall
a For surveys and forensic investigations, N is number of buildings sampled; for test structures, N is number of wall configurations. b Moisture content measurements above 30% by electrical resistance are approximate (see Section 1.4). c BP, bottom plate; Sh, exterior sheathing; St, stud; TP, top plate.
37
summer, unless there is excessive rainwater intrusion. However, in some cases, the design or construction of the wall prevents effective drying.
4. In cold and marine climates, framing members in in-sulated walls generally do not accumulate as much moisture as the exterior sheathing. During winter, the cold side of framing members tends to be wetter than the warm side for the reasons discussed above. Drying usually occurs in spring and summer.
5. In hot-humid climates, the significant moisture trans-port mechanisms (besides rainwater intrusion) are in-filtration of humid outdoor air and inward diffusion of water vapor through wall cavities lacking effective air barriers and (exterior) vapor retarders, the opposite of cold climates in winter. In addition, solar radiation can drive moisture from the exterior sheathing into the wall cavity. When a vapor retarder is placed on the interior (cold side) of an insulated wall cavity, condensation can occur on the vapor retarder.
6. All studies that have investigated the effect of a venti-lated space between the sheathing and cladding have
found that this feature reduces moisture accumulation in the wall.
7. When bottom plates are in direct contact with concrete slab foundations (no capillary break), moisture can be absorbed by the bottom plate, resulting in MCs near 30%.
4 Roof Framing and SheathingIn this section we discuss measurements of wood moisture content and temperature in roof framing and sheathing. Again, many factors influence the conditions in roof mem-bers: climate, including solar radiation, outdoor temperature, and humidity; the design and construction of the roof, in-cluding attic ventilation; and the properties of the materials and roof system as a whole, including moisture transfer from the living space to the attic by diffusion or air leakage. Several types of roof construction are common: (1) attics, in which insulation is placed over a flat ceiling; (2) cathedral ceilings, in which the ceiling is sloped (usually parallel to the roof but not necessarily); and (3) for lack of a better term, “cathedralized” attics, in which the ceiling is flat 16
Table 24—Summary of studies reporting moisture contents in bottom plates Moisture content (%)
Reference Location Type of study Duration Na Foundationb Mean Minimum Maximum
Moses & Scheffer 1962 Southeastern U.S. Survey Aug–Oct 73 Slab — <12 ≤30Moses & Scheffer 1962 Gulf Coast Survey Oct–Dec 249 Slab — <12 >30 Moses & Scheffer 1962 Baltimore, MD Survey Aug 54 Slab — <12 ≤30Moses & Scheffer 1962 Memphis, TN Survey Jan 58 Slab — <12 ≤30Moses & Scheffer 1962 Southern CA Survey Mar–Apr 84 Slab — <12 >30 Moses & Scheffer 1962 Oregon & Washington Survey Apr–Jun 20 Slab — <12 <20 Moses & Scheffer 1962 Chicago, IL & Madison, WI Survey Jan 6 Slab — <12 <20 Tsongas 1980 Portland, OR Survey Feb–Apr 346 B, CS 12.2 7 20 Tsongas 1984 Spokane, WA Survey Winter 608 B, CS 11.0 6.5 26 Tsongas 1990 Montana Survey Winter 38 B, CS 12.0 8 19 Tsongas 1990 Seattle–Olympia, WA Survey Winter 90 B, CS 15.5 10 26 Tsongas 1990 Washington Coast Survey Winter 31 B, CS 18.9 10 28 Cautley 2004 Madison, WI Field experiment 10 mo. — — — <8 >25 a Number of measurements. b B, basement; CS, crawlspace.
Table 25—Summary of studies reporting moisture contents in top plates Moisture content (%)
Reference Location Type of study Duration Na Mean Minimum Maximum
Cautley 2004 Madison, WI Field experiment 10 mo. — — <8 >14
a Number of measurements.
38
17
Table 26—Summary of studies reporting moisture contents in studs Moisture content (%)
Reference Location Type of study Duration Na Mean Minimum Maximumb
Moses & Scheffer 1962 Southeastern U.S. Survey Aug–Oct 5 — <12 <20 Moses & Scheffer 1962 Gulf Coast Survey Oct–Dec 6 — <12 <20 Moses & Scheffer 1962 Baltimore, MD Survey Aug 41 — <12 <20 Moses & Scheffer 1962 Memphis, TN Survey Jan 1 — ≥12 <20 Moses & Scheffer 1962 Southern CA Survey Mar–Apr 14 — <12 <20 Duff 1968 Madison, WI Test structure 2 yr 3 — 7 17 Duff 1972 Athens, GA Test structure 1 yr 12 — 10 13 Tsongas 1980 Portland, OR Survey Feb–Apr 705 11.6 6 19 Wang 1981 Various Survey Winter 70 — ≤7 <15 Marshall Macklin Monaghan 1983 Canada—various provinces Survey Not specified 201 — <15 >22 Tsongas 1984 Spokane, WA Survey Winter 1,217 10.7 6.5 24 Tsongas 1990 Montana Survey Winter 114 12.4 6 34 Tsongas 1990 Seattle–Olympia, WA Survey Winter 300 14.8 9 26 Tsongas 1990 Washington Coast Survey Winter 96 18.6 10 ~40 Straube & Burnett 1998 Waterloo, ON Test structure 2 yr 2 — 9 20 Cautley 2004 Madison, WI Field experiment 10 mo. 12 — <8 >16 a For surveys, N is number of buildings sampled or number of measurements; for test structures and field experiments, N is number of wall configurations. b MC readings above 30% by electrical resistance are approximate (see Section 1.4).
Table 27—Summary of studies reporting moisture contents in wall sheathing Moisture content (%)
Reference Location Type of study Duration Na Mean Minimum Maximumb
Weber & Reichel 1942 Washington, DC Test structure 2 wk (winter) 7 — 6 ~60 Teesdale 1959 Madison, WI Test structure Oct–Jun 3 — 11 47 Duff 1968 Madison, WI Test structure 2 yr 3 — 12 ~60 Duff 1971, 1972 Athens, GA Test structure 1 yr 12 — 10 25 Tsongas 1980 Portland, OR Survey Feb–Apr 294 12.2 6 18 Marshall Macklin Monaghan 1983
Canada—various provinces Survey Not specified 201 — <15 >22
Sherwood 1983 Madison, WI Test structure 2 yr 8 — 8 >20 Tsongas 1984 Spokane, WA Survey Winter 566 13.0 6.5 >30 Sherwood 1985 Gulfport, MS Test structure 2 yr 8 — 8 >20 Tsongas 1990 Montana Survey Winter 30 15.5 8 ~50 Tsongas 1990 Seattle–Olympia, WA Survey Winter 101 18.1 9 ~50 Tsongas 1990 Washington Coast Survey Winter 41 20.6 9 32 Tsongas & Nelson 1991 Helena, MT Forensic Feb–Apr 120 — 6 ~50 TenWolde et al. 1995 Madison, WI Test structure Nov–Feb 10 — <8 >30 Tsongas & Olson 1995 Wisconsin Forensic Winter, spring, summer 17 — — ~80 Crandell & Kenney 1996 Wilmington, NC Forensic Aug 8 — 18 ~50 Rose & McCaa 1998 Champaign, IL Test structure 3 yr 16 — 6 35 Cautley 2004 Madison, WI Field experiment 10 mo. 1 — <8 >25
18
a For surveys, field experiments, and forensic investigations, N is number of buildings sampled or number of measurements; for test structures, N is number of wall configurations. b MC readings above 30% by electrical resistance are approximate (see Section 1.4).
Table 28—Reported moisture content ranges in roof members of house G in New Jersey by season (Harrje et al. 1986) Moisture content range (%)
Roof member Winter Spring Summer Fall
Sheathing, north slope 13–18 7–13 5–7 7–13 Sheathing, south slope 9–11 7–10 5–7 7–10 Rafters 9–11 7–10 5–7 7–10
Table 29—Average, minimum, and maximum moisture contents reported in roof members of house P in New Jersey (Harrje et al. 1986)
Moisture content (%)
Date Measurements Average Minimum Maximuma
3/7/1983 22 21.2 14 ~40 5/2/1983 16 12.0 11 14 5/9/1983 9 11.1 10 12 5/23/1983 9 11.7 11 13 a MC readings above 30% by electrical resistance are approximate (see
Section 1.4).
Table 30—Reported roof sheathing moisture contents and relative humidity of attic air during February in houses in Madison, Wisconsin (Jordan et al. 1948) Moisture content (%)
HouseVent area
ratioVapor
retarder Average Minimum MaximumAverage RH (%)
A 1:770 No 18.2 16.5 19.4 84 B --- Yes 11.1 10.1 11.5 59 C 1:430 No 10.5 9.9 11.1 55
Table 31—Reported “typical” moisture content ranges in roof members of Ontario and Prince Edward Island houses by season (Buchan, Lawton, Parent 1991) Moisture content range (%)
but insulation is placed beneath the roof sheathing, making the attic part of the conditioned space. Rose (1995b) provides a historical overview of attic ventilation, and TenWolde and Rose (1999) and Lstiburek (2006b) discuss various design options in relation to advantages and disad-vantages of ventilation.
4.1 Mixed-Humid ClimateHarrje et al. (1986) monitored moisture conditions in two houses with attics in New Jersey. The first house (denoted G) had plywood roof sheathing; the second (P) had tongue-and-groove lumber decking. Moisture content was measured with two types of electrical resistance probes in the roof sheathing, rafters, and ceiling joists, with generally good agreement between the two probes. Both houses showed a seasonal trend, with high moisture contents in winter that fell during spring, reached minima in summer, and rose again in fall. Table 28 summarizes the measurements in the G house and indicates the importance of solar radiation in drying the sheathing, as seen in the different winter maxima for the north and south slopes. Table 29 summarizes the data for the P house, which had previously experienced attic con-densation problems, with ceiling damage and mold growth on the underside of the roof where air leakage occurred from a bathroom into the attic. No wood decay or structural damage was observed, likely because the high moisture contents coincided with cold temperatures. Unfortunately, temperatures were not reported.
Levins et al. (1989) measured moisture contents of wood truss members during winter in three houses near Oak Ridge, Tennessee. These houses were constructed with attics containing radiant barriers. Several variables were investi-gated:
• Indoor relative humidity—45% or 55% RH• Placement of the radiant barrier—above the insulation
or attached to the trusses• Presence of a vapor retarder (kraft paper facing on the
insulation)• Amount of attic ventilation—1:150 or 1:300 area ratio
(net vent area to floor area)
Moisture content values were generally in the 7–11% range, with only slight differences due to indoor relative humid-ity and ventilation. Temperature and relative humidity were also measured at the bottom of the insulation, at the top of the insulation, and in air a foot above the radiant barrier. A diurnal cycle was observed in which moisture condensed on the bottom surface of the radiant barrier when the outdoor temperature dropped below 35°F (2°C) and then dissipated in the afternoon. (The radiant barrier had perforations of 0.040-in. (1-mm) diameter that allowed water vapor to es-cape.) They did not observe any wet insulation or staining on the ceiling. They found that more moisture condensed in the house when the indoor RH was 55% than 45%. Reduc-ing the attic ventilation area did not significantly change the moisture levels. More condensation was observed over the
bathrooms than elsewhere; this was attributed to air leakage through penetrations for plumbing and exhaust fan ducting.
Winandy et al. (2000) monitored conditions in the sheathing and rafters of five test structures in Starkville, Mississippi, over a 4-year period. The 12- by 16-ft (3.7- by 4.9-m) struc-tures had a 3:12 pitched roof with black fiberglass shingles and felt over 3/4-in. (19-mm) plywood sheathing supported by 2 by 6 rafters. The structures differed significantly from residential attic construction: they were essentially enclosed, unventilated sheds with no ceiling and thus no ceiling insu-lation (radiative exchange between the roof sheathing and the floor was possible). Temperatures were measured in various locations with thermocouples, and moisture content readings were acquired every 2 weeks with a resistance-type meter. Two of the structures were humidified to above 85% RH during most of the day, while the remaining three structures were not humidified. The moisture content of the plywood roof sheathing in the “dry” structures was between 2% and 5% during summer and between 3% and 8% during winter. Maximum temperatures at the top of the plywood, bottom of the plywood, and within the rafters were 172°F (78°C), 145°F (63°C), and 136°F (58°C), respectively. Cor-responding minimum temperatures were –2°F (–19°C), 1°F (–17°C), and 3°F (–16°C). In the “wet” structures, the plywood MCs ranged from 4% to 12% in summer and from 6% to 20% in winter. Maximum temperatures at the top of the plywood, bottom of the plywood, and within the rafters were 165°F (74°C), 136°F (58°C), and 129°F (54°C), re-spectively. Corresponding minimum temperatures were 0°F (–18°C), 3°F (–16°C), and 5°F (–15°C).
4.2 Hot-Dry ClimateMoisture problems were reported in new energy-efficient houses with wood truss-framed low-slope roofs and light-colored membrane roofing in the desert southwest (Holladay 2006b). The roof sheathing was typically OSB with R-38 fiberglass batt insulation directly beneath it. Measurements showed that during winter, the OSB sheathing was 5–7°F (3–4°C) colder than the outdoor air at night, which was at-tributed to radiant heat loss from the roof surface. Moisture contents greater than 30% were measured, the fiberglass in-sulation was found to be totally wet, and mold was growing on the bottom side of the sheathing. The relatively cold roof sheathing was evidently acting as a condensing surface at night. The primary moisture source was not identified with certainty,18 but unexpectedly high indoor humidities were observed by at least one investigator. Construction moisture from concrete, adobe block, and wet-spray cellulose insula-tion were implicated as sources for indoor humidity. The white roof surfaces, which can reflect as much as 80% of the incident solar radiation, apparently did not absorb enough heat during the daytime for the OSB to dry out.
�8The article by Holladay (2006b) made no mention of whether nighttime surface temperatures dropped as low as exterior dew point temperature, or whether overnight dew formation on exterior roof surfaces was observed.
40
4.3 Marine ClimateTsongas and Bolme (1988) conducted a field investigation of roof moisture damage in three state-owned buildings in Trail, Oregon. The buildings had low-sloped roofs of wood-frame construction with plywood inner and outer sheath-ing, R-11 fiberglass batt insulation, and a rubber membrane covering the outer plywood surface. Moisture contents were measured with a resistance-type meter in the plywood sheathing and in laminated wood beams. Values from as low as 7% MC to as high as 30% MC were observed. The wet sites were attributed to leakage of water into the roof cavity through cracks in the deteriorated rubber membrane. Wood decay and structural damage in the roof were also observed.
Sheltair Scientific Ltd. (1997) measured temperature and moisture conditions in two pairs of houses in Vancouver, British Columbia. Each pair was constructed by the same builder, one with attic ventilation and the other without. Moisture contents were measured in roof sheathing and truss members using a resistance-type meter on a monthly basis from September through March. The highest moisture levels were found in the sheathing of north-facing slopes in midwinter, the same trend observed by Harrje et al. (1986). In the first pair of houses, the sheathing rose from a low of 8% MC in September to highs of 25% MC and 30% MC in February for the nonvented and vented attics, respectively. By March, these levels fell to 17–19% MC. In the second pair, the September MC values were 10–11% and rose to 18% and 15% for the nonvented and vented attics, respec-tively. The houses with higher indoor relative humidity lev-els showed higher moisture levels in attic wood members,
irrespective of attic ventilation. Truss members typically remained at lower moisture contents than sheathing, with values between 8% and 14% MC, and no significant differ-ences between vented and nonvented attics.
4.4 Cold ClimateJordan et al. (1948) investigated the effects of attic ventila-tion and the presence of a ceiling vapor retarder on roof sheathing moisture content. Three adjacent houses in Madi-son, Wisconsin, were monitored several times a week during the month of February. Temperature and relative humidity were measured in various locations in the living space and attic. In addition, moisture content was measured gravi-metrically using thin wood strips that were installed below the roof sheathing. All houses had loose-fill insulation above the ceiling to depths of 5–6 in. (130–150 mm). Table 30 gives wood moisture contents and attic relative humiditys for each house. House A was known to have had prior condensation both in the attic and in the walls, which was related to high humidity in the living space. House B was the only one with a vapor retarder between the living space and attic, and there were no signs of condensation problems. The attic vents were closed partway through the study. House C also did not have evidence of prior attic condensation. The authors attributed the low attic relative humidity and moisture content to the low humidity in the living space rather than attic ventilation. The wood moisture content and attic relative humidity for the three houses cor-related well with the relative humidity in the living space.
Marshall Macklin Monaghan Ltd. (1983) conducted a sur-vey of 201 government-financed housing units with reported
18
a For surveys, field experiments, and forensic investigations, N is number of buildings sampled or number of measurements; for test structures, N is number of wall configurations. b MC readings above 30% by electrical resistance are approximate (see Section 1.4).
Table 28—Reported moisture content ranges in roof members of house G in New Jersey by season (Harrje et al. 1986) Moisture content range (%)
Roof member Winter Spring Summer Fall
Sheathing, north slope 13–18 7–13 5–7 7–13 Sheathing, south slope 9–11 7–10 5–7 7–10 Rafters 9–11 7–10 5–7 7–10
Table 29—Average, minimum, and maximum moisture contents reported in roof members of house P in New Jersey (Harrje et al. 1986)
Moisture content (%)
Date Measurements Average Minimum Maximuma
3/7/1983 22 21.2 14 ~40 5/2/1983 16 12.0 11 14 5/9/1983 9 11.1 10 12 5/23/1983 9 11.7 11 13 a MC readings above 30% by electrical resistance are approximate (see
Section 1.4).
Table 30—Reported roof sheathing moisture contents and relative humidity of attic air during February in houses in Madison, Wisconsin (Jordan et al. 1948) Moisture content (%)
HouseVent area
ratioVapor
retarder Average Minimum MaximumAverage RH (%)
A 1:770 No 18.2 16.5 19.4 84 B --- Yes 11.1 10.1 11.5 59 C 1:430 No 10.5 9.9 11.1 55
Table 31—Reported “typical” moisture content ranges in roof members of Ontario and Prince Edward Island houses by season (Buchan, Lawton, Parent 1991) Moisture content range (%)
moisture damage throughout Canada (as described in Section 3.4). Single point-in-time moisture content measure-ments were made in roof sheathing and framing members of houses with accessible attics (the time of year was not speci-fied). Of the 44 readings taken, 57% were below 15% MC and 14% were above 22% MC. High moisture readings were associated with colder weather, wind-driven rain, and low solar gain. Poor attic ventilation was commonly found in houses with high attic moisture. Mold was present in all the attics sampled, and 39% of these showed “major” growth, where mold covered more than 50% of the sheathing.
An attic moisture survey of 15 houses in Ottawa, Ontario, and 5 houses in Charlottetown, Prince Edward Island, was conducted by Buchan, Lawton, Parent Ltd. (1991). These 20 houses spanned a range of ages, types of construction, and types of attic ventilation. Moisture contents were mea-sured in attic wood members with a resistance-type meter; temperatures were measured with thermocouples. Locations monitored included gable ends, ceiling joists, and trusses. In addition, roof sheathing was monitored with a surface moisture probe. Other parameters were measured, including indoor relative humidity and temperature and air exchange rates for the house and attic.
The same seasonal trend observed in the studies above was also found here: wood moisture levels tended to increase in the winter and fall rapidly in spring. The houses were cat-egorized as “wet”—having values above 30% MC in the sheathing and at least one framing member—or “dry” —having all values at or below 20% MC. Four houses fell into the “wet” category, six into the “dry” category, and ten were in between. Table 31 lists the range of moisture contents typically found in the “wet” and “dry” attics. A sig-nificant observation was that high attic moisture levels were correlated with high indoor humidity levels, in agreement with the findings of Sheltair Scientific Ltd. (1997).
Rose (1992) measured temperature and sheathing moisture content in attic assemblies of a test facility in central Illi-nois. The structure had eight separate bays, each 20 by 8 ft (6.1 by 2.4 m), that were configured to test various types of residential construction. Five bays had flat-ceiling truss-framed construction and three had cathedral ceilings. Other variables under study were the following:
• Venting—with or without ridge and soffit vents• Airtightness of the ceiling—capped or uncapped 1.5-in.
(38-mm) round openings in ceilings that tested as es-sentially airtight with the openings capped19
• Placement of insulation in cathedral ceilings—with or without an airspace between the top of the insulation and bottom of the roof sheathing (termed “slotted” versus “stuffed”)
��Although all ceilings had these controllable openings, the effect of capping versus uncapping them was more extensively investigated for cathedral ceilings than for attic spaces.
The roof pitch was 5:12, the sheathing was 7/16-in. (11-mm) OSB, and the shingles were reinforced asphalt triple-tab, ei-ther black or white. The interior of each bay was faced with 1/2-in. (12-mm) gypsum board. Each bay was individually conditioned: in summer, the indoor temperature was main-tained at 75°F (24°C) with humidity uncontrolled; in winter, the bays were heated to 70°F (21°C) and humidified to 50% RH.
Temperature at the top and bottom sides of the OSB sheath-ing was measured in several locations using thermocouples. Sheathing moisture content was monitored using modified wood electrical resistance probes (Duff 1966) both at the surface and embedded in the OSB. As was observed in other studies, sheathing moisture conditions peaked during the winter. When openings in the ceiling were capped, thereby blocking airflow between the conditioned room and the attic or cathedral ceiling cavity, the moisture content of the roof sheathing was between 10% and 18% for most of the winter, with a minimum of 8% and a maximum of 22%. Flat-ceiling attics (which had capped openings) showed little difference in moisture content whether vented or not vented; in con-trast, cathedral ceilings with capped openings generally had drier sheathing if ventilated than if not.
When openings in cathedral ceilings were uncapped during the winter, thereby allowing exfiltration from the condi-tioned room, sheathing moisture contents increased. Mois-ture conditions depended on three factors: location within the cathedral ceiling cavity relative to the uncapped open-ing, whether the cavity was vented or unvented, and whether there was an airspace between the insulation and the sheath-ing. In addition, these three factors apparently interacted. Nevertheless, Rose was able to conclude that the vented–slotted configuration maintained the driest conditions during the winter when an opening in the ceiling was present. Some of the less desirable cathedral ceiling configurations resulted in sheathing moisture contents exceeding 30% for signifi-cant periods when an opening in the ceiling was present. An overarching finding of the study was that moisture and tem-perature conditions in cathedral ceiling cavities were more variable than in attics, and thus less likely to remain within a moderate range.
Maximum summer temperatures were reported for the top side of the roof sheathing. The maximum values, which varied with shingle color, type of construction (attic or ca-thedral ceiling) and ventilation, ranged from 148°F (64°C) to 186°F (86°C).
Rose (1995a) also investigated “cathedralized” attic con-struction in which the insulation was placed against the underside of the roof sheathing rather than on top of the flat ceiling. He modified two bays of the test facility described above and measured temperature and moisture content in the sheathing over a 2-year period. The variables in this study were the following:
42
• Ventilation or no ventilation of the cavity• Continuous air chute construction or stuffed insulation
construction• Open joints in exposed kraft paper facing of insulation
or taped joints
Sheathing moisture contents averaged around 16% during the winter. The variable with the largest impact on sheathing moisture was the air chute (with or without venting). The overall average for the cavities with air chutes was ~10% MC, with values from less than 6% to ~15%, whereas for the cavities without air chutes the average was ~22% MC, with values from less than 6% to greater than 30%. Taping the kraft facing of the insulation and venting the cavity had only small effects on moisture levels.
Summer average temperatures at the top of the sheath-ing were between 83°F (28°C) and 88°F (31°C), whereas maximum temperatures ranged from 150°F (66°C) to 178°F (81°C). The temperature performance of cathedralized attic assemblies was similar to that of cathedral ceilings. Venting did help maintain lower temperatures, though the reduction in temperature was seen most strongly on the parts of roof closest to the eaves.
Further measurements were carried out in this test facility and were used to verify a roof temperature and moisture model (TenWolde 1997). Data were reported only for Bay 2, which had flat-ceiling attic construction, black shingles, sol-id vinyl soffit panels, no ridge vent, and no ceiling penetra-tions. Moisture contents in the sheathing of the north-facing roof slope were between 7% and 11% during February and between 5% and 8% during May. Temperatures measured at the top surface of the sheathing in May cycled between lows of 40–60°F (4–16°C) at night and highs between ~70°F (21°C) and ~140°F (60°C) during the day.
Winandy et al. (2000) monitored conditions in the sheathing and rafters of five test structures near Madison, Wisconsin, over an 8-year period. The structures and test methodol-ogy were the same as described in Section 4.1, except that one structure had white shingles rather than black. One of the black-shingled structures was humidified to above 85% RH for most of the day from April to October. The mois-ture content of the plywood roof sheathing was typically between 13% and 16% during winter and between 8% and 12% during summer. No difference between humidified and non-humidified buildings was reported. Maximum tempera-tures for the top of the plywood, the bottom of the plywood, and the rafters were 147–167°F (64–75°C), 127–138°F (53–59°C), and 120–129°F (49–54°C), respectively; the higher temperatures were observed in roofs with black shingles. There was little variation in minimum temperatures at the various measurement locations, with values between –38°F (–39°C) and –26°F (–32°C). Similarly, yearly average tem-peratures were between 50°F (10°C) and 55°F (13°C).
4.5 Very Cold ClimateSheltair Scientific Ltd. (1997) measured temperature and moisture conditions in two pairs of houses in Edmonton, Alberta. Each pair was constructed by the same builder, one with attic ventilation and the other without. Moisture con-tents were measured in roof sheathing and truss members using a resistance-type meter on a monthly basis from Sep-tember through March. In the first pair of houses, the sheath-ing moisture content rose from lows of 8% and 12% MC in September and October to highs of 13% and 18% MC in January and February for the nonvented and vented attics, respectively. By March, these levels fell to 9% MC. In the second pair, the minimum MC values were 10% and 7% and rose to 16% and 10% for the nonvented and vented attics,
18
a For surveys, field experiments, and forensic investigations, N is number of buildings sampled or number of measurements; for test structures, N is number of wall configurations. b MC readings above 30% by electrical resistance are approximate (see Section 1.4).
Table 28—Reported moisture content ranges in roof members of house G in New Jersey by season (Harrje et al. 1986) Moisture content range (%)
Roof member Winter Spring Summer Fall
Sheathing, north slope 13–18 7–13 5–7 7–13 Sheathing, south slope 9–11 7–10 5–7 7–10 Rafters 9–11 7–10 5–7 7–10
Table 29—Average, minimum, and maximum moisture contents reported in roof members of house P in New Jersey (Harrje et al. 1986)
Moisture content (%)
Date Measurements Average Minimum Maximuma
3/7/1983 22 21.2 14 ~40 5/2/1983 16 12.0 11 14 5/9/1983 9 11.1 10 12 5/23/1983 9 11.7 11 13 a MC readings above 30% by electrical resistance are approximate (see
Section 1.4).
Table 30—Reported roof sheathing moisture contents and relative humidity of attic air during February in houses in Madison, Wisconsin (Jordan et al. 1948) Moisture content (%)
HouseVent area
ratioVapor
retarder Average Minimum MaximumAverage RH (%)
A 1:770 No 18.2 16.5 19.4 84 B --- Yes 11.1 10.1 11.5 59 C 1:430 No 10.5 9.9 11.1 55
Table 31—Reported “typical” moisture content ranges in roof members of Ontario and Prince Edward Island houses by season (Buchan, Lawton, Parent 1991) Moisture content range (%)
a For surveys, field experiments, and forensic investigations, N is number of buildings sampled or number of measurements; for test structures, N is number of wall configurations. b MC readings above 30% by electrical resistance are approximate (see Section 1.4).
Table 28—Reported moisture content ranges in roof members of house G in New Jersey by season (Harrje et al. 1986) Moisture content range (%)
Roof member Winter Spring Summer Fall
Sheathing, north slope 13–18 7–13 5–7 7–13 Sheathing, south slope 9–11 7–10 5–7 7–10 Rafters 9–11 7–10 5–7 7–10
Table 29—Average, minimum, and maximum moisture contents reported in roof members of house P in New Jersey (Harrje et al. 1986)
Moisture content (%)
Date Measurements Average Minimum Maximuma
3/7/1983 22 21.2 14 ~40 5/2/1983 16 12.0 11 14 5/9/1983 9 11.1 10 12 5/23/1983 9 11.7 11 13 a MC readings above 30% by electrical resistance are approximate (see
Section 1.4).
Table 30—Reported roof sheathing moisture contents and relative humidity of attic air during February in houses in Madison, Wisconsin (Jordan et al. 1948) Moisture content (%)
HouseVent area
ratioVapor
retarder Average Minimum MaximumAverage RH (%)
A 1:770 No 18.2 16.5 19.4 84 B --- Yes 11.1 10.1 11.5 59 C 1:430 No 10.5 9.9 11.1 55
Table 31—Reported “typical” moisture content ranges in roof members of Ontario and Prince Edward Island houses by season (Buchan, Lawton, Parent 1991) Moisture content range (%)
respectively. Truss members typically remained at lower moisture contents than sheathing, with values between 8% and 13% MC, although one value of 15% MC was observed in a vented attic. The houses with higher indoor relative humidity levels showed higher moisture levels in attic wood members, irrespective of attic ventilation.
4.6 Summary: Roof Framing and SheathingTable 32 summarizes reported moisture contents in roof framing and sheathing for each climatic region. Several conclusions can be drawn from the literature.
1. High moisture contents in roofs may occur in response to rainwater intrusion. The moisture content depends on the magnitude of the leakage and the rate at which dry-ing occurs.
2. A trend of higher moisture content during winter and lower moisture content during summer has been ob-served in roof framing and sheathing in all studies in which seasonal trends were investigated. Higher mois-ture contents have generally been found in sheathing than in rafters or trusses.
3. Wintertime moisture accumulation in roof members is worse when indoor humidity levels are high and solar gain is low. The dominant moisture transport mecha-nism is likely exfiltration of humid indoor air through ceilings lacking effective air barriers. Ventilation of the attic space has not been a dependable method of con-trolling moisture levels in roofs when air leakage is significant.
5 Exposed Wood DecksAlthough they did not specifically monitor wood decks, Moses and Scheffer (1962) did measure moisture contents of exposed wood posts and columns, porch and step rails, and step carriages (stringers) and treads. The data consist of single point-in-time measurements and were undoubt-edly influenced by the preceding weather. In all the regions surveyed (Baltimore, Maryland; southeastern United States; Gulf Coast; Memphis, Tennessee; California; Oregon; Washington; Madison, Wisconsin; and Chicago, Illinois), moisture contents above 30% were observed regularly, and the majority of readings were generally between 20% and 30% MC. In general, higher moisture contents were spa-tially located near the bases of posts and columns and near joints in rails; however, moisture contents at the centers of stair treads were similar to those near the ends, probably because of surface checks.
Lebow and Lebow (2007) recently reviewed studies that report moisture content of pine sapwood exposed outdoors in locations around the world. Several of these studies were conducted with exposed decks in North America and are summarized here.
Gaby and Duff (1978) constructed an exposed deck and rail-ing assembly at a test building in Athens, Georgia, from
2 by 6 boards of untreated southern yellow pine (SYP).20 Moisture content was measured in various locations using electrical resistance moisture probes (Duff 1966). Moisture content and temperature data were acquired every hour dur-ing periods of rain and every six hours during dry periods. In addition to weather conditions, moisture content depend-ed on the location within the board and the condition of the surface. During and after wetting, the bottom of the board was drier than the top. When surface checks were pres-ent, the rate at which water was absorbed increased. Water absorption was also rapid in the end grains of joints in the lower parts of rail members. Although data were acquired over 18 months, moisture contents were reported only for a 10-day period, with values between 10% and 30% MC. The upper limit of the moisture probes was 30%; higher levels were truncated at this value. Several alternative construction details for railings were shown to avoid water retention at end-grain surfaces.
In current construction practice, lumber that is intended for outdoor use is typically pressure-treated with chemi-cal preservatives. Treated lumber generally has a very high initial moisture content (> 50% MC) unless it is kiln-dried after treatment (KDAT) or air-dried after treatment (ADAT) prior to construction (McDonald et al. 1996). The American Wood-Preservers’ Association specifies that lumber and plywood dried after treatment shall not exceed 19% MC and 18% MC, respectively (AWPA 2006). However, KDAT-grade lumber in reality may not always meet the specifica-tion: Shupe et al. (2001) showed that the actual moisture content of KDAT No. 1 SYP treated with chromated copper arsenate (CCA) and kiln-dried untreated SYP from three suppliers ranged from 12% to well above 30% MC and that the deviation from the specified moisture content increased with the thickness of the lumber for nominal 1-, 2-, and 4-in. boards. They also showed that the CCA treatment does not affect the wood’s hygroscopicity: the ratios of adsorp-tion EMC to desorption EMC did not differ for treated and untreated wood. Recent submission of amine copper-based preservatives (copper azole and copper HDO) report no difference in hygroscopicity between treated and untreated wood (Lebow 2006). To our knowledge there are no pub-lished data on sorption behavior of other wood preserva-tives. Although the active ingredients in the wood preserva-tives discussed above do not significantly affect the response of wood to water vapor, some formulations do include water repellents that are intended to impede the uptake of liquid water.
Zahora (1992) compared the field performance of KDAT and ADAT SYP deck boards treated with CCA only and with CCA plus a water repellent (WR) additive. Eight decks
�0The use of southern pine that was not pressure-treated reflected practice for stairs and railings in the South (Verrall 1966) prior to the introduction of CCA-treated material in the residential market (which occurred in the mid-1970s). Southern pine was typically treated by soak, dip, or brush with site-prepared mixtures of pentachlorophenol concentrate in fuel oil carrier, with variable results.
44
19
Table 32—Summary of studies reporting moisture contents in roof framing and sheathing by climatic region
Moisture content (%)
Reference Location Type of study Duration Na
Measurement locationb Mean Minimum Maximumc
TrendsMixed-humid climate
Harrje et al. 1986
New Jersey Field experiment
1 yr 2 J, R, Sh — 5 ~40 Max MC in winter; min in summer
North slope wetter than south
Levins et al. 1989
Oak Ridge, TN
Field experiment
Winter 3 T — 7 11 Daily cycle of condensation on bottom surface of radiant barrier in attic
Winandy et al. 2000
Starkville, MS
Teststructure
4 yr 5 Sh — ~2 ~20 MC higher in humidified buildings
Trail, OR Forensic --- 3 Sh — 7 30 High MC attributed to bulk water leakage into roof through cracks in deteriorated rubber membrane
Sheltair Scientific 1997
Vancouver, BC
Field experiment
Sep–Mar 4 T, Sh — 8 14 Sheathing generally wetter than framing
Highest MC found in sheathing of north-facing slopes in midwinter
Houses with higher indoor RH had higher MC, irrespective of attic ventilation
Cold climate Jordan et al. 1948
Madison, WI Field experiment
Feb 3 Sh 13.3 10 19 Sheathing MC and attic air RH correlated with RH in living space
MarshallMacklin Monaghan 1983
Canada—various
provinces
Survey --- 44 Framing, Sh — <15 >22 High MC associated with cold weather, wind-driven rain, and low solar gain
Buchan, Lawton, Parent 1991
Charlottetown, PEI &
Ottawa, ON
Survey 1 yr 20 J, T, Sh — 8 ~80 Max MC in winter; min in summer
High MC correlated with high indoor RH
Rose 1992 Central IL Test structure
2 yr 8 Sh — 8 >30 Max MC in winter; min in summer
MC increased when small air leak was introduced from living space into attic
MC and temperature in cathedral ceiling cavities
45
with sets of end-matched boards of each treatment were constructed in Harrisburg, North Carolina, and monitored periodically over 1 year. Moisture content was measured at three depths with an electrical resistance-type meter. The CCA-only boards fluctuated rapidly in moisture con-tent, from below 10% to over 30%, with MC correlating closely with rainfall. Peaks as high as ~40–50% MC were observed.21 In contrast, the CCA–WR boards showed a much narrower variation, with values between 7% and 15% MC. The boards with CCA–WR treatment also showed less checking and cupping than those with only the CCA treatment.
Cui and Zahora (2000) conducted a similar study at the same location comparing SYP lumber with CCA-only, CCA–WR, alkaline copper quat (ACQ)-only, and ACQ–WR treatments. Data were reported for three periods: (A) September–November 1997; (B) May–June 1998; and (C) February–March 2000. Moisture content was measured by gravimetric analysis with matched sets of 2-ft (0.6-m) unfastened 2 by 6 boards exposed horizontally over deck framing. Four decks were constructed from 4-ft (1.2-m) 2 by 6 boards, and moisture content was determined by electrical resistance using pairs of stainless steel pins in-serted from the undersides of the boards.22 Reported data are summarized in Table 33. Several trends are evident. The boards without water repellent additives again showed large
��MC readings above 30% by electrical resistance are approximate (see Section 1.4).��MC readings were apparently corrected for ACQ-treated boards, but the study establishing this correction was not referenced.
fluctuations in moisture content, with values ranging from ~8% to over 30%. Both the ACQ–WR and CCA–WR treat-ments apparently improved in water repellency over time, with lower moisture content values and smaller fluctuations during the later measurement periods.23 This effect was seen more strongly for the ACQ–WR treatment.
On the basis of these studies, the following conclusions can be drawn:1. Untreated boards and pressure-treated boards without
water repellent additives exhibit large fluctuations in moisture content with weather. Water absorption occurs more rapidly when the wood surface is checked.
2. Treating boards with a preservative and water repellent additive significantly dampens these fluctuations. The water repellency of certain treatments improves over time. Water repellents also minimize checking and cupping.
6 Permanent Wood FoundationsBaker and Gjovik (1977) inspected nine houses with permanent wood foundations (PWFs) in Charlottesville and Verona, Virginia, that were treated with CCA. They also inspected seven houses with PWFs in the Minneapolis–St. Paul, Minnesota, area that were treated with ammonical copper arsenate (ACA). The foundations included full basements, crawlspaces, and a slab-on-grade. The purpose
��The rainfall during each period was not reported; however, the large MC fluctuations in the boards without the WR additive in each period imply that rainfall was sufficient to test the water repellency.19
Table 32—Summary of studies reporting moisture contents in roof framing and sheathing by climatic region
Moisture content (%)
Reference Location Type of study Duration Na
Measurement locationb Mean Minimum Maximumc
TrendsMixed-humid climate
Harrje et al. 1986
New Jersey Field experiment
1 yr 2 J, R, Sh — 5 ~40 Max MC in winter; min in summer
North slope wetter than south
Levins et al. 1989
Oak Ridge, TN
Field experiment
Winter 3 T — 7 11 Daily cycle of condensation on bottom surface of radiant barrier in attic
Winandy et al. 2000
Starkville, MS
Teststructure
4 yr 5 Sh — ~2 ~20 MC higher in humidified buildings
Trail, OR Forensic --- 3 Sh — 7 30 High MC attributed to bulk water leakage into roof through cracks in deteriorated rubber membrane
Sheltair Scientific 1997
Vancouver, BC
Field experiment
Sep–Mar 4 T, Sh — 8 14 Sheathing generally wetter than framing
Highest MC found in sheathing of north-facing slopes in midwinter
Houses with higher indoor RH had higher MC, irrespective of attic ventilation
Cold climate Jordan et al. 1948
Madison, WI Field experiment
Feb 3 Sh 13.3 10 19 Sheathing MC and attic air RH correlated with RH in living space
MarshallMacklin Monaghan 1983
Canada—various
provinces
Survey --- 44 Framing, Sh — <15 >22 High MC associated with cold weather, wind-driven rain, and low solar gain
Buchan, Lawton, Parent 1991
Charlottetown, PEI &
Ottawa, ON
Survey 1 yr 20 J, T, Sh — 8 ~80 Max MC in winter; min in summer
High MC correlated with high indoor RH
Rose 1992 Central IL Test structure
2 yr 8 Sh — 8 >30 Max MC in winter; min in summer
MC increased when small air leak was introduced from living space into attic
MC and temperature in cathedral ceiling cavities
20
more variable than in attics
Rose 1995a Central IL Test structure
2 yr 4 Sh — <6 >30 Lower MC in cavities with air chute between sheathing and insulation in cathedralized attics
TenWolde 1997 Central IL Test structure
Feb & May 1 Sh — 5 11
Winandy et al. 2000
Madison, WI Test structure
8 yr 5 Sh — ≥6 ≤20 Max MC in winter; min in summer
Very cold climate Sheltair Scientific 1997
Edmonton,AB
Field experiment
Sep–Mar 4 T, Sh — 7 18 Sheathing generally wetter than framing
Highest MC found in sheathing of north-facing slopes in midwinter
Houses with higher indoor RH had higher MC, irrespective of attic ventilation
a For field experiments, forensic investigations, and surveys, N is number of buildings sampled; for test structures, N is number of roof configurations. b J, ceiling joists; R, rafters; T, trusses; Sh, sheathing. c Moisture content measurements above 30% by electrical resistance are approximate (see Section 1.4).
Table 33—Moisture contents of unfastened SYP boards by gravimetric analysis and of fastened SYP deck boards by electrical resistance with four treatments over three time periods (see text) in North Carolina (Cui and Zahora 2000) Gravimetric MC (%) Resistance MC (%)
of the study was to observe the condition of galvanized steel nails in the foundation to determine the extent of corrosion and to measure wood moisture contents. The moisture con-tent readings were taken using a resistance-type meter above grade and at depths no deeper than 2 ft (0.6 m) below grade. The MC in sheathing and framing above grade ranged from 10% to 18%, whereas below grade it ranged from 10% to over 30%. Many of the foundations were protected by a polyethylene film, though in some instances the film was broken. There was not sufficient data to determine whether polyethylene in good condition was effective at protecting the wood from excessive moisture.
Moisture contents of framing and sheathing in a full base-ment PWF have been measured at the Forest Products Lab-oratory’s Advanced Housing Research Center (unpublished data). The plywood sheathing and 2 by 8 framing members were treated with CCA. The highest moisture contents, in excess of ~50%,21 were observed in foundation wall bot-tom plates during the later stages of construction, and soon thereafter. These high moisture contents reflected the con-struction sequence, in which gutter installation was the last construction step, followed by landscape grading. Spatial variability at this stage was very high, sometimes exceed-ing 30 percentage points in bottom plates. For calendar year 2006, which spanned between 51 and 63 months after con-struction, bottom plate moisture contents were significantly lower with less spatial variability: values were between 16% and ~35%. For the same calendar year, above-grade sheath-ing MC values ranged from 12% to 20%, and below-grade sheathing values ranged from 12% to ~35%.
On the basis of these two studies, it can be concluded that moisture contents of permanent wood foundations appar-ently span a larger range for framing and sheathing below grade than above grade. Factors such as site drainage, soil conditions, and the presence of a protective film may affect moisture levels.
ConclusionsThis literature review reports in-service moisture and temperature conditions for floor, wall, and roof structural
members of wood-frame buildings and wood decks and per-manent wood foundations. Because the data reported in the literature may not be statistically representative of wood-frame buildings in general, it cannot be determined if a bias exists towards either higher or lower moisture contents. However, the studies include common construction found throughout North America, and the data therefore represent conditions that can occur. Moisture contents vary widely, spanning a range from as low as 2% to well above 30%.
The most extreme moisture contents in structural members above crawlspaces occur when the ground is not covered with a vapor diffusion retarder, especially at sites with poor drainage. Two different seasonal trends have been observed for crawlspaces. Studies prior to around 1955 (when build-ings were typically not air-conditioned) in both mixed-hu-mid and cold climates observed a maximum moisture con-tent in winter and minimum in summer. When crawlspace vents were closed during winter, the uncovered soil supplied moisture that condensed on the coldest wood members near the exterior. In the spring, the moisture was driven off as wood temperatures rose and crawlspace vents were opened. Studies after around 1955 in the hot-humid and mixed-hu-mid climatic regions in various types of crawlspaces found that moisture content peaked in summer with a minimum in winter. Moisture from the soil and from warm, humid out-door air entering the crawlspace was absorbed by the floor members, which were cooled by air-conditioning.
High moisture levels in walls occur in response to rainwater intrusion. When bottom plates are in direct contact with concrete slab foundations (no capillary break), MCs may approach 30%. High moisture contents have been found in exterior wall sheathing in cold and marine climates during winter where exfiltration and vapor diffusion are not im-peded. The severity of this problem correlates with indoor humidity levels maintained during the winter. In these cli-mates, framing members in insulated walls generally do not accumulate as much moisture as does exterior sheathing. The cold side of framing members tends to be wetter than the warm side. The sheathing and outer portions of framing members usually dry during the spring and reach a mini-mum moisture content during the summer (unless there is excessive rainwater intrusion). However, in some cases, the design or construction of the wall prevents effective drying. In hot-humid climates, the significant moisture transport mechanisms (besides rainwater intrusion) are infiltration of humid outdoor air and diffusion of water vapor inward, the opposite of cold climates in winter. In addition, solar radia-tion can drive moisture from the exterior sheathing into the wall cavity. When a vapor retarder is placed on the interior (cold side) of the wall cavity, condensation can occur on the vapor retarder. In a number of climates, studies that have investigated the effect of a ventilated space between the sheathing and cladding have found that this feature reduces moisture accumulation in the wall.
21
Table 33—Moisture contents of unfastened SYP boards by gravimetric analysis and of fastened SYP deck boards by electrical resistance with four treatments over three time periods (see text) in North Carolina (Cui and Zahora 2000) Gravimetric MC (%) Resistance MC (%)
The highest moisture contents in roof sheathing (aside from bulk leakage) occur during winter for all the climatic regions reported here. Rafters and trusses generally do not accumulate as much moisture as does sheathing, but they do exhibit the same trend of high moisture content in winter and low moisture content in summer. Wintertime moisture accumulation in roof members is greater when indoor hu-midity levels are high and solar gain is low. The dominant moisture transport mechanism is likely exfiltration of humid indoor air through ceilings lacking effective air barriers. Ventilation of the attic space has not been a dependable method of controlling moisture levels in roofs when air leakage is significant.
Exposed wood decks constructed with untreated boards or pressure-treated boards without water-repellent additives exhibit large fluctuations in moisture content with weather. Water absorption occurs more rapidly when the wood sur-face is checked. Treating the boards with a preservative and water-repellent additive significantly dampens these fluctua-tions. The water repellency of certain treatments improves over time. Water repellents also minimize checking and cupping.
Moisture contents in permanent wood foundations are gen-erally higher below grade than above grade. Factors such as site drainage, soil conditions, and the presence of a protec-tive film may affect the moisture levels.
Literature CitedAdvanced Energy. 2005a. Crawl space characterization: characterizing crawl spaces as sources of mold in the home environment. Report for Duke University and U.S. Depart-ment of Housing and Urban Development. Raleigh, NC. 48 p. http://www.advancedenergy.org/buildings/knowledge_li-brary/crawl_spaces/pdfs/Crawl%20Space%20Characterization%202005.pdf. (3 April 2006).
Advanced Energy. 2005b. Long-term temperature and rela-tive humidity: characterizing crawl spaces as sources of mold in the home environment. Report for Duke University and U.S. Department of Housing and Urban Development. Raleigh, NC. 31 p. http://www.advancedenergy.org/build-ings/knowledge_library/crawl_spaces/pdfs/Longterm%20Temperature%20&%20Relative%20Humidity.pdf. (3 April 2006).
Advanced Energy. 2005c. Princeville field study final report: a field study comparison of the energy and moisture performance characteristics of ventilated versus sealed crawl spaces in the south. Report for U.S. Department of Energy. Raleigh, NC. 115 p. http://www.advancedenergy.org/buildings/knowledge_library/crawl_spaces/pdfs/Field%20Study%20-%202005.pdf. (3 April 2006).
Advanced Energy. 2005d. Characterization study final technical report: a field study comparison of the energy and moisture performance characteristics of ventilated versus
sealed crawl spaces in the south. Report for U.S. Depart-ment of Energy. Raleigh, NC. 54 p. http://www.advanceden-ergy.org/buildings/knowledge_library/crawl_spaces/pdfs/Characterization%20Study%20-%202005.pdf. (3 April 2006).
Amburgey, T.L.; French, D.W. 1970. Plastic soil covers reduce moisture in homes without basements. Pest Control. 38(11): 26–29. See also Amburgey, T.L.; French, D.W. 1971. Plastic soil covers reduce the moisture content in basementless homes. Forest Products Journal. 21(8): 43–44.
Anderson, R.W. 1989. A survey of moisture in Minnesota home interior foundation wall insulation. St. Paul, MN: Minnesota Department of Public Service, Energy Informa-tion Center. 16 p.
AWPA. 2006. Book of Standards: Use Category System: Processing and Treatment Standard T1-06. Birmingham, AL: American Wood-Preservers’ Association. ISSN 1534-195X.
Baker, A.J.; Gjovik, L.R. 1977. Report on inspection of all weather wood foundations in Virginia and Minnesota. [Un-published report] Madison, WI: U.S. Department of Agricul-ture, Forest Service, Forest Products Laboratory. 12 p.
Best, D. 2000. Oak Ridge troubleshooters to probe Seattle’s moisture problems. New York, NY: Energy Design Update. 20(6): 1–4.
Best, D.; Wardell, C. 1997. Defendants, plaintiffs hoping for out-of-court settlement in EIFS litigation. New York, NY: Energy Design Update. 17(4): 1–2.
Bomberg, M.; Pazera, M.; Ellringer, P. 2005a. 3E wall for all climates: part 1, the problem. In: International building lime symposium proceedings. Arlington, VA: National Lime Association, Building Lime Group. 16 p.
Bomberg, M.; Pazera, M.; Ellringer, P. 2005b. 3E wall for all climates: part 2, a proposed solution. In: International building lime symposium proceedings. Arlington, VA: Na-tional Lime Association, Building Lime Group. 14 p.
Britton, R.R. 1948. Crawl spaces: their effect on dwellings - an analysis of causes and results - suggested good practice requirements. HHFA Technical Bulletin No. 2: 17–39 (Janu-ary). Washington, DC: U.S. Housing and Home Finance Agency. Reprinted in HHFA Technical Bulletin No. 8.
Buchan, Lawton, Parent Ltd. 1991. Survey of moisture lev-els in attics. Ottawa: Canada Mortgage and Housing Corpo-ration. 31 p.
Building Envelope Engineering, Inc. 1999. Wall moisture problems in Alberta dwellings. Research report submitted to Canada Mortgage and Housing Corporation and Alberta Housing Industry Technical Committee. Ottawa: Canada Mortgage and Housing Corporation. 60 p.
Carll, C. 2000. Rainwater intrusion in light-frame building walls. In: Proceedings of the second annual conference on
48
durability and disaster mitigation in wood-frame housing. Madison, WI: Forest Products Society: 33–40.
Carll, C.G.; Highley, T.L. 1999. Decay of wood and wood-based products above ground in buildings. Journal of Test-ing and Evaluation. 27(2): 150–158.
Carll, C.; TenWolde, A. 1996. Accuracy of wood resistance sensors for measurement of humidity. Journal of Testing and Evaluation. 24(3): 154–160.
Cautley, D. 2004. Comparative measured moisture perfor-mance of woodframe walls. In: Proceedings, Woodframe housing durability and disaster issues. Madison, WI: Forest Products Society: 201–209.
Choong, E.T.; Cassens, D.L. 1985. Effect of soil cover on wood moisture content in crawl spaces of houses. LSU wood utilization note no. 36. Baton Rouge: Lousiana State University Agricultural Center, School of Forestry and Wildlife Management, Louisiana Agricultural Experiment Station. 4 p.
Chouinard, K.L.; Lawton, M.D. 2001. Rotting wood framed apartments—not just a Vancouver problem. Vancouver: Morrison Hershfield Limited. 16 p.
Christian, J.E. 1994. Moisture sources. In: Trechsel, H.R., ed. Moisture control in buildings. ASTM Manual Series: MNL 18. Philadelphia, PA: American Society for Testing and Materials: 176–182. Chapter 8.
City of Woodbury. 2005. Stucco in residential construction: a position paper. City of Woodbury, Minnesota, Building Inspection Division. http://www.ci.woodbury.mn.us/PLAN-NING/hmstucco.html
Crandell, J.; Kenney, T. 1996. Investigation of moisture damage in single-family detached houses sided with exterior insulation finish systems in Wilmington, NC. 2nd ed. Upper Marlboro, MD: NAHB Research Center. 9 p.
Cui, F.; Zahora, A. 2000. Effect of a water repellent addi-tive on the performance of ACQ treated decks. Proceedings, 31st Annual Meeting of the International Research Group on Wood Preservation. Document no. IRG/WP 00-40168. Stockholm, Sweden: IRG Secretariat. 6 p.
Davis, B.; Dastur, C. 2004. Moisture performance of closed crawlspaces and their impact on home cooling and heating energy in the Southeastern U.S. In: Proceedings, perfor-mance of exterior envelopes of whole buildings IX [CD-ROM]. Atlanta, GA: American Society of Heating, Refriger-ating and Air-Conditioning Engineers. 10 p.
Dell, M.J.; Liaw, S.B. 1998. Performance of stucco-clad wood-frame buildings in a temperate rain forest. In: Kud-der, R.J.; Erdly, J.L., eds. Water leakage through building facades, ASTM STP 1314. West Conshohocken, PA: Ameri-can Society for Testing and Materials: 155–167.
Derome, D.; Teasdale-St-Hilaire, A.; Fazio, P. 2001. Meth-ods for the assessment of moisture content of envelope assemblies. In: Proceedings, performance of exterior en-velopes of whole buildings VIII [CD-ROM]. Atlanta, GA: American Society of Heating, Refrigerating and Air-Condi-tioning Engineers. 13 p.
Desjarlais, AO.; Karagiozis, A.N.; Aoki-Kramer, M. 2001. Wall moisture problems in Seattle. In: Prodeedings, perfor-mance of exterior envelopes of whole buildings VIII [CD-ROM]. Atlanta, GA: American Society of Heating, Refriger-ating and Air-Conditioning Engineers. 8 p.
Diller J.D. 1946. Reduction of decay hazard in basementless houses on wet sites. Forest pathology special release no. 30. Beltsville, MD: U.S. Department of Agriculture, Agricultur-al Research Administration, Bureau of Plant Industry, Soils, and Agricultural Engineering, Division of Forest Pathology. 4 p.
Diller J.D. 1950. Reduction of decay hazard in basementless houses on wet sites. Forest pathology special release no. 30 (revised August 1950). Beltsville, MD: U.S. Department of Agriculture, Agricultural Research Administration, Bureau of Plant Industry, Soils, and Agricultural Engineering, Divi-sion of Forest Pathology. 4 p.
Diller, J.D. 1953. Soil cover reduces decay hazard of base-mentless houses. Forest pathology special release no. 38. U.S. Department of Agriculture, Forest Service, Division of Forest Disease Research, Northeastern Forest Experiment Station. 8 p.
Duff, J.E. 1966. A probe for accurate determination of moisture content of wood products in use. Research Note FPL–0142. Madison, WI: U.S. Department of Agriculture, Forest Service, Forest Products Laboratory. 10 p.
Duff, J.E. 1968. Moisture content distribution in wood-frame walls in winter. Forest Products Journal. 18(1): 60–64.
Duff, J.E. 1971. The effect of air conditioning on the mois-ture conditions in wood walls. Research Paper SE–78. Ashe-ville, NC: U.S. Department of Agriculture, Forest Service, Southeastern Forest Experiment Station. 8 p.
Duff, J.E. 1972. Vapor barrier decreases moisture condi-tions in wood walls exposed to air conditioning and heating. Research Paper SE–98. Asheville, NC: U.S. Department of Agriculture, Forest Service, Southeastern Forest Experiment Station. 8 p.
Duff, J.E. 1978. Moisture content of a joist floor over a crawl space. Research Paper SE–189. Asheville, NC: U.S. Department of Agriculture, Forest Service, Southeastern Forest Experiment Station. 12 p.
Duff, J.E. 1980. Moisture conditions of a joist floor over an insulated and sealed crawl space. Research Paper SE–206.
49
Asheville, NC: U.S. Department of Agriculture, Forest Ser-vice, Southeastern Forest Experiment Station. 5 p.
Dutt, G.S.; Jacobson, D.I.; Gibson, R.G.; Harrje, D.T. 1988. Measurements of moisture in crawlspaces retrofitted for en-ergy conservation. In: Proceedings, symposium on air infil-tration, ventilation, and moisture transfer. Washington, DC: Building Thermal Envelope Coordinating Council: 91–97.
Flynn, K.A.; Quarles, S.L.; Dost, W.A. 1994. Comparison of ambient conditions and wood moisture contents in crawl spaces in a California condominium complex. ASHRAE Technical Data Bulletin. Atlanta, GA: American Society of Heating, Refrigerating and Air-Conditioning Engineers. 10(3): 18–29.
FPL. 1999. Wood handbook—Wood as an engineering ma-terial. General Technical Report FPL–GTR–113. Madison, WI: U.S. Department of Agriculture, Forest Service, Forest Products Laboratory. 463 p.
Fugler, D.W.; Moffatt, S.D. 1994. Investigation of crawl space performance in British Columbia. ASHRAE Techni-cal Data Bulletin. Atlanta, GA: American Society of Heat-ing, Refrigerating and Air-Conditioning Engineers. 10(3): 49–57.
Gaby, L.I.; Duff, J.E. 1978. Moisture content changes in wood deck and rail components. Research Paper SE–190. Asheville, NC: U.S. Department of Agriculture, Forest Ser-vice, Southeastern Forest Experiment Station. 12 p.
Gavin, P.M. 1984. Moisture migration in walls: a sum-mary of current understanding. In: Bales, E.; Trechsel, H., eds. Moisture control in buildings: workshop proceedings. Washington, DC: Building Thermal Envelope Coordinating Council: 31–45.
Harrje, D.T.; Dutt, G.S.; Gibson, R.G.; Jacobson, D.I.; Hans, G. 1986. Field measurements of seasonal wood moisture variations in residential attics. In: Proceedings, thermal per-formance of the exterior envelopes of buildings III. Atlanta, GA: American Society of Heating, Refrigerating and Air-Conditioning Engineers: 620–633.
Healy, W.M. 2003. Moisture sensor technology—a summa-ry of techniques for measuring moisture levels in building envelopes. ASHRAE Transactions. Atlanta, GA: American Society of Heating, Refrigerating and Air-Conditioning En-gineers. 109(1): 232–242.
Holladay, M. 2006a. Minnesota’s rotting stucco walls. New York, NY: Energy Design Update. 26(5): 1–11.
Holladay, M. 2006b. In Arizona, white roofing causes wet insulation. New York, NY: Energy Design Update. 26(6): 4–6.
International Energy Agency. 1991. Condensation and en-ergy: sourcebook. Leuven, Belgium: Report Annex XIV, Vol. 1.
James, W.L. 1988. Electric moisture meters for wood. Gen-eral Technical Report FPL–GTR–6. Madison, WI: U.S. Department of Agriculture, Forest Service, Forest Products Laboratory. 17 p.
Jennings, C.W.; Moody, T.L. 1983. Field experiences under-score the importance of moisture control in energy-efficient homes. In: Proceedings of the ASHRAE/DOE conference: thermal performance of the exterior envelopes of build-ings II. ASHRAE SP 38. Atlanta, GA: American Society of Heating, Refrigerating and Air-Conditioning Engineers: 1063–1077.
Jennings, C.W.; Moody, T L. 1984. Causes and conse-quences of moisture in earth-coupled spaces. In: Bales, E.; Trechsel, H., eds. Moisture control in buildings: workshop proceedings. Washington, DC: Building Thermal Envelope Coordinating Council: 61–75.
Jordan, C.A.; Peck, E.C.; Strenge, F.A.; Teesdale, L.V. 1948. Attic condensation in tightly built houses. HHFA Technical Bulletin. Washington, DC: U.S. Housing and Home Finance Agency. 6: 29–46.
Kadulski, R. 1998. “Leaky condos” are building envelope failures. Solplan Review. 80: 3–7.
Lawton, M. 1999a. Vancouver’s rotting condominium prob-lem—how did we get into this mess? Journal of Thermal Envelope & Building Science. 22: 356–363.
Lawton, M.D. 1999b. Reacting to durability problems with Vancouver buildings. In: Lacasse, M.A.; Vanier, D.J., eds. Durability of building materials and components 8. Ottawa: National Research Council Canada, Institute for Research in Construction: 989–999.
Lebow, S.T. 2006. Personal communication. Research Wood Scientist, U.S. Department of Agriculture, Forest Service, Forest Products Laboratory, Madison, WI.
Lebow, S.; Lebow, P. 2007. The role of moisture content in above-ground leaching. Proceedings, 38th Annual Meeting of the International Research Group on Wood Protection. Document no. IRG/WP 07-50245. Stockholm, Sweden: IRG Secretariat. 15 p.
Levins, W.P.; Karnitz, M.A.; Hall, J.A. 1989. Moisture mea-surements in single-family houses with attics containing ra-diant barriers. ASHRAE Transactions. Atlanta, GA: Ameri-can Society of Heating, Refrigerating and Air-Conditioning Engineers. 95(2): [pages unknown].
Lstiburek, J.W. 1995. The fundamental flaw of EIFS. In: Proceedings, thermal performance of the exterior envelopes of buildings VI. Atlanta, GA: American Society of Heating, Refrigerating and Air-Conditioning Engineers: 775.
Lstiburek, J. 2006a. Builder’s guide to cold climates. West-ford, MA: Building Science Press. 466 p.
Marshall Macklin Monaghan Ltd. 1983. Moisture induced problems in NHA housing, part 1: analysis of field survey results and projections of future problems. Ottawa: Canada Mortgage and Housing Corporation. 108 p.
Mei, H.T. 1988. Moisture transfer in walls in a warm humid climate. In: Proceedings, symposium on air infiltration, ven-tilation, and moisture transfer. Washington, DC: Building Thermal Envelope Coordinating Council: 151–164.
Merrill, J.L.; TenWolde, A. 1989. Overview of moisture-related damage in one group of Wisconsin manufactured homes. ASHRAE Transactions. Atlanta, GA: American Society of Heating, Refrigerating and Air-Conditioning En-gineers. 95(1): 405–414.
Moffatt, S. 1992. Crawl spaces—ventilation control of hu-midity. In: Bales, E.; Rose, W.B., eds. Bugs, mold & rot: proceedings of the moisture control workshop. Washington, DC: National Institute of Building Sciences: 35–48.
Moody, T.L.; Jennings, C.; Lamb, D. 1983. Effect of insulat-ing crawlspace walls in residential structures. In: Proceed-ings of the ASHRAE/DOE conference: thermal performance of the exterior envelopes of buildings II. ASHRAE SP 38. Atlanta, GA: American Society of Heating, Refrigerating and Air-Conditioning Engineers: 571–585.
Moody, T.L.; Jennings, C.W.; Whisenant, W.C. 1985. Heat loss and gain through floors above insulated crawlspace walls. ASHRAE Transactions. Atlanta, GA: American So-ciety of Heating, Refrigerating and Air-Conditioning Engi-neers. 91(2B): 623–639.
Morrison Hershfield Ltd. 1998. Survey of building envelope failures in the coastal climate of British Columbia. Techni-cal Series 98–102. Ottawa: Canada Mortgage and Housing Corporation. 56 p.
Moses, C.S. 1954. Condensation and decay prevention un-der basementless houses. Report Number 2010. Madison, WI: U.S. Department of Agriculture, Forest Service, Forest Products Laboratory. 8 p.
Moses, C.S.; Scheffer, T.C. 1962. Survey of houses for moisture content and decay in wood members. Report WP–60 for Federal Housing Administration. Madison, WI: U.S. Department of Agriculture, Forest Service, Forest Products Laboratory. 33 p. See also Scheffer, T.C.; Moses, C.S. 1993. Survey of moisture content in houses for evidence of decay susceptibility. Forest Products Journal. 43(11/12): 45–51.
Murray, C.; Tichy, R. 2006. Moisture performance of wood framed wall systems in the Pacific Northwest. In: Bender,
D.A.; Gromala, D.S.; Rosowsky, D.V., eds. Proceedings, ninth world conference on timber engineering [CD-ROM]. Portland, OR.
Nisson, J.D.N. 1995. Severe rotting found in homes with exterior insulation systems. New York, NY: Energy Design Update. 15(12): 1–3.
Platts, R.E. 1988. Wet walls: apparent incidence of exces-sive condensation in house envelope construction in Canada. In: Proceedings, symposium on air infiltration, ventilation, and moisture transfer. Washington, DC: Building Thermal Envelope Coordinating Council: 82–90.
Quarles, S.L. 1989. Factors influencing the moisture con-ditions in crawl spaces. Forest Products Journal. 39(10): 71–75.
Rose, W.B. 1992. Measured values of temperature and sheathing moisture content in residential attic assemblies. In: Proceedings, thermal performance of the exterior en-velopes of buildings V. Atlanta, GA: American Society of Heating, Refrigerating and Air-Conditioning Engineers: 379–390.
Rose, W.B. 1993. Crawl spaces: regulations, research, and results. In: Rose, W.B.; TenWolde, A., eds. Bugs, mold & rot II: proceedings of the moisture control workshop. Washing-ton, DC: National Institute of Building Sciences: 83–88.
Rose, W.B. 1994. A review of the regulatory and technical literature related to crawl space moisture control. ASHRAE Technical Data Bulletin. Atlanta, GA: American Society of Heating, Refrigerating and Air-Conditioning Engineers. 10(3): 5–17.
Rose, W.B. 1995a. Attic construction with sheathing-applied insulation. ASHRAE Transactions. Atlanta, GA: American Society of Heating, Refrigerating and Air-Conditioning En-gineers. 101(2): 789–798.
Rose, W.B. 1995b. The history of attic ventilation regulation and research. In: Proceedings, thermal performance of the exterior envelopes of buildings VI. Atlanta, GA: American Society of Heating, Refrigerating and Air-Conditioning En-gineers: 125–134.
Rose, W.B. 2001. Background on crawl space regulation, construction, and performance. In: Technology assessment report: a field study comparison of the energy and moisture performance characteristics of ventilated versus sealed crawl spaces in the south. [Chapter 1] Report for U.S. Department of Energy. Raleigh, NC. http://www.advancedenergy.org/buildings/knowledge_library/crawl_spaces/pdfs/Technology%20Assessment%20-%202005.pdf. (3 April 2006).
Rose, W.B.; McCaa, D.J. 1998. Temperature and moisture performance of wall assemblies with fiberglass and cellulose insulation. In: Proceedings, thermal performance of the exterior envelopes of buildings VII. Atlanta, GA:
51
American Society of Heating, Refrigerating and Air-Condi-tioning Engineers: 133–144.
Rose, W.B.; TenWolde, A. 1994. Issues in crawl space de-sign and construction—a symposium summary. ASHRAE Technical Data Bulletin. Atlanta, GA: American Society of Heating, Refrigerating and Air-Conditioning Engineers. 10(3): 1–4.
Scheffer, T.C. 1971. A climate index for estimating potential decay in wood structures above ground. Forest Products Journal. 21(10): 25–31.
Sheltair Scientific Ltd. 1991. Investigation of crawl space ventilation and moisture control strategies for B.C. houses: final report. Ottawa: Canada Mortgage and Housing Corpo-ration. 28 p.
Sheltair Scientific Ltd. 1997. Attic ventilation and moisture control strategies: final report. Ottawa: Canada Mortgage and Housing Corporation. 7 p.
Sherwood, G.E. 1983. Condensation potential in high ther-mal performance walls—cold winter climate. Research Paper FPL–RP–433. Madison, WI: U.S. Department of Ag-riculture, Forest Service, Forest Products Laboratory. 20 p.
Sherwood, G.E. 1985. Condensation potential in high ther-mal performance walls—hot, humid summer climate. Re-search Paper FPL–RP–455. Madison, WI: U.S. Department of Agriculture, Forest Service, Forest Products Laboratory. 29 p.
Sherwood, G.E. 1987. Condensation potential in wood-frame walls. In: Powell, F.J.; Matthews, S.L., eds. Thermal insulation: materials and systems. ASTM STP 922. Philadel-phia: American Society for Testing and Materials: 405–417.
Shupe, T.F.; Lebow, S.T.; Choong, E.T.; Xiong, M. 2001. Inadequate redrying linked to dimensional instability of CCA-treated southern pine lumber. Forest Products Journal. 51(5): 59–62.
Stiles, L.; Custer, M. 1994. Reduction in moisture of wood joists in crawl spaces—a study of seventeen houses in southern New Jersey. ASHRAE Technical Data Bulletin. Atlanta, GA: American Society of Heating, Refrigerating and Air-Conditioning Engineers. 10(3): 30–40.
Straube, J.F.; Burnett, E.F.P. 1998. Drainage, ventilation drying, and enclosure performance. In: Proceedings, thermal performance of the exterior envelopes of buildings VII. At-lanta, GA: American Society of Heating, Refrigerating and Air-Conditioning Engineers: 189–198.
Straube, J.F.; Burnett, E.F.P. 2005. Building science for building enclosures. Westford, MA: Building Science Press. 542 p.
Straube, J.; Onysko, D.; Schumacher, C. 2002. Methodology and design of field experiments for monitoring the
hygrothermal performance of wood frame enclosures. Journal of Thermal Envelope & Building Science. 26(2): 123–151.
Teesdale, L.V. 1959. Condensation problems in modern buildings. Report Number 1196 [originally published 1939, reviewed and reaffirmed 1959]. Madison, WI: U.S. Depart-ment of Agriculture, Forest Service, Forest Products Labora-tory. 10 p.
TenWolde, A. 1988. Moisture damage in manufactured homes in Wisconsin. In: Shuman, E.C.; Achenbach, P.R., eds. Building thermal envelope technology series. Washing-ton, DC: Building Thermal Envelope Coordinating Council: 87–103 [Vol. 1].
TenWolde, A. 1997. FPL roof temperature and moisture model: description and verification. Research Paper FPL–RP–561. Madison, WI: U.S. Department of Agriculture, Forest Service, Forest Products Laboratory. 48 p.
TenWolde, A. 2000. Mold and decay in Tri-State homes. In: Proceedings of the second annual conference on durability and disaster mitigation in wood-frame housing. Madison, WI: Forest Products Society: 53–57.
TenWolde, A.; Carll, C.; Malinauskas, V. 1995. Airflows and moisture conditions in walls of manufactured homes. In: Modera, M.P.; Persily, A.K., eds. Airflow performance of building envelopes, components, and systems. ASTM STP 1255. Philadelphia: American Society for Testing and Mate-rials: 137–155.
TenWolde, A.; Courville, G.E. 1985. Instrumentation for measuring moisture in building envelopes. ASHRAE Trans-actions. Atlanta: American Society of Heating, Refrigerating and Air-Conditioning Engineers. 91(2): 1101–1115.
TenWolde, A.; Mei, H.T. 1986. Moisture movement in walls in a warm humid climate. In: Proceedings, thermal perfor-mance of the exterior envelopes of buildings III. Atlanta, GA: American Society of Heating, Refrigerating and Air-Conditioning Engineers: 570–582.
TenWolde, A.; Rose, W.B. 1999. Issues related to venting of attics and cathedral ceilings. ASHRAE Transactions. At-lanta, GA: American Society of Heating, Refrigerating and Air-Conditioning Engineers. 105(1): 851–857.
Tsongas, G.A. 1980. A field study of moisture damage in walls insulated without a vapor barrier. Final report for Or-egon Department of Energy. ORNL/Sub-78/97726/1. Oak Ridge, TN: Oak Ridge National Laboratory. 55 p. See also Tsongas, G.A.; Odell, F.G.; Thompson, J.C. 1981. A field study of moisture damage in walls insulated without a vapor barrier. In: Proceedings, thermal performance of the exterior envelopes of buildings. ASHRAE SP 28. New York: Ameri-can Society of Heating, Refrigerating and Air-Conditioning Engineers: 801–815.
52
Tsongas, G.A. 1984. The Spokane wall insulation project: a field study of moisture damage in walls insulated without a vapor barrier. U.S. Department of Energy/Bonneville Power Administration DOE/BP–541. Portland, OR: Bonneville Power Administration. 75 p. See also Tsongas, G. 1986. The Spokane wall insulation project: a field study of moisture damage in walls insulated without a vapor barrier. In: Pro-ceedings of the ASHRAE/DOE–ORNL Conference, thermal performance of the exterior envelopes of buildings III. At-lanta, GA: American Society of Heating, Refrigerating and Air-Conditioning Engineers: 556–569.
Tsongas, G.A. 1990. The Northwest wall moisture study: a field study of excess moisture in walls and moisture prob-lems and damage in new Northwest homes. U.S. Depart-ment of Energy/ Bonneville Power Administration DOE/BP-91489-1. Portland, OR: Bonneville Power Administration. 46 p. See also Tsongas, G. 1992. A field study of indoor moisture problems and damage in new Northwest homes. In: Proceedings, thermal performance of the exterior enve-lopes of buildings V. Atlanta: American Society of Heating, Refrigerating and Air-Conditioning Engineers: 563–571.
Tsongas, G.A. 1991. The effect of exterior insulating sheath-ing on wall moisture. In: Graves, R.S.; Wysocki, D.C., eds. Insulation materials: testing and application. [Vol. 2] ASTM STP 1116. Philadelphia: American Society for Testing and Materials: 401–414.
Tsongas, G. 1994a. Case studies of moisture problems in residences. In: Trechsel, H.R., ed. Moisture control in build-ings. ASTM Manual Series: MNL 18. Philadelphia: Ameri-can Society for Testing and Materials: 254–280. Chapter 14.
Tsongas, G.A. 1994b. Crawl space moisture conditions in new and existing Northwest homes. ASHRAE Technical Data Bulletin. Atlanta, GA: American Society of Heat-ing, Refrigerating and Air-Conditioning Engineers. 10(3): 41–48.
Tsongas, G.A.; Bolme, B. 1988. A case study of the cause of roof moisture damage. In: Proceedings, symposium on air infiltration, ventilation, and moisture transfer. Washington, DC: Building Thermal Envelope Coordinating Council: 212–218.
Tsongas, G.A.; Nelson, G.D. 1991. A field test for correla-tion of air leakage and high moisture content sites in tightly built walls. ASHRAE Transactions. Atlanta, GA: American Society of Heating, Refrigerating and Air-Conditioning En-gineers. 97(1): 1–8.
Tsongas, G.; Olson, J. 1995. Tri State homes: a case study of extensive decay in the walls of older manufactured homes with an exterior vapor retarder. In: Proceedings, thermal performance of the exterior envelopes of buildings VI. At-lanta, GA: American Society of Heating, Refrigerating and Air-Conditioning Engineers: 207–218.
Verrall, A.F. 1966. Building decay associated with rain seepage. Technical Bulletin 1356. New Orleans, LA: U.S. Department of Agriculture, Forest Service, Southern Forest Experiment Station. 58 p.
Verrall, A.F.; Amburgey, T.L. 1980. Prevention and control of decay in homes. U.S. Department of Agriculture, Forest Service, and U.S. Department of Housing and Urban Devel-opment. 148 p.
Wang, F.S. 1981. Comparative studies of vapor condensa-tion potentials in wood framed walls. In: Proceedings of the ASHRAE/DOE–ORNL Conference, thermal performance of the exterior envelopes of buildings. ASHRAE SP 28. New York: American Society of Heating, Refrigerating and Air-Conditioning Engineers: 836–846.
Weber, C.G.; Reichel, R.C. 1942. Accumulation of mois-ture in walls of frame construction during winter exposure. Report BMS93. Washington, DC: U.S. Department of Com-merce, National Bureau of Standards, Building Materials and Structures. 5 p.
Williams, M.F.; Williams, B.L. 1998. An overview of water leakage problems in single-family residences clad with ex-terior insulation and finish systems (EIFS). In: Kudder, R.J.; Erdly, J.L., eds. Water leakage through building facades. ASTM STP 1314. West Conshohocken, PA: American Soci-ety for Testing and Materials: 277–287.
Winandy, J.E.; Barnes, H.M.; Hatfield, C.A. 2000. Roof temperature histories in matched attics in Mississippi and Wisconsin. Research Paper FPL–RP–589. Madison, WI: U.S. Department of Agriculture, Forest Service, Forest Products Laboratory. 24 p.
Zahora, A. 1992. A water repellent additive’s influence on field performance of southern yellow pine lumber. Proceed-ings of the American Wood-Preservers’ Association. Wood-stock, MD: American Wood-Preservers’ Association. 88: 148–159.
Zelinka, S.L.; Rammer, D.R. 2005a. Review of test methods used to determine the corrosion rate of metals in contact with treated wood. General Technical Report FPL–GTR–156. Madison, WI: U.S. Department of Agriculture, Forest Service, Forest Products Laboratory. 23 p.
Zelinka, S.L.; Rammer, D.R. 2005b. The use of electro-chemical impedance spectroscopy (EIS) to measure the cor-rosion of metals in contact with wood. TMS Letters. 2(1): 15–16.