Review of MENA Energy Investment SUPPORTING THE TRANSITION The year 2012 was dominated by rapidly-evolving events with far-reaching repercussions for the Middle East and North Africa (w). 1 In the so-called ‘Arab Spring’ countries, where regime changes and political transformations have taken place, discontent has proved hard to quell. In Syria, a deepening civil war has created new threats to regional stability; while in Iran, tougher international sanctions over the country’s nuclear programme – involving unilateral denial of access to financial and oil markets – have only exacerbated the uncertainties pervading the region. Adding to these uncertainties are the series of setbacks suffered by the global economy, from which the region can hardly shelter. These unfolding developments have continued to dampen the investment climate and business sentiment. However, they have neither invalidated our framework analysis of energy investment, nor altered the resulting medium-term perspectives we provided in October 2012. 2 Nevertheless, it is important to evaluate such findings against evolving macro trends. Given that growth, interest rates and energy prices are key determinants of investment and financing, the first part of the commentary examines the economic outlook, current conditions in the money markets, and developments in the oil and natural gas markets. The second part discusses the scope and structure of MENA energy investment; while part three highlights major constraints and policy challenges, and provides a timely update on funding issues. OUTLOOK FOR THE ECONOMY AND MARKETS Global and MENA Economies The economic recovery witnessed in the immediate aftermath of the global financial crisis has stalled as growth has faced new impediments, including fiscal policy tightening and a weakened financial system. Furthermore, despite highly accommodative monetary policies, stringent credit market conditions have persisted. According to the latest IMF’s World Economic Outlook (WEO), which was released in October 2012 under the theme “Coping with High Debt and Sluggish Growth”, 3 the global economy has deteriorated further since the release of the July 2012 WEO update. Growth in 2012 was put at 5.3% for emerging market countries and 1.3% for advanced economies. The resulting world average of 3.3% shows the extent of the downtrend when set against past rates of 5.1% in 2010 and 3.8% in 2011. Looking forward, uncertainty continues to weigh heavily on the outlook. The prospects for world GDP growth is subject to several downside risks, including continued stress in the Eurozone, intractable US fiscal problems, and China’s economic prospects. As a result, global growth projections have been marked down to 3.6% for 2013 compared with 4.1% in the previous forecast (Figure 1). However, as suggested in Figure 1, the world economy is assumed to return to the pre-crisis growth trend towards 2017. 1 As usual, MENA is defined to include the Arab world and Iran. Despite progress to demarcate borders and delineate oil deposits, energy investment in Sudan is kept inconsequentially aggregated with that of South Sudan. 2 ‘MENA Energy Investment Outlook: Capturing the Full Scope and Scale of the Power Sector’, APICORP Economic Commentary, October 2012. 3 IMF, World Economic Outlook, October 2012. Figure 1: Overview of Global and Regional Growths % Real GDP Growth -5 -3 -1 1 3 5 7 9 11 Emerging and DCs MENA/Arab World Advanced Countries APICORP Research. Source: IMF (Oct 2012) and own projections beyond 2013. 2001 2000 2002 2003 2004 2005 2006 2007 2008 2009 2010 2011 2012 2013 2014 2015 2016 2017 APICORP Annual Report 2012 10
Transcript
Review of MENA Energy InvestmentSUPPORTING THE TRANSITION
The year 2012 was dominated by rapidly-evolving events with far-reaching repercussions for the Middle East and North Africa (w).1 In the so-called ‘Arab Spring’ countries, where regime changes and political transformations have taken place, discontent has proved hard to quell. In Syria, a deepening civil war has created new threats to regional stability; while in Iran, tougher international sanctions over the country’s nuclear programme – involving unilateral denial of access to financial and oil markets – have only exacerbated the uncertainties pervading the region. Adding to these uncertainties are the series of setbacks suffered by the global economy, from which the region can hardly shelter.
These unfolding developments have continued to dampen the investment climate and business sentiment. However, they have neither invalidated our framework analysis of energy investment, nor altered the resulting medium-term perspectives we provided in October 2012.2 Nevertheless, it is important to evaluate such findings against evolving macro trends. Given that growth, interest rates and energy prices are key determinants of investment and financing, the first part of the commentary examines the economic outlook, current conditions in the money markets, and developments in the oil and natural gas markets. The second part discusses the scope and structure of MENA energy investment; while part three highlights major constraints and policy challenges, and provides a timely update on funding issues.
OUTLOOK FOR THE ECONOMy AND MARKETSGlobal and MENA EconomiesThe economic recovery witnessed in the immediate aftermath of the global financial crisis has stalled as growth has faced new impediments, including fiscal policy tightening and a weakened financial system. Furthermore, despite highly accommodative monetary policies, stringent credit market conditions have persisted. According to the latest IMF’s World Economic Outlook (WEO), which was released in October 2012 under the theme “Coping with High Debt and Sluggish Growth”,3 the global economy has deteriorated further since the release of the July 2012 WEO update. Growth in 2012 was put at 5.3% for emerging market countries and 1.3% for advanced economies. The resulting world average of 3.3% shows the extent of the downtrend when set against past rates of 5.1% in 2010 and 3.8% in 2011.
Looking forward, uncertainty continues to weigh heavily on the outlook. The prospects for world GDP growth is subject to several downside risks, including continued stress in the Eurozone, intractable US fiscal problems, and China’s economic prospects. As a result, global growth projections have been marked down to 3.6% for 2013 compared with 4.1% in the previous forecast (Figure 1). However, as suggested in Figure 1, the world economy is assumed to return to the pre-crisis growth trend towards 2017.
1 As usual, MENA is defined to include the Arab world and Iran. Despite progress to demarcate borders and delineate oil deposits, energy investment in Sudan is kept inconsequentially aggregated with that of South Sudan.
2 ‘MENA Energy Investment Outlook: Capturing the Full Scope and Scale of the Power Sector’, APICORP Economic Commentary, October 2012.3 IMF, World Economic Outlook, October 2012.
Figure 1: Overview of Global and Regional Growths
% R
eal G
DP
Gro
wth
-5
-3
-1
1
3
5
7
9
11
Emerging and DCs
MENA/Arab World
Advanced Countries
APICORP Research. Source: IMF (Oct 2012) and own projections beyond 2013.
2001
2000
2002
2003
2004
2005
2006
2007
2008
2009
2010
2011
2012
2013
2014
2015
2016
2017
APICORP Annual Report 201210
Despite a weak global recovery and uncertain political transformations, MENA GDP growth has been revised upward from 4.8% to 5.3% for 2012. However, due to differences in macro-economic conditions and investment climates, the region witnessed a two-speed growth in 2012. Together with Libya’s relative recovery, most oil-exporting countries have shown stronger growth than the oil-importing countries, largely the result of higher petroleum fiscal revenues and increased public spending. In 2013, however, as surplus expenditures run their course, growth in the two groups of countries is expected to converge towards a more modest rate of between 3.3% and 3.6%. Whether or not the region’s economy will then be able to catch up with past trends, as implied in Figure 1, depends on the extent to which social unrest and political uncertainty recede. It also depends on governments pursuing and achieving fundamental reforms with more inclusive socio-economic agenda.
Money Markets Extensive injection of liquidity by the US Federal Reserve (Fed) and other major central banks have helped take the stress out of the money markets. Since December 2008, the Fed has pursued an ultra-accommodative monetary policy in order to encourage banks to expand credit and stimulate the economy. In December 2012, it reiterated its decision to keep its benchmark rate in a range of zero to 0.25%. This will not be until 2014 as previously suggested, but for as long as inflation is under control and
the US unemployment rate remains above 6.5% percent (estimated at 7.8% in December 2012). Therefore, the Fed has continued its unconventional policy consisting of large-scale bond purchase programmes (known as quantitative easing), with the aim of maintaining inter alia downward pressure on longer-term interest rates. At the same time, it has extended to February 2014, its dollar liquidity swap lines with the European Central Bank (ECB) and other major central banks around the world. Accordingly, the Fed will continue offering low-cost US dollar funding to these central banks with the expectation that they would, in turn, make it cheaper for their own banks to borrow. This is aimed particularly at the European banks, whose creditworthiness became a concern in the wake of the Eurozone debt crisis. However, the swap lines are only a temporary solution until US prime money market funds fully resume their lending to these banks.
Meanwhile, central banks’ continued injection of liquidity into the dollar funding markets would appear to have benefited the interbank market. As gauged by the evolution of the dollar spread between Libor and the overnight indexed swap (OIS) – a measure of credit risk and liquidity premium and a strong indicator for the relative stress in the money markets – the willingness of banks to lend to each other has greatly improved. Indeed, after rising to a two-year high of 50 bps in January 2012, the spread dropped to around 30 bps during the summer, before settling at a lower level of 16 bps at the end of 2012 (Figure 2).
0
100
200
300
400
3 m
onth
Lib
or-O
IS s
prea
d (b
asis
poi
nts)
jan
07
jan
08
jan
09
jan
10
jan
11
jan
12
Apr
12
jul 1
2
Oct
12
Apr
07
Apr
08
Apr
09
Apr
10
Apr
11
jul 0
7
jul 0
8
jul 0
9
jul 1
0
jul 1
1
Oct
07
Oct
08
Oct
09
Oct
10
Oct
11
Onset of the Global Financial Crisis (Aug 2007)
Eurozone’s Soverign Debt Troubles
Lehman’s Bankruptcy(Sep 2008)
Summer 2010
Winter 2011-12
APICORP Research. Using Bloomberg database (as of 31 Jan 2012).
Figure 2: Evolution of Libor-OIS spreads
APICORP 11
Figure 3: Recent Trends in Oil Market and Price
0
25
50
75
100
125
150
OPE
C Re
fere
nce
Bask
et P
rice
($bb
l)
APICORP Research. Using OPEC database, as of Dec 2012.
Summer 2008: bursting of the oil market bubble
Winter 2008-09:OPEC’s three successive output cuts
totaling 4.2 mb/d
2011-2012: Market tightening then
stabilizing just above OPEC’s $100/bbl fiscal break-even price
2009-2010: Market tightening then
stabilizing around $75/bbl Saudi ‘fair price’
jan
08
jul 0
8
jan
07
jan
09
jan
10
jan
11
jan
12
jul 1
2
jul 0
7
j ul 0
9
jul 1
0
jul 1
1
4 ‘Fiscal Break-even Prices Revisited: What More Could They Tell Us About OPEC Policy Intent?’, APICORP Economic Commentary, August-September 2012.
However, central banks’ low-cost money has barely trickled down to businesses. Instead of expanding credit, commercial banks have focused efforts on rebuilding their capital reserves to accommodate continued uncertainty in the financial markets, as well as the requirements of the new Basel III regulations. As a result, the real economy has continued to face tight credit markets. This is particularly the case of MENA where capital inflows – the bulk in dollar-dominated syndicated loans – have collapsed after foreign banks reduced their country exposure limits, or just pulled back from lending as has been the case of the European banks. In this context, loans extended to the infrastructure sector in the region have halved from $101bn in 2010 to $53bn in 2012. As discussed further in later sections of this commentary, external funding for the large-scale, capital-intensive energy sector has been no exception.
Oil and Natural Gas Markets Libya’s rapid oil recovery, together with increased production from Saudi Arabia, Iraq and North America, has helped mitigate the loss of Iranian oil. In the face of weak demand, oil prices would have softened considerably if not for geopolitical uncertainty. As a result, the value of the OPEC basket of crudes averaged $109/bbl during 2012, comfortably above OPEC’s weighted-average fiscal breakeven price, which we have estimated at around $100/bbl (Figure 3).4 Looking forward, three factors are likely to dominate the market outlook: the extent of China’s recovery, further escalation of Iran’s standoff with the West, and OPEC’s ability to close ranks. All things considered, we assume that OPEC will still be able to balance the market at present price levels of no less than $100/bbl.
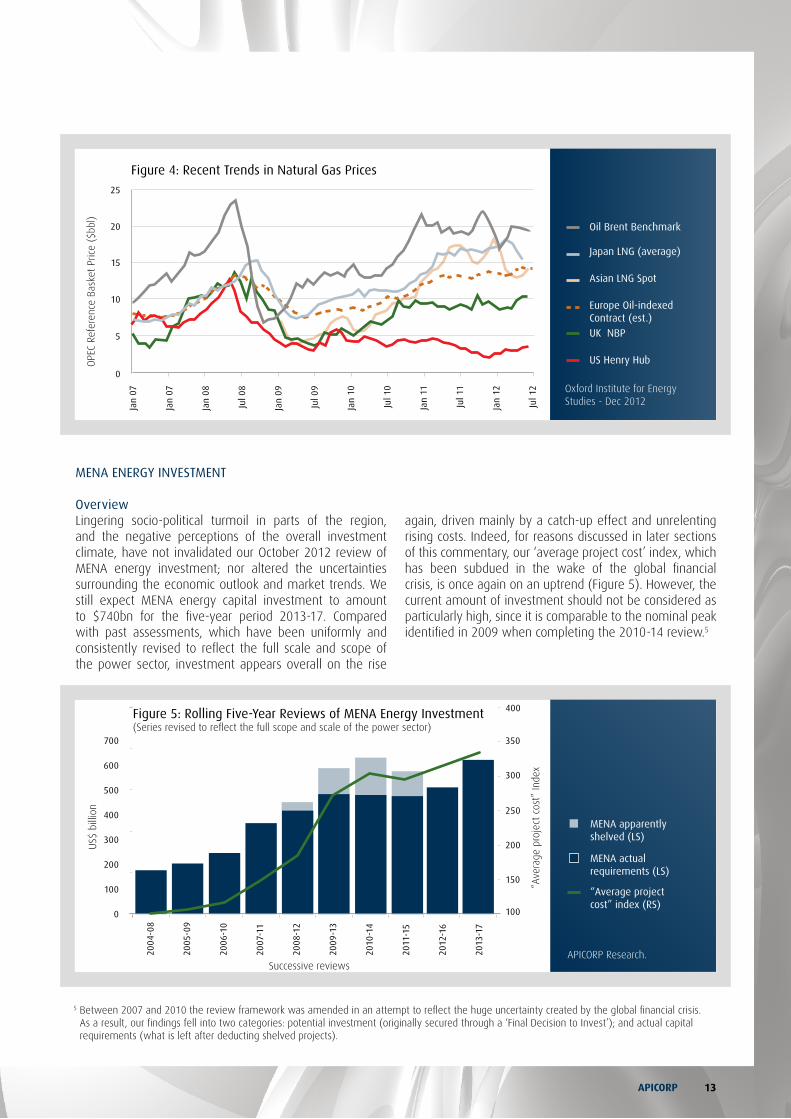
In the more complex natural gas market, prices have failed to converge as anticipated in the mid-2000s. Despite significant volumes of LNG traded on the spot market, and physical arbitrage opportunities between regional markets, prices have remained fragmented. Not only have they disparately deviated from oil parity, but they have also kept diverging between themselves (Figure 4). Looking
forward, prices are likely to evolve to between $3 and 5$ MBtu in fully liberalised markets with abundant domestic supplies, as is the case of the North American market; and between $12 and 15/MBtu in markets relying on imports under traditional long-term contracts, such as European markets and, to a larger extent, Asian markets.
Review of MENA Energy InvestmentSUPPORTING THE TRANSITION
APICORP Annual Report 201212
MENA ENERGy INVESTMENT
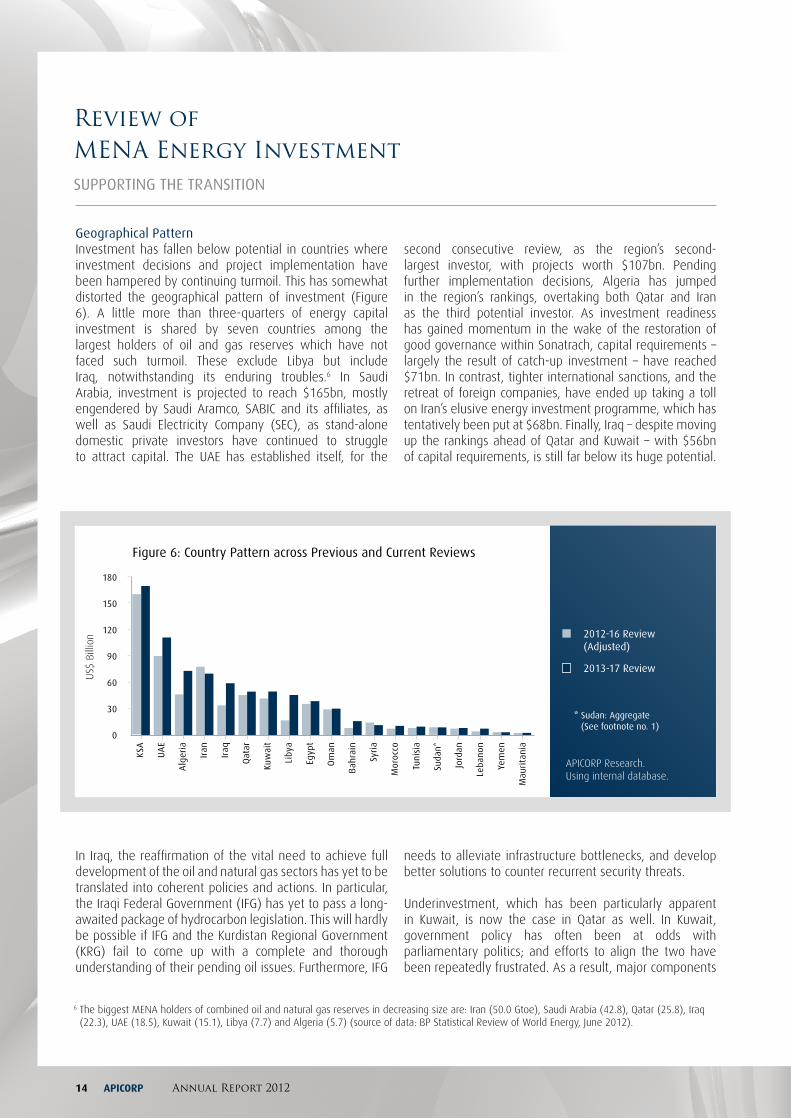
OverviewLingering socio-political turmoil in parts of the region, and the negative perceptions of the overall investment climate, have not invalidated our October 2012 review of MENA energy investment; nor altered the uncertainties surrounding the economic outlook and market trends. We still expect MENA energy capital investment to amount to $740bn for the five-year period 2013-17. Compared with past assessments, which have been uniformly and consistently revised to reflect the full scale and scope of the power sector, investment appears overall on the rise
Figure 5: Rolling Five-year Reviews of MENA Energy Investment(Series revised to reflect the full scope and scale of the power sector)
“Ave
rage
pro
ject
cos
t” In
dex
US$
bill
ion
Successive reviews
2004
-08
2005
-09
2006
-10
2007
-11
2008
-12
2009
-13
2010
-14
2011
-15
2012
-16
2013
-17
100
200
300
400
500
600
700
0
350
400
300
250
200
150
100
MENA apparently shelved (LS)
“Average project cost” index (RS)
MENA actual requirements (LS)
APICORP Research.
5 Between 2007 and 2010 the review framework was amended in an attempt to reflect the huge uncertainty created by the global financial crisis. As a result, our findings fell into two categories: potential investment (originally secured through a ‘Final Decision to Invest’); and actual capital requirements (what is left after deducting shelved projects).
Figure 4: Recent Trends in Natural Gas Prices
0
5
10
15
20
25
OPE
C Re
fere
nce
Bask
et P
rice
($bb
l)
Oxford Institute for Energy Studies - Dec 2012
jan
07
jan
08
jan
07
jan
09
jan
10
jan
11
jul 1
2
jan
12
jul 0
8
jul 0
9
jul 1
0
jul 1
1
Oil Brent Benchmark
Europe Oil-indexed Contract (est.)
UK NBP
Asian LNG Spot
japan LNG (average)
US Henry Hub
again, driven mainly by a catch-up effect and unrelenting rising costs. Indeed, for reasons discussed in later sections of this commentary, our ‘average project cost’ index, which has been subdued in the wake of the global financial crisis, is once again on an uptrend (Figure 5). However, the current amount of investment should not be considered as particularly high, since it is comparable to the nominal peak identified in 2009 when completing the 2010-14 review.5
APICORP 13
6 The biggest MENA holders of combined oil and natural gas reserves in decreasing size are: Iran (50.0 Gtoe), Saudi Arabia (42.8), Qatar (25.8), Iraq (22.3), UAE (18.5), Kuwait (15.1), Libya (7.7) and Algeria (5.7) (source of data: BP Statistical Review of World Energy, June 2012).
Geographical PatternInvestment has fallen below potential in countries where investment decisions and project implementation have been hampered by continuing turmoil. This has somewhat distorted the geographical pattern of investment (Figure 6). A little more than three-quarters of energy capital investment is shared by seven countries among the largest holders of oil and gas reserves which have not faced such turmoil. These exclude Libya but include Iraq, notwithstanding its enduring troubles.6 In Saudi Arabia, investment is projected to reach $165bn, mostly engendered by Saudi Aramco, SABIC and its affiliates, as well as Saudi Electricity Company (SEC), as stand-alone domestic private investors have continued to struggle to attract capital. The UAE has established itself, for the
second consecutive review, as the region’s second-largest investor, with projects worth $107bn. Pending further implementation decisions, Algeria has jumped in the region’s rankings, overtaking both Qatar and Iran as the third potential investor. As investment readiness has gained momentum in the wake of the restoration of good governance within Sonatrach, capital requirements – largely the result of catch-up investment – have reached $71bn. In contrast, tighter international sanctions, and the retreat of foreign companies, have ended up taking a toll on Iran’s elusive energy investment programme, which has tentatively been put at $68bn. Finally, Iraq – despite moving up the rankings ahead of Qatar and Kuwait – with $56bn of capital requirements, is still far below its huge potential.
Figure 6: Country Pattern across Previous and Current Reviews
KSA
Qat
ar
Egyp
t
Om
an
Syri
a
Suda
n*
Bah
rain
Tuni
sia
jor d
an
Mor
occo
Leba
non
yem
en
Mau
rita
nia
Liby
a
UA
E
Alg
eria
Iran
Iraq
Kuw
ait
0
30
60
90
120
150
180
US$
Bill
ion
* Sudan: Aggregate (See footnote no. 1)
2012-16 Review (Adjusted)
2013-17 Review
APICORP Research. Using internal database.
In Iraq, the reaffirmation of the vital need to achieve full development of the oil and natural gas sectors has yet to be translated into coherent policies and actions. In particular, the Iraqi Federal Government (IFG) has yet to pass a long-awaited package of hydrocarbon legislation. This will hardly be possible if IFG and the Kurdistan Regional Government (KRG) fail to come up with a complete and thorough understanding of their pending oil issues. Furthermore, IFG
needs to alleviate infrastructure bottlenecks, and develop better solutions to counter recurrent security threats.
Underinvestment, which has been particularly apparent in Kuwait, is now the case in Qatar as well. In Kuwait, government policy has often been at odds with parliamentary politics; and efforts to align the two have been repeatedly frustrated. As a result, major components
Review of MENA Energy InvestmentSUPPORTING THE TRANSITION
APICORP Annual Report 201214
of upstream development continue to be questioned, while key downstream projects such as the long-delayed giant al-Zour refinery, are still striving for materialisation. In contrast, Qatar’s stagnation is solely the result of policy on whether or not to extend the ongoing moratorium on further development of the North Field, beyond the domestic market-oriented Barzan project. As a result, and despite a shift in emphasis on enhancing oil recovery and expanding the petrochemical industry, energy investment in Qatar has lost momentum.
As already noted, investment has been affected to different degrees in countries still facing political uncertainty. This is the case of Egypt, Libya and Tunisia, and to a larger extent Yemen, where investors have adopted a wait-and-see attitude. Unless supported during what is likely to be a protracted and difficult transition, capacity expansion in these countries will be back-ended towards the end of the review period. Much more critical is the case of Syria, where investment has come to a complete halt, and is unlikely to resume as long as armed violence continues.
In any case, investment in this country is expected to be mostly in repairs, rehabilitation and recovery of destroyed or damaged energy infrastructure.
Sectoral PatternCapturing the full scope and scale of the power sector, and adjusting for the inclusion of transport and distribution systems, has reshaped the sectorial distribution of investment. As a result, each of the oil, gas and power value chains now accounts for a third of the region’s total (Figure 7). In the hydrocarbon sector, the gas downstream link has declined as a result of Qatar’s moratorium, and the consequent pause in its LNG and GTL expansion programme. In contrast, the oil downstream link, where investment is mostly driven by Saudi Aramco’s programme of large-scale integrated refining/petrochemical facilities, has performed well. Much more impressive, however, is investment in power. In this sector, capital requirements have been on a steady rise, and are expected to accelerate during the current review period (see Box).7
7 Investments in nuclear and renewables (mostly solar) are implicit and reflected in the average capacity cost in relevant cases. For nuclear, while the Bushehr plant in Iran has been adding electricity to the national grid since September 2011, Abu Dhabi’s first such plant is not expected to be commissioned during the review period.
Figure 7: Sectoral Pattern Across All Reviews
2008-12 Review
2009-13 Review
2010-14 Review
2011-15 Review
2012-16 Review
2013-17 Review
2007-11 Review
2005-09 Review
2006-10 Review
Oil value chain Natural gas value chain Power
US$
Bill
ion
APICORP Research.
0
50
100
150
200
250
Oil
Ups
trea
m Oil
Mid
stre
am
Oil-
base
d Re
finin
g -
Petr
och
Gas
U
pstr
eam
Gas
M
idst
ream
LNG
- G
TL
Gas
-bas
ed
Petr
och/
Fert
il
Gen
erat
ion
Notwithstanding sustained expansion of investment, power supply has fallen short of needs. To catch up with unmet potential demand, medium-term capacity growth – which has been worked out on a country-by-country basis, is expected to be much higher than that of economic
output: 7.8% for the period 2013-17 against 4.5% for GDP. This would require an investment of about $250bn, with 59% for new generation capacity and the remainder for T&D (see Box).
APICORP 15
BOX: MENA INVESTMENT IN THE POWER GENERATION SECTOR (*)
Many countries within MENA have been struggling to meet fast-growing demand for electricity, which is a consequence of high population
growth, fast expanding urban and industrial sectors, increasing needs for air conditioning, and heavily subsidized electricity tariffs. With ongoing
turmoil in parts of the region, catching up with unmet demand may be perceived as socially and politically more desirable.
In the absence of active demand side management, this will entail a capacity growth of 7.8% per year, which translates into a five-year
increment of 124GW above the 2012 level. Therefore, with current reference costs – reflecting prevailing prices of engineering, procurement
and construction (EPC) and country investment climates – the capital required will be in the order of $148bn for 2013-17. As shown in the table
below, the GCC region, which will continue to grow at the highest rate, accounts for 43% of the MENA total and 53% of the Arab world total
(expenditure for nuclear power generation is implicit for the UAE).
*2011 Estimate1 Maghreb: Algeria, Libya, Mauritania, Morocco and Tunisia.2 Mashreq: Egypt, Iraq, Jordan, Lebanon and Syria.3 GCC: Bahrain, Kuwait, Oman, Qatar,, Saudi Arabia and United Arab Emirates (UAE).4 Rest of Arab World includes Yemen and Sudan, but excludes Comoros, Djibouti and Somalia for lack of data.Compilations and projections by APICORP Research
However, power generation comes with T&D systems. This derives from the need to develop networks to supply electricity to industries,
businesses and households. Transmission grids consist of high voltage lines designed to transfer bulk power from generation plants to large
industrial customers and distribution centres, generally over long distances. In contrast, the function of low voltage distribution grids is to supply
power to final consumers in urban and, whenever socio-economically desirable, in rural areas as well. Under this grid-based supply perspective,
MENA T&D investment amounts to $103bn for 2013-17, with further breakdown given below.
Total Investment in MENA Power Sector for the period 2013-17 ($bn)
Investment in $bn Generation (G) Transmission (T) Distribution (D) Total (T,D) Total (G,T,D)
*2011 Estimate1 Maghreb: Algeria, Libya, Mauritania, Morocco and Tunisia.2 Mashreq: Egypt, Iraq, Jordan, Lebanon and Syria.3 GCC: Bahrain, Kuwait, Oman, Qatar,, Saudi Arabia and United Arab Emirates (UAE).4 Rest of Arab World includes Yemen and Sudan, but excludes Comoros, Djibouti and Somalia for lack of data.Compilations and projections by APICORP Research
(*) Summary from ‘MENA Power Reassessed: Growth Potential, Investment and Policy Challenges’, APICORP Economic Commentary, April-May 2012.
Review of MENA Energy InvestmentSUPPORTING THE TRANSITION
APICORP Annual Report 201216
MENA total energy investment, as validated in the present review, will not be fully realised without addressing serious constraints, prominent among which are cost, fuel/feedstock and funding. These constraints, which are far beyond the scope and resources of any project developer, pose considerable policy challenges.
CONSTRAINTS AND POLICy CHALLENGES
Cost UncertaintiesAs indicated by the evolution of our index (Figure 5), the cost of an ‘average energy project,’ which has almost trebled between 2003 and 2008, has resumed its upward trend after stabilising somewhat in the middle of the global financial crisis. However, the relatively moderate 7% upward trend underpinning the current review should not be misinterpreted. The extent to which project costs
are predictable, depends on the outlook for the price of engineering, procurement and construction (EPC) and its components. As shown in Figure 8, these include the prices of factor inputs, contractors’ margins, project risk premiums, and an element that mirrors general price inflation in the region; not to mention the cost of what we have dubbed ‘excessive largeness’, the documented fact that large-scale projects tend to incur significant delays and cost overruns. Energy project costs would have certainly quadrupled during the last ten years, if not for the dampening effect of the global financial crisis. The likelihood is that costs will continue rising. However, despite efforts to quantify in a meaningful way each of the above-mentioned parameters, we have found it difficult to infer how far up, and for how long, the overall cost trend is likely to be when combining all components.
1 ‘MENA Natural Gas Endowment Is Likely To Be Much Greater Than Commonly Assumed’, APICORP Economic Commentary, December 2012.
Figure 8: Large-scale Energy Project Cost Structure
APICORP Research.
45%
15%
10%
20%
10%
10% Contrractors’ margins
15% Risk premiums
10% Exessive largeness
20% Others
45% Factor inputs
Feedstock AvailabilityThe next challenge is the supply of fuel/feedstock – primarily ethane and natural gas – to the petrochemical industry and the power sector. Our findings confirm and extend previous results, showing that on aggregate, MENA proved reserves are substantial, and that their combined dynamic life is a little beyond the traditional 30-year strategic planning horizon for exploration and development (E&D). However, reserve depletion in more
than half our large sample of gas-endowed countries has critically neared – if not already reached – the point that warrants drastic actions to curb demand, and support more vigorously a supply response (Figure 9).1 This is particularly the case of Bahrain, Libya, Kuwait, Saudi Arabia, Tunisia, the UAE, and to some extent Yemen and Iraq – although Iraq can increase supply at much shorter lead-times by simply cutting down on gas flaring.
APICORP 17
Funding Conditions Uncertainties surrounding project costs and fuel/feedstock supplies are compounded by a marked deterioration of funding conditions, which is likely to further complicate the strategic decisions made by project sponsors in the region with respect to investment and financing.
In a context of prevalent deleveraging, the financing of energy projects is expected to be structured with less debt. On the one hand, the upstream, midstream and T&D systems in the power sector will continue depending heavily on internal funding in the form of either corporate retained earnings or state budget allocations. On the other hand, the hydrocarbon downstream, which has traditionally relied on debt, typically in a proportion of 70%, will need more equity. This derives from recent observations in the oil based refining/petrochemical link, where the equity-debt ratio has been 35:65. More compelling is the trend in the gas-based downstream link, where the ratio has been 40:60, almost certainly to factor in higher risks of feedstock unavailability. Similarly, in the power generation segment, the debt ratio has been reset downward to reflect reduced leverage of projects developed by independent power and water/power producers (IPPs and IWPPs). As a result, the capital-weighted average structure for the oil, gas and power value chains has been found to be 61% equity and
39% debt. This structure conforms to trends observed since the onset of the global financial crisis, once adjustments to include T&D systems in the power sector have been made.
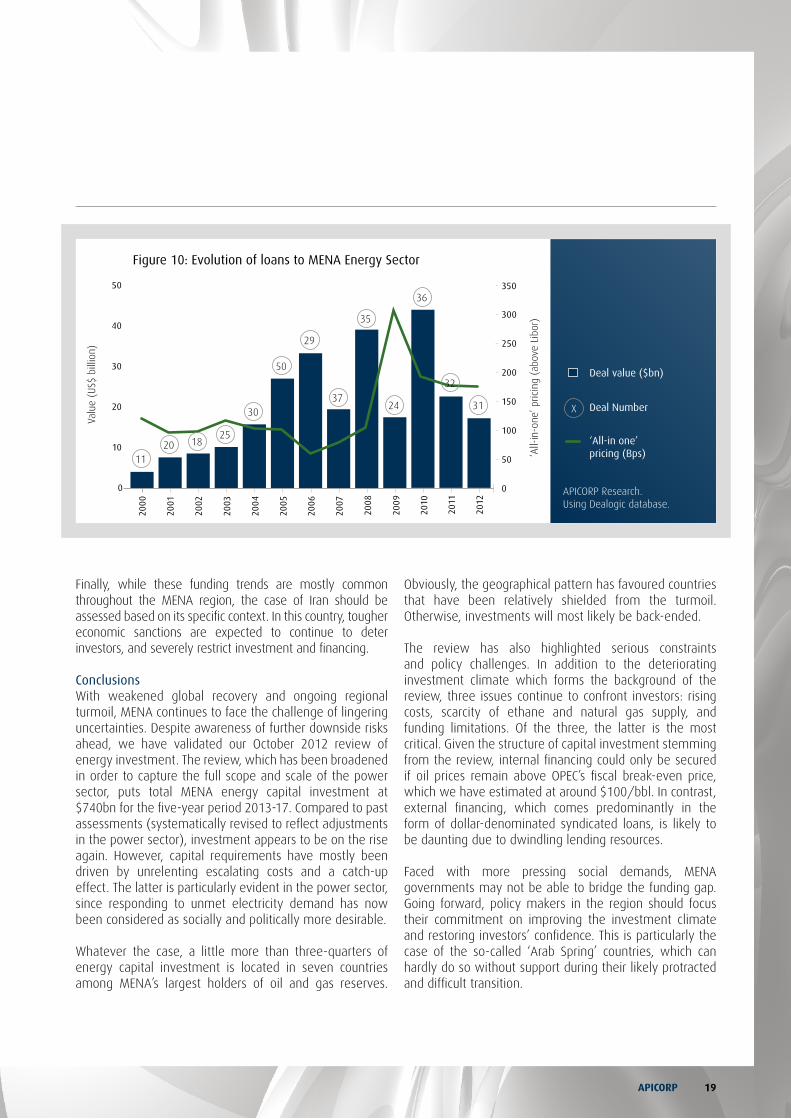
The shift in the energy capital structure does not diminish the challenge of meeting funding from both equity and debt. On the one hand, we have estimated that any prolonged period of low oil prices (value of OPEC basket of crudes) below $100/bbl will affect internal financing for the upstream sector. On the other hand, funding prospects for the downstream, albeit less leveraged, are now highly uncertain. The total annual volume of debt of $58bn, which results from the capital requirements found in the current review and the likely capital structure highlighted above, is much higher than the record of $44bn achieved in the loan market in 2010 (Figure 10). Raising such amounts of debt in the context of a collapsing dollar-denominated syndicated loans market and tight lending conditions, will hardly be possible even with greater recourse to export credit agencies (ECA) and local commercial banks. The resulting shortfall could be even larger if MENA public investment funds, which have stepped up their involvement in the local loan market in recent years, do not receive enough government support due to increasing social demands for public funds.
Figure 9: Distances to Optimal Natural Gas Supply Pattern
KSA
Qat
ar
Egyp
t
Om
an
Syri
a
Bah
rain
Tuni
sia
yem
en
Liby
a
UA
E
Alg
eria
Iran
Iraq
Kuw
ait
-5%
-10%
0%
5%
10%
15%
20%
US$
Bill
ion Distance to OST <0%
Distance to OST 0-10%
Distance to OST >10%
APICORP Research.
Review of MENA Energy InvestmentSUPPORTING THE TRANSITION
APICORP Annual Report 201218
Finally, while these funding trends are mostly common throughout the MENA region, the case of Iran should be assessed based on its specific context. In this country, tougher economic sanctions are expected to continue to deter investors, and severely restrict investment and financing. Conclusions With weakened global recovery and ongoing regional turmoil, MENA continues to face the challenge of lingering uncertainties. Despite awareness of further downside risks ahead, we have validated our October 2012 review of energy investment. The review, which has been broadened in order to capture the full scope and scale of the power sector, puts total MENA energy capital investment at $740bn for the five-year period 2013-17. Compared to past assessments (systematically revised to reflect adjustments in the power sector), investment appears to be on the rise again. However, capital requirements have mostly been driven by unrelenting escalating costs and a catch-up effect. The latter is particularly evident in the power sector, since responding to unmet electricity demand has now been considered as socially and politically more desirable.
Whatever the case, a little more than three-quarters of energy capital investment is located in seven countries among MENA’s largest holders of oil and gas reserves.
Obviously, the geographical pattern has favoured countries that have been relatively shielded from the turmoil. Otherwise, investments will most likely be back-ended.
The review has also highlighted serious constraints and policy challenges. In addition to the deteriorating investment climate which forms the background of the review, three issues continue to confront investors: rising costs, scarcity of ethane and natural gas supply, and funding limitations. Of the three, the latter is the most critical. Given the structure of capital investment stemming from the review, internal financing could only be secured if oil prices remain above OPEC’s fiscal break-even price, which we have estimated at around $100/bbl. In contrast, external financing, which comes predominantly in the form of dollar-denominated syndicated loans, is likely to be daunting due to dwindling lending resources.
Faced with more pressing social demands, MENA governments may not be able to bridge the funding gap. Going forward, policy makers in the region should focus their commitment on improving the investment climate and restoring investors’ confidence. This is particularly the case of the so-called ‘Arab Spring’ countries, which can hardly do so without support during their likely protracted and difficult transition.
Figure 10: Evolution of loans to MENA Energy Sector