39
Review of Semi-Independent Agency Reports Legislative Fiscal Office December 2012
Review of Semi-Independent
Agency Reports
Legislative Fiscal Office
December 2012

Review of Semi-independent Agency Reports
Table of Contents Page Summary ............................................................................................................. 1 Background .......................................................................................................... 1 Authority ............................................................................................................... 2 Review Process ................................................................................................... 2 Required Content ................................................................................................. 2 Findings ............................................................................................................... 3 Conclusions and Recommendations ................................................................. 10 Appendix A – Operations Summary for 2009-11 Biennium .............................. A-1 Appendix B – Fund Balance Summary / Budget Analysis................................ B-1 Appendix C – Sample Licensing and Enforcement Activity Spreadsheet ........ C-1 Appendix D – 2014 Semi-independent Agency Reporting Guidelines ............. D-1

1
Summary This review fulfills the Legislative Fiscal Office’s (LFO) requirement to provide the Joint Legislative Audit Committee and the Joint Committee on Ways and Means with a statement of findings and conclusions related to the semi-independent agency reports submitted pursuant to ORS 182.472.
The review covers agency performance for the 2009-11 biennium and the adopted budget for the 2011-13 biennium. For this review cycle, LFO corresponded via email and telephone, and met in person with agencies as needed to verify report content and discuss each agency’s response to financial review recommendations. During this process, LFO asked for additional data and explanatory information to close information gaps and resolve issues identified so that all affected agencies would be in compliance with ORS 182.472. Throughout the review process, agencies were very cooperative and open to improving the quality and consistency of future reports.
For future reports, LFO recommends that agencies:
1. continue following the updated reporting guidelines prepared by LFO (Appendix D).
2. establish documented procedures for collecting and reporting of licensing and enforcement data; and include this document with the biennial report.
3. continue use of financial reviews (for agencies that find them beneficial).
Background
ORS 182.454 requires the following eleven semi-independent agencies to submit a biennial report to the Governor, the President of the Senate, the Speaker of the House, and the Legislative Fiscal Officer by April 1 of each even-numbered year: Oregon Board of Architect Examiners
Appraiser Certification and Licensure Board
Oregon State Board of Examiners for Engineering and Land Surveying
Board of Geologist Examiners
State Landscape Architect Board
2
State Landscape Contractors Board
Oregon Board of Massage Therapists
Oregon Board of Optometry
Physical Therapist Licensing Board
Oregon Patient Safety Commission
Oregon Wine Board
Appendix A provides a summary profile for each of these semi-independent agencies.
Authority ORS 182.472 requires the Legislative Fiscal Office to review the reports and issue a statement of findings and conclusions to the Joint Legislative Audit Committee and the Joint Committee on Ways and Means. This report fulfills the requirement.
Review Process The review is focused on the provisions of ORS 182.472 and covers reports submitted for the April 1, 2012 deadline. Reports were reviewed for completeness and compliance with statutory requirements. This review should not be considered an audit as findings and conclusions are limited to the information provided by agencies in response to ORS 182.472.
As part of this review, LFO corresponded via email and telephone, and met in person with agencies as needed to collect missing information, provide feedback on report content, and to discuss proposed recommendations for future reports. In all cases, agencies were responsive to requests for information and appreciative of LFO’s efforts at providing more specific structure and guidance to improve the quality of future reports.
Required Content
The required content of agency reports is detailed in ORS 182.472. . 182.472 Reports. Not later than April 1 of each even-numbered
year, each board subject to ORS 182.456 to 182.472 shall
submit a report to the Governor, the President of the Senate,
the Speaker of the House of Representatives and the Legislative
Fiscal Officer. The Legislative Fiscal Officer shall review the
reports and shall prepare and submit a statement of findings
and conclusions to the Joint Legislative Audit Committee and
3
the Joint Committee on Ways and Means. The report must
include the following:
(1) A copy of the most recent audit or financial review of the
board.
(2) A copy of the actual budget for the prior biennium and a
copy of the board’s adopted budget for the biennium in which
the report is made. The budget documents must show:
(a) The beginning balance and ending balance for each of
the two biennia;
(b) A description of material changes between the two
biennia;
(c) A description of the public hearing process used to
establish the budget adopted for the current biennium; and
(d) A description of current fees and proposed changes to
fees, along with information supporting the amounts of the
current fees and any proposed changes to the fees.
(3) A description of all temporary and permanent rules adopted
by the board during the prior biennium.
(4) A description of board actions promoting consumer
protection that were taken during the prior biennium.
(5) If the board issues licenses, a description of the board’s
licensing activities performed during the prior biennium that is
adequate to allow evaluation of the board’s performance of its
licensing responsibilities, including:
(a) The number of license applications;
(b) The number of licenses issued;
(c) The number of examinations conducted;
(d) The average time between application for and issuance
of licenses;
(e) The number and types of complaints received about
persons holding licenses;
(f) The number and types of investigations conducted;
(g) The number and types of resolutions of complaints;
(h) The number and type of sanctions imposed; and
(i) The number of days between beginning an investigation
and reaching a resolution.
(6) A description of all other actions taken during the prior
biennium in the performance of the board’s statutory
responsibilities that is adequate to allow evaluation of the
board’s performance.
Findings
LFO’s review identified the following key findings:
General Reporting: All eleven agencies submitted reports that generally complied with the content requirements specified in ORS 182.472. However, there were a few cases where information provided was insufficient and/or the range and type of information provided was inconsistent. For a few
4
agencies, the information regarding licensing activities still varied significantly from each reporting period.
This variance appears to be the result of inconsistent data collection (shifting definitions of licensure, processing time, complaints, investigations, resolutions, and sanctions for each reporting period) making it difficult to glean reliable trending information, context, and insight from the data provided. Staff turnover also contributes to variance in data collection and reporting.
Moving from Financial Audit to Financial Review: SB 70 (2007) modified ORS 182.472 to enable semi-independent agencies to contract for a financial review or a financial audit. Because the financial review can include a detailed assessment of operational processes and practices, LFO recommended that agencies pilot the use of financial reviews.
For the 2012 reporting period, ten of the eleven agencies opted to use financial reviews. These agencies found the reviews to be less costly and more useful because the information and recommendations received were more specific to best practices for small agencies. All ten of the agencies anticipate continuing with financial reviews. Because organizations that expend $500,000 or more in federal awards must undergo an audit in accordance with OMB Circular A-133, the Oregon Patient Commission may not be able to use financial reviews in the future, as it receives a great number of federal grants.
Summary of Financial Audits/Reviews: The statute requires that “the most recent audit or financial review of the board” be submitted. Ten of the eleven agencies submitted a Wicklund & Lew, CPAs financial review for the biennium ended June 30, 2011. The remaining agency, the Board of Examiners for Engineering and Land Surveying, submitted the Secretary of State Audit report for the biennium ending June 30, 2011.

5
The reviews for all ten financial reviews included an examination of: (1) internal controls related to financial, accounting, and licensing processes; (2) cash controls; and (3) revenues and expenditures. The evaluations of these agreed upon procedures, found that, generally, adequate controls were in place, but also identified opportunities for improvement. All ten agencies submitted responses to the review findings with plans for strengthening internal controls.
The Board of Examiners for Engineering and Land Surveying received an unqualified opinion that the agency appropriately followed accounting rules and that the financial reports are an accurate representation of the agency's financial condition. There were no instances of noncompliance.
Budget and Fund Analysis: All agencies provided [1] a balance sheet for the 2009-11 biennium; [2] comparison of budgeted to actual revenues and expenditures for the 2007-09 and 2009-11 biennia; [3] projected/adopted budget for the 2011-13 biennium; and [4] forecasted balance sheet for the 2011-13 biennium. In general, agencies clearly identified beginning and ending balances, and variances between reported and audited numbers were adequately explained.
2009-2011 Budget The 2009-11 budgets for Semi-Independent Agencies ranged from around $3.1 million for the Oregon Wine Board to just under $300,000 for the State Landscape Architect Board. Ten of the eleven agencies performed under budget for the biennium while one agency, the Oregon Patient Safety Commission, exceeded budgeted expenditures because the agency did not amend its adopted budget to include two federal grants. This oversight occurred during the agency’s transition to a new Director.
Additionally, for the 2009-11 biennium, revenue exceed budgeted projections for six of the eleven agencies. These revenue increases were a

6
result of increased numbers of licensees, or in the case of one agency, a result of receiving two federal grants. 2011-2013 Budget Seven of the eleven agencies have budget increases between 2009-11 and 2011-13. Changes above the inflationary increases to agency budgets included rising costs of employee benefits and legal fees, as well as investments to update telephone and computer systems.
Five boards projected a reduction in revenue between 2009-11 and 2011-13. This reduction is due to the continued struggles of the economic climate. See Appendix B for
A summary of budgeted and actual fund balance, revenue and expenditure numbers for the 2009-11 and 2011-13 biennium.
A brief budget analysis for each of the eleven agencies.
Public Hearing Process: Each agency provided a description of the public hearing process used to establish the adopted 2011-13 budget, including dates and descriptions of actions taken. Permanent Rules: All agencies provided a “description of all temporary and permanent rules adopted by the board,” and process dates in their descriptions of board rules. Agencies are generally complying with public hearing requirements and rule making processes.
Fees: During the 2009-11 biennium, two agencies increased existing fees, and two agencies implemented new fees for new services. During the 2011-13 biennium, two agencies budgeted fee increases, and two agencies plan to implement new fees for new services. Agencies included sufficient information on the board deliberations and evaluation processes that resulted in the need for a
7
new fee or fee increase. Fee increases ensured the continued solvency of the board, and new fees were implemented to offer new, optional, value-added services.
Additional Board Actions Promoting Consumer Protection: Typically, agencies provided consumer information and outreach using websites, newsletters, email alerts, training, speaking engagements, and attendance at conferences. In addition, agencies developed partnerships with other organizations, educators, and practitioners to foster ethical behavior and professional conduct.
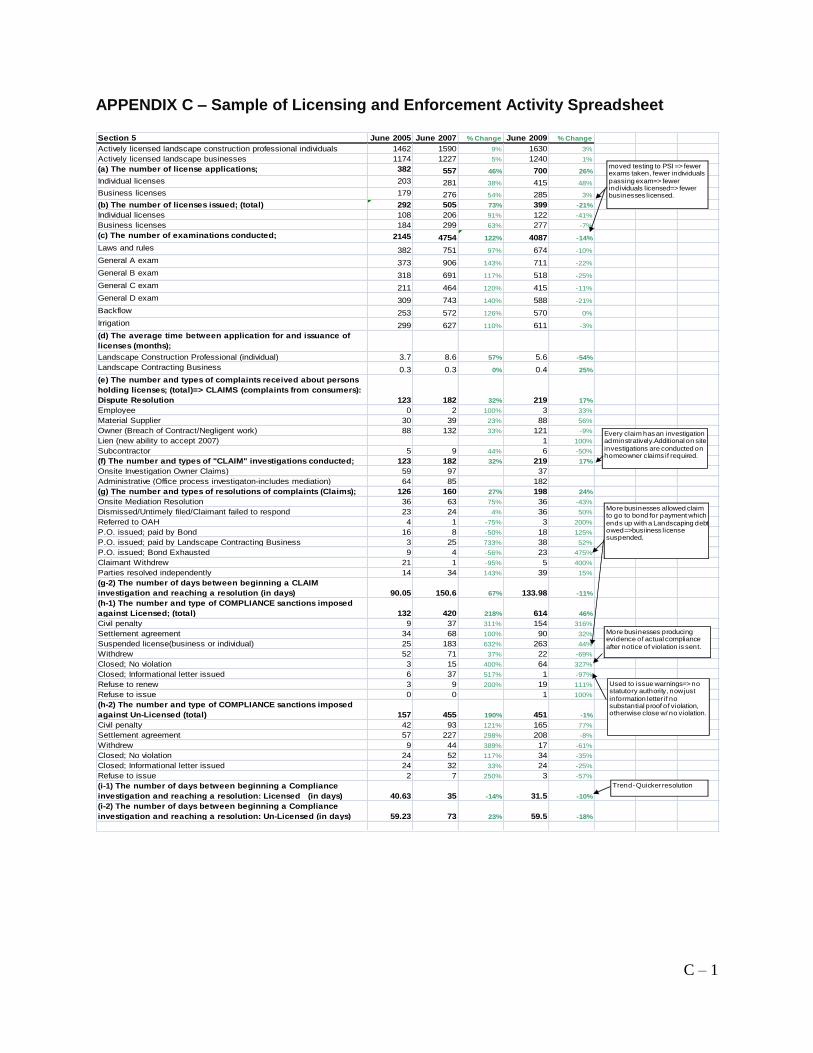
Licensing and Enforcement Activities: The intent of collecting and reporting the data required by ORS 182.472 (5) is to provide reliable and accurate indicators of workforce (licensees) and performance (exams proctored, processing time, complaints received, investigations conducted, backlog risk, sanctions imposed), in order to ensure each agency’s responsiveness to its constituents and market forces. While the statute does not specifically require that agencies include multiple years of data, LFO’s previous reports recommended that agencies include multiple years of data (10 years or 5 biennia) so trending would be possible. To help ensure that multiple years of data are provided, in 2008, LFO worked with each agency to develop a spreadsheet template to use in future reports (Appendix C). For this reporting period, most agencies provided data for the 2007-09 and 2009-11 biennia. Although most agencies followed the LFO recommendations and template, the data still varied significantly from each reporting period for some agencies. Staff turnover contributes significantly to variance in data collection and reporting. In addition, inconsistent data collection appears to be the result of shifting definitions and parameters. For example, one agency included both active and inactive licenses issued for one biennium, but only counted active licenses for the next biennium. LFO acknowledges that data collection and processing methods often change over time. For example, various activity status codes are added or removed by semi-independent agencies, and, at times, a

8
determination may be made to begin to count licensees with a particular license or status code which may not have been counted in previous years. Conversely, at times a determination is made to cease to include licensees with a particular license or status code. Although these types of changes may make sound business sense and result in more accurate data at that specific time, they also skew the trend lines when doing an analysis of trends over a period of time when different collection methods are used. To prevent faulty analysis resulting from these types of changes in future reports, LFO recommends each agency document its data collection process. The establishment of consistent definitions and parameters along with additional years of reporting will allow for more complete, accurate, and reliable data collection, and therefore more meaningful insights and trends to be gleaned from the data provided.
Other Performance Indicators: The Oregon Wine Board and the Oregon Patient Safety Commission do not provide licensing services, and the Wine Board does not have consumer protection as part of its mission. In accordance with LFO recommendations, these agencies provided information that enables LFO to review board performance in line with the expectations of ORS 182.472. The Oregon Wine Board submitted its 2009-10 and 2010-11 Annual Reports. The Oregon Patient Safety Commission uses sound metrics developed from national benchmarks to track its performance. One of the metrics includes an accounting of the number of hospitals, ambulatory surgery centers, nursing homes, retail pharmacies, and renal dialysis centers participating in the Commission’s fee-based voluntary reporting program. LFO recommends the Commission include a copy of the most recent Public Health Officer Certification with future reports.
Other Semi-Independent Agencies: The Oregon Travel Information Council (OTIC) is required by ORS 377.838 to file an annual report of the activities and operations of the council with the Governor and the Legislative Assembly. Similarly, the Oregon Film
9
and Video Office is required by ORS 284.335 to file with the Governor and the Legislative Assembly a biennial report of the activities and operations of the office. SB 939 (2011) amended ORS 284.335 and ORS 377.838 to add the Legislative Fiscal Officer to list of entities receiving these reports. In addition, SB 939 (2011) requires the Oregon Tourism Commission (Travel Oregon) to file copies of the agency’s adopted or modified budget, and financial statements with the Legislative Fiscal Officer not later than five days after these documents are prepared or adopted. These agencies submitted the required documents:
*The Oregon Travel Information Council (OTIC) submitted a Wicklund & Lew, CPAs financial review for the biennium ending June 30, 2011. OTIC’s mission is to create a great visitor experience by providing direction to destinations, connecting travelers with Oregon’s resources, and ensuring safe and convenient travel. OTIC programs include business highway signs, brochure display programs, rest area light-box advertising, Travel Plazas, TripCheck.com, and rest area management. The agency began managing and improving the Oregon Department of Transportation (ODOT) rest areas in 2010. The Council is funded by fees charged for voluntary participation in travel-related highway signage, and funds from ODOT to manage the rest areas. For the 2009-11 biennia, actual revenues of $8,569,588 did not meet budget projections of $9,248,887 by 8% or $715,299. Two anticipated programs (Wine Tour and Interactive Map) did not materialize. Revenues related to back-lit signs in information centers were lower than anticipated in the budget. Total actual expenditures of $8,617,704 were 1% or $111,845 lower than budgeted expenditures. The financial review evaluated internal controls related to receipts, disbursements, and accounting processes. Following the recommendations of the review, OTIC recruited a Business Director and moved the accounting from cash to accrual basis.
*The Oregon Film and Video Office submitted the legislative report the agency presented to the 2011 Legislature. The Office receives Lottery Funds

10
passed through the Oregon Business Development Department (OBDD) for agency operations and certifies up to $1 million of income tax credits per year.
*The Oregon Tourism Commission (Travel Oregon) is required by ORS 284.126 to adopt budgets on a biennial basis, and those portions of the budget funded by appropriations from the General Fund or Lottery Funds are subject to approval and/or modifications by the Legislative Assembly and the Emergency Board. In addition, the remainder of the budget is subject to review and recommendation by the Legislative Assembly. The Commission is funded from the 1% state transient lodging tax. *Because these agencies are required to present their budget and agency operations information to a legislative committee or through the state budget process, this report does not include a detailed review.
Conclusions and Recommendations
The findings of this review point to several key conclusions (identified by italic text) and related recommendations (identified by bold text).
This is the second time the agencies used the reporting guidelines created by LFO. The guidelines have served as a useful tool for ensuring complete and uniform reporting. LFO has revised the reporting guidelines for 2014 (See Appendix D). LFO recommends that agencies continue to follow the updated guidelines for the 2014 reporting cycle.
Information regarding licensing and enforcement activities still varied considerably from each reporting period. Staff turnover contributes significantly to variance in data collection and reporting. In addition, this variance appears to be the result of inconsistent data collection (shifting definitions of licensure, processing time, complaints, investigations, resolutions, and sanctions for each reporting period) making it difficult to glean trending information, context,
11
and insight from the data provided. Given these issues, LFO has created worksheet templates (See Appendix C) to assist agencies in the reporting of data. LFO recommends that each agency establishes and documents a formal procedure for its data collection process. Agencies should include this document with their biennial report. The establishment of consistent definitions and parameters will allow for more complete, accurate, and reliable data collection, and therefore more meaningful insights and trends to be gleaned from the data provided.
Agencies now may contract for financial reviews instead of a financial audit. The ten agencies that used a financial review found that they provided more detailed information on financial processes, practice deficiencies, and opportunities for improvement. The financial review’s evaluation of processes and internal controls offered valuable suggestions for improving agency performance results. Because organizations that expend $500,000 or more in federal awards must undergo an audit in accordance with OMB Circular A-133, the Oregon Patient Commission may not be able to use financial reviews in the future, as it receives a great number of federal grants. LFO recommends the continued use of financial reviews for agencies that do not expend federal funds, and find them beneficial. LFO recommends that the financial review include a compilation of reviewed financial statements. In addition to the financial operations, the risk assessment and the appraisal of internal controls should include, but not be limited to, the following:
board member recruitment, appointment, training and duties;
information technology systems security*,
licensing processes, requests for proposals, rulemaking process,
12
procurement contracts, and vendor relationships.
*Agencies may choose to work with the Department of Administrative Services’ Enterprise Risk Management Office for a review and risk assessment of the agency’s information technology system, instead of including it in the financial review contract.

APPENDIX A Semi-Independent Agencies: Operations Summary for 2009-2011 Biennium
2009-2011 Director 2009-2011 2011-2013
Pos. FTE Industry Public
Board
Meetings Individuals
Firms/
Business Board Stipend
Monthly
Salary on
6/30/2011
Budget
Expenditures
Oregon Board of Architect
Examiners 5 3.50 5 2 12 2,939 625 $60/day $6,249 $846,500
Appraiser Certification and
Licensure Board 6 5.50 6 1 9 1,693 - $30/day $7,585 $1,725,041
Oregon State Board of
Examiners for Engineering
and Land Surveyors 13 12.00 9 2 13 25,054 - $30/day $7,700 $2,679,586
Oregon Board of Geologist
Examiners 2 2.00 4+
1 12 1,197 - $100/day $6,046 $457,420
State Landscape Architect
Board u u 4 3 15 471 201 $50/day * $340,524
State Landscape Contractors
Board 5 5.00 5 2
16 in person
8 phone 1,396 1,159 $30/day $6,349 $1,270,740
Oregon Board of Massage
Therapists 5 5.00 4 3 21 6,253 -
$100/month-members
$375/month - Chair $8,365 $1,601,478
Oregon Board of Optometry 3 2.20 4 1
10 in person
2 phone 1,235 -
$100/day or
$12.50/hour < 4 hours $6,000 $658,809
Physical Therapist Licensing
Board 3 2.80 6 2 15 4,347 -
$150/day or
$75/day < 4 hours $8,106 $988,900
Oregon Patient Safety
Commission
4 Perm
3 LD
4.25 Perm
2.50 LD 17 0 12 o o None Paid $8,208 $1,933,351
Oregon Wine Board 7 6.50 9 0 13 o o None Paid $10,000 $3,932,700
+ Plus one ex officio member (State Geologist)
u Contracted services from Orgeon State Board of Geologist Examiners
o Not a licensing agency
$2,221,649
$412,422
$1,230,352
$3,103,726
$280,643
$1,217,756
$1,451,534
$591,272
$850,768
Board Members Approximate # Licensees
Actual Expenditures
$817,942
$1,322,531
A – 1
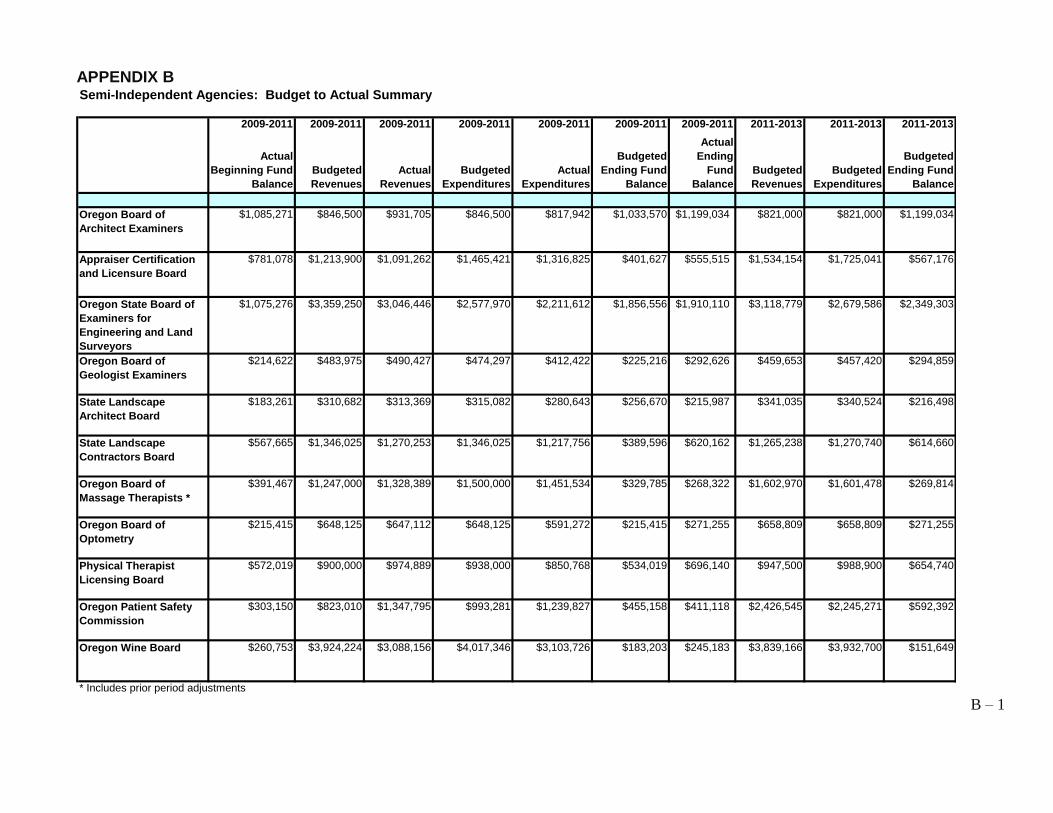
APPENDIX B Semi-Independent Agencies: Budget to Actual Summary
50 100 100 50 25 25
2009-2011 2009-2011 2009-2011 2009-2011 2009-2011 2009-2011 2009-2011 2011-2013 2011-2013 2011-2013
Actual
Beginning Fund
Balance
Budgeted
Revenues
Actual
Revenues
Budgeted
Expenditures
Actual
Expenditures
Budgeted
Ending Fund
Balance
Actual
Ending
Fund
Balance
Budgeted
Revenues
Budgeted
Expenditures
Budgeted
Ending Fund
Balance
Oregon Board of
Architect Examiners
$1,085,271 $846,500 $931,705 $846,500 $817,942 $1,033,570 $1,199,034 $821,000 $821,000 $1,199,034
Appraiser Certification
and Licensure Board
$781,078 $1,213,900 $1,091,262 $1,465,421 $1,316,825 $401,627 $555,515 $1,534,154 $1,725,041 $567,176
Oregon State Board of
Examiners for
Engineering and Land
Surveyors
$1,075,276 $3,359,250 $3,046,446 $2,577,970 $2,211,612 $1,856,556 $1,910,110 $3,118,779 $2,679,586 $2,349,303
Oregon Board of
Geologist Examiners
$214,622 $483,975 $490,427 $474,297 $412,422 $225,216 $292,626 $459,653 $457,420 $294,859
State Landscape
Architect Board
$183,261 $310,682 $313,369 $315,082 $280,643 $256,670 $215,987 $341,035 $340,524 $216,498
State Landscape
Contractors Board
$567,665 $1,346,025 $1,270,253 $1,346,025 $1,217,756 $389,596 $620,162 $1,265,238 $1,270,740 $614,660
Oregon Board of
Massage Therapists *
$391,467 $1,247,000 $1,328,389 $1,500,000 $1,451,534 $329,785 $268,322 $1,602,970 $1,601,478 $269,814
Oregon Board of
Optometry
$215,415 $648,125 $647,112 $648,125 $591,272 $215,415 $271,255 $658,809 $658,809 $271,255
Physical Therapist
Licensing Board
$572,019 $900,000 $974,889 $938,000 $850,768 $534,019 $696,140 $947,500 $988,900 $654,740
Oregon Patient Safety
Commission
$303,150 $823,010 $1,347,795 $993,281 $1,239,827 $455,158 $411,118 $2,426,545 $2,245,271 $592,392
Oregon Wine Board $260,753 $3,924,224 $3,088,156 $4,017,346 $3,103,726 $183,203 $245,183 $3,839,166 $3,932,700 $151,649
* Includes prior period adjustments B – 1

APPENDIX B
B – 2
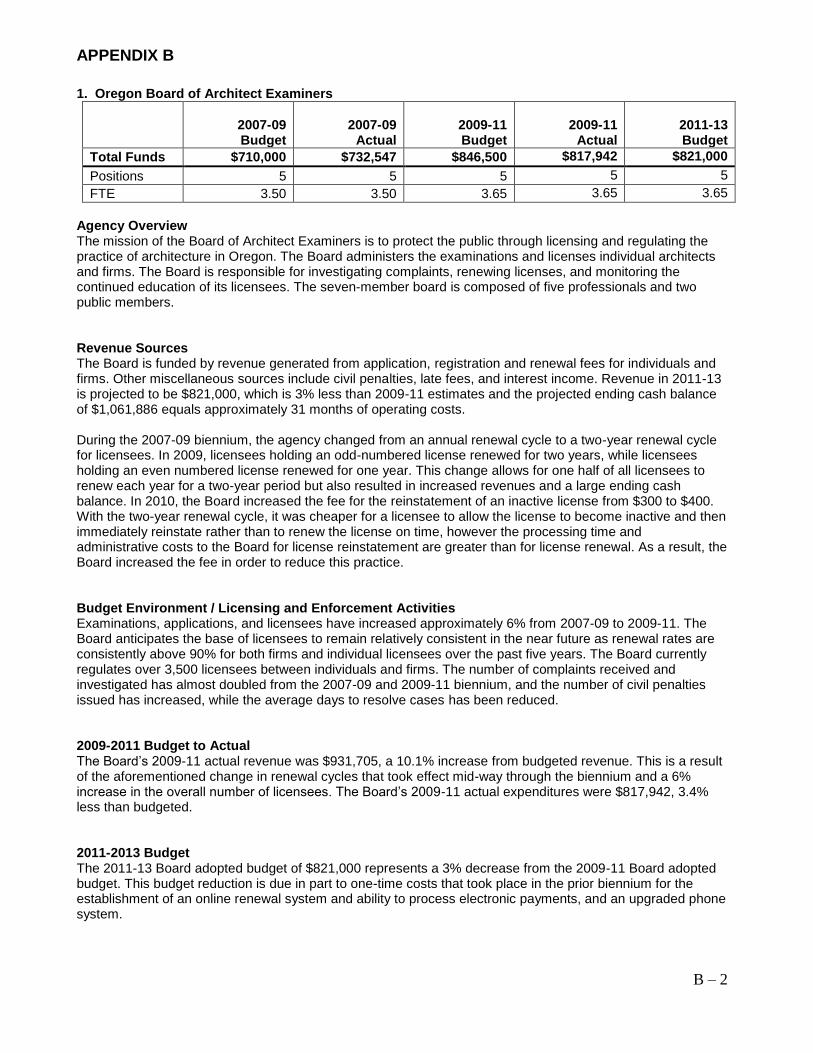
1. Oregon Board of Architect Examiners
2007-09 Budget
2007-09
Actual
2009-11 Budget
2009-11
Actual
2011-13 Budget
Total Funds $710,000 $732,547 $846,500 $817,942 $821,000
Positions 5 5 5 5 5
FTE 3.50 3.50 3.65 3.65 3.65
Agency Overview The mission of the Board of Architect Examiners is to protect the public through licensing and regulating the practice of architecture in Oregon. The Board administers the examinations and licenses individual architects and firms. The Board is responsible for investigating complaints, renewing licenses, and monitoring the continued education of its licensees. The seven-member board is composed of five professionals and two public members. Revenue Sources The Board is funded by revenue generated from application, registration and renewal fees for individuals and firms. Other miscellaneous sources include civil penalties, late fees, and interest income. Revenue in 2011-13 is projected to be $821,000, which is 3% less than 2009-11 estimates and the projected ending cash balance of $1,061,886 equals approximately 31 months of operating costs. During the 2007-09 biennium, the agency changed from an annual renewal cycle to a two-year renewal cycle for licensees. In 2009, licensees holding an odd-numbered license renewed for two years, while licensees holding an even numbered license renewed for one year. This change allows for one half of all licensees to renew each year for a two-year period but also resulted in increased revenues and a large ending cash balance. In 2010, the Board increased the fee for the reinstatement of an inactive license from $300 to $400. With the two-year renewal cycle, it was cheaper for a licensee to allow the license to become inactive and then immediately reinstate rather than to renew the license on time, however the processing time and administrative costs to the Board for license reinstatement are greater than for license renewal. As a result, the Board increased the fee in order to reduce this practice.
Budget Environment / Licensing and Enforcement Activities Examinations, applications, and licensees have increased approximately 6% from 2007-09 to 2009-11. The Board anticipates the base of licensees to remain relatively consistent in the near future as renewal rates are consistently above 90% for both firms and individual licensees over the past five years. The Board currently regulates over 3,500 licensees between individuals and firms. The number of complaints received and investigated has almost doubled from the 2007-09 and 2009-11 biennium, and the number of civil penalties issued has increased, while the average days to resolve cases has been reduced. 2009-2011 Budget to Actual The Board’s 2009-11 actual revenue was $931,705, a 10.1% increase from budgeted revenue. This is a result of the aforementioned change in renewal cycles that took effect mid-way through the biennium and a 6% increase in the overall number of licensees. The Board’s 2009-11 actual expenditures were $817,942, 3.4% less than budgeted.
2011-2013 Budget The 2011-13 Board adopted budget of $821,000 represents a 3% decrease from the 2009-11 Board adopted budget. This budget reduction is due in part to one-time costs that took place in the prior biennium for the establishment of an online renewal system and ability to process electronic payments, and an upgraded phone system.
APPENDIX B
B – 3
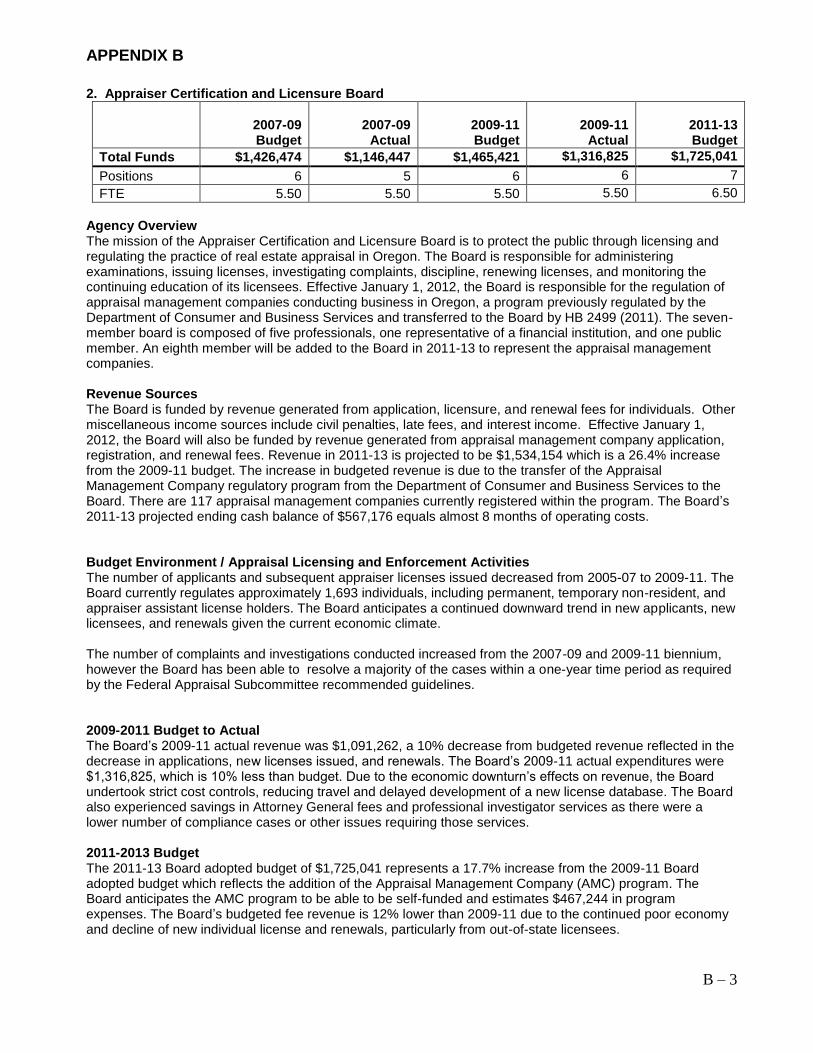
2. Appraiser Certification and Licensure Board
2007-09 Budget
2007-09
Actual
2009-11 Budget
2009-11
Actual
2011-13 Budget
Total Funds $1,426,474 $1,146,447 $1,465,421 $1,316,825 $1,725,041
Positions 6 5 6 6 7
FTE 5.50 5.50 5.50 5.50 6.50
Agency Overview The mission of the Appraiser Certification and Licensure Board is to protect the public through licensing and regulating the practice of real estate appraisal in Oregon. The Board is responsible for administering examinations, issuing licenses, investigating complaints, discipline, renewing licenses, and monitoring the continuing education of its licensees. Effective January 1, 2012, the Board is responsible for the regulation of appraisal management companies conducting business in Oregon, a program previously regulated by the Department of Consumer and Business Services and transferred to the Board by HB 2499 (2011). The seven-member board is composed of five professionals, one representative of a financial institution, and one public member. An eighth member will be added to the Board in 2011-13 to represent the appraisal management companies. Revenue Sources The Board is funded by revenue generated from application, licensure, and renewal fees for individuals. Other miscellaneous income sources include civil penalties, late fees, and interest income. Effective January 1, 2012, the Board will also be funded by revenue generated from appraisal management company application, registration, and renewal fees. Revenue in 2011-13 is projected to be $1,534,154 which is a 26.4% increase from the 2009-11 budget. The increase in budgeted revenue is due to the transfer of the Appraisal Management Company regulatory program from the Department of Consumer and Business Services to the Board. There are 117 appraisal management companies currently registered within the program. The Board’s 2011-13 projected ending cash balance of $567,176 equals almost 8 months of operating costs. Budget Environment / Appraisal Licensing and Enforcement Activities The number of applicants and subsequent appraiser licenses issued decreased from 2005-07 to 2009-11. The Board currently regulates approximately 1,693 individuals, including permanent, temporary non-resident, and appraiser assistant license holders. The Board anticipates a continued downward trend in new applicants, new licensees, and renewals given the current economic climate. The number of complaints and investigations conducted increased from the 2007-09 and 2009-11 biennium, however the Board has been able to resolve a majority of the cases within a one-year time period as required by the Federal Appraisal Subcommittee recommended guidelines. 2009-2011 Budget to Actual The Board’s 2009-11 actual revenue was $1,091,262, a 10% decrease from budgeted revenue reflected in the decrease in applications, new licenses issued, and renewals. The Board’s 2009-11 actual expenditures were $1,316,825, which is 10% less than budget. Due to the economic downturn’s effects on revenue, the Board undertook strict cost controls, reducing travel and delayed development of a new license database. The Board also experienced savings in Attorney General fees and professional investigator services as there were a lower number of compliance cases or other issues requiring those services. 2011-2013 Budget The 2011-13 Board adopted budget of $1,725,041 represents a 17.7% increase from the 2009-11 Board adopted budget which reflects the addition of the Appraisal Management Company (AMC) program. The Board anticipates the AMC program to be able to be self-funded and estimates $467,244 in program expenses. The Board’s budgeted fee revenue is 12% lower than 2009-11 due to the continued poor economy and decline of new individual license and renewals, particularly from out-of-state licensees.

APPENDIX B
B – 4
3. Oregon State Board of Examiners for Engineering & Land Surveying
2007-09 Budget
2007-09
Actual
2009-11 Budget
2009-11
Actual
2011-13 Budget
Total Funds $2,060,432 $2,087,546 $2,577,970 $2,221,649 $2,679,586
Positions 13 13 13 13 13
FTE 12.00 12.00 12.00 12.00 12.00
Agency Overview The mission of the Board of Examiners for Engineering and Land Surveying is to protect the public through licensing and regulating the practice of engineering and land surveying in Oregon. The Board is responsible for administering examinations, issuing licenses, investigating complaints, and renewing licenses. The Board also licenses and regulates the practices of photogrammetric mapping [SB 55( 2005)], and water right examination [SB 126 (2011)]. The eleven-member board is composed of nine professionals and two public members. Revenue Sources The Board is funded by revenue generated from application and annual registration fees for individuals. Other miscellaneous sources include civil penalties, late fees, and interest income. Revenue in 2011-13 is projected to be $3,118,779 which is a 7% decrease from the 2009-11 budget and the projected ending cash balance of $2,349,303 equals approximately 21 months of operating costs. The Board intends to reduce the biennial renewal fees in 2011-13 biennium due to the high ending cash balance.
Budget Environment / Licensing and Enforcement Activities The number of registration and certification applications, exams conducted, and number of registrations and certifications issued decreased from 2007-09 to 2009-11. In total, the Board currently regulates approximately 25,000 individuals in the fields of Professional Engineer, Land Surveyor, or Photogrammetrist. The Board anticipates the number of applications, registrations, and certification by examination to continue to decline in 2011-13 due to the current economic climate. The Board has had the number of complaints received and investigations conducted increase significantly from the previous biennium. The vast majority of the investigations stem from the Board’s auditing of the continuing education requirements of registrants. This has resulted in an increase in the civil penalties issued by the Board. The Board subsequently implemented rules requiring registrants to list continuing education completed during the previous biennium at the next renewal cycle. The Board expects this action will reduce the number of investigations conducted and civil penalties issued. 2009-2011 Budget to Actual The Board’s 2009-11 actual revenue was $3,046,446, a 9% decrease from budgeted revenue, due to the decrease in applicants and licenses issued. The Board’s 2009-11 actual expenditures were $2,211,612, which is 14% less than budget. 2011-2013 Budget The 2011-13 Board adopted budget of $2,679,586 represents a 4% increase from the 2009-11 Board adopted budget. The Board is offsetting budget increases in personnel, office expenses, and lease payments with savings in professional services. 2009-2011 Budget The 2009-11 Board adopted budget of $2,577,970 represents a 25.1% increase from the 2007-09 Board adopted budget. The budget includes a $642,078 increase in personal services.
APPENDIX B
B – 5
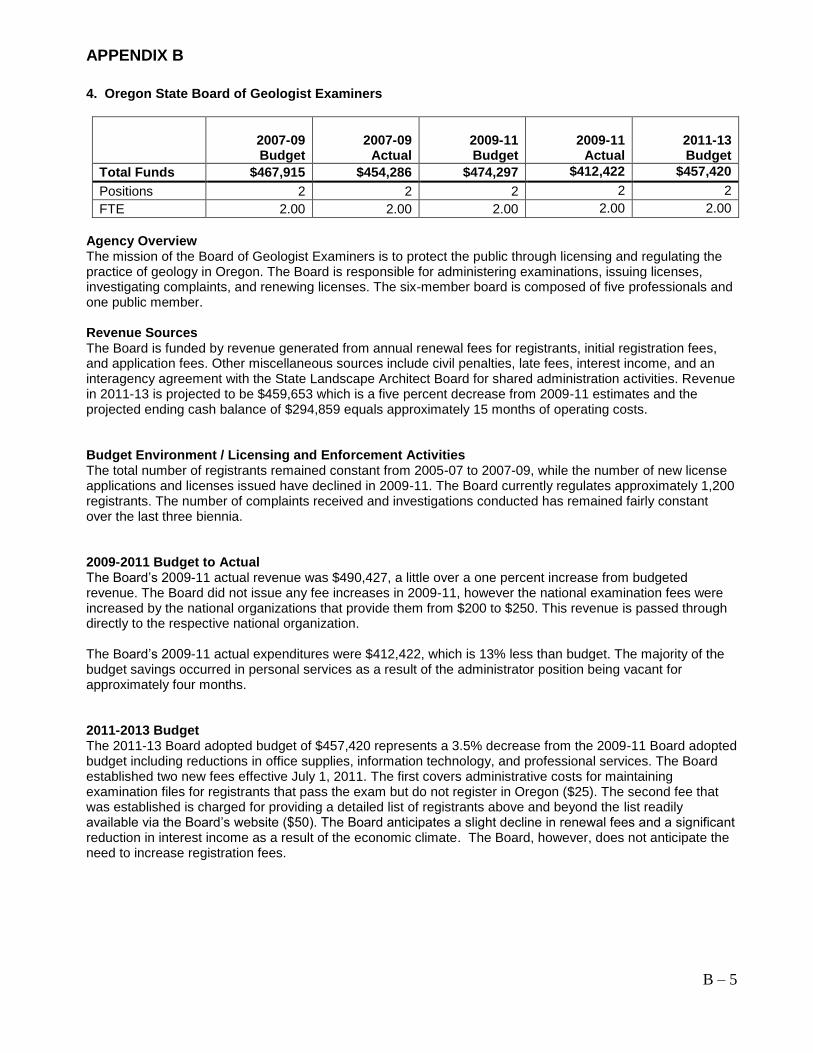
4. Oregon State Board of Geologist Examiners
2007-09 Budget
2007-09
Actual
2009-11 Budget
2009-11
Actual
2011-13 Budget
Total Funds $467,915 $454,286 $474,297 $412,422 $457,420
Positions 2 2 2 2 2
FTE 2.00 2.00 2.00 2.00 2.00
Agency Overview The mission of the Board of Geologist Examiners is to protect the public through licensing and regulating the practice of geology in Oregon. The Board is responsible for administering examinations, issuing licenses, investigating complaints, and renewing licenses. The six-member board is composed of five professionals and one public member. Revenue Sources The Board is funded by revenue generated from annual renewal fees for registrants, initial registration fees, and application fees. Other miscellaneous sources include civil penalties, late fees, interest income, and an interagency agreement with the State Landscape Architect Board for shared administration activities. Revenue in 2011-13 is projected to be $459,653 which is a five percent decrease from 2009-11 estimates and the projected ending cash balance of $294,859 equals approximately 15 months of operating costs. Budget Environment / Licensing and Enforcement Activities The total number of registrants remained constant from 2005-07 to 2007-09, while the number of new license applications and licenses issued have declined in 2009-11. The Board currently regulates approximately 1,200 registrants. The number of complaints received and investigations conducted has remained fairly constant over the last three biennia. 2009-2011 Budget to Actual The Board’s 2009-11 actual revenue was $490,427, a little over a one percent increase from budgeted revenue. The Board did not issue any fee increases in 2009-11, however the national examination fees were increased by the national organizations that provide them from $200 to $250. This revenue is passed through directly to the respective national organization. The Board’s 2009-11 actual expenditures were $412,422, which is 13% less than budget. The majority of the budget savings occurred in personal services as a result of the administrator position being vacant for approximately four months. 2011-2013 Budget The 2011-13 Board adopted budget of $457,420 represents a 3.5% decrease from the 2009-11 Board adopted budget including reductions in office supplies, information technology, and professional services. The Board established two new fees effective July 1, 2011. The first covers administrative costs for maintaining examination files for registrants that pass the exam but do not register in Oregon ($25). The second fee that was established is charged for providing a detailed list of registrants above and beyond the list readily available via the Board’s website ($50). The Board anticipates a slight decline in renewal fees and a significant reduction in interest income as a result of the economic climate. The Board, however, does not anticipate the need to increase registration fees.
APPENDIX B
B – 6
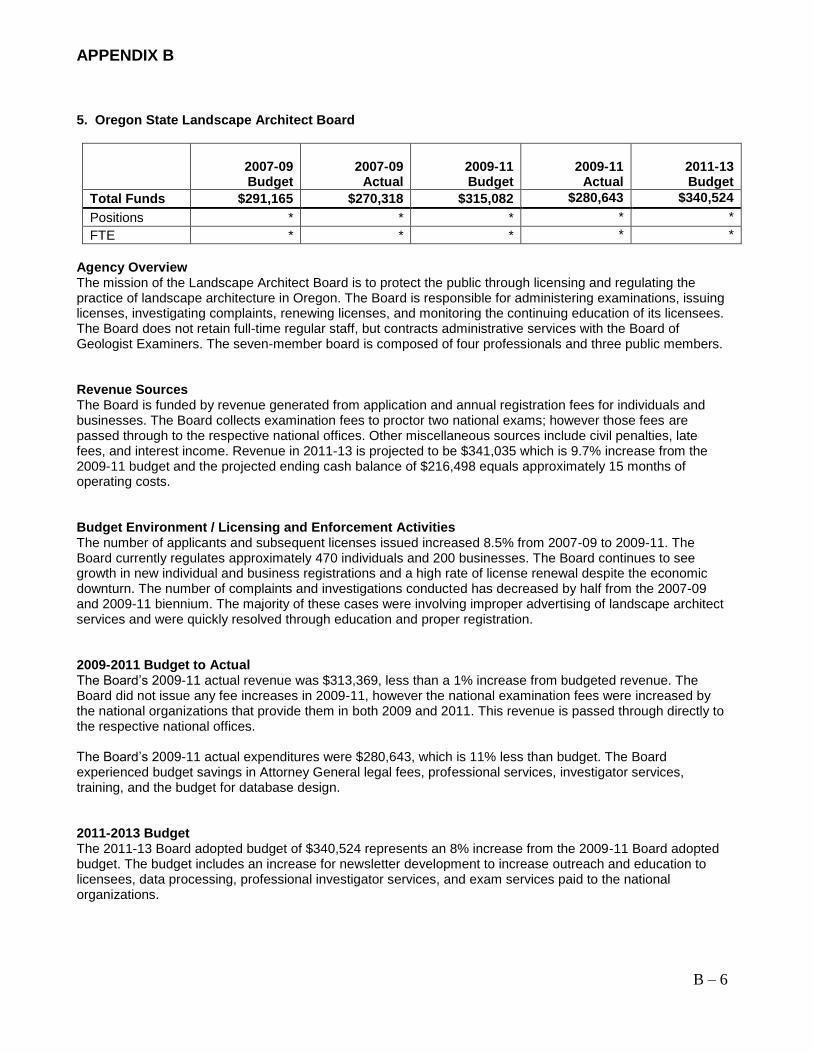
5. Oregon State Landscape Architect Board
2007-09 Budget
2007-09
Actual
2009-11 Budget
2009-11
Actual
2011-13 Budget
Total Funds $291,165 $270,318 $315,082 $280,643 $340,524
Positions * * * * *
FTE * * * * *
Agency Overview The mission of the Landscape Architect Board is to protect the public through licensing and regulating the practice of landscape architecture in Oregon. The Board is responsible for administering examinations, issuing licenses, investigating complaints, renewing licenses, and monitoring the continuing education of its licensees. The Board does not retain full-time regular staff, but contracts administrative services with the Board of Geologist Examiners. The seven-member board is composed of four professionals and three public members. Revenue Sources The Board is funded by revenue generated from application and annual registration fees for individuals and businesses. The Board collects examination fees to proctor two national exams; however those fees are passed through to the respective national offices. Other miscellaneous sources include civil penalties, late fees, and interest income. Revenue in 2011-13 is projected to be $341,035 which is 9.7% increase from the 2009-11 budget and the projected ending cash balance of $216,498 equals approximately 15 months of operating costs. Budget Environment / Licensing and Enforcement Activities The number of applicants and subsequent licenses issued increased 8.5% from 2007-09 to 2009-11. The Board currently regulates approximately 470 individuals and 200 businesses. The Board continues to see growth in new individual and business registrations and a high rate of license renewal despite the economic downturn. The number of complaints and investigations conducted has decreased by half from the 2007-09 and 2009-11 biennium. The majority of these cases were involving improper advertising of landscape architect services and were quickly resolved through education and proper registration. 2009-2011 Budget to Actual The Board’s 2009-11 actual revenue was $313,369, less than a 1% increase from budgeted revenue. The Board did not issue any fee increases in 2009-11, however the national examination fees were increased by the national organizations that provide them in both 2009 and 2011. This revenue is passed through directly to the respective national offices. The Board’s 2009-11 actual expenditures were $280,643, which is 11% less than budget. The Board experienced budget savings in Attorney General legal fees, professional services, investigator services, training, and the budget for database design. 2011-2013 Budget The 2011-13 Board adopted budget of $340,524 represents an 8% increase from the 2009-11 Board adopted budget. The budget includes an increase for newsletter development to increase outreach and education to licensees, data processing, professional investigator services, and exam services paid to the national organizations.
APPENDIX B
B – 7
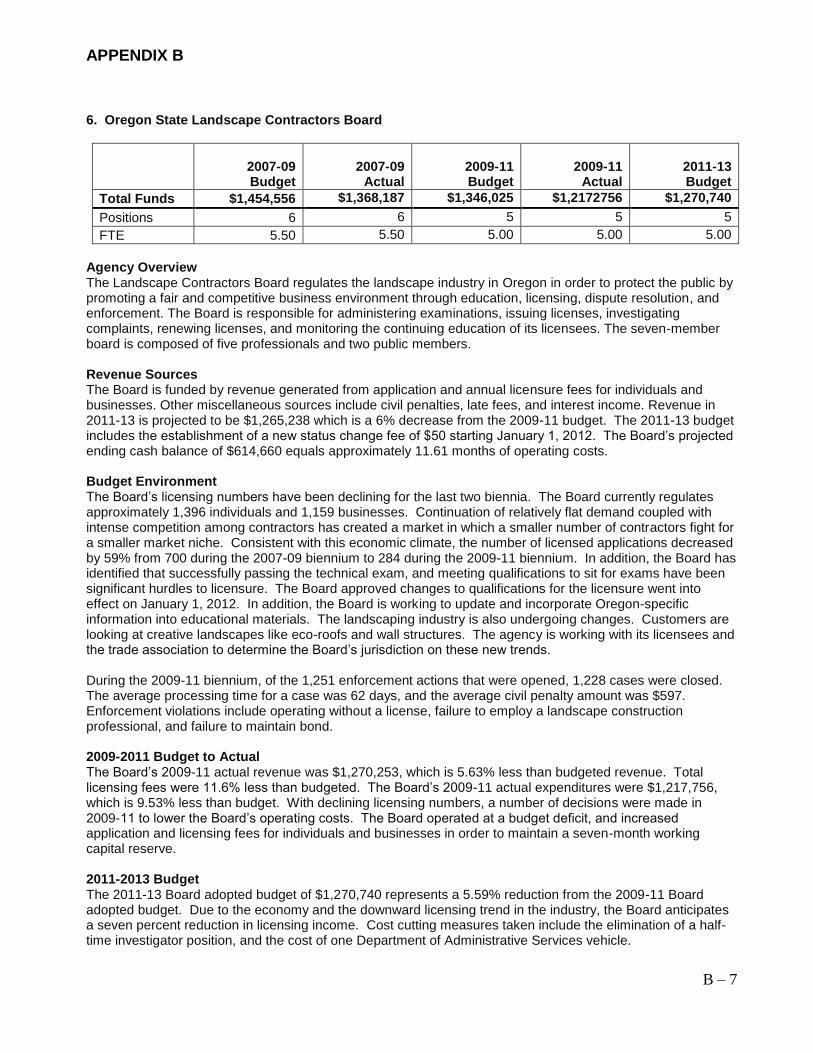
6. Oregon State Landscape Contractors Board
2007-09 Budget
2007-09
Actual
2009-11 Budget
2009-11
Actual
2011-13 Budget
Total Funds $1,454,556 $1,368,187 $1,346,025 $1,2172756 $1,270,740
Positions 6 6 5 5 5
FTE 5.50 5.50 5.00 5.00 5.00
Agency Overview The Landscape Contractors Board regulates the landscape industry in Oregon in order to protect the public by promoting a fair and competitive business environment through education, licensing, dispute resolution, and enforcement. The Board is responsible for administering examinations, issuing licenses, investigating complaints, renewing licenses, and monitoring the continuing education of its licensees. The seven-member board is composed of five professionals and two public members. Revenue Sources The Board is funded by revenue generated from application and annual licensure fees for individuals and businesses. Other miscellaneous sources include civil penalties, late fees, and interest income. Revenue in 2011-13 is projected to be $1,265,238 which is a 6% decrease from the 2009-11 budget. The 2011-13 budget includes the establishment of a new status change fee of $50 starting January 1, 2012. The Board’s projected ending cash balance of $614,660 equals approximately 11.61 months of operating costs. Budget Environment The Board’s licensing numbers have been declining for the last two biennia. The Board currently regulates approximately 1,396 individuals and 1,159 businesses. Continuation of relatively flat demand coupled with intense competition among contractors has created a market in which a smaller number of contractors fight for a smaller market niche. Consistent with this economic climate, the number of licensed applications decreased by 59% from 700 during the 2007-09 biennium to 284 during the 2009-11 biennium. In addition, the Board has identified that successfully passing the technical exam, and meeting qualifications to sit for exams have been significant hurdles to licensure. The Board approved changes to qualifications for the licensure went into effect on January 1, 2012. In addition, the Board is working to update and incorporate Oregon-specific information into educational materials. The landscaping industry is also undergoing changes. Customers are looking at creative landscapes like eco-roofs and wall structures. The agency is working with its licensees and the trade association to determine the Board’s jurisdiction on these new trends. During the 2009-11 biennium, of the 1,251 enforcement actions that were opened, 1,228 cases were closed. The average processing time for a case was 62 days, and the average civil penalty amount was $597. Enforcement violations include operating without a license, failure to employ a landscape construction professional, and failure to maintain bond. 2009-2011 Budget to Actual The Board’s 2009-11 actual revenue was $1,270,253, which is 5.63% less than budgeted revenue. Total licensing fees were 11.6% less than budgeted. The Board’s 2009-11 actual expenditures were $1,217,756, which is 9.53% less than budget. With declining licensing numbers, a number of decisions were made in 2009-11 to lower the Board’s operating costs. The Board operated at a budget deficit, and increased application and licensing fees for individuals and businesses in order to maintain a seven-month working capital reserve. 2011-2013 Budget The 2011-13 Board adopted budget of $1,270,740 represents a 5.59% reduction from the 2009-11 Board adopted budget. Due to the economy and the downward licensing trend in the industry, the Board anticipates a seven percent reduction in licensing income. Cost cutting measures taken include the elimination of a half-time investigator position, and the cost of one Department of Administrative Services vehicle.
APPENDIX B
B – 8
7. Oregon Board of Massage Therapists
2007 – 2009 Budget
2007 – 09
Actual
2009 – 11
Budget
2009 – 11
Actual
2011 – 13
Budget
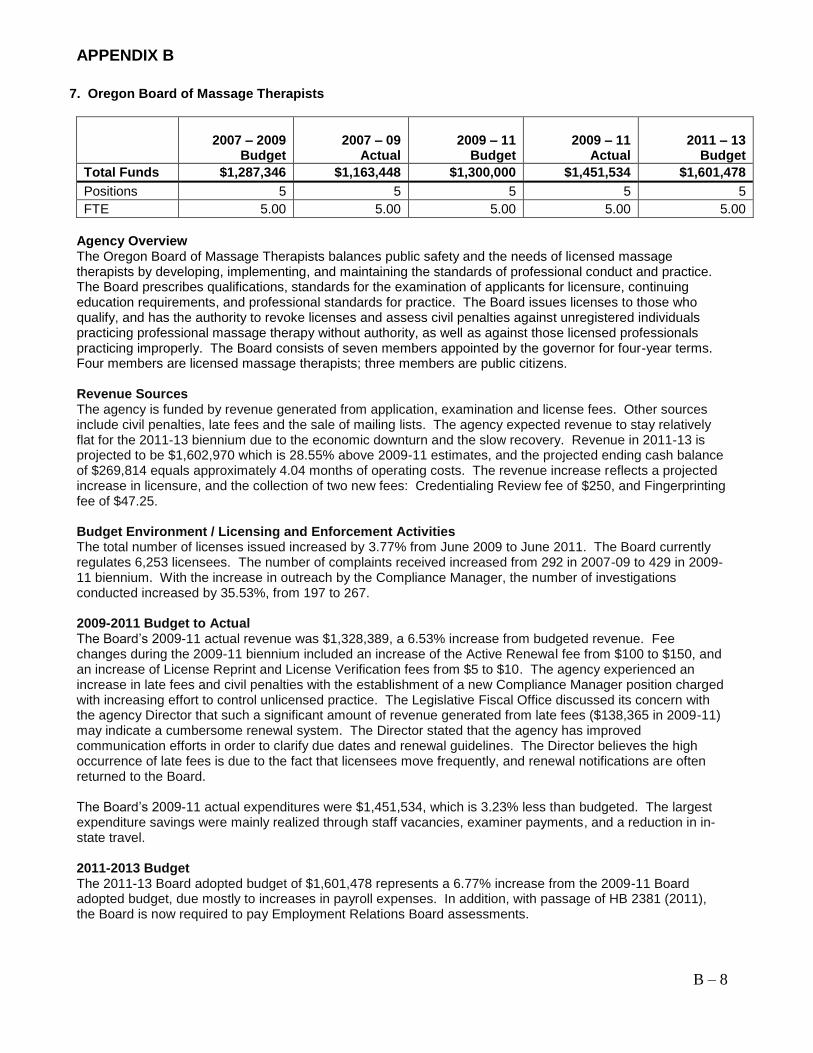
Total Funds $1,287,346 $1,163,448 $1,300,000 $1,451,534 $1,601,478
Positions 5 5 5 5 5
FTE 5.00 5.00 5.00 5.00 5.00
Agency Overview The Oregon Board of Massage Therapists balances public safety and the needs of licensed massage therapists by developing, implementing, and maintaining the standards of professional conduct and practice. The Board prescribes qualifications, standards for the examination of applicants for licensure, continuing education requirements, and professional standards for practice. The Board issues licenses to those who qualify, and has the authority to revoke licenses and assess civil penalties against unregistered individuals practicing professional massage therapy without authority, as well as against those licensed professionals practicing improperly. The Board consists of seven members appointed by the governor for four-year terms. Four members are licensed massage therapists; three members are public citizens. Revenue Sources The agency is funded by revenue generated from application, examination and license fees. Other sources include civil penalties, late fees and the sale of mailing lists. The agency expected revenue to stay relatively flat for the 2011-13 biennium due to the economic downturn and the slow recovery. Revenue in 2011-13 is projected to be $1,602,970 which is 28.55% above 2009-11 estimates, and the projected ending cash balance of $269,814 equals approximately 4.04 months of operating costs. The revenue increase reflects a projected increase in licensure, and the collection of two new fees: Credentialing Review fee of $250, and Fingerprinting fee of $47.25. Budget Environment / Licensing and Enforcement Activities The total number of licenses issued increased by 3.77% from June 2009 to June 2011. The Board currently regulates 6,253 licensees. The number of complaints received increased from 292 in 2007-09 to 429 in 2009-11 biennium. With the increase in outreach by the Compliance Manager, the number of investigations conducted increased by 35.53%, from 197 to 267. 2009-2011 Budget to Actual The Board’s 2009-11 actual revenue was $1,328,389, a 6.53% increase from budgeted revenue. Fee changes during the 2009-11 biennium included an increase of the Active Renewal fee from $100 to $150, and an increase of License Reprint and License Verification fees from $5 to $10. The agency experienced an increase in late fees and civil penalties with the establishment of a new Compliance Manager position charged with increasing effort to control unlicensed practice. The Legislative Fiscal Office discussed its concern with the agency Director that such a significant amount of revenue generated from late fees ($138,365 in 2009-11) may indicate a cumbersome renewal system. The Director stated that the agency has improved communication efforts in order to clarify due dates and renewal guidelines. The Director believes the high occurrence of late fees is due to the fact that licensees move frequently, and renewal notifications are often returned to the Board. The Board’s 2009-11 actual expenditures were $1,451,534, which is 3.23% less than budgeted. The largest expenditure savings were mainly realized through staff vacancies, examiner payments, and a reduction in in-state travel. 2011-2013 Budget The 2011-13 Board adopted budget of $1,601,478 represents a 6.77% increase from the 2009-11 Board adopted budget, due mostly to increases in payroll expenses. In addition, with passage of HB 2381 (2011), the Board is now required to pay Employment Relations Board assessments.

APPENDIX B
B – 9
8. Oregon Board of Optometry
2007 – 2009 Budget
2007 – 09
Actual
2009 – 11
Budget
2009 – 11
Actual
2011 – 13
Budget
Total Funds $617,904 $610,781 $648,125 $591,272 $658,809
Positions 3 3 3 3 3
FTE 2.20 2.20 2.20 2.20 2.20
Agency Overview The Oregon Board of Optometry is responsible for the licensure of doctors of optometry (who are also known as optometric physicians and optometrists), and the enforcement of statutes and administrative rules governing the practice of optometry in Oregon. The Board prescribes qualifications for the practice of optometry, standards for the examination of applicants for licensure and certification, and continuing education requirements. The Board has the authority to issue licenses to those who qualify, and to revoke licenses and assess civil penalties against unlicensed individuals practicing optometry without authority, as well as those licensed professionals practicing improperly. The Board consists of five members appointed by the governor for three-year terms. Four members are licensed doctors of optometry, and the fifth member is a public citizen representing health consumers. Revenue Sources The Board is funded by revenue generated from application, examination, and license fees. Other sources include civil penalties, late fees and interest income. Revenue in 2011-13 is projected to be $658,809 which is 1.65% above 2011-13 estimates, and the projected ending cash balance of $271,255 equals approximately 9.88 months of operating costs. The Board reduced two penalty fees for 2011-13: (1) the sliding scale for the active license late fee was reduced to a flat fee of $50; and (2) the late fee for inactive license renewal was reduced to a flat fee of $15. Budget Environment / Licensing and Enforcement Activities The total number of licensees decreased by about 8.5% from June 2009 to June 2011, with 95 new license applications. As of June 30, 2011, the Board regulates approximately 1,235 licensees (747 holding active, and 488 holding inactive license status). The number of licensees practicing optometry in the state has remained fairly consistent. However, the number of inactive licensees continues to decline. The main reason for this downward trend is due to the fact that optometry boards in all 50 states now use all or most parts of the standardized tests of the National Board of Examiners in Optometry (NBEO). This standardized test greatly facilitates the mobility of optometric physicians, eliminating the need to maintain licenses in more than one state. The number of complaints received and investigations conducted remained fairly constant from the 2007-09 and 2009-11 biennia. 2009-2011 Budget to Actual The Board’s 2009-11 actual revenue was $647,112 which is only nominally less than budgeted revenue of $648,125. The Board’s 2009-11 actual expenditures were $591,272, which is 8.77% less than budgeted. 2011-2013 Budget The 2011-13 Board adopted budget of $658,809 represents a 1.65% increase from the 2009-11 Board adopted budget. The 2011-13 adopted budget also reflects new revenues and expenses of $29,165 projected to be collected for the Prescription Drug Monitoring Program, a pass-through to the Oregon Health Authority. Each licensee is required to pay $25 each year at license renewal.

APPENDIX B
B – 10
9. Physical Therapist Licensing Board
2007 – 2009 Budget
2007 – 09
Actual
2009 – 11
Budget
2009 – 11
Actual
2011 – 13
Budget
Total Funds $859,000 $894,125 $938,000 $850,768 $988,900
Positions 3 3 3 3 3
FTE 2.8 2.8 2.8 2.8 2.8
Agency Overview The Physical Therapist Licensing Board regulates the practice of physical therapy in Oregon. The Board protects the public by establishing professional standards of practice which assure that physical therapists and physical therapist assistants are properly educated, hold valid/current licenses, practice within their scope of practice, and continue to receive ongoing training throughout their careers. Physical therapy practice is governed by state statutes and rules. The Board issues licenses, promulgates rules, monitors continuing education, investigates complaints, issues civil penalties for violations, and may revoke, suspend, or impose probation on a licensee or limit practice. The Board is comprised of eight volunteer members: five physical therapists, one physical therapist assistant, and two public members. Each member is appointed by the Governor, confirmed by the Senate, and may serve a four-year term, with a maximum of two terms. Revenue Sources The Board is funded by revenue generated from application, examination and license fees. Other sources include civil penalties and interest income. Revenue in 2011-13 is projected to be $947,500 which is 5.28% higher than 2009-11 estimates, and the projected ending cash balance of $654,740 equals approximately 15.89 months of operating costs. Budget Environment / Licensing and Enforcement Activities The total number of licensees increased from 4,100 in 2009 to just over 4,300 in 2011. The number of physical therapists in the state has increased by about 5% while the number of physical therapist assistants declined by approximately 2%. The main reason for this downward trend is due to the fact that Washington state now requires licensure for physical therapist assistants. The number of complaints received and investigations conducted decreased between the 2007-09 and 2009-11biennia. 2009-2011 Budget to Actual The Board’s 2009-11 actual revenue was $974,889, a 8.32% increase from budgeted revenue, resulting from an increase of physical therapist applications and renewals, due to an increase in the number of therapists re-entering the workforce through the reinstatement of lapsed licenses, and an increase in the number of therapists who have moved or relocated outside the state, but continue to hold a current license. The Board’s 2009-11 actual expenditures were $850,768, which is 9.30% less than budget. Due to a budget freeze on salaries and unpaid furlough days, payroll costs were $45,702 less than budgeted. Attorney General fees were lower than budgeted as the Board relied more on staff resources to draft Board action documents, and less contested case hearings occurred. 2011-2013 Budget The 2011-13 Board adopted budget of $988,900 represents a 5.28% increase from the 2009-11 Board adopted budget reflecting the rising cost of personnel, the implementation of a new database system, and the decision to absorb two contract services:
1. The merchant account fee triggered by the implementation of online renewals. In 2010, this merchant account fee of 2% was passed onto the licensee. In 2011, in order to encourage more extensive use of the online renewal system, the Board decided to absorb this merchant account fee.
2. To address Oregon’s healthcare workforce shortage and increase the number of providers who practice in the state, HB 2009 (2009) requires the collection of quantitative data on supply, demand, distribution, education and effective incentives for attracting qualified individuals to healthcare education. The bill allowed healthcare workforce regulatory boards to establish fees to reimburse the cost of obtaining and reporting this information. The Board decided to absorb the $2.50 per renewed licensee cost of this initiative.

APPENDIX B
B – 11
10. Oregon Patient Safety Commission
2007 – 2009 Budget
2007 – 09
Actual
2009 – 11
Budget
2009 – 11
Actual
2011 – 13
Budget
Total Funds $997,933 $821,569 $993,281 $1,230,352 $1,933,351
Positions 4 4 4 7 10
FTE 3.75 3.75 3.75 6.75 9.50
Agency Overview The mission of the Oregon Patient Safety Commission is to improve patient safety by reducing the risk of serious adverse events occurring in Oregon’s healthcare system and by encouraging a culture of patient safety in Oregon. The Commission is charged with (1) establishing a confidential, voluntary serious adverse event reporting system in Oregon; (2) promoting quality improvement techniques to reduce system errors; and (3) sharing evidence-based prevention practices to improve patient outcomes. The Commission is not a regulatory body and has no authority to review licenses, permits, certifications, or registrations. The Commission’s Board of Directors is comprised of 17 members appointed by the Governor for four-year terms. The Board represents a cross-section of diverse health care interests in the state. Revenue Sources The Commission is funded primarily by revenue generated from fees paid by the organizations that are eligible to participate in Oregon’s Patient Safety Reporting Program: hospitals, nursing homes, ambulatory surgical centers, pharmacies, and renal dialysis facilities. The Commission is actively working to increase participation in the reporting program. Currently, 100% of hospitals, 75% of ambulatory surgery centers, and 75% of nursing homes participate in this program. Other sources of income include federal grants, state contracts, and interest income. With increased participation and an aggressive grant strategy, revenue in 2011-13 is projected to be $2,426,545 which is an 194.84% increase from 2009-11 estimates, and the projected ending cash balance of $592,392 equals approximately 6.33 months of operating costs. Budget Environment The Legislature authorized the assessment of fees on health organizations eligible to participate in the reporting program. The Legislature also capped the fees the Commission may collect from organizations at $1,500,000 per year. Since inception of the program in 2006, the Commission has never proposed a rate increase for the program. Total annual fees to the Commission vary depending upon the volume of eligible licensed healthcare facilities. 2009-2011 Budget to Actual The Commission’s 2009-11 actual revenue of $1,347,795 was 63.76% higher than budgeted revenue of $823,010. The Commission’s 2009-11 actual expenditures were $1,239,827, which is 24.82% more than budgeted expenditures of $993,281. Not included in the 2009-11 adopted budget were two grants totaling $379,943 in one-time federal funds: (1) the Healthcare Associated Infection grant from the Center for Disease Control to build and sustain programs which prevent healthcare acquired infections; and (2) the Model Infection Prevention Education Program grant. Also not included in the 2009-11 adopted budget was related fee revenue for outpatient renal dialysis facilities. At the time of budget development, it was uncertain whether this sector would participate in the Patient Safety Reporting Program. 2011-2013 Budget The 2011-13 Commission adopted budget of $2,245,271 represents a 126.05% increase from the 2009-11 adopted budget. The large variance between biennia is due to grant funding fluctuations. The budget includes funding to contract for expertise and support necessary to manage adverse event reporting, website development, and an extensive marketing and communication plan. In addition, the two federal grants mentioned above have been extended (in the amount of $816,461 and 3.25 limited duration FTE) through July 2013.

APPENDIX B
B – 12
11. Oregon Wine Board
2007 – 2009 Budget
2007 – 09
Actual
2009 – 11
Budget
2009 – 11
Actual
2011 – 13
Budget
Total Funds $3,459,544 $3,378,254 $4,017,346 $3,103,726 $3,932,700
Positions 7 7 7 7 7
FTE 6.50 6.50 6.50 6.50 6.50
Agency Overview According to the Oregon Wine Board, the Oregon wine grape and wine industry contributes over $1.4 billion of economic activity to the state economy each year, including over 8,500 wine-related jobs and $200 million in wages. The Oregon Wine Board was established to support and advance enological, viticultural, and economic research to develop sustainable business practices for wine grape growing and wine making in Oregon. The Board supports marketing, research, education, and advocacy initiatives on behalf of all Oregon wineries and independent growers throughout the state’s diverse winegrowing regions. The Board is comprised of nine members appointed by the Governor with staggered three-year terms for each member. Among other qualifications, Board members must be actively engaged in wine grape growing or wine making and have a demonstrated interest in the positive development of the Oregon wine industry. Revenue Sources The agency is funded primarily by revenue generated from two assessment fees: (1) an assessment of $25 per ton imposed on grapes crushed; and (2) an assessment of $0.021 per gallon imposed on wine made from other agricultural products. In addition, a privilege tax of $0.67 per gallon ($0.77 per gallon for wines containing more than 14% alcohol by volume) is imposed on manufacturers and distributors of wines. Of this tax, $0.02 per gallon is paid into the account established by the Oregon Wine Board. All assessment fees are collected by the Oregon Liquor Control Commission on behalf of the Oregon Wine Board. Other revenue sources include program fees and grants, including the United States Department of Agriculture's (USDA) Market Access Program (MAP) export grants, Value-Added Producer Grants (VAPG) and Rural Development Rural Business Enterprise Grants (RBEG). In 2008, the Board began charging a fee for use of the Oregon Certified Sustainable Wine® (OCSW) certification mark. The 2011-13 budgeted revenue of $3,839,166 is a 2.17% decrease from the 2009-11 budgeted revenue, and the projected ending cash balance of $151,649 represents less than the average monthly expenditures of $163,863. Budget Environment The Board is required to adopt budgets on an annual basis. The Board may adopt or modify a budget only after holding a public hearing and must give notice of budget hearings to all constituents. In addition, the Board circulates a draft budget and strategic plan to the industry to obtain public comment. The Board is required to submit annual plans and budget to the Director of the Oregon Business Development Department for review. In reviewing the annual plans and budget, the Director may consult with and receive coordinated support from the Oregon State Department of Agriculture, the Oregon Tourism Commission, the Department of Higher Education, the Department of Community Colleges and Workforce Development, and the Oregon Liquor Control Commission. 2009 – 2011 Budget to Actual The 2009-11 actual revenue of $3,088,156 was 21.21% lower than budgeted revenues. The 2009-11 actual expenditures of $3,103,726 was 22.74% lower than budgeted expenditures. The Board’s budget was adjusted during the biennium because grant revenues (USDA Value-Added Producer Grant) and related expenses did not materialize. The largest expenditure variance was due to staff vacancies during the biennium, including periods when the Executive Director position was vacant. 2011 – 2013 Budget The 2011-13 Board adopted budget of $3,932,700 represents a 2.11% decrease from the 2009-11 Board adopted budget.
C – 1
APPENDIX C – Sample of Licensing and Enforcement Activity Spreadsheet
Section 5 June 2005 June 2007 % Change June 2009 % Change
Actively licensed landscape construction professional individuals 1462 1590 9% 1630 3%
Actively licensed landscape businesses 1174 1227 5% 1240 1%
(a) The number of license applications; 382 557 46% 700 26%
Individual licenses 203 281 38% 415 48%
Business licenses 179 276 54% 285 3%
(b) The number of licenses issued; (total) 292 505 73% 399 -21%
Individual licenses 108 206 91% 122 -41%
Business licenses 184 299 63% 277 -7%
(c) The number of examinations conducted; 2145 4754 122% 4087 -14%
Laws and rules 382 751 97% 674 -10%
General A exam 373 906 143% 711 -22%
General B exam 318 691 117% 518 -25%
General C exam 211 464 120% 415 -11%
General D exam 309 743 140% 588 -21%
Backflow 253 572 126% 570 0%
Irrigation 299 627 110% 611 -3%
(d) The average time between application for and issuance of
licenses (months);
Landscape Construction Professional (individual) 3.7 8.6 57% 5.6 -54%
Landscape Contracting Business 0.3 0.3 0% 0.4 25%
(e) The number and types of complaints received about persons
holding licenses; (total)=> CLAIMS (complaints from consumers):
Dispute Resolution 123 182 32% 219 17%
Employee 0 2 100% 3 33%
Material Supplier 30 39 23% 88 56%
Owner (Breach of Contract/Negligent work) 88 132 33% 121 -9%
Lien (new ability to accept 2007) 1 100%
Subcontractor 5 9 44% 6 -50%
(f) The number and types of "CLAIM" investigations conducted; 123 182 32% 219 17%
Onsite Investigation Owner Claims) 59 97 37
Administrative (Office process investigaton-includes mediation) 64 85 182
(g) The number and types of resolutions of complaints (Claims); 126 160 27% 198 24%
Onsite Mediation Resolution 36 63 75% 36 -43%
Dismissed/Untimely filed/Claimant failed to respond 23 24 4% 36 50%
Referred to OAH 4 1 -75% 3 200%
P.O. issued; paid by Bond 16 8 -50% 18 125%
P.O. issued; paid by Landscape Contracting Business 3 25 733% 38 52%
P.O. issued; Bond Exhausted 9 4 -56% 23 475%
Claimant Withdrew 21 1 -95% 5 400%
Parties resolved independently 14 34 143% 39 15%
(g-2) The number of days between beginning a CLAIM
investigation and reaching a resolution (in days) 90.05 150.6 67% 133.98 -11%
(h-1) The number and type of COMPLIANCE sanctions imposed
against Licensed; (total) 132 420 218% 614 46%
Civil penalty 9 37 311% 154 316%
Settlement agreement 34 68 100% 90 32%
Suspended license(business or individual) 25 183 632% 263 44%
Withdrew 52 71 37% 22 -69%
Closed; No violation 3 15 400% 64 327%
Closed; Informational letter issued 6 37 517% 1 -97%
Refuse to renew 3 9 200% 19 111%
Refuse to issue 0 0 1 100%
(h-2) The number and type of COMPLIANCE sanctions imposed
against Un-Licensed (total) 157 455 190% 451 -1%
Civil penalty 42 93 121% 165 77%
Settlement agreement 57 227 298% 208 -8%
Withdrew 9 44 389% 17 -61%
Closed; No violation 24 52 117% 34 -35%
Closed; Informational letter issued 24 32 33% 24 -25%
Refuse to issue 2 7 250% 3 -57%
(i-1) The number of days between beginning a Compliance
investigation and reaching a resolution: Licensed (in days) 40.63 35 -14% 31.5 -10%
(i-2) The number of days between beginning a Compliance
investigation and reaching a resolution: Un-Licensed (in days) 59.23 73 23% 59.5 -18%
Every claim has an investigation adminstratively.Additional on site
investigations are conducted on homeowner claims if required.
More businesses allowed claim to go to bond for payment which
ends up with a Landscaping debt owed=>busiiness license suspended.
Used to issue warnings=> no statutory authority, now just
information letter if no substantial proof of violation, otherwise close w/ no violation.
moved testing to PSI => fewer exams taken, fewer individuals
passing exam=> fewer individuals licensed=> fewer businesses licensed.
More businesses producing evidence of actual compliance
after notice of violation is sent.
Trend-Quicker resolution


D – 1
APPENDIX D – Updated Reporting Guidelines
Semi-Independent Agency Reporting Guidelines - 2014
ORS 182.472 requires that eleven semi-independent agencies provide reports every even
numbered year to the Governor, Senate President, House Speaker, and Legislative Fiscal Office
(LFO). The following guidelines were developed by LFO to facilitate its report review and
completion of the biennial summary report of findings prepared for the Legislature. Questions
about these guidelines can be directed to Kim To at [email protected] or John Terpening at
Reporting Time Period
The report should include actual data for the prior biennium and approved/forecasted budget and
fee change information for the biennium in which the report is completed. The report that is due
on April 1, 2014 should include actual data for the 2011-13 biennium, and projected revenue,
adopted budget, and proposed fee change information for the 2013-15 biennium.
What to Report
The statute specifies what information agencies are required to include; however, there is a wide
range of information submitted to meet the requirement. What follows are more specific
reporting guidelines intended to promote consistency in the type and level of detail of
information provided:
Sample Table of Contents
SECTION I: COPY OF AUDIT OR FINANCIAL REVIEW
SECTION II: BUDGET COMPARISON
SECTION III: RULE MAKING ACTIVITIES
SECTION IV: CONSUMER PROTECTION
SECTION V: LICENSING ACTIVITIES AND DISCIPLINARY ACTIONS
SECTION VI: OTHER BOARD ACTIVITIES
SECTION I: COPY OF AUDIT OR FINANCIAL REVIEW
ORS 182.472 (1) A copy of the most recent audit or financial review of the board.
The statute directs agencies to submit their most recent audits or financial review. Having a
copy of the audit that covers the timeframe of the report is a critical tool for LFO to reference
when reviewing information provided by agencies. For the 2014 reporting period, LFO requests
that agencies provide a copy of the audit or review for the biennium ended June 30, 2013, along
with copies of management letters referenced in the audit or review.
If agencies choose to use financial reviews, in addition to the guidelines for financial reviews
recommended by the Secretary of State, LFO recommends that agencies also include a risk
assessment, and an agreed upon procedures for an appraisal of internal controls. The financial
review should include, but not be limited to, the following:
a compilation of reviewed financial statements
D – 2
review and risk assessment of:
board member recruitment, appointment, training and duties;
information technology systems security;*
licensing processes;
rulemaking process;
requests for proposals;
procurement contracts; and
vendor relationships.
*Agencies may choose to work with the Department of Administrative Services’ Enterprise Risk
Management Office for a review and risk assessment of the agency’s information technology
system, instead of including it in the financial review contract.
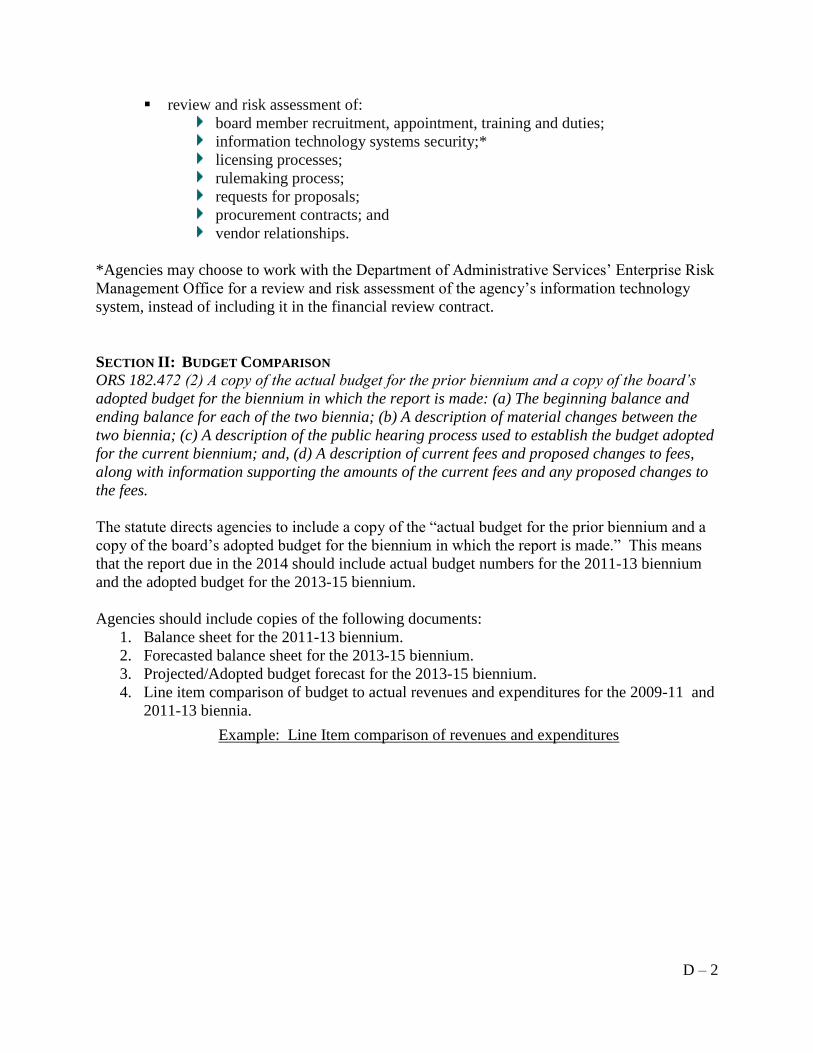
SECTION II: BUDGET COMPARISON
ORS 182.472 (2) A copy of the actual budget for the prior biennium and a copy of the board’s
adopted budget for the biennium in which the report is made: (a) The beginning balance and
ending balance for each of the two biennia; (b) A description of material changes between the
two biennia; (c) A description of the public hearing process used to establish the budget adopted
for the current biennium; and, (d) A description of current fees and proposed changes to fees,
along with information supporting the amounts of the current fees and any proposed changes to
the fees.
The statute directs agencies to include a copy of the “actual budget for the prior biennium and a
copy of the board’s adopted budget for the biennium in which the report is made.” This means
that the report due in the 2014 should include actual budget numbers for the 2011-13 biennium
and the adopted budget for the 2013-15 biennium.
Agencies should include copies of the following documents:
1. Balance sheet for the 2011-13 biennium.
2. Forecasted balance sheet for the 2013-15 biennium.
3. Projected/Adopted budget forecast for the 2013-15 biennium.
4. Line item comparison of budget to actual revenues and expenditures for the 2009-11 and
2011-13 biennia.
Example: Line Item comparison of revenues and expenditures

D – 3
2011-13
Adopted
Budget
2011-13
Adjusted
(Approved)
Budget
2011-13
Actual
% Change
Budget to
Actual
2013-15
Adopted Budget
% Change
2011-13 Adopted to
2013-15 Adopted
Revenue
Licensing Fees
Other Fees
Total Revenue
Expenses
Payroll
Services and Supplies
Travel
Telecommunications
Professional Development
Attorney General Fee
Audit Charges
Facilities Rent
Total Expenses
Postions
FTEs
In addition, agencies should include the following material:
a) Beginning and ending balances for the two biennia
Beginning and ending balances represent the amount of monies that are carried over from one
biennium to the next. LFO recognizes that the accounting software that most agencies use does
not easily identify this information, so LFO requests that agencies prepare a simple table to
communicate this information.
Example: Table of Beginning and Ending Balances
Beginning and Ending Balances
2011-13
Actual/Reported
2013-15
Projected/Adopted
Beginning Balance (2009-11 carry-over) $200,000 $220,000
Net Income/Loss 20,000 15,000
Ending Balance $220,000 $235,000
LFO will confirm that audited values for the past biennium and actual numbers reported by the
agency are the same. Variances occur for a number of legitimate reasons, many of which are
related to accounting timing. LFO will ask the agency to clarify any variance, so agencies may
want to include this information when they submit the audit for the timeframe covered by the
report.
b) A description of material changes between the two biennia
A material change is any change above an inflationary increase to a budget from one biennium to
another. Agencies need to provide:
A discussion of material changes between budget and actual beginning balance, revenues,
expenditures, and ending balance for the 2011-13 biennium (including any budget
adjustments);
A discussion of material changes between 2011-2013 Approved Budget and 2013-15
Adopted Budget.
In providing this information, it may also be appropriate to discuss unanticipated expenditures
that emerged during the 2013-15 biennium that are not reflected as material changes in the 2011-

D – 4
13 biennium.
c) A description of the public hearing process used to establish the adopted budget
When describing the public hearing process for approval of the budget, please include the dates
and a description of actions taken. Actions covered should include:
Information regarding who received notices about budget hearings and why (with dates)
Information regarding budget hearings, public comments, and board actions (with dates)
Information regarding the date the budget was filed with the Secretary of State and when a
copy was submitted to Legislative Counsel
d) A description of current fees and proposed changes, and information supporting the changes
Agencies should include a list of all current fees, any fee changes made in the previous
biennium, and anticipated changes for the upcoming biennium. One suggested presentation
format for this information is to use a table such as the following:
Example: Table of Fees and Changes over Time
Fee Type
Fee as of
6/30/09
Fee as of
6/30/11
Fee as of
6/30/13
Anticipated
Fee on 6/30/15
List of all fee types.
In addition to including a list of fees, the agency should supply an explanation of changes and a
justification for fee increases. Typically, the justification is a “budget shortfall.” In this case,
LFO will want to confirm that the agency has appropriately forecasted anticipated revenues and
expenditures and that all other avenues of potential funding were considered (such as agency
efficiency improvements or use of agency reserves) prior to approval of a fee increase. Some
questions agencies might consider when preparing their justification for a fee increase are:
What is changing in the operating environment that is negatively impacting future revenues
and expenditures?
What actions has the agency already taken to mitigate the impacts of the factors that are
negatively influencing future revenues and expenditures?
What assumptions are used when forecasting a budget shortfall?
What options besides a fee increase were considered as a strategy for funding the budget
shortfall?
The Oregon Patient Safety Commission and the Oregon Wine Board have different revenue
structures than licensing boards, so LFO requests that these agencies provide information on
changes in revenue sources which may include fees, contributions, tax revenues, grants, or other
sources.
SECTION III: RULE MAKING ACTIVITIES
ORS 182.472 (3) A description of all temporary and permanent rules adopted by the board
during the prior biennium.
The statute requests that agencies report rules adopted by the board during the prior biennium.
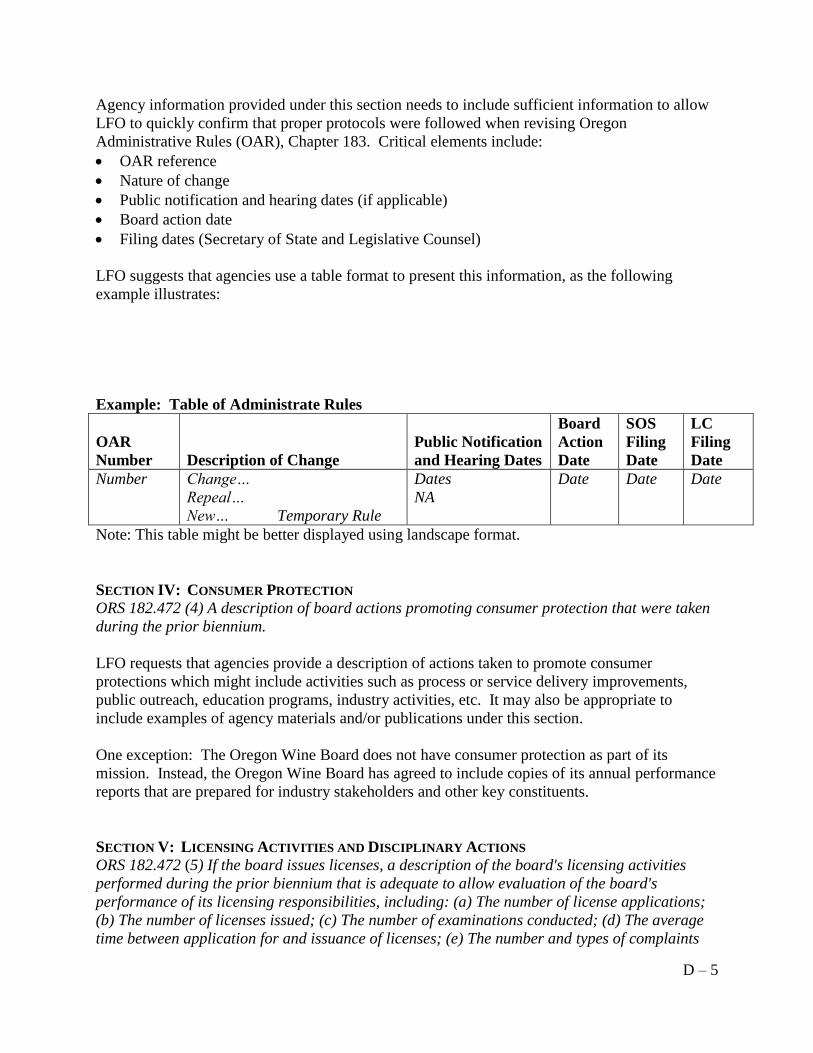
D – 5
Agency information provided under this section needs to include sufficient information to allow
LFO to quickly confirm that proper protocols were followed when revising Oregon
Administrative Rules (OAR), Chapter 183. Critical elements include:
OAR reference
Nature of change
Public notification and hearing dates (if applicable)
Board action date
Filing dates (Secretary of State and Legislative Counsel)
LFO suggests that agencies use a table format to present this information, as the following
example illustrates:
Example: Table of Administrate Rules
OAR
Number
Description of Change
Public Notification
and Hearing Dates
Board
Action
Date
SOS
Filing
Date
LC
Filing
Date
Number
Change…
Repeal…
New… Temporary Rule
Dates
NA
Date Date Date
Note: This table might be better displayed using landscape format.
SECTION IV: CONSUMER PROTECTION
ORS 182.472 (4) A description of board actions promoting consumer protection that were taken
during the prior biennium.
LFO requests that agencies provide a description of actions taken to promote consumer
protections which might include activities such as process or service delivery improvements,
public outreach, education programs, industry activities, etc. It may also be appropriate to
include examples of agency materials and/or publications under this section.
One exception: The Oregon Wine Board does not have consumer protection as part of its
mission. Instead, the Oregon Wine Board has agreed to include copies of its annual performance
reports that are prepared for industry stakeholders and other key constituents.
SECTION V: LICENSING ACTIVITIES AND DISCIPLINARY ACTIONS
ORS 182.472 (5) If the board issues licenses, a description of the board's licensing activities
performed during the prior biennium that is adequate to allow evaluation of the board's
performance of its licensing responsibilities, including: (a) The number of license applications;
(b) The number of licenses issued; (c) The number of examinations conducted; (d) The average
time between application for and issuance of licenses; (e) The number and types of complaints
D – 6
received about persons holding licenses; (f) The number and types of investigations conducted;
(g) The number and types of resolutions of complaints; (h) The number and type of sanctions
imposed; and (i) The number of days between beginning an investigation and reaching a
resolution.
The intent of collecting and reporting the data required by ORS 182.472 (5) is to provide reliable
and accurate indicators of workforce (licensees) and performance (exams proctored, processing
time, complaints received, investigations conducted, backlog risk, sanctions imposed), in order to
ensure each agency’s responsiveness to its constituents and market forces. While the statute
does not specifically require that agencies include multiple years of data, LFO’s previous reports
recommended that agencies include multiple years of data (10 years or 5 biennia) so trending
would be possible. To help ensure that multiple years of data are provided, LFO worked with
each agency to establish a standardized template for reporting data under this section. In future
reports, agencies will retain historical data when reporting for up to a period of 10 years (5
biennia). The inclusion of historical data enables the agency to discuss performance trends
and/or potential issues such as case backlogs in their narrative, which facilitates LFO’s efforts to
evaluate the board’s performance of licensing and enforcement responsibilities. The January
2014 report should include actual licensing data for the 2003-05, 2005-07, 2007-09, 2009-11,
2011-13 biennia.
Understandably, data collection and processing methods often change over time. Various
activity status codes are added or removed by semi-independent agencies, and at times, a
determination may be made to begin to count licensees with a particular license or status code
which may not have been counted in previous years. Conversely, at times a determination is
made to cease to include licensees with a particular license or status code. Although these types
of changes may make sound business sense and result in more accurate data at that specific time,
they also skew the trend lines when doing an analysis of trends over a period of time when
different collection methods were used. To prevent faulty analysis resulting from these types of
changes, LFO recommends the inclusion of a detailed description of your agency’s data
collection process. Critical elements include:
1. Document procedures used to ensure that data are accurate and internally consistent.
2. Be clear about the date or time period of collected data.
3. Provide a glossary of terms. For example, define each type and status of
licensing/certification, exams conducted, complaints, investigations, sanctions.
4. Ensure that definitions of data elements are consistent from biennia to biennia. Any
deviations in data collection process or definition of terms should be explained.
5. Document the reasons for significant changes in data from one year to the next.
The Oregon Patient Safety Commission and the Oregon Wine Board are not licensing entities.
In lieu of licensing and enforcement data, LFO recommends that the Oregon Patient Safety
Commission submit a copy of the latest Public Health Officer Certification Report, and the
Oregon Wine Board submit a copy of its latest Annual Report along with other information that
that illustrate performance results achieved during the reporting period.
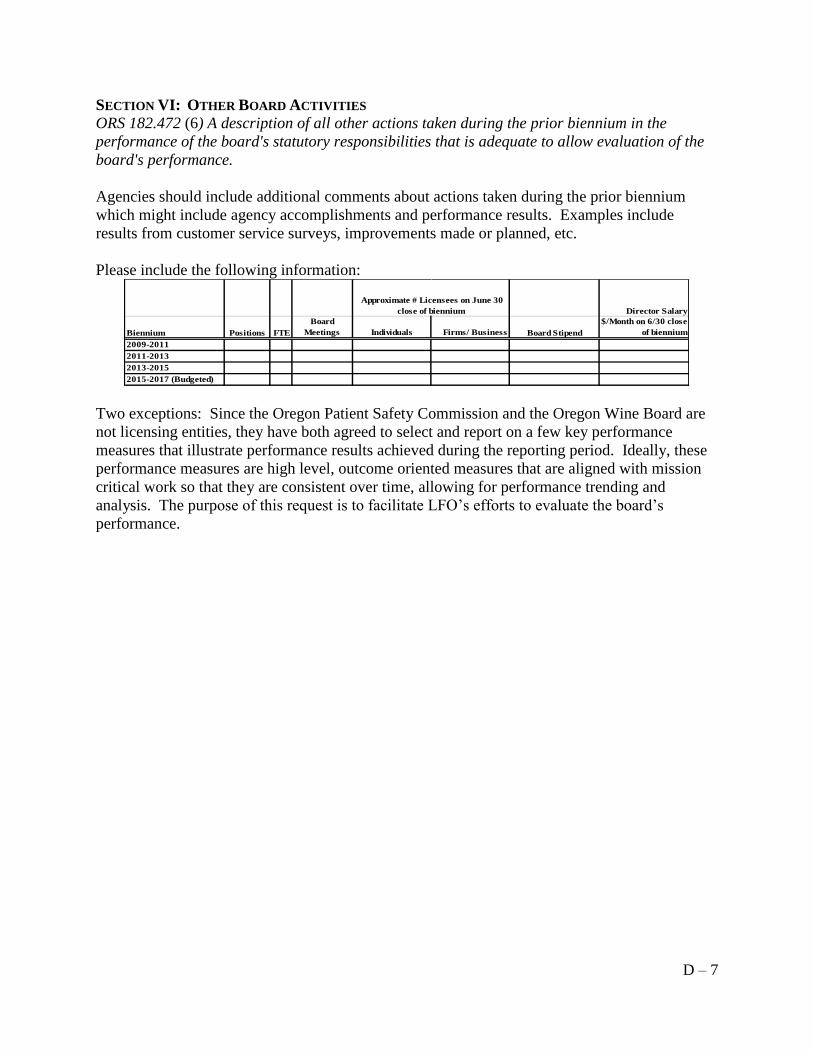
D – 7
SECTION VI: OTHER BOARD ACTIVITIES
ORS 182.472 (6) A description of all other actions taken during the prior biennium in the
performance of the board's statutory responsibilities that is adequate to allow evaluation of the
board's performance.
Agencies should include additional comments about actions taken during the prior biennium
which might include agency accomplishments and performance results. Examples include
results from customer service surveys, improvements made or planned, etc.
Please include the following information:
Director Salary
Biennium Positions FTE
Board
Meetings Individuals Firms/ Business Board Stipend
$/Month on 6/30 close
of biennium
2009-2011
2011-2013
2013-2015
2015-2017 (Budgeted)
Approximate # Licensees on June 30
close of biennium
Two exceptions: Since the Oregon Patient Safety Commission and the Oregon Wine Board are
not licensing entities, they have both agreed to select and report on a few key performance
measures that illustrate performance results achieved during the reporting period. Ideally, these
performance measures are high level, outcome oriented measures that are aligned with mission
critical work so that they are consistent over time, allowing for performance trending and
analysis. The purpose of this request is to facilitate LFO’s efforts to evaluate the board’s
performance.


