73
Review of Special Education in the Commonwealth of Massachusetts Thomas Hehir and Associates Thomas Hehir, Todd Grindal and Hadas Eidelman Boston, Massachusetts
| Date post: | 27-Sep-2018 |
| Category: |
Documents |
| Upload: | phungthien |
| View: | 213 times |
| Download: | 0 times |
Review of Special Education in theCommonwealth of Massachusetts
Thomas Hehir and Associates
Thomas Hehir, Todd Grindal and Hadas EidelmanBoston, Massachusetts
April 2012
Report commissioned by the Massachusetts Department of Elementary and Secondary Education
Mitchell D. Chester, Ed.D., Commissioner
Review of Special Education in the Commonwealth of Massachusetts
Table of Contents Executive Summary Page 1
Introduction Page 3
Methods Page 4
Summary of Key Findings Page 5
Findings Page 5
Part 1: Detailed findings comparing the identification, Page 6 placement and performance of Massachusetts students with disabilities with students in the rest of the country
Part 2: Detailed findings regarding rates of special education Page 10identification in the commonwealth of Massachusetts
Part 3: Detailed findings describing the relationship between Page 13district rates of identification and proficiency on the Massachusetts Comprehensive Assessment System (MCAS)
Part 4: Detailed findings regarding the relationship between Page 17student characteristics and likelihood of being identified as eligible for special education services
Part 5: Detailed findings describing the relationship between Page 23characteristics of students with ‘High Incidence’ disabilities and the proportion of the school day spent in classrooms with their typically developing peers
Part 6: Detailed findings describing the relationship between Page 27the proportion of the school day a student spent in classrooms with their typically developing peers and scores on the MCAS for students with ‘High Incidence’ disabilities
Recommendations Page 30
References Page 34
Appendix A: Additional Methodological Information Page 36
Appendix B: Selected Regression Models Page 39

1
Executive Summary
We conducted this study at the behest of Massachusetts Commissioner of Elementary and Secondary Education, Dr. Mitchell D. Chester. The commissioner was concerned about the relatively high numbers of students with disabilities identified in the commonwealth and the degree to which those identification rates were beneficial to students given the high costs associated with special education. For the purposes of this study we primarily examined those disability categories whose determination – whether a child is identified as having a disability or not – might involve a greater degree of subjectivity and therefore represent likely sources of high rates of special education identification.
We performed extensive statistical analyses using the state student databases examining many student and district-level characteristics. We looked at demographic information concerning the populations receiving special education services, the performance of these students on the Massachusetts Comprehensive Assessment System (MCAS) and the National Assessment of Educational Progress (NAEP), the level of integration these students experienced in school (the extent to which they were included in classrooms with their typically developing peers), the variability among districts in serving these students and factors that were associated with identification rates and student performance.
Several powerful trends emerged from our analyses:
-Massachusetts general education students and students with disabilities score near or at the top of the National Assessment of Educational Progress (NAEP) distribution compared to students in other states.
-Massachusetts has the second highest rate of special education identification in the United States.
-The percentage of students identified as eligible for special education does not appear to have a consistently positive or negative impact on average district performance on the MCAS.
- However, the degree to which students with disabilities are included in classrooms with their non-disabled peers is substantially related to MCAS performance, controlling for a host of relevant variables such as income, race and English language proficiency.
- Low-income students are considerably more likely than their counterparts to be deemed eligible for special education services.
2
- Low-income students with disabilities and Latino and African American students with disabilities are considerably less likely to be included in general education classes when compared to their White and Asian special education counterparts.
- We find evidence that among special education students, lack of integration may be a contributing factor for lower performance on the MCAS.
These data paint an uneven picture of special education policy and practice in the commonwealth. On the one hand, many students with disabilities are doing comparatively well in Massachusetts and are experiencing high levels of integration and success. However, there appear to be some disturbing trends among low-income students and students of color. Low-income students are far more likely to be eligible for special education services than other students and once they receive services, are more apt to be educated in separate settings. This is particularly alarming given evidence that separation from the mainstream is associated with poorer standardized test performance for students with disabilities.
Though we believe that the findings of this report call for state action, we do not recommend major state policy changes in special education. This report should not be interpreted as a call to dramatically reduce the number of Massachusetts student served through special education across the board. Special education helps to ensure that students with disabilities receive supports and services critical to their academic and life-long success. Large numbers of students with disabilities the commonwealth are doing well, compared to students with disabilities across the country. However, the substantial variation in district practices and student performance from one school district to another as it relates to low-income students, calls for state action. The Department of Elementary and Secondary Education should be more actively intervening in districts whose identification rates and use of substantially separate educational settings for low-income students – and students with disabilities as a whole – are substantially higher than average. Further, we believe that the commonwealth should be examining its current efforts under Title 1 of the Elementary and Secondary Education Act and should promote more powerful practices in general education to assure that low-income students receive the support they may need in order to be successful in school. Detailed recommendations are included at the end of this report.
3
Introduction
This report presents findings from our comprehensive review of the identification1, placement2 and performance3 of students with disabilities in the Commonwealth of Massachusetts.
In the spring of 2011, Thomas Hehir and Associates was retained by the Massachusetts Department of Elementary and Secondary Education to conduct a comprehensive review of special education in the Commonwealth of Massachusetts. Our review focused on the following questions:
Question 1: How do the identification, placement and performance of students with disabilities in Massachusetts compare to students with disabilities across the United States?
Question 2: What are the characteristics of school districts in Massachusetts that identify a relatively high percentage of students as eligible for special education and how do these characteristics compare to Massachusetts school districts that identify a moderate or relatively low percentage of students as eligible for special education?
Question 3: What district-level characteristics or practices are associated with higher district wide performance of students with disabilities on the Massachusetts Comprehensive Assessment System (MCAS)?
Question 4: Are some Massachusetts students more likely than other students to be identified as eligible for special education?
Question 5: Among students with disabilities, are some students more likely than other students to be educated in classrooms with their typically developing peers?
Question 6: What student and district-level characteristics are related to the performance of students with disabilities on the MCAS?
1 Here ‘identification’ refers to the identification of students as eligible for special education services.2 Here ‘placement’ refers to the proportion of the school day that students eligible for special education services spend with their typically developing peers.3 For this analysis, we will use Massachusetts Comprehensive Assessment System (MCAS) scores as a measure of student academic performance.
4
Methods
This report is based on quantitative – i.e., statistical – analyses of district, school and student data and qualitative – i.e., interview and focus group – data collected through meetings with district and state administrators as well as special educators and advocates. Quantitative data on Massachusetts’s students included information on student performance on the Massachusetts Comprehensive Assessment System (MCAS) and student background information from the Student Information Management System (SIMS). Where possible, we added additional school district information to the SIMS and MCAS data by using publicly available data sets, such as the 2000 Census and the National Center for Education Statistics (NCES) Common Core of Data (CCD). We also examined publicly available datasets and reports from the Data Accountability Center (www.ideadata.org) to provide comparison information on students with disabilities across the country.
Although the combination of these data sources provided us with an unprecedented level of information regarding a large number of students with disabilities, it is important to note that they do not permit us to account for district-level factors such as the quality of classroom teaching or child-level factors such as the experience of trauma or housing instability that can be associated with performance on the MCAS. Further, we do not have information on indicators of students’ social emotional development which we believe to be a critical component of student’s lifelong success
In this report, the term “District” refers to traditional, multi-grade, academically-focused school districts only (n=298). We chose to exclude charter schools, vocational districts and separate special education public and private schools from our analysis for the following reasons. First, vocational schools and separate special education public and private schools enroll substantially higher than average percentages of students with disabilities and thus behave quite differently from traditional school districts, which are the intended focus of this analysis. Secondly, since charter schools are each their own district, including them in our analysis would confound schools with districts. Third, since charter schools enroll a substantially lower than average percentage of students with disabilities, they also behave quite differently than traditional school districts and therefore represent a separate substantive area for analysis. Lastly, we are not able to incorporate geographic census data (such as median family income) for these types of non-standard districts, so the models we fit that included such variables would by default exclude such non-traditional districts from the analysis.
Additional details describing the specific methods used to determine each of our findings are presented in Appendix A.
5
Summary of Key Findings
Some of the key findings we discuss in this report, tied to their respective research questions, include:
Summary of Findings for Question 1: Overall, Massachusetts’s schools identify a higher percentage of students as having a disability than do schools across the country. Massachusetts’s students with disabilities compare favorably to students across the country in terms of their academic achievement and the degree to which they are included with their typically developing peers.
Summary of Findings for Question 2: Though some wealthy districts have high rates of special education identification, overall high-income districts are not primarily responsible for the commonwealth’s relatively high identification rates statewide. Rather, districts with higher percentages of low-income students, on average, identify a higher percentage of their students as disabled than do districts with low percentages of low-income students.
Summary of Findings for Question 3: At the district level, the performance of students with disabilities – while consistently lower on average – typically parallels the performance of general education students; such that in districts where general education students have higher MCAS scores, students with disabilities also, on average, earn higher scores on the MCAS.
Summary of Findings for Question 4: Low-income students in Massachusetts are more likely to be identified as eligible for special education services than are students who are not low-income. This is particularly true for low-income students who attend school in high-income districts. Meanwhile, among students with limited English proficiency, there are dramatic differences in the rates of disability identification between students whose home language is Spanish and students whose home language is not Spanish.
Summary of Findings for Question 5: Among students with disabilities, low-income students, African American students and Latino students are consistently more likely to be educated in classrooms away from their typically developing peers than are middle- or high-income students or students who are not African American or Latino.
Summary of Findings for Question 6: Holding constant other student and district-level characteristics associated with MCAS performance, students with disabilities who spend more time being educated with their typically developing peers, on average, earn higher scores on the MCAS than students who spend much of their time in substantially-separate, non-mainstream classes.
6
Part 1: Detailed findings comparing the identification, placement and performance of Massachusetts students with disabilities with students in the rest of the country
Question 1: How do the identification, placement and performance of students with disabilities in Massachusetts compare to students with disabilities across the United States.?
Finding 1a – Identification: Massachusetts identifies students as eligible for special education and related services at rates substantially higher than the rest of the country.
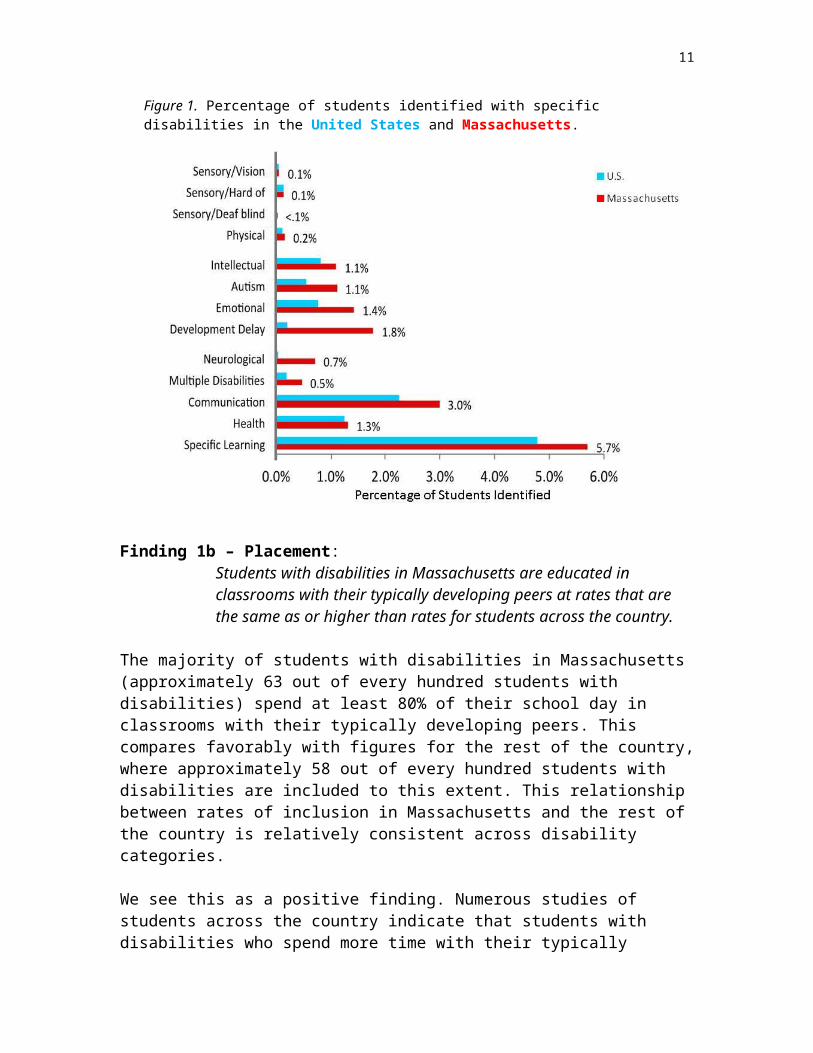
More than 17% of Kindergarten through 12th grade students in the Commonwealth of Massachusetts are eligible for special education services. This rate of identification for special education service eligibility is the second highest in the country, behind Rhode Island (~19%). In Figure1 (on the following page), we display a comparison of identification rates in Massachusetts and the rest of the United States., by disability category.
We interpret Figure 1 as indicating three general patterns. In the first pattern, which applies to categories whose designations have relatively strict and narrow definitions (Vision, Hard of Hearing/Deaf-Blind and Physical Disabilities), rates of identification in Massachusetts look very similar to national averages. In the second pattern, we find disabilities (Intellectual Disabilities, Autism, Emotional Disturbance, Multiple Disabilities and Developmental Delay) where Massachusetts rates of identification, while high relative to the national average, may be more in line with recent research findings (e.g., Bhasin,2006; Rice, 2009, Sheldrick, 2011; Pizur-Barnekow, 2010) regarding true incidence in the population of school age children.
The third pattern, which will be the focus of the majority of the analyses presented in this report, is applicable to disability categories whose definitions may be more subject to interpretation (Specific Learning Disability, Communication and Other Health Impairment).1 Nearly two out of every three Massachusetts students with a disability are identified as belonging in one of these three categories and due to the potentially subjective nature of their diagnosis, rates of identification for these categories may be more sensitive to policy decisions than rates for the more strictly defined categories. Further, we see evidence throughout the commonwealth that indicates that children with similar profiles may fall differentially into one of these three categories, depending on the designation conventions of different school districts.
1 The Neurological Impairment designation does not clearly fall into any of the three patterns we describe here. In part because of the very small proportion of Massachusetts children represented in this category and in part due to variability in the use of this designation in the state, we do not include this category in most of the analyses presented in this report.
7
For these reasons, we combine students in the Specific Learning Disability, Communication and Other Health Impairment categories for many of our analyses and we refer to this combined group as the ‘High Incidence’ disability categories. We will discuss in detail later in this report evidence of overrepresentation of the ‘High Incidence’ disability categories among Massachusetts students and because of their policy relevance, we focus the majority of analyses discussed in this report on this subset of children. Throughout this report, any reference to the ‘High Incidence’ disability categories therefore refers to the combined group of children who are identified as having a Specific Learning Disability, Communication Impairment, or Other Health Impairment.
Figure 1. Percentage of students identified with specific disabilities in the United States and Massachusetts.
Finding 1b – Placement:Students with disabilities in Massachusetts are educated in classrooms with their typically developing peers at rates that are the same as or higher than rates for students across the country.
The majority of students with disabilities in Massachusetts (approximately 63 out of every hundred students with disabilities) spend at least 80% of their school day in classrooms with their typically developing peers. This compares favorably with figures for the rest of the country, where approximately 58 out of every hundred students with disabilities are included to this extent. This relationship between

8
rates of inclusion in Massachusetts and the rest of the country is relatively consistent across disability categories.
We see this as a positive finding. Numerous studies of students across the country indicate that students with disabilities who spend more time with their typically developing peers outperform similar students who are educated in less integrated settings on measures of numerous social, academic and post-school success (Wagner et al, 2003; Hehir, 2005). Later in this report, we will discuss the relationship between inclusion with typically developing peers and academic performance for Massachusetts students with disabilities specifically.
Finding 1c – Performance:Massachusetts students with disabilities, on average, score higher than students with disabilities across the country on the National Assessment of Educational Progress (NAEP).
In 2009, students with disabilities in Massachusetts scored at or near the top of the national distribution on the NAEP English and Mathematics tests. This finding was generally consistent across grade levels.
While this is laudable, we urge the reader to interpret this finding with caution. As we will discuss below, we have reason to believe that the phenomenon of higher rates of disability identification in Massachusetts creates a pool of students with disabilities whose challenges are potentially less severe than in other states. These students therefore are more likely to perform well on average on measures of academic achievement than students with disabilities in states that identify a relatively smaller percentage of students as eligible for special education and related services.
Question 1: Summary
Massachusetts’s students are identified as eligible for special education in the categories of Vision, Hard of Hearing/Deaf-Blind and Physical Disabilities at rates similar to students across the country.
Massachusetts’s students are identified as eligible for special education in the categories of Intellectual Disabilities, Autism, Emotional Disturbance, Multiple Disabilities and Developmental Delay at rates higher than students across the country, but we believe, based on findings from other research, that these higher rates may represent a more accurate reflection of true population incidence.
Massachusetts’s students may be inappropriately overrepresented in the disability categories of Specific Learning Disability, Communication and Other Health Impairment.
9
Massachusetts’s students with disabilities are educated in classrooms with their typically developing peers at slightly higher rates compared to students with disabilities across the country.
Massachusetts’s students with disabilities, on average, outperform students with disabilities across the country on the National Assessment of Educational Progress (NAEP).
10
Part 2: Detailed findings regarding rates of special education identification in the Commonwealth of Massachusetts
Question 2: What are the characteristics of school districts in Massachusetts that identify a relatively high percentage of students as eligible for special education and how do these characteristics compare to Massachusetts school districts that identify a moderate or relatively low percentage of students as eligible for special education?
Finding 2a – Variation in Identification Rates Within and Between Districts:Rates of special education identification vary substantially within and between Massachusetts school districts.
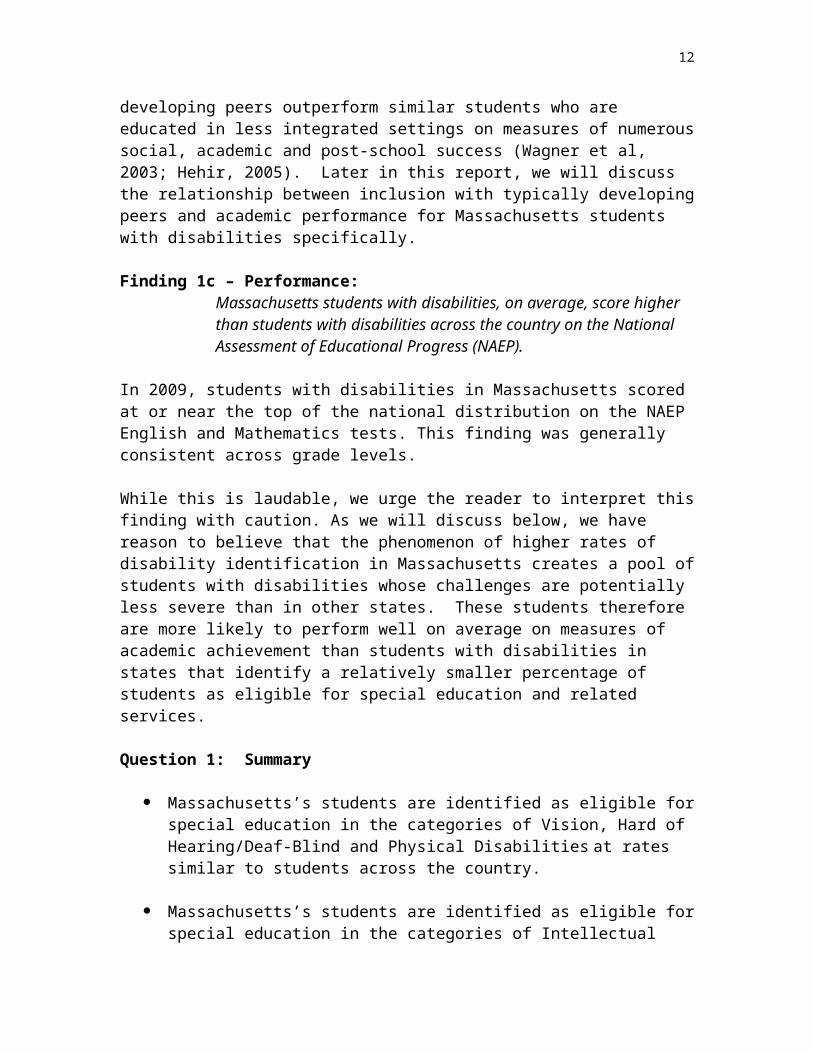
Rates of special education identification vary substantially across Massachusetts’s school districts,1 ranging from a low of approximately 9% to a high of 29% of a district’s students identified as eligible for special education and related services. While this does not change the overall finding that the state demonstrates a higher rate of students with disabilities than most of the rest of the country, it does indicate that this higher rate is not evident in all districts. The map below displays the variation in rates of identification of students with high incidence disabilities for school districts across the state.
Figure 2: Displaying variation in the percentage of students in a district identified with high incidence disabilities (Specific Learning Disability, Communication Impairment, or Other Health Impairment). n=275 school districts.2
1 See methods section (p. 6 above) for details on how we identified districts for these analyses. 2 In cases where there were overlapping geographic boundaries (e.g. an area in which several small school districts serving elementary school students occupy the same geographic space as one larger district that supports high schools students), we display the larger geographic unit.

11
The variability in identification between specific disability categories from district to district is also notable. For example, we found one district with the highest rates of identification for Specific Learning Disability in the commonwealth (17.7%) and the lowest rates of identification for the Communication category (0%). This same district, meanwhile, had an average identification rate for the Health category (<1%). In another district, we found the commonwealth’s lowest rate of identification for Specific Learning Disabilities (<1%), one of the highest rates of identification in the Communication category (7.4%) and an above average rate of identification in the Health category (1.7%). While these districts represent extreme examples, this high degree of variation in the use of these three disability categories was evident across the commonwealth.
Through focus groups with advocates and state special education officials, we learned that local school districts are given substantial flexibility in their interpretation of these specific disability categories. In some cases, this appears to result in children with the same underlying issues receiving different disability labels in different school districts. This represents a potential impediment to the effective delivery of services to children and also presents challenges for our analyses. Based on what appears to be the relative diagnostic subjectivity for certain disability categories across the Commonwealth, we combined – as described in Part 1 of this report – children in the Specific Learning Disability, Health and Communication disability categories into one ‘High Incidence’ disability category in some of the analyses reported below.
Finding 2b – Low-Income Students and Special Education:Districts that have a larger percentage of low-income students, on average, identify a larger percentage of their students in the ‘High Incidence’ disability categories.
As we discussed our work with colleagues who are familiar with special education in the commonwealth, we have repeatedly encountered a narrative that attributes the high rates of special education identification in Massachusetts to high-resource parents seeking to secure advantages (for example, untimed or otherwise accommodated standardized exams) for their children through gaining eligibility for special education. However, in our examination of district–level data, we find little evidence that this is the case. Districts with higher median family incomes do not identify a higher percentage of their students as eligible for special education and related services.
In fact, counter to the narrative that district wealth might drive high rates of special education identification; we found that districts with a larger percentage of low-income1 students, on average, identified a larger percentage of their students into
1 In this report, a student is considered low-income if he or she was eligible to receive a free or reduced priced lunch.
12
the ‘High Incidence’ special education categories.1 In this portion of our analysis, we fit a series of statistical models in which we predicted district-level percentage of students identified in the ‘High Incidence’ disability categories, controlling for the effect of other relevant district characteristics,2 and we found that every doubling of district percentage of free or reduced price lunch students (for example, from 5% to 10%, or 12% to 24%, etc.) was associated with nearly a one percentage point difference in the district percentage of students identified as having a Specific Learning Disability, Other Health Impairment, or Communication Impairment designation.
Question 2: Summary
Rates of special education identification vary substantially within and between Massachusetts’s school districts.
Though some wealthy districts have high rates of special education identification, overall high-income districts are not primarily responsible for the relatively high identification rates in the state.
Districts that have a larger percentage of low-income students, on average, identify a larger percentage of their students in the ‘High Incidence’ disability categories.
1Unless otherwise stated, throughout this report the term ‘High Incidence’ will refer to students in the Specific Learning Disabilitiy, Health, or Communication disability categories.2 In these analyses we controlled for whether the district was classified by the National Center of Education Statistics (NCES) as rural, city, suburban or town (see http://nces.ed.gov/ccd/rural_locales.asp for more information); the percentage of white students in a district; the percentage of students who demonstrated limited English proficiency in a district; the percentage of a district’s students who are in elementary school; and whether the district participated in the METCO program. We found all of these potential predictors of rates of ‘High Incidence’ identification to be trivial and non-significant.
13
Part 3: Detailed findings describing the relationship between district rates of identification and proficiency on the Massachusetts Comprehensive Assessment System (MCAS)
Question 3: What district-level characteristics or practices are associated with higher district wide performance of students with disabilities on the Massachusetts Comprehensive Assessment System (MCAS)?
In the previous section of this report, where we discussed findings related to Question 2, we discussed the fact that some school districts identify higher numbers of children as eligible for special education than other districts. In this section, we explore this further, looking not only at rates of identification but also at aggregate student performance on the MCAS. Given the crucial importance of MCAS performance on school attainment (most notably, high school graduation), the MCAS performance of students with disabilities, as well as the relationship between rates of identification and students’ MCAS scores, are indispensable to this analysis. Specifically, we examine here whether on average, district characteristics, including districts’ percentage of students identified in the ‘High Incidence’ disability category are meaningfully associated with district average performance on the MCAS.
Finding 3a – Districts with High Rates of MCAS Proficiency for General Education Students tend to also have High Rates of MCAS Proficiency for Students with Disabilities:
The performance of a school district’s general education students is, on average, the strongest district-level predictor of that district’s special education students’ performance on the MCAS.
General education students consistently outperform students with disabilities on the MCAS. For example, on average, approximately 78% of a district's general education students score proficient or higher on the English language MCAS, while only 38% of a district’s students in the ‘High Incidence’ disability category do the same. That said, the performance of a district’s general education students and students with disabilities are closely related, although average scores for students with disabilities are consistently lower. We conducted Ordinary Least Squares regression analyses and found that, controlling for relevant district-level characteristics,1 a one-percentage-point difference in the percentage of general education students scoring proficient or higher on the English language MCAS (for example, 78% vs. 79%; or 85% vs. 86%) is associated with an approximately one-percentage-point difference in the percentage of students with disabilities with a ‘High Incidence’ disability designation scoring proficient or higher on the same exam (for example, 38% vs. 39%; or 45% vs. 46%). Put another way, districts with higher-
1 In these regression models we controlled for the percentage of students in the district with a ‘High Incidence’ designation, the percentage of students in the district who were White, district enrollment and district urbanicity. Control variables that were trivial and/or non-significant were excluded from the final model (see Appendix B, Table 2 for an example).
14
than-average rates of general education students scoring proficient or higher on the MCAS are also likely to have higher-than-average rates of students with disabilities scoring proficient or higher.
Figure 3. District-level percentage of Students with Disabilities scoring Proficient or Advanced on the 8th grade MCAS math assessment predicted by district-level percentage of General Education students scoring Proficient or Advanced on the same test, controlling for districts’ percentage of students with a ‘High Incidence’ disability, percentage of White students, district enrollment and district urbanicity (n=297 traditional school districts).
Finding 3b – Rates of ‘High Incidence’ Disability Identification and MCAS Scores:Students in the ‘High Incidence’ disability categories in districts that identify a higher percentage of children as disabled do not demonstrate meaningfully higher scores on the MCAS.1
We fit a series of multilevel regression models to assess the relationship between the percentage of children in a district identified in the ‘High Incidence’ category and those students’ scores on the MCAS. The purpose of these models was to explore whether students in ‘High Incidence’ catagories in high-identifying districts scored notably lower or higher than students in ‘High Incidence’ categories in low-identifying districts, taking into account other relevant student- and district-level factors.2
1 See appendix B, tables 2 & 3, for results from sample multi-level regression analyses in support of this finding. 2We conducted these analyses separately for students in grades 4, 8 and 10. We excluded students enrolled in vocational or technical schools, charter schools or out-of-district placements. In these analyses we controlled for student race (African American, Latino, Asian, American Indian and ‘Other’ race, with White as the reference category); whether the child has a ‘High Incidence’ disability or is eligible for special education in a different disability category; the extent to which a child spent their school day in classrooms with their typically developing peers (inclusiveness); child gender;

15
Examining student-level raw scores on the MCAS, we found that consistently, although students in the ‘High Incidence’ disability categories do appear to score somewhat higher on the MCAS in high-identifying districts than in low-identifying districts, the difference in ‘High Incidence’ scores between low- and high-identifying districts was not substantial. The difference in average score between ‘High Incidence’ students in a district identifying 5% of their students as having a ‘High Incidence’ disability (placing that district’s rate of identification at the 5th percentile for the state) and ‘High Incidence’ students in a district identifying 20% of their students as having a ‘High Incidence’ disability (representing the 95th percentile for identification rates in the state) was about 1.8 raw points on the 8th grade math and English assessments.
Looking at MCAS performance categories, we also examined the combined percentages of students (special and general education) who scored Proficient or Advanced on the MCAS and once again we did not see a clear trend regarding the relationship between district rates of special education identification and overall student performance. That said, we did find some evidence in uncontrolled analyses, that students in highly inclusive districts, on average, earn higher marks than students in districts that include a relatively low percentage of students with disabilities.
We take the finding regarding test scores and rates of identification to be sensible, given the reasonable likelihood that students with ‘High Incidence’ disabilities in high identifying districts are likely to be, on average, less severely disabled than students with ‘High Incidence’ disabilities in low identifying districts. We therefore conclude that the difference in average scores is not only small but also likely driven by the ability levels of more mildly disabled students rather than by district rates of identification per se. We examine this relationship in more detail in Part 6 of this report
child eligibility for free or reduced-priced lunch; whether the child’s school district participates in the METCO program; district median family income (from 2000 census data); overall inclusiveness of the district; percentage of LEP students in the district and percentage of a district’s students who receive free or reduced-priced lunches. Models also included two-way statistical interactions between: child inclusiveness and special education category (‘High Incidence’ vs. a different disability category);and child special education category (‘High Incidence’ vs. a different disability category)and the percentage of students in the district identified as having a ‘High Incidence’ disability. We tested a number of other main effects and interactions and found them to be non-significant.

16
Question 3: Summary
The performance of a school district’s general education students is, on average, the strongest predictor of the performance of a district’s special education students.
Students in the ‘High Incidence’ disability categories in districts that identify a higher percentage of children as disabled do not demonstrate meaningfully higher scores on the MCAS.
17
Part 4: Detailed findings describing the relationship between student characteristics and likelihood of being identified as eligible for special education services
Question 4: Are some students more likely than other students to be identified as eligible for special education?
Finding 4a – Student Race and Special Education: Despite the fact that African American and Latino students are identified as eligible for special education at slightly higher rates than White students, this disparity virtually disappears when we consider other relevant district and student characteristics including socio-economic status, which appears to be the main driver of the race differential.
Approximately 22% of African American and 21% of Latino students in Massachusetts are students with disabilities. This is higher than the rates of disability identification for White students, which are approximately 17%, as well as for Asian students, which are approximately 9%. While the differential between rates for African American and Latino students and rates for White and Asian students might appear substantial at first, we see a different picture when we control for other student and district-level characteristics.
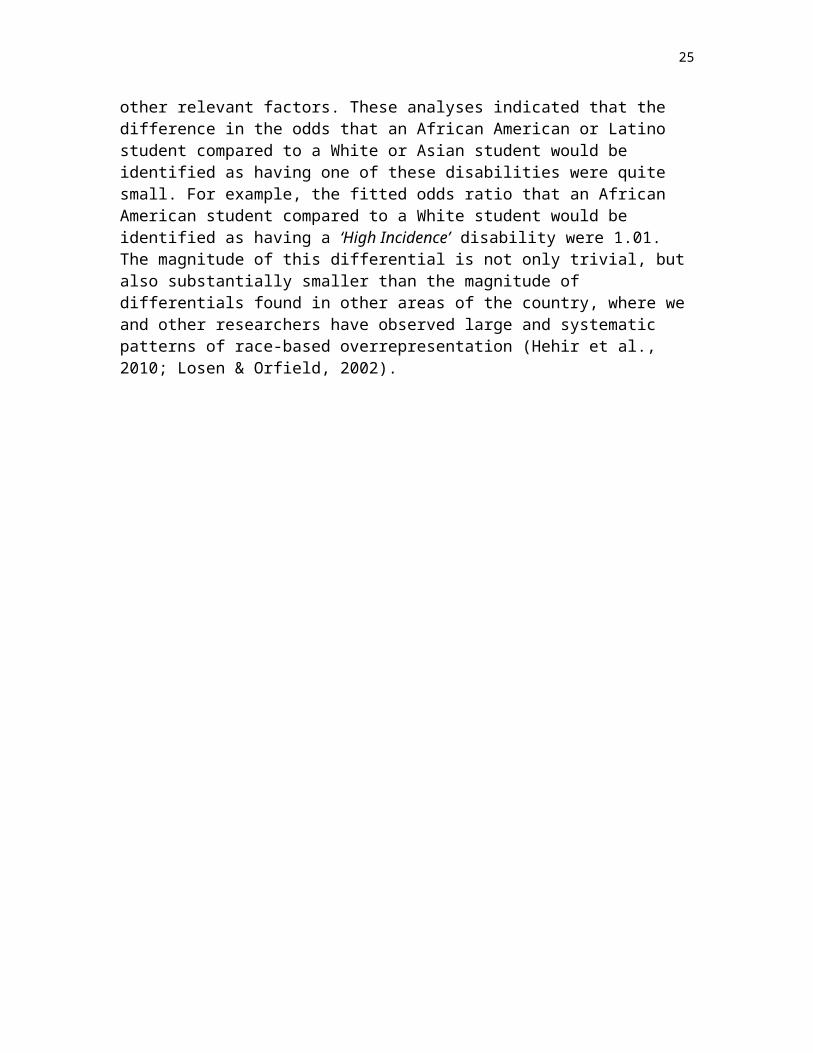
We fit a series of multilevel logistic regression models to predict the probability that a child would receive a ‘High Incidence’ designation1 while taking into account a variety of other relevant factors. These analyses indicated that the difference in the odds that an African American or Latino student compared to a White or Asian student would be identified as having one of these disabilities were quite small. For example, the fitted odds ratio that an African American student compared to a White student would be identified as having a ‘High Incidence’ disability were 1.01. The magnitude of this differential is not only trivial, but also substantially smaller than the magnitude of differentials found in other areas of the country, where we and other researchers have observed large and systematic patterns of race-based overrepresentation (Hehir et al., 2010; Losen & Orfield, 2002).
1 These models (School Districts n=299; Children n=468,158) control for student race (African American, Latino, Asian, American Indian and ‘Other’ race with White as the reference category); child gender; child eligibility for free or reduced-priced lunch; whether the child’s school district participates in the METCO program; percentage of White students in the district; and log2 of percentage of a district’s students who receive free or reduced-priced lunches. Models also included two-way statistical interactions between: student race and district percentage of white students; student race and district METCO status; and child eligibility for free or reduced-priced lunch and log2
of percentage of a district’s students who receive free or reduced-priced lunches.
18
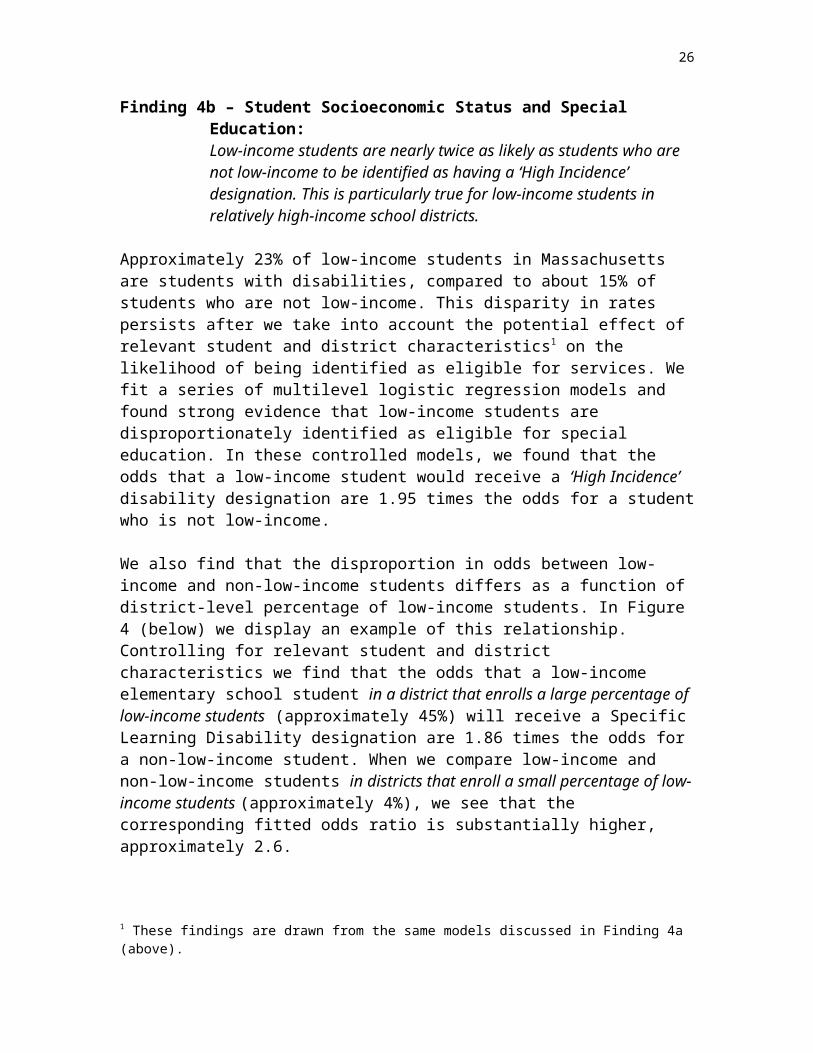
Finding 4b – Student Socioeconomic Status and Special Education: Low-income students are nearly twice as likely as students who are not low-income to be identified as having a ‘High Incidence’ designation. This is particularly true for low-income students in relatively high-income school districts.
Approximately 23% of low-income students in Massachusetts are students with disabilities, compared to about 15% of students who are not low-income. This disparity in rates persists after we take into account the potential effect of relevant student and district characteristics1 on the likelihood of being identified as eligible for services. We fit a series of multilevel logistic regression models and found strong evidence that low-income students are disproportionately identified as eligible for special education. In these controlled models, we found that the odds that a low-income student would receive a ‘High Incidence’ disability designation are 1.95 times the odds for a student who is not low-income.
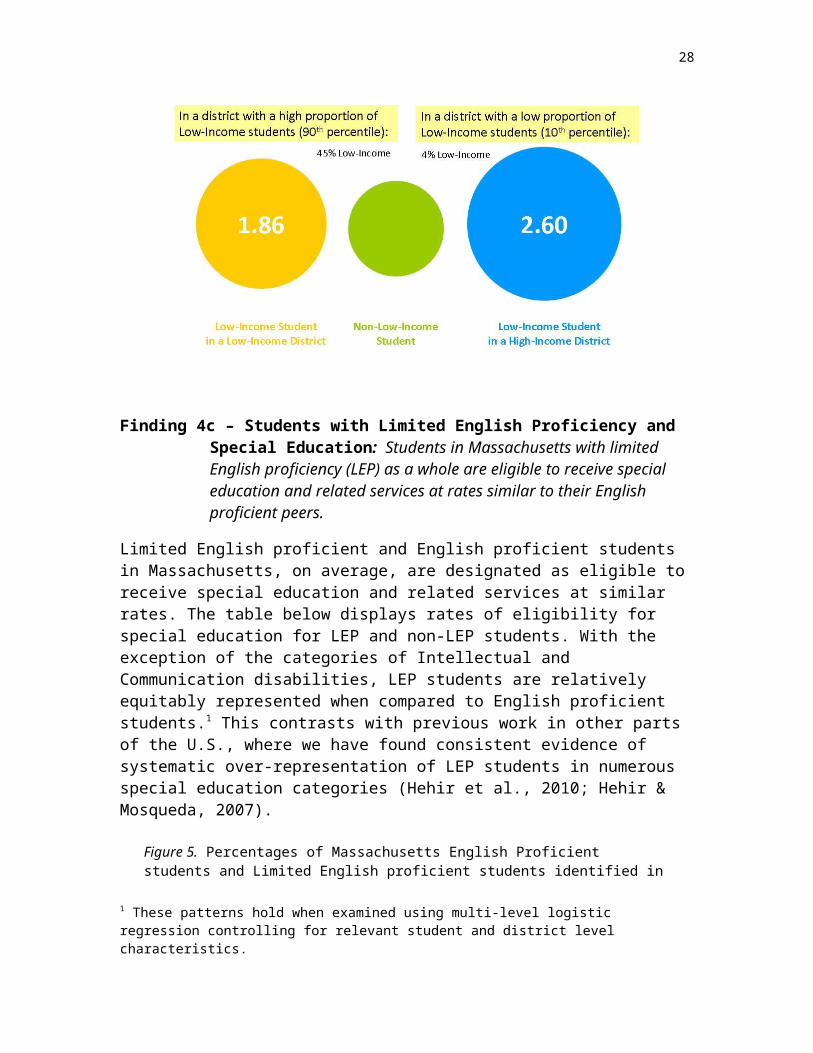
We also find that the disproportion in odds between low-income and non-low-income students differs as a function of district-level percentage of low-income students. In Figure 4 (below) we display an example of this relationship. Controlling for relevant student and district characteristics we find that the odds that a low-income elementary school student in a district that enrolls a large percentage of low-income students (approximately 45%) will receive a Specific Learning Disability designation are 1.86 times the odds for a non-low-income student. When we compare low-income and non-low-income students in districts that enroll a small percentage of low-income students (approximately 4%), we see that the corresponding fitted odds ratio is substantially higher, approximately 2.6.
1 These findings are drawn from the same models discussed in Finding 4a (above).
19
Figure 4. Representation of fitted odds ratios that a low-income student (eligible for Free/Reduced Price Lunch) will be identified as having a Specific Learning Disability compared to a student who is not low-income in districts with high (45%) and low (4%) proportions of low-income children,1 controlling for student-level factors (gender, race and LEP status) and district-level factors (percentage of White students in a district and whether the district participates in the METCO program).2,3
Finding 4c – Students with Limited English Proficiency and Special Education: Students in Massachusetts with limited English proficiency (LEP) as a whole are eligible to receive special education and related services at rates similar to their English proficient peers.
Limited English proficient and English proficient students in Massachusetts, on average, are designated as eligible to receive special education and related services at similar rates. The table below displays rates of eligibility for special education for LEP and non-LEP students. With the exception of the categories of Intellectual and Communication disabilities, LEP students are relatively equitably represented when compared to English proficient students.4 This contrasts with previous work in other parts of the U.S., where we have found consistent evidence of systematic over-representation of LEP students in numerous special education categories (Hehir et al., 2010; Hehir & Mosqueda, 2007).
1 These rates of low-income student represent the 90th and 10th percentiles in the state.2 All other student- and district-level factors in the dataset were not meaningfully related to the probability of a student’s eligibility for special education services.3 See appendix B, Table 1, for results from sample multi-level logistic regression analyses in support of this finding.4 These patterns hold when examined using multi-level logistic regression controlling for relevant student and district level characteristics.

20
Figure 5. Percentages of Massachusetts English Proficient students and Limited English proficient students identified in each disability category (does not include Deafness, Vision, or Deaf/Blind categories).
Finding 4d – Home Language of LEP Students (Spanish vs. Other Languages) and Special Education: Within the LEP student subgroup, we find dramatic differences in special education identification between LEP students whose home language is Spanish and LEP students whose home language is not Spanish.
Though rates of special education identification are similar between LEP and non-LEP students overall, there are meaningful differences in identification rates for LEP students who speak Spanish as a first language and those whose first language is not Spanish. Spanish speakers account for approximately 55% of all Massachusetts LEP students, but they represent approximately 75% of LEP students who are eligible for special education services. When we explored this issue statistically(through multi-level logistic regression analyses), we found that the fitted odds that an LEP student whose first language is Spanish will be identified as eligible for special education services are quite similar to the odds for an English proficient student. LEP students who speak a first language other than Spanish, on the other hand, exhibit odds that are nearly half those of non-LEP students in the state. As the figures below indicate, this means that while LEP students whose first language is Spanish do not demonstrate systematic over- or under-identification in special education categories, LEP students whose first language is not Spanish appear to be identified as eligible for special education services at dramatically lower rates.

21
Figure 6. Representation of fitted odds ratios that a student with Limited English Proficiency (LEP) will be identified as eligible for special education services compared to a non-LEP student for LEP students whose home language is Spanish and LEP students whose home language is not Spanish1, controlling for student-level factors (gender, race and eligibility for free/reduced price lunch) and district-level factors (percentage of students eligible for free/reduced price lunch).2
The category of intellectual disabilities represents an exception to the overall pattern of equitable- or under-representation of LEP students as eligible for special education services. Massachusetts Limited English Proficient students are identified as having an intellectual disability at more than double the rate of English proficient students. Although this differs from the overall pattern for LEP versus non-LEP students, the relationship between LEP students whose first language is Spanish versus those whose first language is not Spanish holds consistently in the intellectual disability category. Rates of eligibility for special education services related to intellectual disability vary sharply between Spanish speaking and non-Spanish speaking LEP students. While approximately 1% of English proficient students are identified as having an intellectual disability, the rate for non-Spanish speaking LEP students is 1.5% and the rate for Spanish speaking LEP students is substantially higher at nearly 6%. Controlling for relevant student and district characteristics3 we find that the odds that a Spanish speaking LEP student will receive a designation of intellectual disability are nearly double (1.87 times) the odds that an English Proficient student will receive the same designation. Non-Spanish speaking LEP students by contrast are identified at rates similar to non-LEP students.
1 These results come from a model including only elementary school students, although the pattern was consistent for students in middle and high schools as well.2 All other student- and district-level factors in the dataset were not meaningfully related to the probability of a student’s eligibility for special education services.3 In these models we control for student gender, low-income status, district percentage of low-income students, district METCO participation, the interaction between student LEP status and district percentage of low-income students and the interaction between student low-income status and district percentage of low-income students (n=307,193 children, nested in n=252 school districts).

22
Question 4: Summary
While African American and Latino students are identified as eligible for special education services at slightly higher rates than White students, this differential virtually disappears when we control for SES and other district and student characteristics.
Low-income students are nearly twice as likely as students who are not low-income to be identified as having a ‘High Incidence’ designation. This is particularly true for low-income students in relatively wealthy school districts.
Students in Massachusetts with limited English proficiency (LEP) as a group are eligible to receive special education and related services at rates similar to their English proficient peers.
Within the LEP student subgroup, we found dramatic differences in special education identification between LEP students whose first language was Spanish and LEP student whose first language was not Spanish.
23
Part 5: Detailed findings describing the relationship between characteristics of students with ‘High Incidence’ disabilities and the proportion of the school day spent in classrooms with their typically developing peers
Question 5: Among students with disabilities, are some students more likely than other students to be educated in classrooms with their typically developing peers?
Like students across the country, Massachusetts students with different disability designations are educated in classrooms with their typically developing peers at different rates. For example, students with disabilities in the ‘High Incidence’ categories are included with their typically developing peers at higher rates than students with disabilities in other special education categories. Within the ‘High Incidence’ category, students with Communication disabilities are included with their typically developing peers at a higher rate than students designated as having a Specific Learning Disability or Other Health Impairment.
Although students with disabilities in Massachusetts are, overall, educated in inclusive settings at higher rates than similar students across the United States, we found that the degree to which students with disabilities are educated in classrooms with their typically developing peers varies substantially from district to district and student to student. For example, in some districts, more than 3 out of 10 students with disabilities are in substantially separate settings (spending between 0-40% of their days with typically developing peers), while in other districts this figure is less than 1 out of 10.
There were also student-level characteristics that were associated with the extent to which students with disabilities spent their school day in classrooms with their typically developing peers. These characteristics tended to be consistent across grades and here we present as an example, the subgroup of students in the state who were in the 10th grade in 2009-2010 who were identified as eligible for special education in one of the ‘High Incidence’ catagories.
There were 7,672 10th grade students with disabilities in ‘High Incidence’ disability categories in traditional school districts across the commonwealth in the 2009-2010 school year. 677 (approximately 9%) of these 10th grade ‘High Incidence’ students spent less than 40% of their day with their typically developing peers. Of the 2,543 of these ‘High Incidence’ students who qualified for free or reduced price lunch, 409 (or 14%) were separated from the mainstream classroom to this same degree. Breaking this group down further, of the 628 10th grade ‘High Incidence’ students who were low-income and African American, 103 (or 16%) were educated in these substantially separate settings. And finally, within that group, looking only at males, more than 18% of low-income, 10th grade African American male ‘High Incidence’ students were educated in substantially separate classrooms away from their typically developing peers.
24
While we use the 10th grade sample as an example, these patterns were consistent across grade-levels, with characteristics like race and low-income status associated with substantially higher proportions of the school day spent outside of mainstream classrooms. We expand on these findings in the remainder of this section.
Finding 5a – Low-income Students with Disabilities and Educational Setting: Low-income students with disabilities are educated in substantially separate classrooms at higher rates than non-low-income students with disabilities.
Low-income students with disabilities are educated outside of the general education classroom at rates higher than children who are not low-income. Figure 7 (below) displays the percentages of low-income and non-low-income students with disabilities who are educated with typically developing peers: 80-100% of the school day (mostly included); 40-79% of the school day (somewhat included); and 0-40% of the school day (substantially separate).
Figure 7. Percentage of low-income and non-low-income students with disabilities who are educated with their typically developing peers 80-100% of the school day; 40-79% of the school day and 0-40% of the school day (n=174,730 students with disabilities).
We explored this finding further by fitting multi-level logistic regression models predicting the likelihood that a student would be in the 0-40% category. We found that controlling for student race, student gender, district median family income and the overall inclusivity of the district, the odds that a low-income student would be educated in a substantially separate setting (included less than 40% of the day) are between 1.8 and 2 times the odds for a non-low-income student. This relationship is consistent across the elementary, middle and high school years. We also conducted

25
these analyses excluding the large urban districts of Boston, Worcester and Springfield and found that, although the relationship between low-income status and the odds of being educated in a substantially separate classroom was slightly attenuated when these districts were removed, the overall pattern remained.
Finding 5b – African American and Latino Students with Disabilities and Inclusion: African American and Latino middle and high school students with disabilities in Massachusetts are included with their typically developing peers at lower rates than are White and Asian middle and high school students with disabilities.
African American and Latino students spend less time in integrated settings than White and Asian students. For example, approximately two-thirds of White students with disabilities are included with their typically developing peers for at least 80% of the day compared to only one-half of African American and Latino students with disabilities. This pattern is consistent across disability categories and the discrepancy in inclusion is most dramatic in the category of emotional disturbance. In this category, the percentage of White students who are mostly included is nearly double the corresponding percentage of African American students (about 40 out of 100 White students and 21 out of 100 African American students). The graph below displays the distribution of students with disabilities (all disability categories combined) into the three levels of inclusion: 80-100% of the school day; 40-79% of the school day; and 0-40% of the school day.1
Figure 8. Percentage of students with disabilities who are educated with their typically developing peers 80-100% of the school day; 40-79% of the school day; and 0-40% of the school day by race (n=9,996 children with disabilities).
While the previous paragraph described differences in rates of students by race in
1 Note: Students in “Other settings” are not included in this graph. The “Other settings” category includes students educated in public and private separate day schools, residential schools, public residential institutional facilities as well as hospital or homebound students.
26
mostly included settings, we also found that the difference in rates between the percentage of African-American/Latino students and White/Asian students in substantially separate settings (included less than 40%) was notable. Among all students (special and general education) approximately 5% of African American and Latino students are educated in these separate settings compared to 1.6% of all White and Asian students, more than a three-fold difference.
We examined whether the higher rates of educational separation we observed for African American and Latino students were possibly driven by the fact that these students were more likely to be low-income and/or more likely to be identified into more severe disability categories. As with many of the findings reported above, we looked within the subcategory of students with ‘High Incidence’ disabilities and examined the relationship in a controlled multilevel logistic regression framework. We found that student race remained a salient characteristic in predicting educational separation even after controlling for low-income status. For example, controlling for student low-income status, student gender, district median family income and the overall inclusivity of the district, we found that the fitted odds that an African American or Latino middle or high school student with a ‘High Incidence’ disability would be educated in a substantially separate setting (included in classrooms with their typically developing peers less than 40% of the day) were approximately 1.6 times the odds that a White or Asian middle or high school student with a ‘High Incidence’ disability would be similarly separated.
It is notable that student race was not a relevant predictor of whether an elementary school student would be educated in a substantially separate setting. This may be because, on average and regardless of race, elementary school students with disabilities are included with their typically developing peers at higher rates than students with disabilities in middle and high school. Meaning, only at the point when we begin to see substantial separation of students with disabilities in separate classrooms – which appears to occur around the transition to middle school – do we begin to observe differences in separation by student race.
Question 5: Summary
Low-income students with disabilities are educated in substantially separate settings at higher rates than students with disabilities who are not low-income. This finding was consistent across grade levels and in controlled statistical models.
African American and Latino students with disabilities are educated in substantially separate settings at higher rates than White and Asian students with disabilities in middle and high schools. This finding was consistent in controlled statistical models for middle and high schools, but not in elementary schools, where we did not find statistically significant differences between the rates of educational separation for African American/Latino and White/Asian students with disabilities.
27
Part 6: Detailed findings describing the relationship between the proportion of the school day a student spent in classrooms with their typically developing peers and scores on the MCAS for students with ‘High Incidence’ disabilities
Question 6: What student and district-level characteristics are related to the performance of students with disabilities on the MCAS?
This section of the report expands on findings we have discussed in the report thus far. In our presentation of findings related to MCAS performance, we looked first at district-level rates of proficiency. We then discussed raw scores (as opposed to designations of proficiency) for the MCAS at the student level in our analysis of district-level identification rates and student performance, where we found a small, but trivial, difference in scores between students with ‘High Incidence’ disabilities in very high-identifying districts and students with ‘High Incidence’ disabilities in very low-identifying districts. We concluded that the slight difference was likely the result of higher-functioning students being incorporated into the ‘High Incidence’ special education categories in high identifying districts.
We then examined patterns of inclusion for different students eligible for special education services and we found that low-income students and African American and Latino students were more likely to be educated outside of mainstream classrooms. In this final section of the report, we expand on all of these findings by focusing on the relationship between level of inclusion and MCAS scores for students with disabilities.
Finding 6 – Educational Setting and MCAS Performance: Students with ‘High Incidence’ disabilities who spend a larger proportion of their school day with their typically developing peers, on average, perform better on the MCAS than students with ‘High Incidence’ disabilities who spend a smaller proportion of their school day with their typically developing peers (this finding is consistent for students in Grades 4, 8 & 10 and for English Language Arts(ELA) and Mathematics portions of the MCAS).
We found a number of student and district-level variables that were associated with student performance on the MCAS. Many of these factors, such as student race, home language and low-income status, have been discussed by other researchers in depth and do not warrant repeating here. That said, we found that when controlling for these factors, the degree to which students with ‘High Incidence’ disabilities were educated with their typically developing peers was positively and significantly associated with their MCAS performance, Meaning, students with ‘High Incidence’ disabilities who spent more of their time in mainstream settings tend to score higher on the MCAS than students with ‘High Incidence’ disabilities who spent less of their time with typically developing peers. This finding is consistent across grade level and test domains.
28
Figure 9 (below) displays this relationship between predicted MCAS scores and time spent with typically developing peers for prototypical students with ‘High Incidence’ disabilities in grade 8. These predicted scores were generated by multi-level regression models in which we controlled for relevant student and district-level characteristics.1 In the figure, we display predicted MCAS raw scores for low-income students with ‘High Incidence’ disabilities and students with ‘High Incidence’ disabilities who do not qualify as low-income by the extent to which they are included with their typically developing peers: 80-100% of the day, 40-79% of the day and less than 40% of the day
Figure 9. Predicted scores derived from controlled multi-level regression models on the ELA portion of the grade 8 MCAS test for students with ‘High Incidence’ disabilities (low-income and non-low-income) who are included with their typically developing peers 80-100% of the day, 40-79% of the day and less than 40% of the day (n=68,622 students, nested in n=239 school districts).2
As you can see, although students with ‘High Incidence’ special education designations, on average, score in the Needs Improvement category regardless of
1These models control for student race (African American, Latino, Asian, American Indian and ‘Other’ race with White as the reference category), whether the child is in the ‘High Incidence’ or another special education category, whether the child is female, whether the child is eligible for a free or reduced-priced lunch, whether the child’s school district participates in the METCO program, District median family income (from 2000 census), the overall inclusivity of the district the percentage of LEP students in the district, the percentage of a district’s students who receive free or reduced priced lunches. It also includes interaction of child inclusivity and special education category (‘High Incidence’ v. other special education categories), the interaction of the child’s special education category and the percentage of students in the district who are identified as ‘High Incidence’. We tested a number of other main effects and interactions and found them to be non-significant. 2 See appendix B tables 2 & 3 for results from sample multi-level regression analyses in support of this finding.
29
instructional setting, students who are mostly included (80-100%) score approximately 4 raw points higher than those who are somewhat included (40-79%) and 7 raw points higher than students with ‘High Incidence’ designations who are substantially separated (less than 40%). These differences are substantial and represent approximately 2/5ths and 4/5ths of a standard deviation, respectively.
In the 10th grade data, approximately 13% of tested students with ‘High Incidence’ disabilities who were mostly included received a failing score on the language or mathematics MCAS exams. The corresponding percentage for students with ‘High Incidence’ disabilities who were somewhat included was 28% and among tested students with ‘High Incidence’ disabilities who were substantially separated , approximately 40% received a failing score on one or both of these exams. Given the implications of these scores for children’s eligibility to graduate from high school, we believe the instructional settings of students with ‘High Incidence’ disabilities warrant particular attention.
Although we suspect that educational separation leads to lower MCAS scores and by virtue of that, lower graduation rates for students in the ‘High Incidence’ category, it is possible that the students who are educated in substantially separate settings are also the students who face more severe challenges to their learning and the lower test scores are an artifact of these underlying ability differences. We cannot, with these data, determine with complete certainty, which – if either – of these mechanisms is at play in Massachusetts. However, the significant variability in district inclusion rates would support the hypothesis that more than disability characteristics are involved here. That is, the fact that some districts are able to include almost all of this population while others separate large numbers make it less likely that the overall population of students who are educated in substantially separate settings is due solely to severity of student need. Furthermore, it seems reasonable that the likelihood that a student will be integrated in general education classes might be malleable and influenced by district policies. The variability between districts regarding inclusion rates argues that there is room to influence inclusion rates via district-level policies. Therefore, we can recommend that the relationship between proportion of the school day spent with typically developing peers and MCAS scores be explored more thoroughly by the DESE through methods including school visits, interviews, focus groups and classroom observations. Such an investigation might prove fruitful in uncovering the dynamics that may be contributing to the patterns we observe in the data.
Question 6: Summary
Students with disabilities who spend more time being educated with their typically developing peers, on average, earn higher scores on the Massachusetts Comprehensive Assessment System tests.
30
Recommendations
As we considered the implications of this study for the Department of Elementary and Secondary Education, we felt a balance needed to be struck between maintaining and enhancing the success that many students with disabilities are experiencing in the commonwealth with the need to assertively address the shortcomings identified in the report. Of particular concern are the problems identified in this report concerning low-income students around identification and separation outside of the mainstream classroom. With this in mind we are not recommending a sweeping policy response to this report. Such a response could ultimately prove counterproductive for districts that are serving students with disabilities well. Further, we believe the department currently has sufficient authority to address the problems identified in the report.
These recommendations fall into two broad categories of state activity. One involves intervention in districts that may be engaged in the overrepresentation of low-income students and/or the inordinate use of substantially separate educational settings. Though we do not recommend substantial policy changes, we do recommend strong assertive action by the state within certain school districts. Given the impact that district-level policies and practices may have on students of color and students with disabilities in general, serious concerns arise from the findings of this report.
It is important to note that the current initiatives being promoted by the Governor, the Secretary of Education and the Commissioner concerning the achievement gap between low-income children and that of their more advantaged peers are consistent with the recommendations in this report. The findings in this report concerning how low-income students are served in special education speak to the need for broader changes within the general education system.
The second set of recommendations involves the role of the state in promoting good practices that have been shown to benefit students with disabilities. Although we should be pleased that Massachusetts does relatively well compared to other states, this study documents a persistent large gap between the performance of students with disabilities and their non-disabled peers. The Department of Elementary and Secondary Education should play a major role in promoting positive educational practices. It is not enough to simply integrate students into general education classrooms; we need to make sure that children and teachers have the supports they need to meet challenging standards.

31
Targeted State Intervention
1. The Department of Elementary and Secondary Education should intervene in districts that evidence highly disproportionate levels of enrollment of low-income students in special education.
Though some level of over-placement of low-income students in special education may be appropriate (Hehir & Gamm, 1999; Donovan & Cross, 2002), the numbers of low-income students being served in ‘High Incidence’ categories exceed what most experts would consider appropriate. Further the generally higher level of segregation among low-income students and students of color suggest that some of these placements may be inappropriate. In addition, the generally weaker MCAS performance for students with disabilities who are educated in substantially separate settings raises serious concerns regarding whether, for these students, being identified as eligible for special education services is beneficial. The student-level data used in this study were all supplied by the state and thus can be used to target school districts that are most in need of intervention.
2. The Department of Elementary and Secondary Education should monitor and intervene in districts in which there is inordinate use of substantially separate settings for students with disabilities.
Though this report identified problems concerning the use of substantially separate settings to educate low-income students, African American students and Latino students, many school districts also continue to separate large numbers of students across income and racial groups. This is particularly true at the middle and high school level. Although ensuring access to the curriculum should be the over-riding concern when making placement decisions about an individual student with a disability, integration consistently predicts higher performance on the MCAS. Given that there is such variability between districts in the state concerning integration, the Department of Elementary and Secondary Education should intervene in districts that continue to educate higher than average numbers of students in substantially separate settings.
3. Interventions in districts should focus on requiring better practices in general education.
Research on over-identification of low-income students and students of color as eligible for special education services situates this problem primarily in general education practices. Most of students are designated as eligible for special education due to problems in academics, particularly reading and/or due to problems concerning behavior. Powerful practices have been developed by researchers and implemented in many schools across the United States that have proven effective in dealing with these issues (these are discussed below). The Massachusetts students who are of most concern in this regard are all students who are eligible for services under Title 1 of the Elementary and Secondary Education Act and IDEA. The

32
Commissioner should consider directing the use of these funds toward this purpose as current authority allows.
Promotion of More Effective Practice
Though we recommend that the state intervene in districts whose patterns of identification, placement and performance are most problematic, the interventions needed in these districts may also be broadly beneficial to all districts. Therefore we recommend that the Department of Elementary and Secondary Education promote the adoption of three powerful research-based practices: 1
1. The Department of Elementary and Secondary Education should promote the adoption of principles of Universal Design for Learning.
Powerful instructional practices have developed that allow students with disabilities as well as other students with diverse instructional needs to prosper in general education environments. For instance, students who have print disabilities (Dyslexia, low-vision, tracking difficulties due to Cerebral Palsy, etc.) can access high-level text through text-to-voice technology. Students with physical disabilities can move a computer mouse with eye movement through a tablet computer and a free application. With these tools teachers can customize digital text to include comprehension prompts or to pre-teach vocabulary through another free download. These are but a few of the tools available that enable students to access more challenging curriculum while giving teachers more options to broaden their reach. Many of these approaches have been developed here in Massachusetts through such groups as the Center for Applied Special Technology in Wakefield, Boston Children’s Hospital, Boston College and Harvard University and are based on insights derived from neuroscience. These approaches have been adopted by a number of schools in the state including the Henderson in Dorchester and Boston Arts Academy.
2. The Department of Elementary and Secondary Education should promote adoption of a Response to Intervention (RTI) model in kindergarten through grade three to promote early literacy development
Response to intervention, when implemented with fidelity, has strong research support as a vehicle to improve early reading development for struggling readers and as improved means to identify students who may have a more intractable reading disability such as dyslexia. We believe that a more focused effort on early reading such as RTI might be helpful in promoting better literacy overall and reducing inappropriate referrals to special education. The Tucker School in Milton has implemented such a program and it served to reduce over-placement of students of color in special education while improving literacy scores throughout the school.1 We believe that the work of the department’s newly developed Massachusetts Tiered System of Supports (MTSS) is well aligned with these recommendations and provides much of the infrastructure necessary to promote their implementation.

33
3. The Department of Elementary and Secondary Education should promote universally designed behavior supports.As we recommend above, programs such as Positive Behavior Intervention Supports (Sugai et al., 2000) have been shown to improve student behavior in schools and reduce suspensions, while allowing schools to focus support on those students most in need. Allowing students to stay engaged in school is central to improving performance for many students who struggle. For example, Worcester East Middle School has successfully implemented this approach.
4. The Department of Elementary and Secondary Education should encourage school districts that identify large numbers of students with disabilities to examine their practices of special education determination.
Though this study found that in general, the numbers of students a district identifies for special education does not appear to be related to the overall MCAS performance of a district, the placement of large numbers of students in ‘High Incidence’ categories raises at minimum fiscal concerns. Special education is expensive and budgets are tight in most districts. Further, as the number of children with more significant disabilities such as those with low birth weight is increasing, school districts are faced with meeting the needs of students whose service programs are apt to be relatively expensive (Marcus, 2011). These children are clearly entitled to receive what they need under IDEA. The practice of stretching special education budgets to serve students who are questionably eligible needs to be seriously examined in districts serving large numbers of students in special education. Further, as our study indicates, the integration of students with disabilities in the general education classroom is associated with significantly higher performance on the MCAS.
Conclusion
Massachusetts has a long and proud history as a leader in the education of students with disabilities. These efforts have borne clear results, as more and more children are experiencing unprecedented success in school. Though we have made great progress, more needs to be done to make the promise of effective education a reality for all students. We hope this report will help policy makers, educators and parents focus their efforts toward a brighter future for all children.
34
References
Bhasin, T., Brocksen, S., Avchen, R., & Braun, K. (2006). Prevalence of four developmental disabilities among children aged 8 years — Metropolitan Atlanta Developmental Disabilities Surveillance Program, 1996 and 2000. Morbidity and Mortality Weekly Report Surveillance Summaries, 55(SS-1) p. 1-9. Retrieved from http://www.cdc.gov/mmwr/PDF/ss/ss5501.pdf
Donovan, M., & Cross, C. (Eds.). (2002). Minority students in special and gifted education. Washington DC: National Academies Press.
Hehir, T, & Mosqueda, E.(2007). San Diego Unified School District issues document, Retrieved from http://old.sandi.net/depts/specialed/hehir_issues.pdf
Hehir, T., & Gamm, S. (1999). Special education: From legalism to collaboration. In J. P. Heubert (Ed.), Law and school reform: Six strategies for promoting educationalequity. New Haven: Yale University Press. pp 205-243.
Hehir, T. (2005). New directions in special education: Eliminating ableism in policy and practice. Cambridge, MA: Harvard Education Press.
Hehir, T., Eidelman, H., Grindal, T., & Marcell, E. (2010). Review of special education in the Houston Independent School District. Retrieved from http://www.houstonisd.org/HISDConnectEnglish/Images/PDF/HISD__Special_Education_Report_2011_Final.pdf
Marcus, J. (2005, October 9). The test ahead. Boston Globe Magazine. Retrieved online http://www.bostonglobe.com/magazine/2011/10/08/the-test-ahead/89zgadwU7F5ckhFxu7JOdN/story.html
Pizur-Barnekow, K., Erickson, S., Johnston, M., Bass, T., Lucinski, L., & Bleuel, D. (2010) Early identification of developmental delays through surveillance, screening and diagnostic evaluation. Infants & Young Children, 23(4), 323-330.
Rice, C. (2009) Prevalence of autism spectrum disorders --- Autism and developmental disabilities monitoring network, United States. Morbidity and Mortality Weekly Report Surveillance Summaries, 58(SS-10), 1-20. Retrieved from http://www.cdc.gov/mmwr/preview/mmwrhtml/ss5810a1.htm
Sheldrick, C., Merchant, S., & Perrin, E. (2011). Identification of developmental-behavioral problems in primary care: A systematic review. Pediatrics, 128(2), 356 -363.
35
Sugai, G., Horner, R., Dunlap, G., Hieneman, M., Lewis, T., Nelson, C., Scott, T., Liaupsin, C., Salir, W., Turnbull, A., Wickham, D., Wilcox, .B., & Ruef, M. (2000). Applying positive behavior support and functional behavioral assessment in schools. Journal of Positive Behavior Interventions, 2(3), 131-143.
Wagner , M., Newman, L., Cameto, R., Levine, P., & Marder, C. (2003). Going to school: Instruction contexts, programs and participation of secondary school students with disabilities. Retrieved from www.sri.com/nlts2/
36
Appendix A: Additional Methodological Information
Throughout this report we refer to findings from a variety of statistical techniques. In this appendix, we first detail the types of analysis we used to answer each research question and then provide examples of the actual models we fitted that were used to form the findings reported in the body of this report.
Further inquiries about the methods and models can be directed to Todd Grindal [email protected]
Question 1 To compare rates of identification, placement and performance of students with disabilities in Massachusetts to those of students across the country, we reported simple descriptive statistics from a variety of data sources. We examined the distributions of variables of interest, paying attention to measures of central tendency and variability (mean, median, mode, standard deviation, etc.). We used the 2010 Massachusetts SIMS and MCAS data files and compared rates to those from publicly available information from the National Center for Education Statistics (http://nces.ed.gov/), the Data Accountability Center (https://www.ideadata.org/IDEAData.asp) and Centers for Disease Control and prevention (http://www.cdc.gov/).
Questions 2 & 3 We used Ordinary Least Squares (OLS) regression models to address our questions about how district characteristics are associated with district rates of special education identification and MCAS pass rates. OLS regression methods permit us to estimate the relationship between variables of interest (e.g., predicting the performance of a district’s students with disabilities on the MCAS as a function of the performance of a district’s general education students on the MCAS) while taking into account the role of other variables (e.g., district wealth, urbanicity, or percentage of students with limited English proficiency) in explaining the variability that we observe in our outcome (e.g., special education students’ MCAS scores). In Appendix B, Tables 1 and 2, we provide examples of selected Ordinary Least Squares regression models that we fit as part of this analysis.
Questions 4 & 5 We used multi-level logistic regression models to estimate the probabilities that different students in Massachusetts would be (a) identified into Special Education categories or (b) placed in inclusive or substantially separate settings.
Logistic regressions estimate the probability that an event will occur (for example, a Latino student is identified as eligible for special education services), while taking
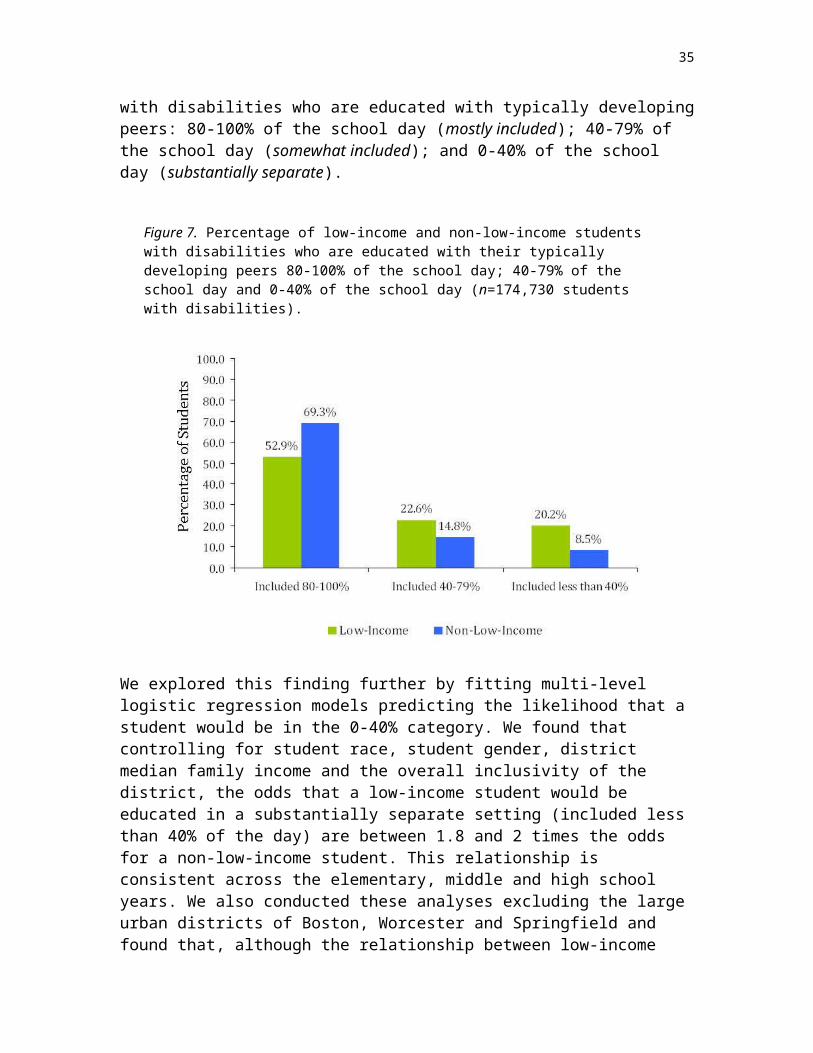
37
into account a variety of factors that might play into whether or not the event occurs (for example, the student’s socioeconomic status or the financial resources of the student’s school district, both of which are known to be related to rates of identification of special education eligibility).
By using multi-level logistic regression models, we were able to estimate the likelihood of students’ identification as eligible for services (the logistic regression does this), while also estimating and taking into account the role played by student- and district-level characteristics (the multi-level structure of the models does this) in the likelihood of identification.
This process allowed us to understand, on average, the likelihood of identification that was uniquely associated to specific student- or district-level characteristics (for example, the estimated likelihood, on average, that a low-income student in Massachusetts would be identified as eligible for special education services), taking into account the role that factors such as socioeconomic status, gender, or district proportion of students eligible for free/reduced price lunch, play in a student’s likelihood of receiving a given special education designation.
These logistic regression models yielded estimates called odds ratios, which we used to describe differential probability patterns of (a) over- and under-identification into Special Education and (b) disproportions of different types of students in Massachusetts who are educated in each of these settings. Essentially, odds ratios compare the odds of an event occurring to the odds that the event will not occur. Put more plainly, odds ratios compare the likelihood of occurrence between two different events (for example, the likelihood that a low-income student in Massachusetts will be identified as eligible for special education services compared to the likelihood that a non- low-income student in Massachusetts with similar characteristics such as socioeconomic status, gender, district proportion of students eligible for free/reduced price lunch, etc., will be identified as eligible for special education services.
A practical guide to interpreting odds ratios is as follows: a) if the value of an odds ratio is less than 1, then the event (for example, a low-income student being identified as eligible for special education) is less likely than its comparison event (for example, a non-low-income student being identified as eligible for special education); b) if the value of an odds ratio is equal to 1, then the event of interest is just as likely to occur as its comparison event; c) if the value of an odds ratio is greater than 1, then the event is more likely than its comparison event.
In comparing between members in a group of odds ratios, lower values represent lower likelihoods and higher values represent higher likelihoods; so an odds ratio of 5.4 represents a higher probability of identification than an odds ratio of 2.2 and an odds ratio of 0.3 represents a lower probability of identification than an odds ratio of 0.7.
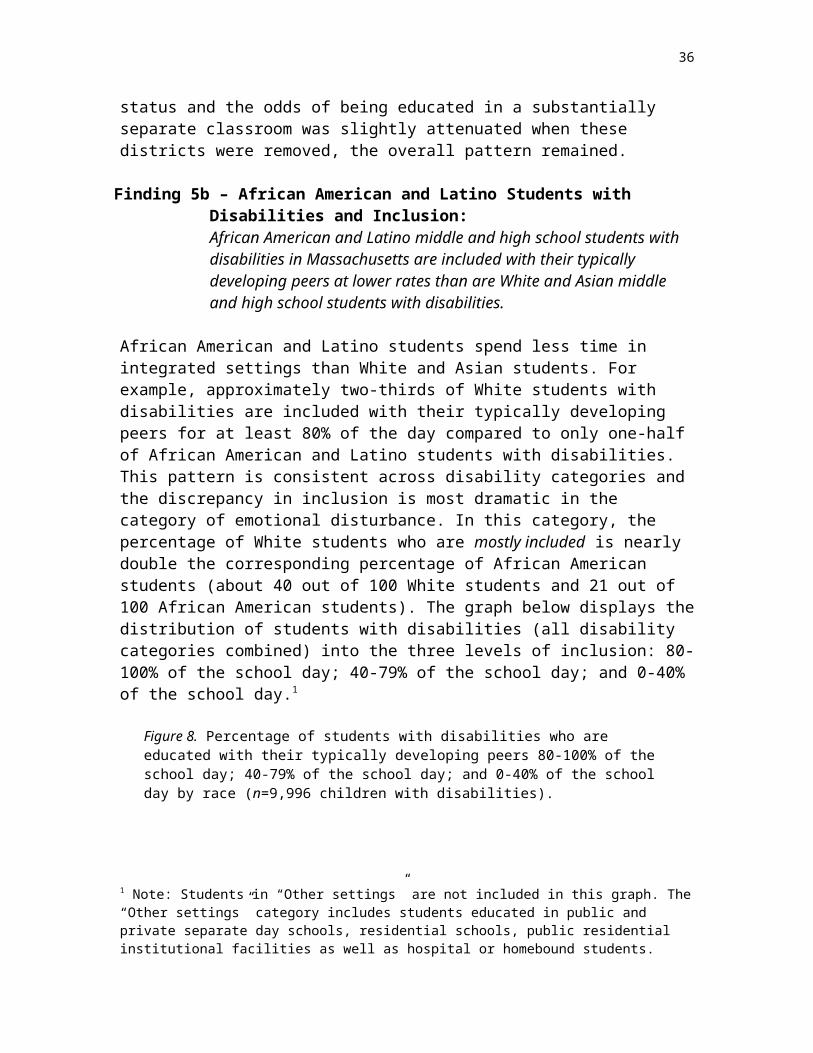
38
In Appendix B, Table 3, we provide an example of one set of the multi-level logistic regression models we examined as part of this analysis.
Question 6 We used multi-level Ordinary Least Squares regression models to model the relationships between student and district characteristics on student scores on the English and Mathematics MCAS tests. The use of multi-level models allowed us to account for similarities in the performance of students with disabilities that might be related to their enrollment in schools within the same district, thereby providing a clearer picture of the variability in achievement that was uniquely related to a student’s proportion of time in mainstream settings.
In these models, we used dichotomous variables to represent 40-79% of a student’s day in school in mainstream settings and 0-39% of a student’s day in school in mainstream settings, with 80-100% mainstream as the reference category. This allowed us to estimate the difference in special education student performance on the MCAS associated with each setting category in comparison with the mostly mainstreamed (80-100%) setting category.
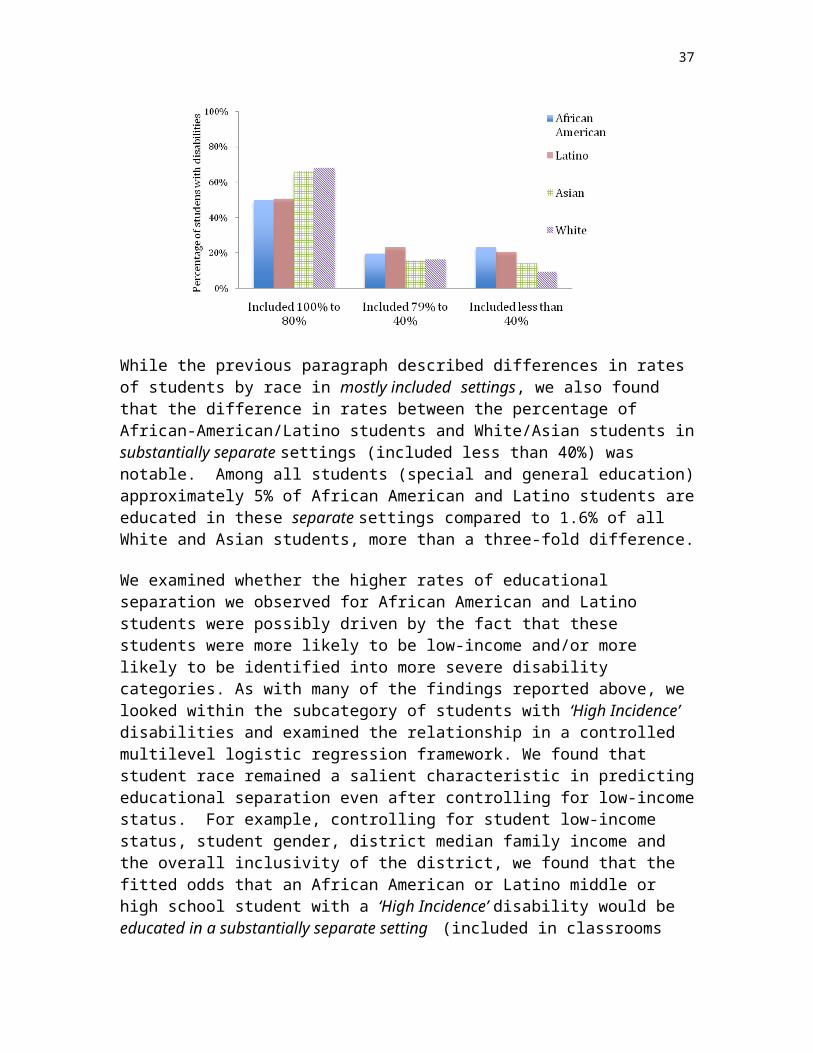
39
Appendix B: Selected Regression Models
Table 1. Taxonomy of selected fitted school-level Ordinary Least Squares regression models predicting district identification rates of students with ‘High Incidence’ disabilities in Massachusetts public school districts, n=298 traditional school districts (model excludes charter schools, vocational/tech schools, or schools serving special education students exclusively).
Model 1.1 Model 1.2 Model 1.3 Model 1.4 Model 1.5
Intercept11.194**(0.156)
8.456**(1.234)
7.309**(1.948)
8.554**(2.924)
9.275**(0.454)
District Percent White Students
0.010(0.011)
0.022(0.018)
0.021(0.019)
District Percent Students eligible for Free/Reduced Price Lunch (log2)
1.155**(0.297)
1.123**(0.282)
1.096**(0.292)
1.095**(0.261)
District Participates in METCO Program
0.055(0.542)
District Percent Students with Limited English Proficiency (square root)
0.210(0.275)
0.384(0.301)
District Enrollment (log2)-0.255(0.372)
District is ‘Rural1’ 0.570
(0.424)0.609
(0.355)
District is ‘Town’ -0.311(0.661)
-0.139(0.600)
District is ‘City’ -0.075(0.837)
-0.232(0.777)
District Percent Elementary Schools
-0.005(0.008)
R2 0.000 0.057 0.059 0.072 0.065N 298 298 298 298 298dfERROR 297 294 294 289 293
* p<0.05; ** p<0.01
1 In these models we included dichotomous variables representing whether the district was classified by the National Center of Education Statistics (NCES) as rural, city, or town, with suburban districts as the reference category (see http://nces.ed.gov/ccd/rural_locales.asp for more information on NCES classification of district urbanicity).
40
Table 2. Taxonomy of selected fitted school-level Ordinary Least Squares regression models predicting the percentage of a school district’s students with ‘High Incidence’ disability designations who score Proficient or Advanced on the Math MCAS, n=297 traditional school districts (model excludes charter schools, vocational/tech schools, or schools serving special education students exclusively; models also exclude one small rural school district that represents an outlier on a number of critical characteristics).
Model 2.1 Model 2.2 Model 2.3 Model 2.4 Model 2.5 Model 2.6
Intercept-24.845**
(2.781)-30.452**
(3.710)-25.870**
(4.094)-8.490
(10.031)-9.583(6.521)
-12.783(7.081)
District Percent General Education Students scoring Proficient or Advanced
0.740**(0.040)
0.749**(0.040)
0.782**(0.066)
0.765**(0.065)
0.810**(0.044)
0.814**(0.044)
District Percent Students with ‘High Incidence Disabilities
0.449*(0.198)
0.452*(0.202)
0.419*(0.199)
0.406*(0.194)
0.365(0.193)
District Percent White Students
-0.094*(0.036)
-0.183**(0.065)
-0.150**(0.039)
-0.151**(0.040)
District Median Family Income
0.014(0.038)
0.038(0.039)
District Percent Students with Limited English Proficiency (square root)
-0.667(1.021)
District Enrollment (log2)-2.097(1.294)
-2.535**(0.805)
-1.996*(0.954)
District is ‘Rural’ 3.110*
(1.445)3.204*
(1.416)
District is ‘Town’ -0.192(2.253)
-0.618(2.182)
District is ‘City’ 3.375
(2.834)3.038
(2.788)
District Percent Elementary Schools
-0.005(0.026)
R2 0.534 0.542 0.552 0.580 0.568 0.579N 297 297 296 296 297 297dfERROR 295 294 291 285 292 289* p<0.05; ** p<0.01

41Table 3. Taxonomy of selected fitted multilevel logistic regression models estimating the odds that elementary school children, nested in traditional school districts, will receive a Specific Learning Disability designation, n=468,158 children nested in 299 school districts (random effects at the district level)1.
Model 3.1 Model 3.2 Model 3.3 Model 3.4 Model 3.5
Intercept -3.22*** -3.22*** -2.68*** -2.66*** -3.05***
Child is Hispanic 0.08** 0.08** 0.09~ 0.08
Child is Black 0.13*** 0.14*** 0.20*** 0.12***
Child is Asian -1.27*** -1.28*** -1.32*** -1.29***
Child is ‘Other’ 0.14*** -0.14*** 0.05 -0.12**
Child is American Indian 0.14 0.15** -0.10 0.17
Child has Limited English Proficiency
-0.15*** -0.16*** -0.15*** -0.15***
Child is Female -0.39*** -0.38*** -0.38*** -0.38***
Child eligible for Free/ Reduced Price Lunch (FRPL)
0.68*** 0.69*** 1.16*** 1.10***
District Percent White Students -0.00 -0.004***
District Percent Students eligible for FRPL (log2)
-0.08 -0.07* -0.04~
District is ‘Rural’ 0.12~
District is ‘Town’ 0.15
District is ‘City’ 0.17
District Participates in METCO Program
0.08 0.09
Interaction: Child Eligible for FRPL x District % FRPL (log2)
-0.10*** -0.09***
Interaction: Child is Hispanic x District % White Students
0.001
Interaction: Child is Black x District % White Students
-0.001
Interaction: Child is Asian x District % White Students
0.001
Interaction: Child is ‘Other’ x District % White Students
-0.003*
Interaction: Child is Hispanic x District Participates in METCO
0.12
Interaction: Child is Black x District Participates in METCO
0.26**
Interaction: Child is Asian x District Participates in METCO
0.07
Interaction: Child is ‘Other’ x District Participates in METCO
-0.23
Goodness of fit (-2LL) 85371.7 83742.9 82374.7 82350.2 82349.2* p<0.05; ** p<0.01; *** p<0.001
1 Standard errors are not displayed in this table because of space constraints. Additional information is available by request.

42Table 4a. Child-level coefficients and level of statistical significance in a taxonomy of selected fitted multilevel regression models predicting performance on the MCAS English Language Arts assessment for 8th grade students, nested in traditional school districts1, n=68,622 8th grade students nested in 239 school districts (random effects at the district level). 2
Model 4.1 Model 4.2 Model 4.3 Model 4.4 Model 4.5
Intercept 1.95** 1.87** 1.87** 1.86** 1.86**
Child-Level Main Effects
Child has ‘High Incidence’ Disability Designation
-9.67** -9.98** -10.23** -11.25** -11.21**
Child has another Disability Designation
-10.84** -9.60** -9.95** -9.16** -9.16**
Child is Female 1.78** 1.79** 1.91** 1.91**
Child eligible for Free/ Reduced Price Lunch (FRPL)
-2.86** -2.91** -3.07** -3.07**
Child has Limited English Proficiency
-10.87** -10.96** -11.33** -11.32**
Child is Black -1.82** -1.82** -1.68** -1.69**
Child is Hispanic -1.77** -1.75** -1.74** -1.74**
Child is Asian 1.64** 1.68** 1.74** 1.74**
Child is American Indian -1.80** -1.85** -1.67** -1.67**
Child is ‘Other’ 0.39* 0.42** 0.50** 0.49**
Child is in METCO Program -0.69 -0.74 -0.96* -0.94*
Child is Included in Mainstream Classes 40-79% of School Day
-7.26** -7.29**
Child is Included in Mainstream Classes 0-40% of School Day
-8.18** -8.20**
Child-Level Interactions
Child ‘High Incidence’ Designation x Included 40-79% of Day
2.06** 2.06**
Child ‘High Incidence’ Designation x Included 0-40% of Day
0.46 0.45
Child is Hispanic x has Limited English Proficiency
0.94** 0.94**
Child ‘High Incidence’ Designation x eligible for FRPL
1.44** 1.44**
Child another Disability Designation x eligible for FRPL
0.73* 0.73*
Child ‘High Incidence’ Designation x Child is Female
-0.76** -0.76**
Child another Disability Designation x Child is Female
-1.23** -1.23**
* p<0.05; ** p<0.01; *** p<0.001
1 Excludes students attending charter schools, vocational schools, or out-of-district placements.2 Standard errors are not displayed in this table because of space constraints. Additional information is available by request.
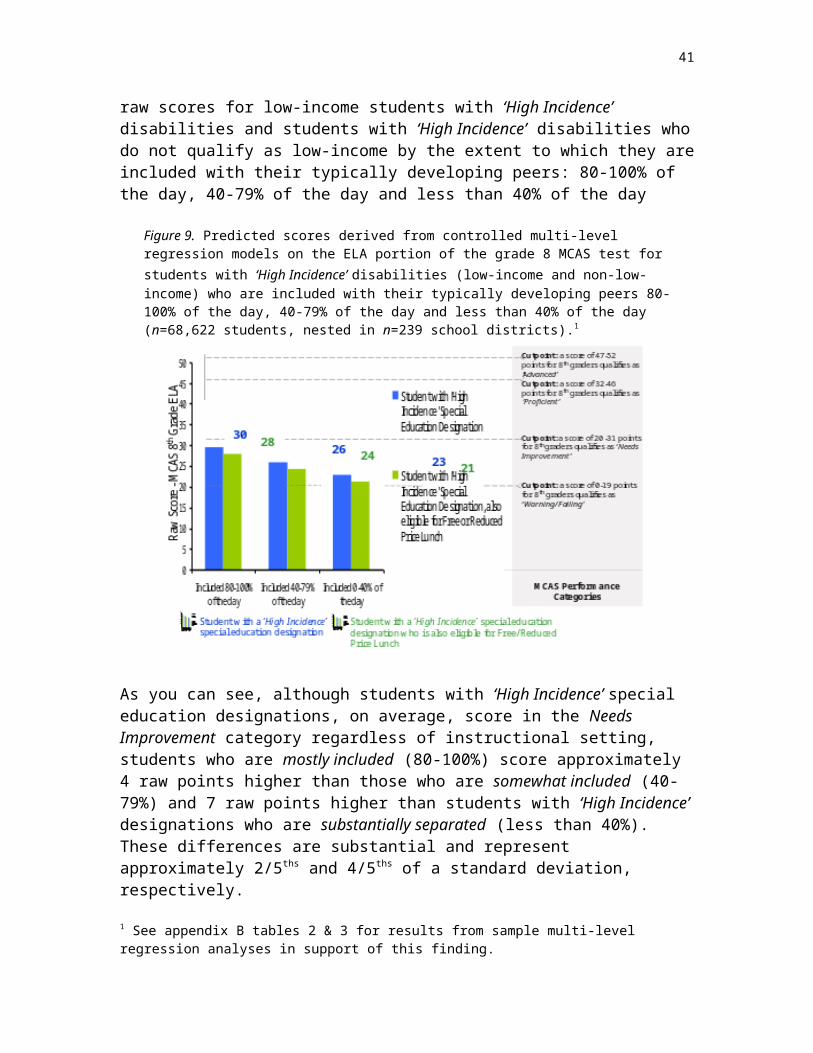
43Table 4b. District-level and cross-level interaction coefficients and level of statistical significance in a taxonomy of selected fitted multilevel regression models predicting performance on the MCAS English Language Arts assessment for 8th grade students, nested in traditional school districts1, n=68,622 8th grade students nested in 239 school districts (random effects at the district level). 2
Model 4.1 Model 4.2 Model 4.3 Model 4.4 Model 4.5
District-Level Main Effects
District Percent Students with ‘High Incidence’ Disability Designation
0.07 -0.49 -0.42 0.08** 0.55
District % Students with ‘High Incidence’ Designation (Squared)
-0.03
District % Students with ‘High Incidence’ Designation (Cubed)
0.00*
District Level of Inclusion 0.11** 0.00 -0.07 -0.00 -0.01
District Median Family Income (MFI), in units of $10,000
0.45** 0.47** 1.83**
District MFI, in units of $10,000 (Squared)
-0.07**
District Student-Teacher Ratio -0.09
District Participates in METCO Program
0.59
District Percent Students with Limited English Proficiency
0.18** 0.19** 0.14**
District Percent Students eligible for FRPL (log2)
-0.08** -0.07** -0.03
District is ‘City’ 0.70
District is ‘Town’ 0.16
District is ‘Rural’ -0.34
District-Level Interactions
District % Students with ‘High Incidence’ Designation x District Level of Inclusion
0.01 0.01
Cross-Level Interactions
Child ‘High Incidence’ Designation x District % ‘High Incidence’
0.08** 0.09** 0.12** 0.12**
Child another Disability Designation x District % ‘High Incidence’
-0.02 0.00 0.07 0.07
Child Included 40-79% of Day x District % ‘High Incidence’
0.12** 0.12**
Child Included 0-40% of Day x District % ‘High Incidence’
0.08 0.08
Child ‘High Incidence’ Designation x Dist. MFI, in $10K units
0.25** 0.25**
Child another Disability Designation x Dist. MFI, in $10K units
0.22** 0.22**
1 Excludes students attending charter schools, vocational schools, or out of district placements.2 Standard errors are not displayed in this table because of space constraints. Additional information is available by request.
44Table 4c. Variance components and goodness-of-fit estimates in a taxonomy of selected fitted multilevel regression models predicting performance on the MCAS English Language Arts assessment for 8th grade students, nested in traditional school districts1, n=68,622 8th grade students nested in 239 school districts (random effects at the district level) 2.
Model 4.1 Model 4.2 Model 4.3 Model 4.4 Model 4.5
Variance Components
σ̂ ε2 8.63** 5.73** 2.25** 2.37** 2.14**
σ̂ u2 49.35** 42.13** 42.24** 41.20** 41.20**
ICC 0.15 0.12 0.05 0.05 0.05
Goodness of Fit:
Pseudo R2μ 0.11 0.41 0.77 0.76 0.78
Pseudo R2ε 0.22 0.34 0.33 0.35 0.35
n (students) 71,176 71,166 68,622 68,622 68,622
* p<0.05; ** p<0.01; *** p<0.001
1 Excludes students attending charter schools, vocational schools, or out of district placements.2 Standard errors are not displayed in this table because of space constraints. Additional information is available by request.
45Table 5a. Child-level coefficients and level of statistical significance in a taxonomy of selected fitted multilevel regression models predicting performance on the MCAS mathematics assessment for 8th grade students, nested in traditional school districts1, n=68,775 8th grade students nested in 239 school districts (random effects at the district level) 2.
Model 5.1 Model 5.2 Model 5.3 Model 5.4 Model 5.5
Intercept 2.30** 2.24** 2.24** 2.23** 2.23**
Child-Level Main Effects
Child has ‘High Incidence’ Disability Designation
-12.85** -13.79** -14.21** -13.05** -12.96**
Child has another Disability Designation
-13.56** -14.77** -14.96** -11.51** -11.52**
Child is Female -0.77** -0.75** -0.54** -0.54**
Child eligible for Free/ Reduced Price Lunch (FRPL)
-4.28** -4.32** -4.91** -4.91**
Child has Limited English Proficiency -8.98** -9.02** -8.80** -8.80**
Child is Black -4.79** -4.79** -4.66** -4.68**
Child is Hispanic -3.62** -3.64** -3.56** -3.56**
Child is Asian 4.31** 4.39** 4.43** 4.42**
Child is American Indian -3.24** -3.39** -3.21** -3.22**
Child is ‘Other’ -0.00 0.04 0.06 0.05
Child is in METCO Program -1.84** -1.92** -1.94** -1.91**
Child is Included in Mainstream Classes 40-79% of School Day
-8.96** -9.03**
Child is Included in Mainstream Classes 0-40% of School Day
-8.52** -8.57**
Child-Level Interactions
Child ‘High Incidence’ Designation x Included 40-79% of Day
2.49** 2.49**
Child ‘High Incidence’ Designation x Included 0-40% of Day
1.17 1.17
Child is Hispanic x has Limited English Proficiency
-0.13 -0.14
Child ‘High Incidence’ Designation x eligible for FRPL
3.57** 3.58**
Child another Disability Designation x eligible for FRPL
2.75** 2.75**
Child ‘High Incidence’ Designation x Child is Female
-1.56** -1.56**
Child another Disability Designation x Child is Female
-1.10** -1.10**
* p<0.05; ** p<0.01
1 Excludes students attending charter schools, vocational schools, or out of district placements.2 Standard errors are not displayed in this table because of space constraints. Additional information is available by request.

46Table 5b. District-level and cross-level interaction coefficients and level of statistical significance in a taxonomy of selected fitted multilevel regression models predicting performance on the MCAS mathematics assessment for 8th
grade students, nested in traditional school districts1, n=68,775 8th grade students nested in 239 school districts (random effects at the district level) 2.
Model 5.1 Model 5.2 Model 5.3 Model 5.4 Model 5.5
District-Level Main Effects
District Percent Students with ‘High Incidence’ Disability Designation
0.02 -0.20 -0.35 0.08* 0.53
District % Students with ‘High Incidence’ Designation (Squared)
-0.04
District % Students with ‘High Incidence’ Designation (Cubed)
0.00*
District Level of Inclusion 0.17** 0.10 -0.06 -0.00 -0.02
District Median Family Income (MFI), in units of $10,000
0.75** 0.75** 2.59**
District MFI, in units of $10,000 (Squared)
-0.09**
District Student-Teacher Ratio -0.11
District Participates in METCO Program
1.21* 1.32** 1.02*
District Percent Students with Limited English Proficiency
0.17** 0.18** 0.12**
District Percent Students eligible for FRPL (log2)
-0.09** -0.09** -0.02
District is ‘City’ 0.83
District is ‘Town’ -0.05
District is ‘Rural’ -0.14
District-Level Interactions
District % Students with ‘High Incidence’ Designation x District Level of Inclusion
0.00 0.01
Cross-Level Interactions
Child ‘High Incidence’ Designation x District % ‘High Incidence’
0.12** 0.15** 0.12** 0.12**
Child another Disability Designation x District % ‘High Incidence’
0.16** 0.17** 0.15* 0.15*
Child Included 40-79% of Day x District % ‘High Incidence’
0.16** 0.16**
Child Included 0-40% of Day x District % ‘High Incidence’
0.08 0.09
Child ‘High Incidence’ Designation x Dist. MFI, in $10K units
-0.02
Child another Disability Designation x Dist. MFI, in $10K units
-0.10
* p<0.05; ** p<0.01
1 Excludes students attending charter schools, vocational schools, or out of district placements.2 Standard errors are not displayed in this table because of space constraints. Additional information is available by request.

47Table 5c. Variance components and goodness-of-fit estimates in a taxonomy of selected fitted multilevel regression models predicting performance on the MCAS mathematics assessment for 8th grade students, nested in traditional school districts1, n=68,775 8th grade students nested in 239 school districts (random effects at the district level) 2.
Model 5.1 Model 5.2 Model 5.3 Model 5.4 Model 5.5
Variance Components
σ̂ ε2 18.86** 13.48** 4.08** 4.33** 3.67**
σ̂ u2 98.85** 88.23** 88.24** 86.87** 86.87**
ICC .11 .13 .04 .05 .04
Goodness of Fit:
Pseudo R2μ 0.15 0.39 0.82 0.80 0.83
Pseudo R2ε 0.19 0.28 0.28 0.29 0.29
n (students) 71,327 71,319 68,775 68,775 68,775
* p<0.05; ** p<0.01
1 Excludes students attending charter schools, vocational schools, or out of district placements.2 Standard errors are not displayed in this table because of space constraints. Additional information is available by request.